Rapid-scan electron paramagnetic resonance using an EPR-on-a-Chip sensor
←
→
Page content transcription
If your browser does not render page correctly, please read the page content below
Magn. Reson., 2, 673–687, 2021                                                                           Open Access
https://doi.org/10.5194/mr-2-673-2021
© Author(s) 2021. This work is distributed under
the Creative Commons Attribution 4.0 License.

         Rapid-scan electron paramagnetic resonance using an
                        EPR-on-a-Chip sensor
             Silvio Künstner1 , Anh Chu2 , Klaus-Peter Dinse1,3 , Alexander Schnegg4 , Joseph E. McPeak1 ,
                                Boris Naydenov1 , Jens Anders2,5, , and Klaus Lips1,3,
          1 Berlin Joint EPR Laboratory and EPR4Energy, Department Spins in Energy Conversion and Quantum
               Information Science (ASPIN), Helmholtz-Zentrum Berlin für Materialien und Energie GmbH,
                                          Hahn-Meitner-Platz 1, 14109 Berlin, Germany
              2 Institute of Smart Sensors, Universität Stuttgart, Pfaffenwaldring 47, 70569 Stuttgart, Germany
                          3 Berlin Joint EPR Laboratory, Fachbereich Physik, Freie Universität Berlin,

                                              Arnimallee 14, 14195 Berlin, Germany
                             4 EPR4Energy, Max-Planck-Institut für chemische Energiekonversion,

                                    Stiftstraße 34–36, 45470 Mülheim an der Ruhr, Germany
               5 Center for Integrated Quantum Science and Technology (IQST), Stuttgart and Ulm, Germany
                                          These authors contributed equally to this work.

                       Correspondence: Boris Naydenov (boris.naydenov@helmholtz-berlin.de)

                                    Received: 26 April 2021 – Discussion started: 3 May 2021
                        Revised: 11 August 2021 – Accepted: 17 August 2021 – Published: 25 August 2021

      Abstract. Electron paramagnetic resonance (EPR) spectroscopy is the method of choice to investigate and
      quantify paramagnetic species in many scientific fields, including materials science and the life sciences. Com-
      mon EPR spectrometers use electromagnets and microwave (MW) resonators, limiting their application to
      dedicated lab environments. Here, novel aspects of voltage-controlled oscillator (VCO)-based EPR-on-a-Chip
      (EPRoC) detectors are discussed, which have recently gained interest in the EPR community. More specifically,
      it is demonstrated that with a VCO-based EPRoC detector, the amplitude-sensitive mode of detection can be
      used to perform very fast rapid-scan EPR experiments with a comparatively simple experimental setup to im-
      prove sensitivity compared to the continuous-wave regime. In place of a MW resonator, VCO-based EPRoC
      detectors use an array of injection-locked VCOs, each incorporating a miniaturized planar coil as a combined
      microwave source and detector. A striking advantage of the VCO-based approach is the possibility of replacing
      the conventionally used magnetic field sweeps with frequency sweeps with very high agility and near-constant
      sensitivity. Here, proof-of-concept rapid-scan EPR (RS-EPRoC) experiments are performed by sweeping the
      frequency of the EPRoC VCO array with up to 400 THz s−1 , corresponding to a field sweep rate of 14 kT s−1 .
      The resulting time-domain RS-EPRoC signals of a micrometer-scale BDPA sample can be transformed into the
      corresponding absorption EPR signals with high precision. Considering currently available technology, the fre-
      quency sweep range may be extended to 320 MHz, indicating that RS-EPRoC shows great promise for future
      sensitivity enhancements in the rapid-scan regime.

Published by Copernicus Publications on behalf of the Groupement AMPERE.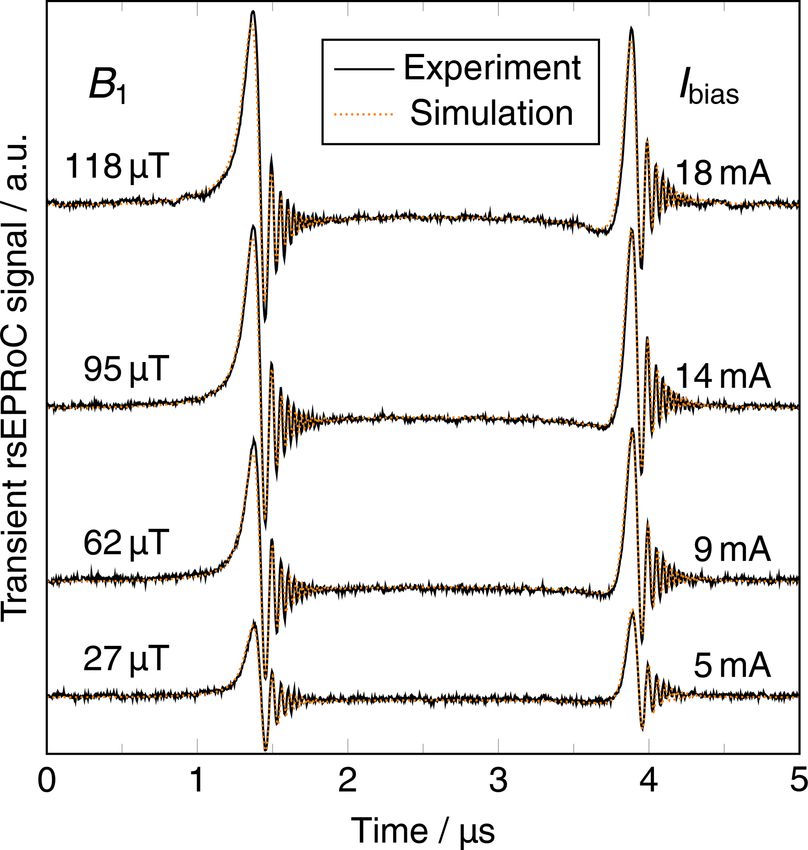
674                     S. Künstner et al.: Rapid-scan electron paramagnetic resonance using an EPR-on-a-Chip sensor

1   Introduction                                                 try (Wolfson et al., 2015), an EPR “dipstick” spectrometer
                                                                 that can be immersed in an aqueous solution (Zgadzai et
Electron paramagnetic resonance (EPR) spectroscopy is a          al., 2018), and the EPR Mobile Universal Surface Explorer
widespread analytical tool for studying species with un-         (EPR-MOUSE) as a field-swept, surface-sensitive EPR spec-
paired electrons relevant in chemistry, physics, biology, and    trometer (Switala et al., 2017). In all of these designs, how-
medicine. The main uses of EPR are the quantification of         ever, a conventional microwave bridge is used for MW gen-
paramagnetic centers (Eaton et al., 2010) in, e.g., chemical     eration and detection, limiting their applicability to dedicated
analyses or quality control, the identification and character-   laboratories. Moreover, the sensitivity as a function of oper-
ization of radicals (Villamena, 2017), paramagnetic defects      ating frequency is still dictated by the characteristics of the
(Brodsky and Title, 1969), and transition metal ion states       utilized resonator.
(Van Doorslaer and Vinck, 2007) in biological samples, in           Significant progress in semiconductor fabrication technol-
semiconductors, and during chemical reactions for assign-        ogy has propelled the design of new EPR spectrometers
ment of the electronic and atomic structure of paramagnetic      that are fully integrated into a single silicon microchip, so-
states (Neese, 2017).                                            called EPR-on-a-Chip (EPRoC) devices (Yalçin and Boero,
   In conventional continuous-wave (CW) EPR spectrome-           2008; Anders et al., 2012; Yang and Babakhani, 2015;
ters, a microwave (MW) cavity resonator with a high-quality      Handwerker et al., 2016; Zhang and Niknejad, 2021). These
factor (Q) is used to enhance the signal-to-noise ratio (SNR)    EPRoC devices either integrate a conventional microwave
and the resolution. The resonator couples the magnetic field     bridge or variants of it in a single integrated circuit (Yang
component of the MW (∼ 9.4 GHz in X-band spectrometers)          and Babakhani, 2015; Zhang and Niknejad, 2021) and use
to the magnetic moments of the unpaired electron spins of        a fixed-frequency oscillator (Yalçin and Boero, 2008; An-
the sample. The response of the magnetic susceptibility of       ders et al., 2012) or a voltage-controlled oscillator (VCO)
the sample is detected via the reflected MW using an MW          (Handwerker et al., 2016) to detect the EPR signal. In the
bridge. To achieve the resonance condition, an external mag-     latter approach, a miniaturized coil with a diameter of a few
netic field B0 is swept linearly and continuously, while the     hundred micrometers is embedded in a voltage-controllable
MW frequency is kept constant due to the very low band-          LC oscillator to serve as both microwave source and EPR
width of the resonator, as dictated by the high Q employed       detector. The idea of using a VCO instead of a microwave
to increase the SNR. In standard CW (CW-EPR) operation,          bridge to excite and detect the nuclear magnetic resonance
the magnetic field is modulated, enabling lock-in detection.     (NMR) signal was first proposed in 1950 (Pound and Knight,
Presently, EPR spectrometers are relatively bulky, having        1950). Importantly, this approach circumvents the classi-
typical dimensions ranging from several tens of centimeters      cal trade-off between resonator Q and detection sensitiv-
for smaller benchtop X-band systems to several meters for        ity (Hyde et al., 2010), enabling frequency-swept EPR over
higher-resolution research spectrometers. While the former       wide frequency ranges with near-constant sensitivity. This al-
are limited to X-band operation, high-end spectrometers are      lows the use of permanent magnets for smaller, more afford-
available at much higher frequencies, operating at X (9 GHz),    able, battery-driven spectrometers, as recently demonstrated
Q (36 GHz), and W (94 GHz) bands up to even higher fre-          (Handwerker et al., 2016; Schlecker et al., 2017a, b; An-
quencies (∼ 263 GHz). Sales prices of EPR spectrometers          ders and Lips, 2019). The magnetic field strengths of prac-
range from ≈ EUR 50 000 for benchtop devices up to well          tical permanent magnets (< 1.5 T) limit the EPR excitation
over EUR 1 000 000 for high-end spectrometers. However,          frequency to below 35 GHz, limiting the use of very high-
for more widespread use of this powerful technique in sci-       frequency EPRoC detectors to research applications (Math-
ence, industry, and even consumer applications, access to        eoud et al., 2018). In addition to allowing for the design of
portable, cost-effective, and easy-to-operate EPR sensors is     miniaturized, battery-driven “conventional” EPR spectrome-
required. In the optimum case, such a spectrometer would         ters, EPRoC detectors can also easily be integrated into com-
consist of a single sensor that can be immersed in, attached     plex and application-specific sample environments, opening
to, or embedded in a sample of interest, removing the limi-      the door to numerous potential in situ and/or operando EPR
tations of current resonator-based techniques. This vision re-   applications from room temperature to cryogenic tempera-
quires a complete redesign of the EPR spectrometer, in which     tures down to 4 K (Gualco et al., 2014).
the bulky electromagnets and microwave parts are replaced           To further increase the sensitivity of the EPR technique,
with smaller permanent magnets and miniaturized electronic       especially for samples with long relaxation times, the rapid-
components capable of sweeping the frequency at a fixed          scan EPR (RS-EPR) technique has been introduced (Eaton
magnetic field. An important challenge in designing such         and Eaton, 2016). The advantage of the RS technique as
frequency-swept EPR systems is to ensure a (near-)constant       compared to CW-EPR is that much higher microwave exci-
sensitivity over wide sweep ranges.                              tation fields (B1 ) can be applied to the sample before satura-
   In pursuit of this redesign, EPR spectrometers have been      tion effects are observed. The RS technique overcomes MW
developed that enable more flexible operando applications        saturation limitations of the spin system by spending less
such as a handheld EPR system for transcutaneous oxime-          time on resonance. Thereby, the SNR can be significantly

Magn. Reson., 2, 673–687, 2021                                                        https://doi.org/10.5194/mr-2-673-2021
S. Künstner et al.: Rapid-scan electron paramagnetic resonance using an EPR-on-a-Chip sensor                                    675

enhanced in comparison to traditional CW-EPR (Eaton and              eter with a permanent magnet. Rapid-scan operation with
Eaton, 2016). This is accomplished by scanning the magnetic          single-chip integrated oscillators was initially proposed in
field or MW frequency quickly such that the resonance is             Gualco et al. (2014); however, no details about detecting the
passed in a time shorter than the relaxation times T1 and T2∗ .      resulting EPR signal were provided. The fact that the tun-
The EPR signal is recorded with a transient digitizer instead        ing voltage of a VCO can be used to produce fast-frequency
of a phase-sensitive detector, and passage effects may appear        ramps is well known and has been previously used in RS-
as “wiggles” on the trailing edge of the EPR resonance sig-          EPR (Laguta et al., 2018). However, VCO-based EPRoC de-
nals in the time domain. The passage effects can then be re-         tectors also provide a very interesting means of detecting the
moved by Fourier deconvolution to recover the conventional           resulting change in sample magnetization, which was first
slow-passage EPR spectrum (Stoner et al., 2004; Joshi et al.,        proposed in Chu et al. (2017). In this report, we extend the
2005b; Tseitlin et al., 2011a), i.e., the sample susceptibility.     approach proposed in Chu et al. (2017) for RS-EPRoC exper-
There are various reports on enhanced SNR of RS-EPR com-             iments to allow for a reproducible reconstruction of the slow-
pared to CW-EPR using spin-trapped radicals (Mitchell et             passage spectrum from the RS data. Embedding the VCO in a
al., 2013a), nitroxyl radicals (Mitchell et al., 2012), irradiated   high-bandwidth phase-locked loop (PLL) allows for a precise
fused quartz (Mitchell et al., 2011a), and samples with long         definition of the phase of the exciting B1 field from an exter-
relaxation rates such as hydrogenated amorphous silicon (a-          nal reference, even in the presence of temperature and other
Si : H) (Mitchell et al., 2013b; Möser et al., 2017), where          experimental fluctuations. Moreover, the amplitude-sensitive
the latter showed an improvement in spin sensitivity of more         mode of detection with an implicit, high-bandwidth AM de-
than 1 order of magnitude. In addition, RS-EPR allows for            modulator built directly into the LC VCO, as suggested in
the determination of spin relaxation times, which is particu-        Chu et al. (2017), is used to detect the sample magnetization
larly useful in very high-frequency EPR and under conditions         with a high bandwidth on the order of a few hundred MHz.
where pulse EPR techniques are not applicable (Laguta et             Together with the very recent results from Chu et al. (2021),
al., 2018). In most of the aforementioned experiments, field-        a closed theory for the analysis of the AM RS-EPRoC signals
swept RS-EPR was employed. Sweeping magnetic fields at               is provided.
high rates over a wide range is technically demanding and re-           Experimentally, proof-of-concept frequency-swept RS-
quires specialized coils and high-current, high-slew-rate am-        EPR experiments (Tseitlin et al., 2011b; Hyde et al., 2010)
plifiers. The realistically achievable maximum sweep width           with a sweep width of 128 MHz (4.57 mT) using an RS-
is limited to about 20 mT at slow rates (tens of kHz), re-           EPRoC detector are reported, and an improvement of almost
stricting field-swept RS-EPR to the quite narrow spectra of          2 orders of magnitude in SNR was observed compared to
the aforementioned sample classes (organic radicals, samples         CW-EPRoC measurements conducted with the same detec-
with low g anisotropy and small hyperfine interaction, etc.).        tor.
Many transition metal ion states in biological and other sam-
ples, however, have much larger spectral widths. For faster
                                                                     2     Materials and methods
rates, the sweep width is limited even more for typical res-
onator sample sizes. Additionally, vibrations of the coils and       2.1    EPR-on-a-Chip setup
eddy currents induced in the metallic parts of the resonator
may distort the spectrum, which may be especially large for          The schematic of the employed experimental setup is de-
fast, wide sweeps (Joshi et al., 2005a). The sweep width lim-        picted in Fig. 1. The EPRoC detector is located on a printed
itation of field-swept RS-EPR can be overcome using the              circuit board (PCB) which is inserted between the poles of an
non-adiabatic rapid sweep (NARS) (Kittell et al., 2011) or           electromagnet (Bruker B-E 25) (Fig. 1a). The electromagnet
field-stepped direct detection (FSDD) EPR technique (Yu et           was used solely because of immediate availability, without
al., 2015). This technique, however, complicates the data ac-        using the sweeping capabilities, and, in principle, a perma-
quisition as well as the post-processing, prolongs the mea-          nent magnet can be used instead. A small permanent magnet
surement time, and necessitates the use of an electromag-            for the EPRoC is currently being developed. An EPRoC de-
net. Employing frequency-swept RS-EPR circumvents these              sign with an array of 12 injection-locked VCOs was used
problems; however, routinely used high-Q, low-bandwidth              (see Fig. 1b), similarly to the design in Chu et al. (2018). Im-
resonators limit the achievable sweep width considerably.            portantly, the injection locking of N VCOs
                                                                                                             √     lowers the phase
With EPRoC, it is possible to utilize frequency-swept RS-            noise of the joint array frequency by N (Chu et al., 2018).
EPR over large sweep widths of more than 1.8 GHz (63 mT)             The utilized EPRoC detector has a frequency sweep range
(Chu et al., 2017) without the constraints of resonator-based        extending from 12.0 to 14.4 GHz (sweep width 2.4 GHz or
RS-EPR and thus may be used for interrogation of g and               85.6 mT). Two techniques may be used for detecting the spin
A anisotropy of samples with large hyperfine splitting and           response with the EPRoC, namely, amplitude-sensitive de-
long relaxation times, such as in transition metal complexes         tection (AM) (Chu et al., 2017; Matheoud et al., 2018; Chu
at cryogenic temperatures, with increased sensitivity com-           et al., 2021) and frequency-sensitive detection (FM) (Yalçin
pared to CW-EPR using a small-footprint EPRoC spectrom-              and Boero, 2008; Anders et al., 2012). The AM and FM

https://doi.org/10.5194/mr-2-673-2021                                                           Magn. Reson., 2, 673–687, 2021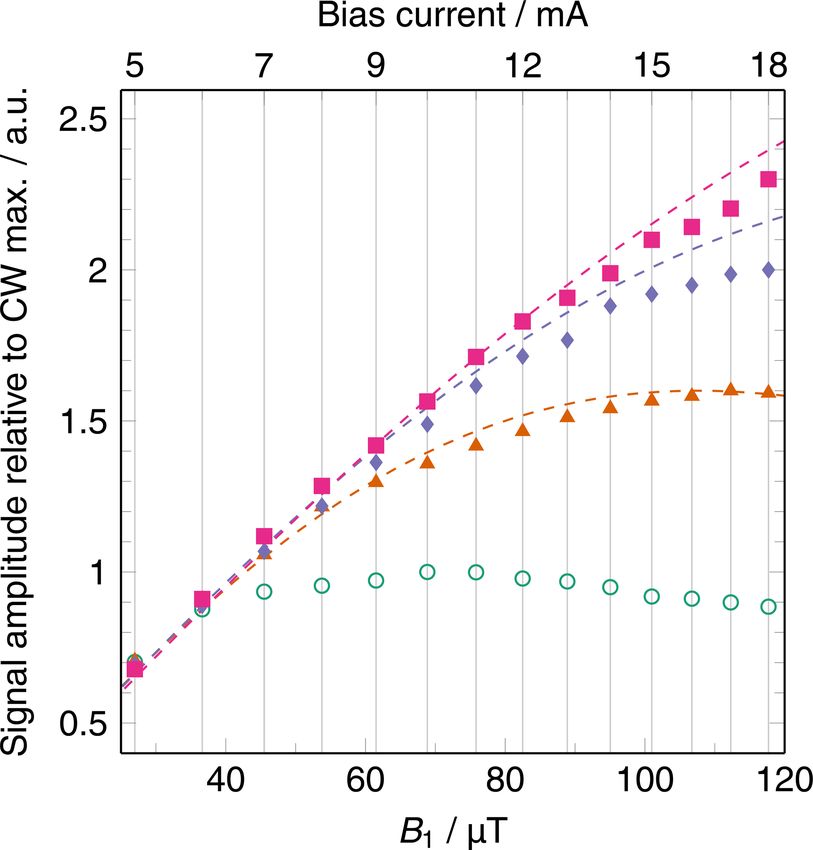
676                      S. Künstner et al.: Rapid-scan electron paramagnetic resonance using an EPR-on-a-Chip sensor

signals correspond to the EPR-induced changes in the VCO
amplitude and frequency, respectively. While the FM signal
purely represents the real component of the complex suscep-
tibility, the AM signal represents a mixture of the imaginary,
χ 00 , and real, χ 0 , components of the magnetic susceptibility
(Chu et al., 2021). More specifically, the EPR-induced fre-
quency changes, 1ωosc , and amplitude changes, 1Aosc , in
the AM and FM detection modes can be written as

1Aosc ∝ Qχ 00 − χ 0 ,                                       (1)
           0
1ωosc ∝ χ ,                                                 (2)

where Q is the quality factor of the LC tank inside the VCO.
Note that the FM signal only depends on χ 0 (Eq. 2) and that,
depending on the quality factor, the AM signal is primarily
observed as an absorption signal according to χ 00 , which is
slightly distorted by the dispersion signal χ 0 . In the experi-
ments performed in this report, the amplitude detection mode
of the VCO-based detector (cf. Fig. 1d) is employed, and the
EPR signal is measured as a change in the oscillation am-
plitude of the VCO (Chu et al., 2017). Although both de-
tection modes provide theoretically the same sensitivity (An-
ders, 2011; Matheoud et al., 2018), the practical advantage of
detecting the AM signal is that a wideband AM demodulator
can be easily integrated into an LC tank VCO as suggested
in Chu et al. (2017), which greatly reduces the experimental       Figure 1. (a) Depiction of the EPRoC setup. The EPRoC is located
complexity. The resulting change in amplitude of oscillation       on the PCB, which is inserted between the poles of the electromag-
of the VCO, δA(t), is given by, e.g., Chu et al. (2017):           net. It is connected to a signal generator, a power supply and ei-
                                                                   ther a lock-in amplifier (LIA) for CW measurements or a digitizer
                                                                   for RS operation. The directions of the static B0 field and B1 MW
                                        Z
             Qcoil                   d
δA(t) ≈ −           · sin (ωosc t) ·      B u · M s dV ,    (3)    field are indicated by the arrows. (b) Close-up of the EPRoC ar-
            αod − 1                  dt
                                    Vs                             ray with the 12 octagonal coils. The BDPA sample is placed in the
                                                                   coil AM1, where an AM signal can be detected. (c) A block dia-
where Qcoil is the unloaded factor of the LC resonator in-         gram of the EPRoC setup as shown in (a). The RF generator pro-
side the VCO, αod is a design parameter ranging for prac-          vides a reference frequency fref to the phase-locked loop in which
tical VCOs between two and five, ωosc is the VCO oscilla-          the VCO of the EPRoC is embedded. The VCO is biased using a
tion frequency, B u is the unitary magnetic field of the VCO       bias current, Ibias . The AM signal at Vx is detected by the digitizer.
tank inductor, and M s is the sample magnetization. Here,          (d) Illustration of the interaction between the VCO-based detector
                                                                   and the spins in the sample. The knot Vx provides the implicit AM
it should be noted that, assuming that ωosc ≈ ωL , i.e., that
                                                                   demodulation as described in the text. The transistors M1 and M2
the oscillation frequency is close to the Larmor frequency of
                                                                   are a cross-coupled pair that acts as a “negative” resistance replen-
the electron spin ensemble, Eq. (3) contains a low-frequency       ishing the energy loss of the LC tank (upper part of the electrical
component that corresponds to the spin magnetization in the        circuit). The copyright statement only applies to (d) © 2017 IEEE.
rotating frame of reference M s,rot and a component around         Reprinted, with permission, from Chu et al. (2017).
twice the Larmor frequency. The implicit AM demodulator
(denoted as Vx in Fig. 1d) extracts the low-frequency compo-
nent of Eq. (3) with a sensitivity SAM and an effective noise
figure, which will be discussed later in the context of the ex-    crucial for deriving the phase of the B1 field produced by the
perimental results. In principle, as suggested in Matheoud et      VCO from a well-defined reference, even in the presence of
al. (2018), an external AM demodulator can be used instead.        fluctuations of the experimental conditions. On the EPRoC,
   The AM detection scheme is implemented in one VCO               a 32-divider is placed such that the reference frequency for
inside the injection-locked VCO array, which is used as the        the PLL is around 420 MHz (13.44 GHz / 32).
EPR detector for all EPR experiments shown in this paper; cf.         The B1 magnitude may be varied by controlling the
Fig. 1. The MW frequency of the EPRoC array is controlled          bias current, Ibias , applied to the VCO with a minimum
by a PLL with a bandwidth of about 10 MHz and a radio fre-         B1 of about 27 µT resulting from the minimum bias cur-
quency (RF) generator (Rohde & Schwarz, SMB100A) as the            rent (∼ 5 mA) required for stable oscillations of the VCO.
PLL frequency reference. As mentioned above, the PLL is            All EPR measurements were performed as a frequency-

Magn. Reson., 2, 673–687, 2021                                                             https://doi.org/10.5194/mr-2-673-2021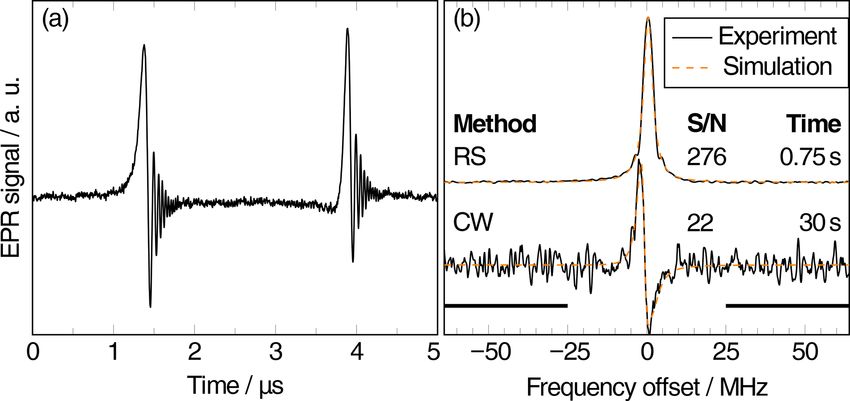
S. Künstner et al.: Rapid-scan electron paramagnetic resonance using an EPR-on-a-Chip sensor                               677

swept experiment with the EPRoC detector at a central mi-        regime only depends on B1 according to
crowave frequency of 13.44 GHz and at an external mag-           dωmw
netic field of B0 = 479.4 mT. For CW-EPRoC detection, si-                  γ 2 B12 ,                                      (5)
                                                                    dt
nusoidal frequency modulation is applied to the MW carrier
                                                                 as defined by Powles (1958). For sinusoidal frequency
wave with a modulation rate fm and a peak-to-peak mod-
                                                                 sweeps, which are used in all RS-EPRoC experiments re-
ulation amplitude 1fm,pp = 21fm (see Eq. 7 below). The
                                                                 ported in this paper, the excess (i.e., in excess of the MW
CW-EPRoC signal is detected with a lock-in amplifier (An-
                                                                 carrier frequency ωmw ) instantaneous microwave frequency,
fatec, eLockIn 203) and is linearly baseline-corrected using
                                                                 fi , is defined as
the outermost 5 % of the recorded spectrum where no signal
is present. For RS-EPRoC measurements, a complex tran-           fi = 1fm cos (2π fm τ ) ,                                  (6)
sient signal was constructed from the AM signal by invok-
                                                                 where 1fm is the modulation amplitude in Hertz and fm is
ing the Kramers–Kronig (corresponding to a Hilbert trans-
                                                                 the modulation frequency in Hertz. In one scan period T ,
form of the signal) relationship to allow accurate deconvo-
                                                                 resonance is achieved twice, namely, at τ = T /4 and at τ =
lution and reconstruction of the EPR spectrum (Tseitlin et
                                                                 3T /4, where the scan rate, α, reaches a maximum of
al., 2010). Only the AM signal was considered due to the
large demodulation bandwidth of the implicit AM demodu-                αrot   dfi
                                                                 α=         =             = 2π fm 1fm .                     (7)
lator. This greatly facilitates AM RS-EPR experiments us-              2π     dt    max
ing EPRoC detectors compared to FM RS-EPRoC, where a             The maximum modulation amplitude in these experiments
much larger PLL bandwidth (∼ 80 MHz) would be needed             was limited by the RF generator, which provides a frequency-
to demodulate the FM RS-EPR and make it available at the         modulated reference signal at 420 MHz to the EPRoC via the
VCO tuning voltage. Such large PLL bandwidths are hard           PLL, corresponding to 13.44 GHz on the chip due to the 32-
to achieve due to the very high required reference frequen-      divider as mentioned above. At this frequency, the maximum
cies. (See Appendix B for more information concerning the        frequency modulation amplitude of the RF generator (also
bandwidth calculation.)                                          referred to as frequency deviation) is 2 MHz, corresponding
   A single grain of α,γ -bisdiphenylene-β-phenylallyl           to 1fm = 32 · 2 MHz = 64 MHz (2.28 mT) at the VCO out-
(BDPA, 1 : 1 with benzene from Sigma Aldrich, ∼ 1.6 µg,          put frequency, which was used in the experiments reported.
∼ 2 × 10¹⁵ spins) was placed in the AM1 coil of the EPRoC        The maximum modulation frequency of the RF signal gener-
detector (see Fig. 1b). The sample volume was calculated to      ator is 1 MHz; thus, only about 5 % of the available frequency
be 6.7 × 10⁻⁴ mm3 (0.67 nL) (for more information, see Ap-       sweep range of the EPRoC, about 2.4 GHz (1fm ≈ 1.2 GHz,
pendix F). BDPA gives an EPR signal at g = 2.003 with a          sweep width 85.6 mT), was used. This in turn limited the
line width of about 0.07 mT (Meyer et al., 2014).                maximum scan rate, α, to 402.1 THz s−1 , corresponding to
                                                                 14.4 kT s−1 .
2.2   Rapid scan using EPRoC
In RS-EPRoC operation, sinusoidal frequency modulation is        3     Results and discussion
applied to the fixed MW frequency, similarly to CW-EPRoC
operation; however, in the case of RS-EPRoC, much larger         3.1    Comparison between CW- and RS-EPRoC spectra
modulation rates, fm , and frequency deviations, 1fm , are       An example of a full-cycle transient AM RS-EPRoC signal
used with the transient response detected directly and without   recorded with a bias current of 7 mA (B1 ∼ 45.5 µT) and a
lock-in amplification. The RS-EPRoC signal is recorded us-       scan rate of 80 THz s−1 is depicted in Fig. 2a, where the char-
ing a transient digitizer (Zurich Instruments, UHF-LIA) with     acteristic “wiggles” resulting from the non-adiabatic rapid
a sampling rate set to 450 MHz. For the baseline correction      passage are clearly observed. Since the resonance is passed
of the transient RS signal, a non-resonant transient RS back-    twice in each full cycle, the signal is recorded twice during
ground signal was recorded at a magnetic field of 400 mT and     each experiment. As expected, the AM EPRoC signal ex-
was subsequently subtracted from the experimental transient      hibits an asymmetric line shape due to the mixture of ab-
RS-EPRoC signal.                                                 sorption and dispersion (see Eq. 1) that is dependent on the
   To ensure operation in the rapid-passage regime as defined    direction of the frequency sweep. If the signal was purely
by Weger (1960), the scan rate αrot of the MW frequency          absorption, the shape of the two lines would be symmetric;
ωmw = 2π fmw must fulfill the following condition:               if it was purely dispersion, they would be “mirrored” since
         dωmw  |γ | B1                                           the resonance is passed once from low frequency to high fre-
αrot =        √       ,                                   (4)   quency and again in the opposite direction. To recover the
          dt     T1 T2
                                                                 EPR spectrum, the transient RS-EPRoC signal is Fourier-
where γ is the gyromagnetic ratio of the spin, and B1 is         deconvolved from the sinusoidally oscillating MW excita-
the amplitude of the MW excitation field. The criterion for      tion, as explained in detail in Appendix A. Only the imag-
a frequency sweep to reach the non-adiabatic rapid passage       inary component of the deconvolved RS-EPRoC spectrum,

https://doi.org/10.5194/mr-2-673-2021                                                         Magn. Reson., 2, 673–687, 2021
678 S. Künstner et al.: Rapid-scan electron paramagnetic resonance using an EPR-on-a-Chip sensor
unit measurement time, and an overall improvement in SNR
of nearly 2 orders of magnitude is obtained. These results
are in good agreement with those reported for field-swept
RS-EPR of various sample classes, including nitroxyl radi-
cals (Mitchell et al., 2012), irradiated fused quartz (Mitchell
et al., 2011a), and samples with long relaxation rates such
as a-Si : H or N@C60 (Mitchell et al., 2013b; Möser et al.,
2017). When comparing the sensitivities in the CW mode
between the FM mode of detection and the AM mode of de-
tection, it was found that a discrepancy of about 4 orders
of magnitude between the FM mode and the AM mode is
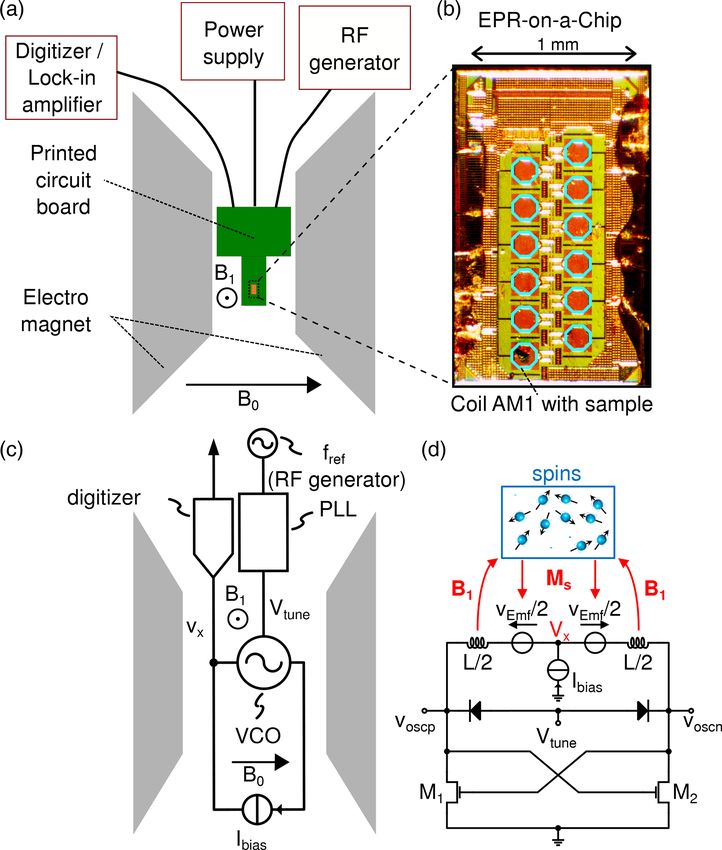
Figure 2. (a) The background-corrected AM RS-EPRoC time
trace recorded at a scan rate of 80 THz s−1 (corresponding to
observed. More specifically, the presented EPRoC√detector
2.9 kT s−1 ; 1fm = 64 MHz, fm = 200 kHz, Ibias = 7 mA, B1 = has an FM sensitivity of around 5 × 10⁹ spins (G Hz)−1 ,
46 µT). (b) Experimental data (black) and simulations (orange) of whereas in the AM mode √ the measured CW sensitivity is
the CW (Ibias = 5 mA, B1 = 27 µT) and the deconvolved RS spec- around 3 × 10¹³ spins (G Hz)−1 . This discrepancy in sen-
tra. sitivity partially arises due to the injection locking of the
VCOs, which improves the FM noise√ floor but not the AM
noise floor, accounting for a factor of 12 ≈ 3.5. Only very
which corresponds to the imaginary component of the mag- recently, the noise figure of the implicit AM demodulator was
netic susceptibility, is shown in Fig. 2b. The CW spectrum simulated numerically (Chu et al., 2021), revealing a sensi-
of the same sample recorded using a bias current of 5 mA tivity of around 1/6 and a degradation in the noise floor of
(B1 = 27 µT) is also shown. The different bias currents in the around 20 dB in the frequency range of interest of the implicit
two experiments were chosen to ensure operation in the lin- AM demodulator, corresponding to an effective noise figure
ear regime, i.e., without microwave saturation. around 35 dB, i.e., a degradation of around 60 in the spin sen-
As expected from Eq. (1), the CW-EPRoC signal exhibits sitivity at the output of the AM demodulator compared to the
an asymmetric line shape. There is no asymmetry in the RS- intrinsic SNR of the AM signal with respect to the ampli-
EPRoC spectrum because the complex RS-EPRoC spectrum tude of the VCO. Together with the factor of 3.5 from above,
can be phase-adjusted such that only the absorption signal these factors explain a ∼ 210-fold degradation compared to
is visible. In CW-EPRoC measurements, quadrature detec- the FM sensitivity, explaining a large fraction (up to approxi-
tion is not possible, and Kramers–Kronig manipulation is ill- mately a factor of 10) of the discrepancy between the FM and
suited due to slight signal saturation. Both spectra in Fig. 2b AM CW sensitivities of the presented system. As suggested
were simulated using the “pepper” function of the EasySpin in Matheoud et al. (2018), an off-chip AM demodulator with
software package (Stoll and Schweiger, 2006) assuming a a better noise figure may be used to improve the sensitivity
spin-1/2 system with Lorentzian broadening. The asymme- of the AM mode detection, preserving more closely the in-
try of the line shape in the CW spectrum is included in the trinsically identical sensitivities of the FM and AM modes of
simulation via a tailored fitting function according to Eq. (1), detection.
using a mixture of absorption and dispersion. A detailed de-
scription of the simulations is given in Appendix E. The fit
parameters of the CW and deconvolved RS spectra as well as 3.2 Analysis of the transient RS-EPRoC signal
the measurement parameters for the CW spectrum are given
in Appendix D. RS-EPRoC time traces recorded using four different bias cur-
The SNR and relevant parameters of CW- and RS-EPRoC rents (5, 9, 14, and 18 mA) corresponding to B1 values of
measurements are summarized in Table 1. While only the 27, 62, 95, and 118 µT are shown in Fig. 3. The RS-EPRoC
imaginary component of the deconvolved spectrum is shown time traces were simulated and fit using a solution of Bloch’s
in Fig. 2, √
the SNR can in principle be further increased by a equations in the steady state for sinusoidal modulation. For
factor of 2 by the addition of the real and imaginary com- the simulation, Biot and Savart’s law and a square-root coil
ponents of the RS-EPRoC spectrum (Tseitlin et al., 2010). current model were used to calculate the B1 magnitude,
Because the Kramers–Kronig relation is needed to obtain the which cannot be analytically calculated from the bias cur-
complex transient RS-EPRoC signal in the presented setup, rent driving the EPRoC sensor (see Appendix E for more in-
the SNR cannot be increased in the presented setup by the formation). The simulations were performed using the tran-
addition of the two spectra. The use of quadrature detection sient AM RS-EPRoC signals without deconvolution, and the
eliminates noise correlation and allows the real and imagi- asymmetry of the AM signals was considered by including
nary components to be combined, increasing SNR similarly the quality factor from Eq. (1) in the simulations. The re-
to increasing the number of averages in the collected spec- laxation times of BDPA, T1 = 110 ns and T2 = 100 ns, were
trum. RS-EPRoC measurements yield improved SNR per taken from the literature (Goldsborough et al., 1960; Mitchell
Magn. Reson., 2, 673–687, 2021 https://doi.org/10.5194/mr-2-673-2021S. Künstner et al.: Rapid-scan electron paramagnetic resonance using an EPR-on-a-Chip sensor 679
Table 1. SNR for the CW-EPRoC and RS-EPRoC methods.
Method Bias current, B1 , No. of Modulation SNR Measurement Normalized
mA µT averages rate, THz s−1 time, s SNR, s−1
CW-EPRoC 5 27.0 1 0.5 22 30.0 4.0
RS-EPRoC 7 45.5 1.5 × 10⁵ 80.4 276 0.75 318.6
Figure 3. RS-EPRoC time traces (black) recorded using four dif-
Figure 4. Signal amplitudes of CW-EPRoC (green circle) and tran-
ferent bias currents that correspond to four different B1 magnitudes
sient RS-EPRoC for three scan rates (80.4 THz s−1 , orange triangle;
at a scan rate of 80 THz s−1 . The spin system passes through res-
201.1 THz s−1 , purple diamond; and 402.1 THz s−1 , pink square)
onance twice during each period of the modulation of the MW
as a function of bias current (x axis, top) and corresponding B1
frequency; see Eqs. (6) and (7). The simulations (orange) of the
magnitudes (x axis, bottom). The dashed lines are simulations of
transient-acquired data are in good agreement with the experiment.
the RS signals.
et al., 2011b) and are required for the RS simulations. A thor-
ough description of the simulations is given in Appendix E. Finally, it is necessary to explore the theoretical limits of
In Fig. 4, the signal intensities of CW- and transient RS- the RS-EPRoC technique. Figure 5 shows the simulated sig-
EPRoC measurements are compared as a function of B1 , nal amplitudes of the deconvolved RS-EPRoC spectra as a
demonstrating the saturation behavior of the BDPA–benzene function of both B1 and scan rate, α. The scan rate was in-
complex observed via CW- and RS-EPRoC with rates of α = creased by increasing scan width while maintaining a con-
80.4, 201.1, and 402.1 THz s−1 . The CW- and RS-EPRoC stant scan frequency (200 kHz) to ensure that all oscillations
signal increases with increasing B1 , as expected, and satu- have decayed within a single scan period (half cycle) when
ration is observed at higher values of B1 for RS- compared considering T1 and T2∗ on the order of 100 ns. The signal
to CW-EPRoC experiments. Increasing α leads to a linear amplitudes were normalized to the global maximum of all
regime that extends over several tens of µT, thus allowing signals resulting from the simulations to probe the limits of
the use of B1 values beyond the relaxation-determined limit. the RS-EPRoC technique with respect to SNR. This analysis
Though BDPA is considered rapidly relaxing (∼ ns), this extends the rapid-scan technique far beyond what is possi-
sample was chosen to facilitate operation in the linear regime ble with field-swept RS-EPR to encompass a regime that is
for both CW- and RS-EPRoC experiments (see Eqs. 4 and only accessible via frequency-swept RS-EPR, which has now
5). The minimum B1 of the EPRoC is large enough to satu- been implemented with RS-EPRoC. From this simulation, an
rate many slowly relaxing radicals, distorting the line shape improvement of the signal amplitude by a factor of about 5
and thereby limiting quantitative analysis. Such samples with may be achieved compared to the rapid-scan measurements
slow relaxation, such as single substitutional nitrogen centers presented in this work.
(N0S ) in diamonds, a-Si : H, or N@C60 (Mitchell et al., 2013b; From the simulations, it was determined that simultane-
Möser et al., 2017), especially benefit from the RS technique ously increasing both B1 and α yields an increase in relative
due to the signal saturation that is observed at low MW pow- signal amplitude (yellow region in Fig. 5). For a constant B1 ,
ers when using CW methods. an optimal scan rate, α, may be achieved that maximizes rel-
ative signal intensity without saturation; however, increasing
https://doi.org/10.5194/mr-2-673-2021 Magn. Reson., 2, 673–687, 2021680 S. Künstner et al.: Rapid-scan electron paramagnetic resonance using an EPR-on-a-Chip sensor
or by using faster repetition rates, which increases the num-
ber of full-frequency sweeps per unit time. The number of
sweeps per unit time, however, is limited by the effective
transverse relaxation time T2∗ (Tseytlin, 2017) given by the
expression
1
> N · T2∗ , (8)
fm
with N being in the range of 3 to 5, depending on the amount
of acceptable line broadening introduced by Fourier decon-
volution. This limit imposes the requirement that the RS sig-
nal oscillations or “wiggles” must have decayed completely
before the next scan cycle is recorded (Fig. 2a).
Figure 5. Relative simulated signal amplitude of the deconvolved Currently, the scan rate is not limited by the EPRoC array
RS spectrum as a function of both B1 and scan rate α. The solid line and its PLL, but by the signal generator supplying the PLL
defines the adiabatic and non-adiabatic regions (Eqs. 4 and 5). The
reference frequency (see Sect. 2.2 for a detailed explanation).
relaxation times were set to T1 = 110 ns and T2∗ = 100 ns. The sim-
ulation was performed with a constant RS frequency (200 kHz) and
Commercially available analog signal generators, such as the
increasing scan width (Eq. 7). The two outlined rectangular regions Rohde & Schwarz SMB100B, may improve the scan rate
(dashes) represent the accessible area for the current work as well as (1fm,max = 160 MHz (sweep width 320 MHz or 11.4 mT),
that of a study using field-swept RS-EPR where the maximum scan factor of 2.5, and fm,max = 10 MHz, factor of 10). However,
rate was reported (Mitchell et al., 2011b). (∗ The fastest scan rate as described by Eq. (8), the transverse relaxation time limits
currently reported for a frequency-swept high-field/high-frequency the usage of such high modulation frequencies. Additionally,
RS-EPR experiment was 267 000 THz s−1 (Laguta et al., 2018) and the bandwidth of the PLL limits the modulation frequency to
is far beyond the limits of this plot.) The ellipse shows the target about 5 MHz, such that an improvement of the scan rate by
region for the next-generation EPRoC, where the maximum signal a factor of 5 is realistic. The next-generation EPRoC with
is obtained. An improvement of the signal amplitude by a factor of on-chip PLLs and higher bandwidths of up to 80 MHz is
about 5 is expected.
currently in development and will be capable of delivering
scan rates of up to 104 THz s−1 via scan widths of more than
2.4 GHz (85.6 mT) and repetition rates of 2 MHz or more.
the scan rate when the signal is unsaturated does not increase Due to the larger bandwidth of the PLL and a different PLL
the signal intensity unless B1 is similarly increased. Like- design where the FM signal may be extracted without filter-
wise, for a constant scan rate, α, an optimal B1 may similarly ing, the FM signal may additionally be used for data analysis
be achieved that maximizes relative signal intensity without exploiting the advantage of the array giving access to a larger
saturation, but additional increases in B1 strength without an sample volume and hence increased concentration sensitiv-
accompanying increase in scan rate lead to saturation and ity.
a decrease in signal intensity due to line broadening. Thus,
only an increase in both B1 and scan rate will increase the 4 Conclusions
relative signal amplitude in RS experiments, and this princi-
ple will guide further development of RS-EPRoC designs. In this work, the use of VCO-based EPRoC detectors is intro-
In these experiments, the available B1 as indicated by the duced for closed-loop non-adiabatic RS-EPR experiments.
dashed rectangle in Fig. 5 is limited due to heating of the By embedding the VCO in a large-bandwidth PLL and using
passively cooled EPRoC detector. If the EPRoC sensor was the implicit amplitude demodulation capability of current-
actively cooled, a B1 of up to 250 µT (∼ factor of 2) is pos- biased LC tank oscillators, the experimental setup of RS-
sible with this generation of the EPRoC. In future EPRoC EPRoC experiments is comparatively simpler compared to
generations with a smaller coil diameter (∼ 100 µm, factor of conventional field-swept RS-EPR. In these experiments, an
2), the B1 magnitude may be increased by an additional fac- improvement in SNR of almost 2 orders of magnitude is
tor of 2. With the usage of other fabrication techniques than achieved compared to CW experiments performed using the
a complimentary metal-oxide semiconductor (CMOS), such same EPRoC detector. The improvement in SNR arises from
as bipolar CMOS (BiCMOS) and indium gallium arsenide a combination of an increased signal amplitude due to a later
(InGaAs), the total B1 gain can be increased by an additional onset of sample saturation (a factor of approximately 2) in
factor of 10 compared to the current generation, resulting in the RS regime and an improved noise floor due to the sig-
absolute B1 magnitudes of about 1 mT. nificant signal averaging employed in the RS measurements.
The scan rate may be increased by either extending the With these experimental results, it is confirmed that – simi-
scan width, which decreases the time spent on resonance, larly to field-swept RS-EPR – in RS-EPRoC the RS signal is
Magn. Reson., 2, 673–687, 2021 https://doi.org/10.5194/mr-2-673-2021S. Künstner et al.: Rapid-scan electron paramagnetic resonance using an EPR-on-a-Chip sensor 681 less prone to B1 field saturation and remains in the linear B1 regime up to 90 µT for BDPA at the fastest scan rate investi- gated (402.1 THz s−1 ). The time-domain signals can be reli- ably transformed to depict the EPR susceptibility. Although the reported CW sensitivities are greatly inferior to the FM sensitivities of the presented chip, most of this discrepancy can be explained by the poor noise figure of the implicit AM demodulator. Therefore, by using improved, low-noise AM demodulators in the future, it is expected that AM sensitiv- ities similar to those observed in the FM mode may be ob- tained, allowing the full benefits from the simplified experi- mental setup and the large SNR gain in the AM rapid-scan mode of detection to be realized. The inherently large frequency sweep width capability of the EPRoC array, with sweep widths of up to 2.4 GHz (86 mT) and intrinsically near-constant detection sensitivity, will allow investigations of transition metal ions and other broad line spectra by RS-EPR. The ability to use small per- manent magnets via frequency-swept RS-EPR, coupled with its small size and power consumption, makes EPRoC appli- cations very flexible. In the future, EPRoC detectors may be integrated into various complex and harsh sample envi- ronments, enabling in situ and operando EPR measurements that have previously been inaccessible. This includes hand- held devices for in-the-field multi-line fingerprinting applica- tions in chemistry, medicine, biology, material science, and physics. https://doi.org/10.5194/mr-2-673-2021 Magn. Reson., 2, 673–687, 2021
682 S. Künstner et al.: Rapid-scan electron paramagnetic resonance using an EPR-on-a-Chip sensor
Appendix A: Fourier deconvolution and the effective transverse relaxation time T2∗ (Mitchell et
al., 2012),
The Fourier deconvolution procedure was published in de-
tail in the references (Stoner et al., 2004; Joshi et al., 2005b; BWsignal ≈ N αT2∗ = 2π fm 1fm T2∗ , (B1)
Tseitlin et al., 2011a; Tseytlin, 2017) and is briefly summa-
rized here. To obtain the EPR spectrum, the RS signals must where N is a parameter that describes the acceptable line-
be Fourier-deconvolved from the frequency spectrum of the shape broadening and is usually between 3 and 5. The signal
MW excitation. Assuming a linear response r(t) of the spin bandwidth of the transient RS-EPR signal is determined by
system under the influence of the excitation d(t) and B1 to be the spacing of the “wiggles”, which are a measure of the res-
small enough to avoid saturation, the following is obtained: onance offset, the modulation frequency, fm , and the mod-
ulation amplitude, 1fm . The spacing of the “wiggles” on
Z∞ the trailing edge of the transient RS-EPR signal at constant
r(t) = (h∗d) (t) = h(τ )d(t − τ )dτ, (A1) T2∗ and constant fm gets smaller with increasing modulation
−∞ amplitude, 1fm , since the resonance offset gets larger. The
linear dependence of the signal bandwidth on T2∗ can be ex-
where h(t) is the impulse response of the spin system (often plained by the fact that the “wiggles” are visible for a longer
referred to as “wiggles”), and ∗ denotes the convolution op- time. Since the resonance is passed twice in one full RS cy-
erator. The driving function (Tseitlin et al., 2011a) for the RS cle, only half of the available bandwidth of any detection sys-
modulation, d(t), is then defined as tem is available for the signal present in each half cycle, such
t that the BW of the detection system BWdetection should be
Z
twice as large as the signal bandwidth as
d(t) = exp i ω(τ )dτ , (A2)
0 BWdetection ≥ 2N αT2∗ . (B2)
where ω(τ ) is the time-dependent angular MW frequency In Mitchell et al. (2012), relation (B2) was used to determine
(i.e., the waveform), and its integral is the MW phase. In the the quality factor needed for detection of an undistorted RS-
frequency domain, the convolution in Eq. (A1) becomes a EPR signal. Concerning the EPRoC, the bandwidth of the
multiplication: PLL, about 10 MHz, limits the bandwidth of the FM signal to
about 5 MHz. Using a conservative estimate for N = 5 and a
R(ω) = H (ω)D(ω), (A3)
T2∗ of 110 ns, the signal bandwidth needed for an undistorted
where R(ω), H (ω), and D(ω) are the Fourier transforms of FM signal is about 80 MHz. Since the available bandwidth is
r(t), h(t), and d(t), respectively. Thus, the EPR spectrum can much less than the required signal bandwidth, the FM signal
be obtained in the frequency domain by a division as was not considered in these experiments.
H (ω) = R(ω)/D(ω). (A4) Appendix C: Digital post-processing of the EPRoC
spectra
The algorithm of the deconvolution procedure is as fol-
lows. The zero-padded transient baseline-corrected RS sig-
Both CW- and RS-EPRoC spectra are digitally filtered with
nal is Fourier-transformed with a Welch apodization win-
a moving-average, second-order Savitzky–Golay filter. The
dow (Welch, 1967). The excitation function is calculated as-
filter window is adjusted such that the line width is broadened
suming a sinusoidal frequency scan, numerically integrated,
by less than 5 %. For CW data, the effective acquisition time
zero-padded, and Fourier-transformed with the same Welch
is calculated from the number of data points of the sweep,
apodization window. According to Eq. (A4), the EPR spec-
Npoints , and the time constant of the lock-in amplifier, τLIA ,
trum containing both real and imaginary components of the
as
complex susceptibility is obtained by the division of both
Fourier transforms. The zero-padding function improves fre- Tacq,cw = 3Npoints · τLIA . (C1)
quency resolution, while the apodization window avoids
sharp transitions to zero when zero-padding, which would A factor of 3 is introduced to take into account the re-arm
result in spikes in the Fourier transforms. time of the lock-in amplifier required to achieve 99.9 % of the
maximum signal intensity. For RS experiments, the effective
Appendix B: Bandwidth of the transient RS-EPRoC acquisition time is calculated using the number of averages,
signal and its relation to the PLL bandwidth Navg , and both the number, Nfc , and the period, Tfc , of all RS
cycles present in the signal acquisition, respectively, as
The bandwidth of a transient RS-EPR signal for a single
Lorentzian may be calculated from the scan rate α in Hz s−1 Tacq,rs = Navg Nfc Tfc . (C2)
Magn. Reson., 2, 673–687, 2021 https://doi.org/10.5194/mr-2-673-2021S. Künstner et al.: Rapid-scan electron paramagnetic resonance using an EPR-on-a-Chip sensor 683
The signal amplitude of the CW measurements is defined
as the peak-to-peak amplitude of the AM signal. The root-
mean-square (rms) noise is determined from the baseline re-
gions of the spectrum (see Fig. 2b). For both CW- and RS-
EPRoC measurements, ∼ 61 % of the data points were used
for calculation of the rms noise. The SNR is calculated as the
ratio of the signal amplitude to the rms noise. The signal am-
plitude of the deconvolved RS-EPRoC spectrum is defined
as the maximum value of the imaginary part of the decon-
volved RS spectrum. The rms noise is calculated for the CW
measurements from the baseline regions of the spectrum. The
SNR is calculated as the ratio of the signal amplitude to the
rms noise. For the saturation analysis, the signal amplitude of
the RS measurements is defined as the peak-to-peak ampli-
tude of the transient RS signals since a deconvolution of the
Figure E1. B1 magnitude obtained by the square-root model of the
highest scan rate was not possible due to overlapping signals. bias current used throughout the EPRoC experiments reported in
To compare the signal amplitudes of different methods and this paper.
scan rates, the relative signal amplitude is used.
Appendix D: Fit and CW measurement parameters tributions from both absorption and dispersion. To convert
for Fig. 2 the bias current to a B1 magnitude, a two-parameter square-
root model of the current in the coil, Icoil , taking the curvature
The Lorentzian peak-to-peak line width of the fit of the of the coil current at low bias current into consideration, was
deconvolved RS-EPRoC spectrum is 1.98 MHz (0.071 mT). assumed to be
The fit parameters of the CW-EPRoC spectrum are p
Lorentzian peak-to-peak line width: 2.42 MHz (0.086 mT), Icoil = a + b Ibias . (E1)
Qcoil = 3.54 as defined in Eq. (1).
The measurement parameters of the CW spectrum are From this, the B1 magnitude, as seen in Fig. E1, was calcu-
fm = 100 kHz, 1fm,pp = 0.768 MHz (0.028 mT), lock-in lated assuming a circular single turn inductor with a radius,
time constant, 10 ms, and filter order, 24 dB, which gives an R, of 100 µm using Biot and Savart’s law as
effective noise bandwidth of the LIA of 102.62 Hz. √
1 Icoil 1 a + b Ibias
B1 = µ0 = µ0 , (E2)
2 2R 2 2R
Appendix E: Simulation of transient RS-EPR signals
where µ0 is the vacuum permeability. The factor of 1/2 takes
All simulations of transient RS-EPR signals were performed into account that only half of the B1 field is available for
by numerically solving the Bloch equations (Tseitlin et al., microwave excitation due to the two counter-rotating mi-
2013; Stoll and Schweiger, 2006) in the steady state us- crowave fields in the rotating frame.
ing EasySpin’s “blochsteady” function. A spin-1/2 system For the simulation of the AM RS-EPRoC signals, three
with a g value of 2.003, a Lorentzian line shape, and relax- global parameters were slightly varied for all transient RS
ation times T1 = 110 ns and T2 = 100 ns were assumed based signals – the parameters a and b and the quality factor Q of
on previous reports for BDPA (Goldsborough et al., 1960; the VCO from Eq. (1).
Mitchell et al., 2011b).
E2 Simulation of the RS-EPR signal amplitude as a
E1 Simulation of the transient RS-EPRoC signals to function of B1 and scan rate
obtain B1 magnitude
For each point in Fig. 5, a complex transient RS-EPR sig-
Since the range of the B1 magnitude of the EPRoC is not nal containing both dispersion and absorption was simulated
precisely known and cannot be measured by Rabi oscilla- as described in the preceding section and subsequently de-
tions due to the limited bandwidth of the PLL, 14 transient convolved. From each deconvolution, the signal amplitude,
AM RS signals were recorded with increasing bias current which is the maximum of the absorption signal, was ex-
and simulated as described in the preceding section without tracted. The obtained values were normalized to the global
Kramers–Kronig manipulation and without subsequent de- maximum of all the signal amplitudes to form a relative com-
convolution. Thus, the lineshape asymmetry expected from parison.
Eq. (1) was also considered by using a tailored fitting func-
tion in the simulation according to Eq. (1) that includes con-
https://doi.org/10.5194/mr-2-673-2021 Magn. Reson., 2, 673–687, 2021684 S. Künstner et al.: Rapid-scan electron paramagnetic resonance using an EPR-on-a-Chip sensor Appendix F: Determination of sample volume and mass The sample volume was approximated using multiple pho- tographs of the sample as shown in Fig. 1b while varying the light present to differentiate shadows from the sample material. To calculate the sample volume, a cuboid was as- sumed. The planar dimensions of the cuboid were deter- mined from the shape of the sample in the photograph, while height was determined using its shadow on the chip. In this way, the sample volume might be overestimated. The den- sity of the BDPA–benzene complex is 1.220 g cm−3 (Azuma et al., 1994). From the volume and the density, the sample mass and the number of spins were calculated. Magn. Reson., 2, 673–687, 2021 https://doi.org/10.5194/mr-2-673-2021
S. Künstner et al.: Rapid-scan electron paramagnetic resonance using an EPR-on-a-Chip sensor                                            685

Code availability. All programming used for data analysis, simu-         Azuma, N., Ozawa, T., and Yamauchi, J.: Molecular and Crystal
lation, and processing is available from the authors upon request.          Structures of Complexes of Stable Free Radical BDPA with Ben-
                                                                            zene and Acetone, Bulletin of the Chemical Society of Japan, 67,
                                                                            31–38, https://doi.org/10.1246/bcsj.67.31, 1994.
Data availability. The data that support the findings of this study      Brodsky, M. H. and Title, R. S.: Electron Spin Resonance in Amor-
are available from the corresponding authors upon request.                  phous Silicon, Germanium, and Silicon Carbide, Phys. Rev.
                                                                            Lett., 23, 581–585, https://doi.org/10.1103/PhysRevLett.23.581,
                                                                            1969.
Author contributions. SK, BN, AS, JA and KL defined the goals            Chu, A., Schlecker, B., Handwerker, J., Künstner, S., Ort-
of the research and designed the experiments. SK performed all              manns, M., Lips, K., and Anders, J.: VCO-based ESR-on-a-
EPR experiments, data processing, and simulations. AC and JA de-            chip as a tool for low-cost, high-sensitivity food quality con-
signed the EPR-on-a-Chip spectrometer. SK, JEM, BN and JA eval-             trol, in: 2017 IEEE Biomedical Circuits and Systems Con-
uated the results of the experiments and wrote the manuscript. KPD          ference (BioCAS), 19–21 October 2017 , Torino, Italy, 1–4,
advised the authors at all stages of the research and authoring of the      https://doi.org/10.1109/BIOCAS.2017.8325172, 2017.
manuscript. The paper was revised by all the authors.                    Chu, A., Schlecker, B., Lips, K., Ortmanns, M., and An-
                                                                            ders, J.: An 8-channel 13 GHz ESR-on-a-Chip injection-locked
                                                                            VCO-array achieving 200 µM-concentration sensitivity, in: 2018
                                                                            IEEE International Solid-State Circuits Conference (ISSCC),
Competing interests. The contact author has declared that nei-
                                                                            11–15 February 2018, San Francisco, CA, USA, 354–356,
ther they nor their co-authors have any competing interests.
                                                                            https://doi.org/10.1109/ISSCC.2018.8310330, 2018.
                                                                         Chu, A., Schlecker, B., Kern, M., Goodsell, J. L., Angerhofer, A.,
                                                                            Lips, K., and Anders, J.: On the modeling of amplitude-sensitive
Disclaimer. Publisher’s note: Copernicus Publications remains               ESR detection using VCO-based ESR-on-a-chip detectors,
neutral with regard to jurisdictional claims in published maps and          Magn. Reson. Discuss. [preprint], https://doi.org/10.5194/mr-
institutional affiliations.                                                 2021-42, in review, 2021.
                                                                         Eaton, G. R. and Eaton, S. S.: Rapid-Scan Electron Paramag-
                                                                            netic Resonance, in: eMagRes, edited by: Harris, R. K. and
Acknowledgements. We are grateful to Jannik Möser and Jason                 Wasylishen, R., John Wiley & Sons, Ltd, Chichester, UK, 1529–
Sidabras for experimental support and for helpful discussions. This         1542,       https://doi.org/10.1002/9780470034590.emrstm1522,
work has been supported by the Bundesministerium für Bildung                2016.
und Forschung under contract number 01186916/1 (EPRoC) and               Eaton, G. R., Eaton, S. S., Barr, D. P., and Weber, R.
by the HEMF (Helmholtz Energy Materials Foundry) infrastructure             T.: Quantitative EPR, Springer Vienna, Vienna, Austria,
funded by the Helmholtz Association (HGF). Boris Naydenov ac-               https://doi.org/10.1007/978-3-211-92948-3, 2010.
knowledges the financial support from the Deutsche Forschungsge-         Goldsborough, J. P., Mandel, M., and Pake, G. E.: Influence of
meinschaft (project numbers 410866378 and 410866565).                       Exchange Interaction on Paramagnetic Relaxation Times, Phys.
                                                                            Rev. Lett., 4, 13–15, https://doi.org/10.1103/PhysRevLett.4.13,
                                                                            1960.
Financial support. This research has been supported by the Bun-          Gualco, G., Anders, J., Sienkiewicz, A., Alberti, S., Forró,
desministerium für Bildung und Forschung (grant no. 01186916/1),            L., and Boero, G.: Cryogenic single-chip electron spin
the Helmholtz-Gemeinschaft Deutscher Forschungszentren                      resonance detector, J. Magn. Reson., 247, 96–103,
(HGF, Helmholtz Energy Materials Foundry), and the Deutsche                 https://doi.org/10.1016/j.jmr.2014.08.013, 2014.
Forschungsgemeinschaft (grant nos. 410866378 and 410866565).             Handwerker, J., Schlecker, B., Wachter, U., Radermacher, P., Ort-
                                                                            manns, M., and Anders, J.: A 14 GHz battery-operated point-
                                                                            of-care ESR spectrometer based on a 0.13 µm CMOS ASIC,
Review statement. This paper was edited by Daniella Goldfarb                in: 2016 IEEE International Solid-State Circuits Conference
and reviewed by two anonymous referees.                                     (ISSCC), 31 January–4 February 2016, San Francisco, CA, USA,
                                                                            476–477, https://doi.org/10.1109/ISSCC.2016.7418114, 2016.
                                                                         Hyde, J. S., Strangeway, R. A., Camenisch, T. G., Ratke, J. J., and
                                                                            Froncisz, W.: W-band frequency-swept EPR, J. Magn. Reson.,
References                                                                  205, 93–101, https://doi.org/10.1016/j.jmr.2010.04.005, 2010.
                                                                         Joshi, J. P., Eaton, G. R., and Eaton, S. S.: Impact of resonator on
Anders, J.: Fully-integrated CMOS Probes for Magnetic Reso-                 direct-detected rapid-scan EPR at 9.8 GHz, Appl. Magn. Reson.,
  nance Applications, École polytechnique fédérale de Lausanne,             28, 239–249, https://doi.org/10.1007/BF03166759, 2005a.
  Lausanne, Switzerland, https://doi.org/10.5075/EPFL-THESIS-            Joshi, J. P., Ballard, J. R., Rinard, G. A., Quine, R. W.,
  5154, 2011.                                                               Eaton, S. S., and Eaton, G. R.: Rapid-scan EPR with
Anders, J. and Lips, K.: MR to go, J. Magn. Reson., 306, 118–123,           triangular scans and fourier deconvolution to recover
  https://doi.org/10.1016/j.jmr.2019.07.007, 2019.                          the slow-scan spectrum, J. Magn. Reson., 175, 44–51,
Anders, J., Angerhofer, A., and Boero, G.: K-band single-chip               https://doi.org/10.1016/j.jmr.2005.03.013, 2005b.
  electron spin resonance detector, J. Magn. Reson., 217, 19–26,
  https://doi.org/10.1016/j.jmr.2012.02.003, 2012.

https://doi.org/10.5194/mr-2-673-2021                                                                 Magn. Reson., 2, 673–687, 2021
You can also read