Menopause impacts human brain structure, connectivity, energy metabolism, and amyloid beta deposition - Nature
←
→
Page content transcription
If your browser does not render page correctly, please read the page content below
www.nature.com/scientificreports
OPEN Menopause impacts human brain
structure, connectivity, energy
metabolism, and amyloid‑beta
deposition
Lisa Mosconi1,2,3*, Valentina Berti4, Jonathan Dyke2, Eva Schelbaum1, Steven Jett1,
Lacey Loughlin1, Grace Jang1, Aneela Rahman1, Hollie Hristov1, Silky Pahlajani1,2,
Randolph Andrews5, Dawn Matthews5, Orli Etingin6, Christine Ganzer7, Mony de Leon2,
Richard Isaacson1 & Roberta Diaz Brinton8
All women undergo the menopause transition (MT), a neuro-endocrinological process that impacts
aging trajectories of multiple organ systems including brain. The MT occurs over time and is
characterized by clinically defined stages with specific neurological symptoms. Yet, little is known
of how this process impacts the human brain. This multi-modality neuroimaging study indicates
substantial differences in brain structure, connectivity, and energy metabolism across MT stages
(pre-menopause, peri-menopause, and post-menopause). These effects involved brain regions
subserving higher-order cognitive processes and were specific to menopausal endocrine aging rather
than chronological aging, as determined by comparison to age-matched males. Brain biomarkers
largely stabilized post-menopause, and gray matter volume (GMV) recovered in key brain regions for
cognitive aging. Notably, GMV recovery and in vivo brain mitochondria ATP production correlated
with preservation of cognitive performance post-menopause, suggesting adaptive compensatory
processes. In parallel to the adaptive process, amyloid-β deposition was more pronounced in peri-
menopausal and post-menopausal women carrying apolipoprotein E-4 (APOE-4) genotype, the major
genetic risk factor for late-onset Alzheimer’s disease, relative to genotype-matched males. These data
show that human menopause is a dynamic neurological transition that significantly impacts brain
structure, connectivity, and metabolic profile during midlife endocrine aging of the female brain.
The menopause transition (MT) is a midlife neuroendocrine aging process specific to females that culminates
with reproductive senescence1. All women undergo menopause in their lifetime either through the natural
endocrine aging process or through medical intervention. The MT occurs in stages characterized by unique
endocrine properties that impact aging trajectories of multiple organ systems including b rain1. While menopause
is a reproductive transition state, it is also a neurological transition1, as evidence by the fact that many menopausal
symptoms are neurological in nature, such as hot flashes, disturbed sleep, mood changes, and forgetfulness2.
The MT is orchestrated by gonadal sex steroid hormones, which are known regulators of both reproductive
and neural f unction1. During the MT, sex hormones, especially 17β-estradiol, substantially decline in body and
brain3. Molecular, cellular and systems biology characterization of the MT in brain demonstrate a broad impact of
estrogen declines on neural processes via genomic and non-genomic a ctions1, including changes in spinogenesis
and synaptogenesis, neuronal number, morphology, glucose metabolic rates, and gene expression1,3. Additionally,
estrogen depletion has been linked to amyloid-beta (Aβ) plaque accumulation, a hallmark of Alzheimer’s disease
(AD), in female a nimals4,5. However, little is known of how the MT impacts the human brain.
1
Department of Neurology, Weill Cornell Medicine, 420 East 70th, LH‑404, New York, NY 10021, USA. 2Department
of Radiology, Weill Cornell Medical College, New York, NY, USA. 3Department of Psychiatry, New York University
School of Medicine, New York, NY, USA. 4Department of Nuclear Medicine, University of Florence, Florence,
Italy. 5ADM Diagnostics, Chicago, IL, USA. 6Department of Internal Medicine, Weill Cornell Medical College, New
York, NY, USA. 7Hunter‑Bellevue School of Nursing, Hunter College, CUNY, New York, NY, USA. 8Departments of
Pharmacology and Neurology, College of Medicine, University of Arizona, Tucson, AZ, USA. *email: lim2035@
med.cornell.edu
Scientific Reports | (2021) 11:10867 | https://doi.org/10.1038/s41598-021-90084-y 1
Vol.:(0123456789)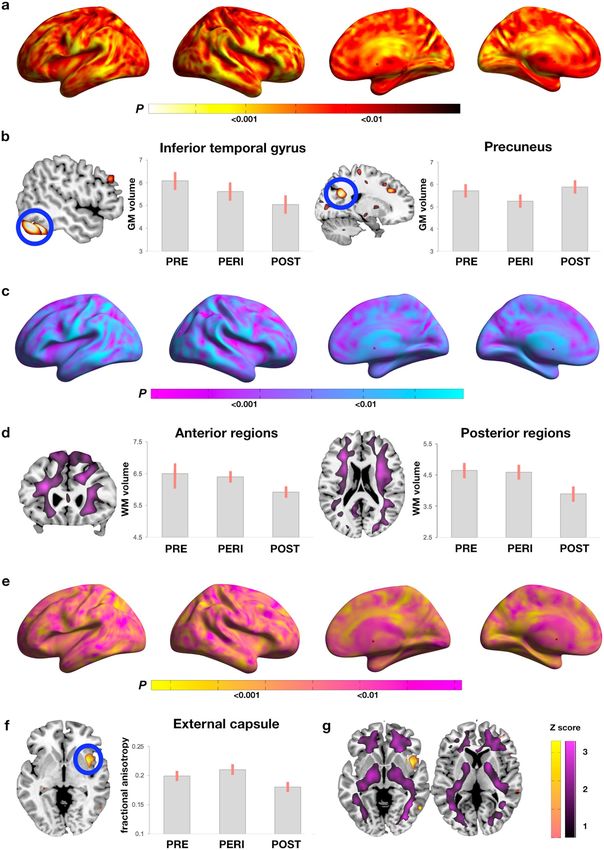
www.nature.com/scientificreports/
Pre-menopausal group Peri-menopausal group Post-menopausal group
Clinical and demographic measures
N 30 57 74
Age, years, range 44 (4), 40–53 50 (4), 41–60 57 (4)*, 46–65
Education, years 17 (3) 17 (2) 17 (2)
Ethnicity, % White 80 77 89
MMSE score 29 (1) 29 (1) 29 (1)
APOE ε4 carriers, % positive 43 33 48
Hysterectomy status, % positive 0 6 19
Menopausal hormonal therapy
% Current users 0 13 32
% Past users 0 2 4
Cognitive measures
Global cognition, mean (SE) − 0.11 (0.17) − 0.02 (0.09) 0.06 (0.11)
Adjusted by APOE-4 status − 0.09 (0.17) − 0.03 (0.09) 0.06 (0.11)
Memory, mean (SE) 0.05 (0.20) 0.06 (0.11) 0.02 (0.13)
Adjusted by APOE-4 status 0.07 (0.21) 0.04 (0.11) 0.02 (0.13)
Table 1. Participants’ characteristics by menopause status. Clinical measures are means (SD), unless otherwise
specified. Cognitive measures are age and education-adjusted means (SE). *Different from PRE, p < 0.05.
Brain imaging analyses conducted in post-menopausal women first reported declines in glucose metabolism
and gray matter volume (GMV), which were modulated by menopause hormone treatment (HT)6,7, indicat-
ing that neuro-endocrine processes retain dynamic properties well into menopause. However, data in women
undergoing the MT are scarce. We previously reported that, among those with genetic risk factors for AD such
as apolipoprotein epsilon-4 genotype (APOE-4)8, the MT was associated with lower GMV, hypometabolism,
and emerging Aβ d eposition9–11. It is unknown whether similar changes occur in women without genetic risks
for AD, or whether the MT impacts other structural, bioenergetic and cognitive indicators.
Herein, we conducted a multi-modality neuroimaging study of women at different MT stages (pre-, peri-,
and post-menopause) to investigate MT’s effects on brain’s gray (GM) and white matter (WM) structure, con-
nectivity, energy metabolism, and Aβ deposition. Results indicate that the MT significantly impacts all these
brain biomarkers in regions involved in higher-order cognitive functions. Effects were independent of age and
HT use, and were specific to menopausal endocrine aging rather than chronological aging, as determined by
comparison with age-matched males. Notably, cognition was preserved post-menopause, which correlated with
GMV recovery and brain adenosine triphosphate (ATP) production, highlighting potential compensatory mecha-
nisms. Finally, Aβ deposition was greater in post-menopausal and peri-menopausal women carrying APOE-4
genotype, indicating APOE-4 specific effects on AD risk with onset in the peri-menopause.
Results
Participants. A total of 182 cognitively intact 40–65 year-old women were enrolled. Nine participants were
excluded due to neuropathological conditions encountered in the MR images (n = 7; e.g. neoplastic condition or
aneurysm), or due to artifacts (n = 2). Three participants with incomplete clinical data and 9 with unclear meno-
pause status were also excluded. Our final sample consisted of 161 women, including 30 pre-menopausal (PRE),
57 peri-menopausal (PERI), and 74 post-menopausal (POST) participants.
Participants’ characteristics are found in Table 1. There were no group differences in demographic and clinical
measures except for an age difference between PRE and POST groups. As described in “Methods”, our procedures
to address age effects included (i) adding age as a confounder in all analyses, and (ii) comparing each MT group
to an age-matched male group: consisting of 30 males age-matched to the PRE group ( MALEPRE), 50 age-matched
to the PERI group ( MALEPERI), and 45 age-matched to the POST group ( MALEPOST) (Supplementary Table S1).
Forty-two percent of participants were APOE-4 positive, with comparable distributions between groups.
Biomarker results. We examined a panel of brain biomarkers examining:
• Structure: GMV and white matter volume (WMV) via Magnetic Resonance Imaging (MRI), and fractional
anisotropy (FA, an index of WM integrity and structural c onnectivity12) via MRI-Diffusion Tensor Imaging
(DTI);
• Energy metabolism: glucose metabolism (CMRglc) via 18F-fluorodeoxy-2-glucose (FDG) Positron Emission
tomography (PET), cerebral blood flow (CBF) via Arterial Spin Labeling (ASL), and ATP production via
31
Phosphorus-Magnetic Resonance Spectroscopy (31P-MRS);
• Aβ deposition via 11C-Pittsburgh compound B (PiB) PET.
Scientific Reports | (2021) 11:10867 | https://doi.org/10.1038/s41598-021-90084-y 2
Vol:.(1234567890)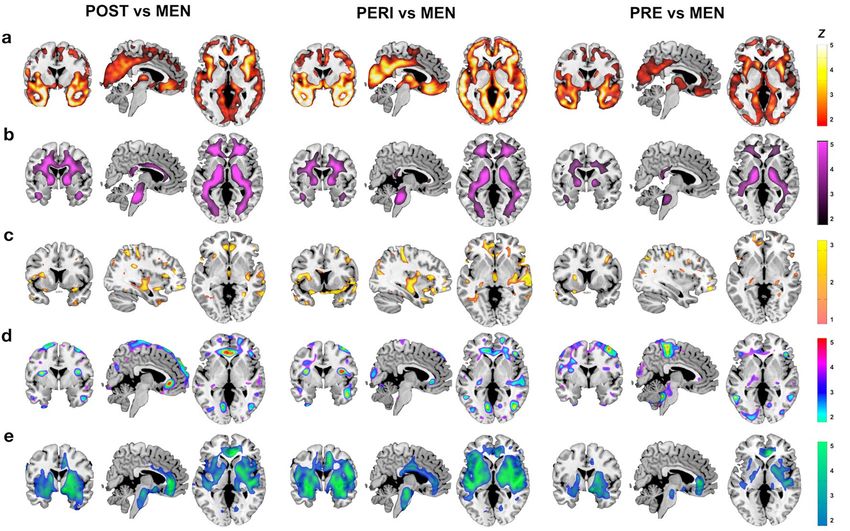
www.nature.com/scientificreports/
Unless otherwise specified, all below voxel-based results are significant at p < 0.05, cluster-level corrected for
family-wise type error (FWE), adjusted for age, APOE-4 status, and modality-specific confounders.
Biomarker differences between MT groups. Structural biomarkers. GMV. MT stage effects were
observed in inferior temporal gyrus, precuneus, and fusiform gyrus of the right hemisphere (Fig. 1a). On post-
hoc analysis, the temporal cluster reflected lower GMV in the POST group compared to the PRE group, while
the precuneus and fusiform clusters reflected lower GMV in the PERI group compared to the POST group
(Fig. 1b, and Supplementary Table S2).
WMV. MT stage effects were observed in anterior and posterior corona radiata, which reflected lower WMV
in POST versus PRE and PERI groups (Fig. 1c, d, and Supplementary Table S2).
FA. The only cluster showing MT stage effects that survived correction for multiple comparisons was the right
external capsule. In this cluster, the POST group had lower FA than PERI (cluster extent 71 voxels, x, y, z = 33,
− 9, − 6, Z = 3.81, p = 0.017; Fig. 1e, f). There was no anatomical overlap between FA and WMV maps, as shown
in Fig. 1g.
Metabolic biomarkers. CMRglc. MT stage effects were observed in supramarginal gyri, middle and inferior
temporal gyri (Fig. 2a). On post-hoc analysis, all clusters reflected lower CMRglc in the POST group compared
to the PRE and PERI groups, and lower CMRglc in right middle temporal gyrus of the PERI compared to the
PRE group (Fig. 2b, and Supplementary Table S3).
CBF. MT stage effects were observed in supramarginal gyrus, middle and superior temporal gyrus, superior
and inferior frontal gyrus of both hemispheres, which on post-hoc analysis, reflected higher CBF in POST versus
PERI (Fig. 2c, d, and Supplementary Table S3).
Figure 2e displays the regional overlap of CMRglc and CBF effects.
ATP production. We examined regional ATP to phosphocreatine (PCr) ratios in parieto-temporal regions
showing MT-stage effects on CMRglc and CBF (Table 2). Multivariate general linear models (mGLM) showed
higher ATP/PCr in temporal regions (p’s ≤ 0.047) and borderline higher ATP/PCr in parietal regions (p < 0.12) of
POST versus PRE groups. Results remained significant adjusting by APOE-4 status (Table 2).
Amyloid‑β load. Results are reported in Table 2. Adjusting by age and cerebellar uptake, there were no signifi-
cant differences in PiB uptake between MT groups. However, adding APOE-4 status as a covariate enhanced
group differences, resulting in higher PiB uptake in POST versus PRE (27%, p = 0.006), and PERI versus PRE
groups (18%, p = 0.056). PiB differences between PERI and PRE groups were more pronounced among APOE-4
carriers (Table 2).
Comparisons to age‑matched males. To determine whether MT-stage effects on biomarkers were
specific for menopause endocrine aging versus chronological aging, we compared each MT group to an age-
matched male group. We first tested for group biomarker differences within the brain regions showing the MT
group-specific effects reported above. We then tested for group differences in the entire search volume.
Structural biomarkers. GMV. Results are presented in Fig. 3a, and Supplementary Table S4. Examination
of brain regions showing MT-stage effects indicated lower GMV in inferior temporal gyrus of the POST group
compared to MALEPOST, and lower GMV in precuneus and fusiform gyrus of the PERI group compared to
MALEPERI. Across the entire search volume, both POST and PERI groups exhibited additional widespread areas
of lower GMV compared to males, involving middle and medial temporal (MTL) regions, superior, middle, and
orbital frontal gyrus, anterior cingulate (ACC), insula, and putamen. The PRE group showed lower GMV versus
MALEPRE in MTL, frontal gyrus, putamen, and inferior and middle temporal cortex.
WMV. Results are presented in Fig. 3b, and Supplementary Table S5. In examination of brain regions exhibit-
ing MT-stage effects, lower WMV in corona radiata of the POST group compared to M ALEPOST was evident. In
the entire search volume, the POST group exhibited additional areas of lower WMV in several tracts including
superior longitudinal fasciculus (SLF), posterior thalamic radiation, and cortico-spinal tracts. The PERI group
exhibited a similar pattern of lower WMV compared to MALEPERI, and the PRE group showed lower WMV in
internal capsule compared to MALEPRE.
FA. Results are presented in Fig. 3c, and Supplementary Table S6. Examination of brain regions showing MT-
stage effects revealed higher FA in corona radiata and fornix in the POST group compared to M ALEPOST. There
were no other regions showing FA differences for POST versus MALEPOST. The PERI group exhibited higher FA
in corona radiata, fornix, external capsule and uncinate fasciculus; and lower FA in SLF and posterior thalamic
radiation compared to MALEPERI. The PRE group showed higher FA in corona radiata, and lower FA in SLF,
compared to MALEPRE.
Scientific Reports | (2021) 11:10867 | https://doi.org/10.1038/s41598-021-90084-y 3
Vol.:(0123456789)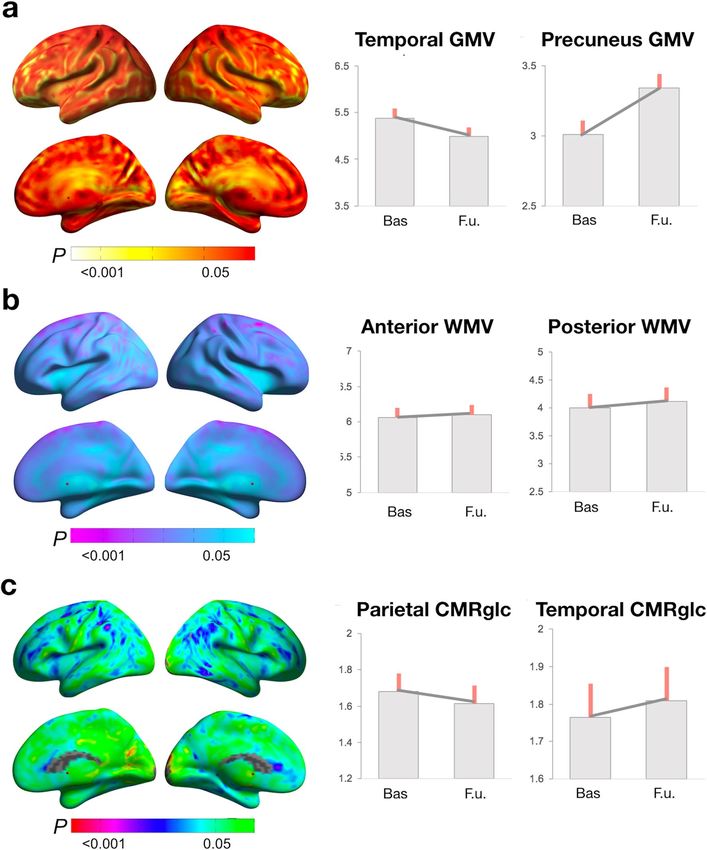
www.nature.com/scientificreports/

                                            Figure 1.  Structural biomarker differences between menopausal groups. (a) Surface maps of regional GMV differences. (b) MRI slice
                                            overlays and plots representing GMV in temporal and precuneus clusters. (c) Surface maps of regional WMV differences. (d) MRI
                                            slice overlays and plots representing WMV in anterior and posterior areas averaged between hemispheres. (e) Surface maps of regional
                                            FA differences. (f) MRI slice overlays and plots representing FA in external capsule. (g) Slice overlays depicting lack of overlap between
                                            WMV (purple) and FA (yellow) effects. In (a, c, e), SPMs are represented on modality-specific color-coded scales with corresponding
                                            P values. In (g), Z scores are reported in lieu of p values to enable multi-modality comparison. In (b, d), values are mean (SE). Results
                                            are adjusted by age and total intracranial volume. Abbreviations FA, fractional anisotropy; GMV, gray matter volume; PERI, peri-
                                            menopause; POST, post-menopause; PRE, pre-menopause; SPMs, statistical parametric maps; WMV, white matter volume.

          Scientific Reports |   (2021) 11:10867 |                   https://doi.org/10.1038/s41598-021-90084-y                                                                     4

Vol:.(1234567890)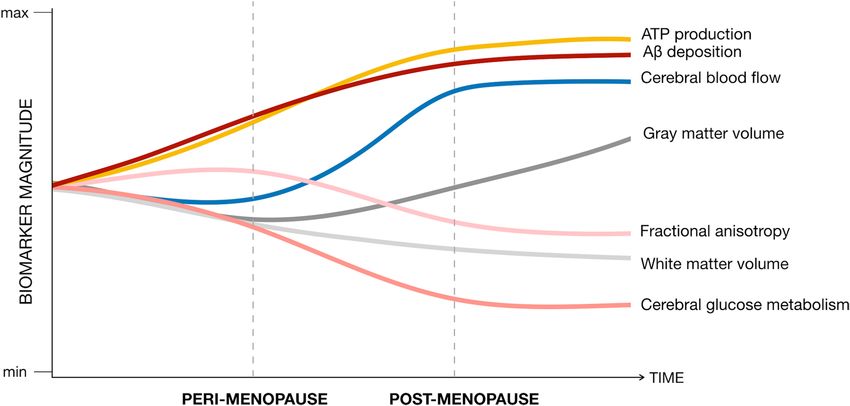
www.nature.com/scientificreports/

                                  Figure 2.  Metabolic biomarker differences between menopausal groups. (a) Surface maps of regional CMRglc
                                  differences. (b) MRI slice overlays and plots representing CMRglc in temporal and parietal regions. (c) Surface
                                  maps of regional CBF differences. (d) MRI slice overlays and plots representing CBF extracted in temporal
                                  and parietal clusters. (e) Slice overlays depicting the overlap between CMRglc (green to red scale) and CBF
                                  (blue to green scale) effects. (f) In (a, c), SPMs are represented on modality-specific color-coded scales with
                                  corresponding p values. In (e), Z scores are reported to enable multi-modality comparisons. In (b, d), values
                                  are mean (SE). Results are adjusted by age and global activity. Abbreviations CBF, cerebral blood flow; CMRglc,
                                  cerebral glucose metabolism; PERI, peri-menopause; POST, post-menopause; PRE, pre-menopause; SPMs,
                                  statistical parametric maps.

Scientific Reports |   (2021) 11:10867 |              https://doi.org/10.1038/s41598-021-90084-y                                                    5

                                                                                                                                            Vol.:(0123456789)
www.nature.com/scientificreports/
PRE PERI POST
ATP/PCr measures
Superior temporal gyrus 1.11 (0.05) 1.18 (0.03) 1.26 (0.03)*
Adjusted by APOE status 1.14 (0.04) 1.18 (0.03) 1.24 (0.02)*
Middle temporal gyrus 1.09 (0.04) 1.13 (0.03) 1.20 (0.02)*
Adjusted by APOE status 1.10 (0.03) 1.14 (0.02) 1.19 (0.02)*
Inferior temporal gyrus 1.07 (0.04) 1.11 (0.02) 1.13 (0.02)*
Adjusted by APOE status 1.07 (0.03) 1.10 (0.02) 1.14 (0.02)*
Inferior parietal lobule 0.77 (0.06) 0.76 (0.05) 0.83 (0.04)
Adjusted by APOE status 0.78 (0.04) 0.75 (0.03) 0.83 (0.03)*
Amyloid-β load
AD-mask SUVR 1.01 (0.12) 1.20 (0.06) 1.27 (0.07)
Adjusted by APOE status 1.00 (0.09) 1.21 (0.06) 1.29 (0.06)*
AD-mask SUVR by APOE-4 status
APOE-4− 0.94 (0.12) 1.14 (0.07) 1.32 (0.07)*
APOE-4+ 1.07 (0.12) 1.32 (0.11)* 1.25 (0.08)*
Table 2. Region-of-Interest (ROI) measures by menopausal stage group. APOE-4−, APOE-4 non-carriers;
APOE-4+, APOE-4 carriers; PERI, peri-menopausal group; POST, post-menopausal group; PRE, pre-
menopausal group; SUVR, standardized uptake value ratio to cerebellar gray matter PiB uptake. Values are
means (SE), unless otherwise specified. *Different from PRE, p < 0.05.
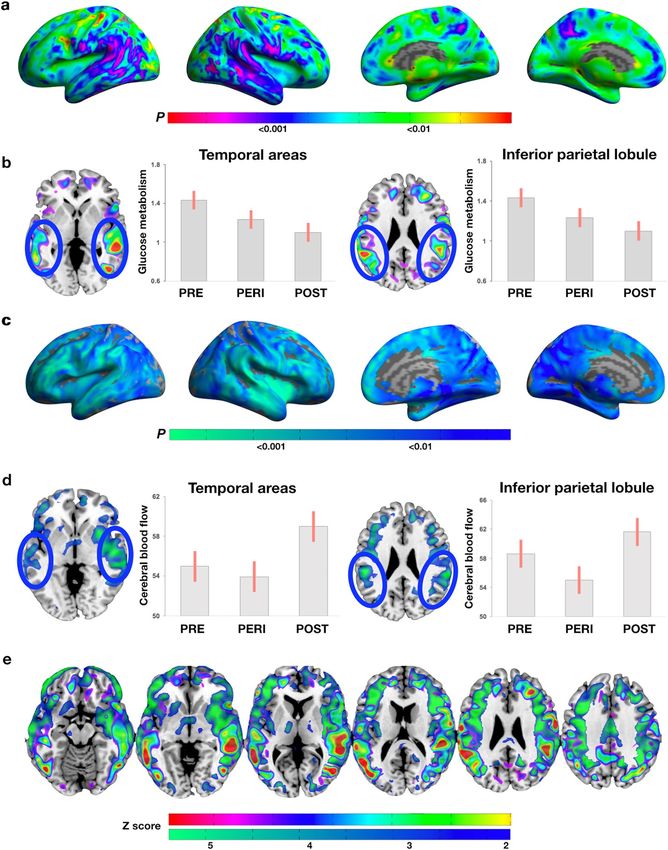
Figure 3. MRI slice overlays displaying biomarker differences between each MT group and males in the
corresponding age ranges: (a) Lower GMV in (left) POST, (middle) PERI, and (right) PRE groups versus males.
(b) Lower WMV in (left) POST, (middle) PERI, and (right) PRE groups versus males. (c) Higher FA in (left)
POST, and (middle) PERI versus males; (right) no differences between PRE and males. (d) Lower CMRglc in
(left) POST, (middle) PERI, and (right) PRE groups versus males. (e) Higher CBF in (left) POST, (middle) PERI,
and (right) PRE groups versus males. (f) SPMs are represented on modality-specific color-coded scales with
corresponding Z scores to enable multi-modality comparisons. Abbreviations See legend to Figs. 1 and 2.
Metabolic biomarkers. CMRglc. Results are presented in Fig. 3d, and Supplementary Table S7. Examination
of brain regions showing MT-stage effects showed lower CMRglc in temporo-parietal areas of the POST group
compared to MALEPOST. In the entire search volume, the POST group exhibited additional areas of hypometabo-
lism in superior and middle frontal cortex compared to males. The PERI group showed lower CMRglc in frontal
Scientific Reports | (2021) 11:10867 | https://doi.org/10.1038/s41598-021-90084-y 6
Vol:.(1234567890)www.nature.com/scientificreports/
PRE MALEPRE PERI MALEPERI POST MALEPOST
ATP/PCr measures
Anterior cingulate cortex 1.06 (0.07) 1.11 (0.07) 1.10 (0.04) 1.12 (0.05) 1.12 (0.04) 1.12 (0.05)
Adjusted by APOE-4 status 1.05 (0.07) 1.12 (0.07) 1.11 (0.04) 1.10 (0.05) 1.11 (0.04) 1.13 (0.05)
Insula 1.21 (0.06) 1.29 (0.07) 1.24 (0.04) 1.24 (0.04) 1.26 (0.03)* 1.21 (0.05)
Adjusted by APOE-4 status 1.20 (0.06) 1.30 (0.06) 1.24 (0.04) 1.23 (0.04) 1.27 (0.03)* 1.22 (0.05)
Inferior parietal lobule 0.78 (0.07) 0.85 (0.08) 0.76 (0.04) 0.84 (0.04) 0.83 (0.03) 0.86 (0.04)
Adjusted by APOE-4 status 0.77 (0.08) 0.86 (0.08) 0.76 (0.04) 0.84 (0.04) 0.83 (0.03) 0.86 (0.04)
Middle temporal gyrus 1.10 (0.04) 1.17 (0.05) 1.15 (0.02) 1.12 (0.3) 1.19 (0.02)* 1.10 (0.03)
Adjusted by APOE-4 status 1.10 (0.04) 1.18 (0.04) 1.15 (0.02) 1.12 (0.3) 1.19 (0.02)* 1.10 (0.03)
Medial temporal lobe 1.16 (0.05) 1.24 (0.05) 1.22 (0.03) 1.20 (0.04) 1.21 (0.03) 1.19 (0.04)
Adjusted by APOE-4 status 1.15 (0.05) 1.26 (0.05) 1.22 (0.03) 1.20 (0.04) 1.22 (0.03) 1.19 (0.04)
Medial frontal gyrus 1.05 (0.06) 0.99 (0.06) 1.04 (0.03) 0.98 (0.04) 1.07 (0.03)* 0.95 (0.04)
Adjusted by APOE-4 status 1.04 (0.06) 1.01 (0.06) 1.05 (0.03) 0.97 (0.04) 1.07 (0.03)* 0.96 (0.04)
Superior frontal gyrus 0.95 (0.05) 0.86 (0.06) 0.94 (0.03)* 0.84 (0.03) 0.96 (0.03)* 0.83 (0.04)
Adjusted by APOE-4 status 0.94 (0.05) 0.87 (0.05) 0.95 (0.03)* 0.84 (0.04) 0.96 (0.03)* 0.84 (0.04)
Amyloid-β load
AD-mask SUVR 1.01 (0.05) 0.92 (0.05) 1.20 (0.05)* 0.92 (0.06) 1.29 (0.05)* 0.93 (0.06)
Adjusted by APOE-4 status 1.01 (0.05) 0.92 (0.05) 1.21 (0.05)* 0.91 (0.06) 1.29 (0.05)* 0.93 (0.06)
AD-mask SUVR by APOE-4 status
APOE-4− 0.94 (0.07) 0.86 (0.07) 1.14 (0.06) 0.88 (0.08) 1.32 (0.07)* 0.93 (0.09)
APOE-4+ 1.07 (0.07) 0.96 (0.08) 1.32 (0.09)* 0.93 (0.10) 1.25 (0.05)* 0.95 (0.10)
Table 3. Regions-of-interest (ROI) measures by age-matched male group comparisons. MALEPRE, males
age-matched to PRE; MALEPERI, males age-matched to PERI; MALEPOST, males age-matched to POST; PERI,
peri-menopausal group; POST, post-menopausal group; PRE, pre-menopausal group. Values are means (SE).
*Different from age-matched males, p < 0.05.
cortex and insula versus MALEPERI, and the PRE group showed lower CMRglc in left supramarginal gyrus versus
MALEPRE.
CBF. Results are presented in Fig. 3e, and Supplementary Table S8. Examination of brain regions exhibiting
MT-stage effects showed elevated CBF in frontal regions of POST versus MALEPOST. In the entire search volume,
the POST group also exhibited lower CBF in ACC, MTL, and basal ganglia compared to males. Likewise, PERI
and PRE groups exhibited areas of higher and lower CBF compared to males, chiefly lower CBF in ACC, medial
and superior temporal gyrus, and basal ganglia, and higher CBF in parietal lobe.
ATP production. We investigated ATP/PCr using two separate mGLMs: model 1 included regions with
higher CBF in POST versus MALEPOST (ACC, insula and temporo-parietal regions); model 2 included regions
with lower CMRglc and CBF in POST versus M ALEPOST (frontal areas). Results are presented in Table 3. With
and without adjustment by APOE-4 status, the POST group had higher ATP/PCr than M ALEPOST in model 1
(p ≤ 0.003) and borderline higher ATP/PCr in model 2 (p ≤ 0.082), and the PERI group had higher ATP/PCr than
MALEPERI in model 2 (p ≤ 0.049). There were no differences between PRE and MALEPRE.
Amyloid‑β load. POST and PERI groups exhibited higher PiB uptake in AD-mask than M ALEPOST and
MALEPERI, respectively (p’s ≤ 0.001), while no differences were found between PRE and MALEPRE (Table 3).
These effects remained unchanged including APOE-4 status as a covariate, which enhanced differences between
PERI and MALEPERI APOE-4 carriers (p = 0.020). PiB differences between PERI and M ALEPERI were more pro-
nounced among APOE-4 carriers (Table 3).
Biomarker changes post‑menopause. To examine whether biomarker effects were persistent post-
menopause, and to test their specificity for menopause endocrine aging versus chronological aging, we per-
formed 2-year follow-up volumetric MRI and FDG-PET scans in 17 POST and 12 M ALEPOST (Supplementary
Table S9). We first tested for changes in biomarkers within the brain regions showing POST-specific effects, and
secondly, in the entire search volume.
Examination of brain regions exhibiting POST-stage effects on GMV indicated no GMV changes in inferior
temporal and fusiform gyri, and GMV increases in the precuneus of the POST group (Fig. 4a, d; and Supplemen-
tary Table S10). There were no GMV changes in precuneus of the M ALEPOST group, suggesting POST-specific
GMV recovery. In the entire search volume, both POST and M ALEPOST groups showed GMV declines in right
frontal gyrus, which did not differ between the groups (Supplementary Table S10).
No significant WMV changes were observed in the POST group, or in comparison to M ALEPOST (Fig. 4b, d).
Scientific Reports | (2021) 11:10867 | https://doi.org/10.1038/s41598-021-90084-y 7
Vol.:(0123456789)www.nature.com/scientificreports/
Figure 4. Longitudinal biomarker changes post-menopause. (a) Surface maps of GMV change. (b) Surface
maps of WMV change. (c) Surface maps of CMRglc change. (d) Plots representing mean (SE) biomarker levels
at baseline (POST) versus 2-year follow-up (POST + 2) in the subset of POST participants with longitudinal
brain scans. Surface maps are represented on modality-specific color-coded scales with corresponding p values.
See legends to Figs. 1 and 2.
Examination of temporo-parietal regions that were hypometabolic in the POST group versus PRE and PERI
groups showed CMRglc declines in left inferior parietal lobule and not in other areas of the POST group (Fig. 4c,
d; Supplementary Table S11). Parietal CMRglc declines were significant compared to M ALEPOST. In the entire
search volume, there were no further longitudinal group differences.
Summary of biomarker findings. The main biomarker findings of this study are summarized in Fig. 5.
Sensitivity analysis. We performed a sensitivity analysis to test for effects of HT use and hysterectomy
status on biomarker data. Results are presented in Supplementary Appendix. Briefly, including HT use and
Scientific Reports | (2021) 11:10867 | https://doi.org/10.1038/s41598-021-90084-y 8
Vol:.(1234567890)www.nature.com/scientificreports/
Figure 5. Summary of brain biomarker effects during the menopause transition. This figure summarizes the
main results of the study by mapping estimated brain biomarker outcomes from pre-menopausal to peri-
menopausal and post-menopausal stages. Biomarker measures extracted from representative clusters for each
modality are displayed on a standardized scale and normalized to pre-menopausal levels to enable examination
of the magnitude of biomarker effects by menopausal stage and across modalities.
hysterectomy status as covariates left MT effects on brain biomarkers substantially unchanged. As compared to
HT users, non-users exhibited lower GMV in inferior temporal gyrus, and lower CMRglc in parietal regions,
independent of hysterectomy status. Restricting analysis to HT non-users confirmed results from the entire
cohort, with two exceptions: CBF differences between MT groups were more pronounced among non-users, and
FA differences between PERI and POST groups did not reach significance.
Associations between biomarkers and cognition. There were no significant differences in cognitive
scores between MT groups (Table 1), or between each MT group and the corresponding age-matched male
group (Supplementary Table S12). As shown in Supplementary Table S13, in the POST group, precuneus GMV
was positively associated with memory scores at cross-section (r = 0.311, p = 0.007) and longitudinally (r = 0.521,
p = 0.032). ATP/PCr in temporo-parietal regions was positively associated with global cognition (Rho = 0.323,
p = 0.027). There were no significant associations between cognitive scores and regional biomarkers among PRE
and PERI groups (Supplementary Table S13).
Discussion
Outcomes of this multi-modality neuroimaging analyses demonstrate that MT stage has pronounced effects
on human brain’s structure, connectivity, and energy metabolism, and provide a neurological framework for
both vulnerability and resilience. Effects were most pronounced in regions subserving higher-order cognitive
processes, and were independent of age, APOE-4 status, HT usage, and hysterectomy status. Comparisons
to age-matched males provided further evidence that neuroimaging biomarker effects were specific to meno-
pausal endocrine aging rather than to chronological aging. In most brain regions and across modalities, brain
biomarkers stabilized or recovered post-menopause. Cognitive preservation post-menopause correlated with
GMV recovery and brain ATP production, highlighting possible compensatory mechanisms. In parallel to the
adaptive process, Aβ deposition was more pronounced in PERI and POST women positive for APOE-4 genotype,
indicating specificity for AD risk with onset in the peri-menopause.
The MT is a normal physiological event. However, while the majority of women undergo menopause without
long-term adverse e ffects1, many are vulnerable to the neurological shifts that can occur during this transition,
experiencing bothersome s ymptoms2 as well as a higher risk of depression, anxiety, and A D13. Preclinical work
indicates that the brain has the ability to compensate for changes in estrogen levels and estrogen receptor activ-
ity during the MT1. In some instances, however, compensatory responses are diminished, lacking, or limited to
some estrogen-regulated n etworks1, which may account for the complex MT phenotype observed in w omen2.
Investigation of compensatory responses is still in the early stages1, though clinical observations suggest that
gradual hormonal changes during spontaneous MT may allow “brain resetting”, e.g. neuronal adaptations to
the hypo-estrogenic post-menopausal s tate1,14,15. Brain adaptation may account for the easing of menopausal
symptoms like hot flashes, which tend to resolve 2–7 years into menopause2. Present neuroimaging results pro-
vide novel neurophysiological evidence for post-menopausal brain adaptation in humans, encompassing brain
structure, connectivity and bioenergetics, and preservation of cognitive function.
Our results have several implications. First, compared to age-matched males, POST and PERI groups exhib-
ited lower GMV in several cortical regions and subcortical structures such as hippocampus, amygdala, and
Scientific Reports | (2021) 11:10867 | https://doi.org/10.1038/s41598-021-90084-y 9
Vol.:(0123456789)www.nature.com/scientificreports/
thalamus. However, GMV generally stabilized post-menopause and selectively recovered in precuneus, an asso-
ciative cortical area involved in social processes, episodic memory, and information i ntegration16. On average,
in the POST group, GMV in precuneus (a) was higher than the PERI group, (b) was comparable to age-matched
males, and (c) increased over a 2-year span, a change that was not observed in males, indicating POST-specific
recovery. Further, among POST participants, GMV in precuneus correlated with memory scores at cross-section
and longitudinally, indicating that this area undergoes structural changes that are influenced by MT and have
cognitive implications. Brain imaging studies of pregnancy, the other female-specific neuro-endocrine transi-
tion, also report dynamic GMV changes in precuneus, which are thought to reflect reduced neurogenesis in
late pregnancy, followed by restoration by the time of weaning17. Although neurogenesis decreases with aging18,
similar mechanisms may play a role in the brain’s adaptation to the post-menopausal stage. Notably, the observed
MT-related anatomical pattern maps onto estrogen-regulated s ystems1 and displays notable similarities to the
neural networks impacted by p regnancy19.
MT stage also influenced WMV within major tracts connecting extensive parts of the cerebral cortex and
subcortical regions. Both POST and PERI groups exhibited widespread WMV loss compared to age-matched
males, with the POST group also exhibiting lower WMV in corona radiata compared to PRE and PERI groups.
In spite of the WMV loss, all MT groups exhibited higher FA than males in corona radiata, as well as in fornix
of the POST group, and in fornix, uncinate fasciculus and external capsule of the PERI group. PERI and PRE
groups also exhibited some clusters with lower FA than males, involving chiefly SLF, whereas the POST group
showed no deficits. To our knowledge, there are no previous DTI studies of the MT. However, there is evidence
for sex differences in WM microstructure that vary with age and endocrine aging status. Most DTI studies on the
entire age range found that males have generally higher FA than females in WM tracts such as SLF20, as in our
comparisons with PERI and PRE groups. In contrast, during puberty (the first neuro-endocrine transition for
both genders), females display higher FA than males in several WM tracts including corona radiata and f ornix21.
Animal studies report that pregnancy is also accompanied by increased regional water diffusivity22. While FA
has a number of determinants, the principle factors are myelination and tissue architecture, with the inference
that higher FA represents more “efficient” WM o rganization12. As such, our findings suggest greater efficiency of
a smaller corona radiata and fornix post-menopause, raising the possibility that MT is accompanied by further
refinement of these regions’ connectivity. Longitudinal studies are warranted to map FA changes during the MT
and in relation to other biomarkers.
The MT also impacted brain energetics on multiple levels. The POST group, and to a lesser extent the PERI
group, exhibited hypometabolism in parieto-temporal cortices, consistent with previous reports in women at
risk for A D9–11. However, in the present study, regional CMRglc largely plateaued post-menopause, suggesting
adaptation to a new metabolic baseline after prolonged estrogen deficiency. Additionally, CBF and ATP produc-
tion in temporo-parietal regions were elevated post-menopause, and ATP levels positively correlated with global
cognition. Our findings of higher CBF in women than in men are consistent with the literature23, and further
indicate that MT modulates CBF sex differences in midlife. To our knowledge, there are no previous studies of
MT effects on brain ATP production in humans. Altogether, present results provide novel evidence for in vivo
neurovascular-neurometabolic dissociations during the MT. Typically, regional brain activity, CMRglc, and
CBF are c oupled24. Dissociation can occur with aging, pathology, and inflammation24, or as a compensatory
response25. While data in humans are scarce, preclinical evidence indicates that estrogen loss during MT triggers
CMRglc declines26, prompting an adaptive reaction to increase ketone bodies utilization as an alternative fuel
for ATP27. Continued reliance on ketones leads to compromised mitochondrial function, WM catabolism, and
cellular apoptosis in animals26,27. In light of preclinical work, the higher CBF and ATP levels observed in our
POST women may reflect a compensatory reaction to glucose hypometabolism, as well as a means to increase
ketone metabolism.
We previously reported lower peripheral mitochondrial cytochrome oxidase activity (COX) in POST versus
PRE women at risk for AD28. Herein, we investigated mitochondria ATP production in brain, which was higher
in POST women independent of APOE-4 status, suggesting different mitochondrial activity profiles in brain and
periphery. Animal models of menopause show dynamic relationships between central and peripheral metabolic
systems, which tend to shift from uncoupled to coupled under metabolic s tress29. Although brain mitochondria
might eventually falter in older POST women, the positive associations between ATP production and global cog-
nition suggest a recovery mechanism, at least in midlife. As aging and menopause differ to some extent between
humans and animals, the neuro-energetics of menopause are also likely to differ – in this case, by supporting
women’s ability to transition into late life with preserved cognition, as discussed below.
In parallel to the hypothesized adaptive process, POST and PERI groups, especially APOE-4 carriers, exhib-
ited higher Aβ deposition compared to the PRE group and to age-matched males. While Aβ deposition was mild,
this data is consistent with previous studies of women at risk for AD9–11, and support evidence that interactions
between age, female gender and APOE-4 increase AD vulnerability during peri-menopause30. Chronologically,
MT maps onto the preclinical phase of AD, which begins decades prior to symptom o nset31. The earlier onset
of, and longer exposure to Aβ pathology may help explain the higher prevalence of AD in females, with POST
women comprising over 60% of all cases32. It warrants emphasis that reproductive aging is not uniformly associ-
ated with AD risk. While some women in our cohort might eventually develop AD, for others, Aβ deposition
could reflect accelerated biological aging due to hormonal declines instead33. In fact, over 20% of healthy elderly
display moderate cerebral Aβ burden and no dementia31.
The proportion of APOE-4 carriers in our study was 42%, which is higher than the 15–30% observed in the
general population34. Many of our participants volunteer because of concerns about cognitive functioning, which
tend to be more frequent among APOE-4 c arriers35. As such, our cohort may be self-enriched with individuals
at higher a priori risk of AD. Although our results were independent of APOE-4 status, more studies are needed
to replicate these findings in community-dwelling individuals randomly recruited from the population.
Scientific Reports | (2021) 11:10867 | https://doi.org/10.1038/s41598-021-90084-y 10
Vol:.(1234567890)www.nature.com/scientificreports/
The observed MT effects were independent of HT and hysterectomy status, though HT use was associated
with mild beneficial effects on GMV and CMRglc, consistent with some clinical t rials6. Whether HT provides
protection against cognitive aging and AD remains unclear. Observational studies generally found positive
effects on cognition across multiple HT regimens36, whereas clinical trials of late POST women aged 65 or older
reported an increased dementia risk with estrogen-plus-progestin HT, and no effects with estrogen-alone37, while
studies of early POST women observed no adverse or beneficial effects on cognition38,39. Overall, HT’s efficacy
is thought to depend on timing of treatment initiation with respect to age at menopause, with benefits pertain-
ing to early initiation, especially after induced menopause7,37. Our neuroimaging results point to the MT as a
dynamic neurological process and, therefore, a window of vulnerabilities and opportunities when the human
brain is influenced by biochemical adjustments, but is also likely to be receptive to interventions. More studies
are needed to test the efficacy of HT instituted prior to menopause, and in relation to brain biomarker levels.
In our study, POST participants did not exhibit impaired cognitive performance as compared to the other
groups. While self-reports of poor memory and concentration are common in women undergoing MT2, meno-
pause itself hasn’t been associated with clinically significant functional impairment or deficits on cognitive
testing40. Further, it is well-documented that women perform better than men on several cognitive domains
across the adult lifespan– an advantage that seems to persist even after a dementia d iagnosis41. Lack of cognitive
decline may seem in contrast with neuroimaging findings of extensive MT-stage effects on brain biomarkers. In
the present study, GMV recovery and ATP production positively correlated with cognitive scores in the POST
group. While this awaits confirmation, present results provide neurophysiological insights on brain adaptation
during the MT, which may at least in part, account for the lack of cognitive impairment among POST w omen40.
Large-scale epidemiological studies reported a decrement in cognitive performance during the peri-menopause,
followed by a rebound to pre-menopausal levels in post-menopause42. This is consistent with the post-meno-
pausal brain biomarker recovery observed in our study. Additionally, studies that differentiated between early
and late menopausal stages reported subtle yet transitory cognitive changes during the M T43, which have yet to
be investigated with neuroimaging. However, it is possible that brain and cognitive aging trajectories may differ
among MT women depending on genetic predisposition, medical history, and environmental influences. More
longitudinal imaging studies with larger samples are warranted to address these questions. Additionally, as our
cohort was highly educated, the observed lack of cognitive deficits may not be generalizable to women with dif-
ferent educational or socio-economical background.
Another limitation of this study is the low percentage of minority participants, which limits the generaliz-
ability of our findings. Today, no brain imaging studies have been conducted to investigate MT effects on brain
biomarkers based on ethnicity. Multiple studies have indicated increased frequency and severity of menopau-
sal symptoms, particularly vasomotor symptoms, with greater prevalence in African-American and Hispanic
women44, which strongly argues for studies that specifically address differences in MT-associated biomarker
outcomes across ethnic groups.
From a methodological perspective, we examined statistically powered groups of women at different MT
stages, paired with age correction procedures including comparisons to age-matched males and longitudinal
evaluations in a subset of participants. Nonetheless, a causal link between MT and brain biomarkers cannot
be unequivocally established. We chose this study design because the timing of menopause is highly variable,
with a median age at menopause of 51 years, and a distribution of 40–58 years2. Longitudinal studies may
require > 10 years of follow-ups to capture the effects of MT on brain biomarkers. While studies of surgical
menopause ideally reduce follow-up times, the procedure seems associated with different, possibly more severe
outcomes45,46. Longitudinal studies are warranted to replicate our findings and test for differential effects of
induced and spontaneous menopause.
Determination of MT status was based on established diagnostic criteria47. Nonetheless, some PERI may
have been early POST, while some early POST could have been late PERI. This would, however, conservatively
reduce power in detecting MT-stage effects. Considering the hormonal changes women experience during
MT, and the observed biomarker effects, we attribute our results to the endocrine climate of menopause. Our
analyses were corroborated by testing of males of similar demographic and socio-economical characteristics.
Future studies tracking changes in hormones, medical status, and lifestyle are needed to clarify the complex
relationships between MT and brain a ging13, and identify which factors impact successful versus unsuccessful
brain adaptation post-menopause.
Overall, present findings show that human menopause is a dynamic neurological transition that reshapes the
neural landscape of the female brain during midlife endocrine aging, and provide preliminary evidence for an
adaptive process serving the transition into late life.
Methods
Participants. This is a non-randomized natural history non-treatment study of healthy, cognitively normal
female and male participants ages 40–65 years at different menopausal stages, recruited at Weill Cornell Medi-
cine (WMC) and NYU School of Medicine between 2015 and 2020. Participants were recruited by self-referral,
flyers, and word of mouth, as described9–11. Pre-established exclusion criteria included medical conditions that
may affect brain structure or function (e.g. stroke, any neurodegenerative diseases, major psychiatric disorders,
hydrocephalus, white matter lesions suggestive of demyelinating disease such as Multiple Sclerosis, intracranial
mass and infarcts on MRI), use of psychoactive medications, and contraindications to MRI or PET. Participants
had Mini Mental Status Exam ≥ 27 and normal cognitive performance for age and education9–11.
The patients’ sex was determined by self-report. APOE genotype was assessed using quantitative Polymerase
Chain Reaction (qPCR) p rocedures9–11. Participants carrying one or two copies of APOE-4 allele were grouped
as carriers, and compared to non-carriers.
Scientific Reports | (2021) 11:10867 | https://doi.org/10.1038/s41598-021-90084-y 11
Vol.:(0123456789)www.nature.com/scientificreports/
Standard protocol approvals, registrations, and patient consents. All methods were carried out in accordance
with relevant guidelines and regulations. All experimental protocols were approved by the WMC and NYU
Institutional Review Boards. Written informed consent was obtained from all participants.
Cognitive testing. Our neuropsychological testing battery included tests measuring three cognitive domains:
memory (immediate and delayed recall of a paragraph and paired associates), higher-order processing (block
design tests), and language (object naming)9–11. We computed (i) a global cognitive score by creating Z-scores
within each domain and averaging across the domains; and (ii) a memory score by creating Z-scores for each
memory test and averaging across tests.
Menopause assessments. Determination of menopausal status was based on the Stages of Reproductive Aging
Workshop (STRAW) c riteria47 and corroborated by means of hormone assessments. Female participants were
classified as regular cyclers (PRE), irregular cyclers (PERI), and no cycle for 12 or more months (POST).
Brain imaging acquisition and analysis. All participants underwent structural MRI, and 160 partici-
pants received 18F-FDG and 11C-PiB PET at WMC. In 2017, we started acquiring DTI, ASL, and MRS scans,
which have been done on 100 participants.
Our protocol included three MRI sequences on a 3.0 T G.E. Discovery MR750 scanner: (a) sagittal T1-MRI
[Brain Volume Imaging (BRAVO); 1.0 × 1.0 ×1.0 mm resolution, 8.2 ms repetition time (TR), 3.2 ms echo time
(TE), 25.6 cm field of view (FOV), 256 × 256 matrix] used to estimate GMV and WMV; (b) DTI scan [b = 0 s/
mm2, b = 1000 s/mm2 55-directions, 8000 ms TR , 65 ms TE, 256 × 256 matrix, 0.9 × 0.9 ×1.8 mm resolution]; (c)
ASL scan [pseudo-continuous technique with 4851 ms TR, 10.6 ms TE, 4 averages, 24 cm FOV, 2.0 × 2.0 × 3.8 mm
resolution] used to estimate CBF using arterial blood water48.
31
P-MRS was acquired on the GE scanner using a dual tuned 32-channel 31P/1H quadrature head coil [2048
points, 5000 Hz sweep width, 2000 ms TR, 2 averages, 55° flip angle at 51.3 MHz, 24 cm FOV] to assess mito-
chondrial function in brain through the mapping of intracellular ATP and PCr levels49,50. A higher ATP/PCr
ratio reflects greater ATP production relative to utilization51. Shimming was performed using a 1H single voxel
technique placed over the entire brain. Raw data was processed using Hamming and Fermi k-space filters, 20 Hz
exponential filtering and zero-filling in time, x and y-domains prior to 3D Fast Fourier Transformation. The PCr
peak is set at 0.0 ppm and susceptibility corrections performed. Baseline correction was applied by an experienced
analyst (JPD). This resulted in a 16 × 16 image of 1.5 × 1.5 × 3.0 cm voxels with the signal intensity in each voxel
corresponding to the peak area of the 31P metabolite. The central 4 slices of Chemical Shift Imaging (CSI) data
were then registered to the BRAVO sequence.
PET scans were acquired on a Siemens BioGraph mCT 64-slice PET/CT operating in 3D mode [70 cm
transverse FOV, 16.2 cm axial FOV] following standardized procedures9–11. Summed images were obtained
40–60 min post-injection of 5 mCi of 18F-FDG, and 60–90 min post-injection of 15 mCi of 11C-PiB. All images
were corrected for attenuation, scatter and decay, and smoothed for uniform r esolution52.
Two-year follow-up volumetric MRI and FDG-PET scans were performed on 17 POST women (age at base-
line scan: 57 ± 3 years; time to follow-up: 2.2 ± 0.4 years) and 12 males within the same age range (age at baseline:
56 ± 4 years, time to follow-up: 2.4 ± 0.4 years) using the same protocol and equipment as the baseline exams.
Multiparametric mapping. All images were processed in Statistical Parametric Mapping (SPM12, (https://www.
ipeline9–11.
fil.ion.ucl.ac.uk/spm/software/spm12/) and Matlab 7.8, using a fully automated image processing p
For each participant, scans were co-registered to the T1-MRI and to each other using the Normalized Mutual
Information routine53. Volumetric scans were processed with voxel-based morphometry (VBM), including Jaco-
bian modulation to restore volumes using the unified segmentation algorithm, DARTEL normalization of the
segments, and application of an 8 mm full-width at half maximum (FWHM) smoothing kernel53. Co-registered
DTI, ASL, and PET scans were spatially normalized using subject-specific transformation matrices obtained
from the corresponding MRI and smoothed at 10-mm FWHM. For longitudinal analysis, each participant’s
MRIs were processed using longitudinal routines incorporating rigid-body registration, intensity inhomogene-
ity correction, and nonlinear diffeomorphic registration53. Co-registered follow-up PET were processed using
the baseline MRI as the anchor.
ATP/PCr and PiB uptake were quantified using FreeSurfer 6.0 and Desikan-Killiany Atlas-based cortical
ROIs54,55 applied to the aligned MRI. For PiB analysis, we created an AD-mask by averaging parietal, temporal,
frontal, posterior cingulate and precuneus ROIs56,57. PiB uptake in AD-mask was normalized to cerebellar GM
uptake obtained via FreeSurfer.
Statistical analysis. Analyses were performed in SPSS v.25 and SPM12. Clinical, demographic and cogni-
tive measures were examined with General Linear Models (GLM) or Chi-squared tests at p < 0.05.
To address the age difference between POST and PRE groups we11,58: (a) used box plots and frequency dia-
grams to ensure that we had sufficient age overlap among women of different MT statuses, which enabled us
to examine the effects of endocrine aging separately from those of chronological aging; (b) included age as a
covariate in all analyses; (c) compared each MT group to an age-range matched male group ( MALEPRE, MALEPERI,
MALEPOST); and (d) compared 2-year MRI and FDG-PET changes in a subset of POST women and M ALEPOST.
All images were analyzed using SPM12, except for MRS and PiB-PET ROI data which were examined using
SPSS, as described below. SPM12 analyses were adjusted by age, APOE-4 status, and modality-specific confounds,
e.g. GMV, WMV and FA were adjusted by total intracranial volume (TIV) obtained via Freesurfer, CMRglc by
global metabolic activity, CBF by global CBF. Statistical maps were conservatively obtained by first applying an a
Scientific Reports | (2021) 11:10867 | https://doi.org/10.1038/s41598-021-90084-y 12
Vol:.(1234567890)www.nature.com/scientificreports/
priori masking image including regions involved in the brain estrogen network with known cognitive functions1,
and then a stringent cluster-level FWE correction at p < 0.05, with cluster extent ≥ 20 voxels. The masking image
comprised anterior and posterior cingulate cortex; fusiform gyrus; inferior and medial orbitofrontal cortex;
inferior, medial, middle and superior frontal cortex; inferior, middle, and superior temporal gyrus; inferior and
superior parietal lobule; insula; medial temporal lobe; precuneus; putamen; and thalamus. For WM analysis,
the brainstem was also included. Further, results were examined after application of an a priori GM or WM
mask to restrict analysis to GM or WM fiber voxels, respectively. Identification of GM clusters was made using
MNI coordinates, and of WM clusters by reference to the Johns Hopkins University White-Matter Labels a tlas59.
In figures, statistical parametric maps and surface maps were obtained using SPM12 and SurfRend v.1 (http://
spmsurfrend.sourceforge.net/).
Biomarker differences between MT groups. For SPM12 analyses, we used full factorial models to test for bio-
marker differences between MT groups. If a significant main effect was found, we then proceeded to separately
examine the directionality of biomarker differences between paired groups using post-hoc t-contrasts. For all
biomarker modalities, statistical parametric maps of significant results were saved as masking images, which
were then used as implicit masks of MT stage-specific regional biomarker effects in subsequent analyses (see b
and c, below). For example, the POST group showed larger GMV in precuneus compared to PERI. The precu-
neus cluster was saved as a masking image for further examination of POST and PERI-specific GMV effects in
this region.
For ROI analyses, we used (i) mGLMs with post-hoc Sidak tests to test for group differences in ATP/PCr in
regions showing MT effects on CMRglc and CBF (e.g. temporo-parietal regions), adjusting by age and APOE-4
status as covariates, at p < 0.05; and (ii) GLMs with post-hoc Sidak tests to examine AD-mask PiB uptake for MT
group effects, and for APOE-4 effects by (i) examining APOE-4 status as a covariate; (ii) testing for interactions
between MT and APOE-4 status; and (iii) for MT effects within each APOE-4 subgroup, at p < 0.05.
Comparisons to age‑matched males. For SPM12 analyses, we used two-sample t-tests to compare each MT
group to the corresponding age-matched male group, using the same confounders as above. For all biomarker
modalities, our main endpoint was detection of sex-related biomarker differences within the implicit masks of
MT stage-specific effects described in (a). For example, we used the precuneus cluster described above to test for
GMV differences between POST and PERI groups and corresponding age-matched male groups. Comparison
to MALEPERI confirmed presence of lower precuneus GMV in the PERI group, while comparison to MALEPOST
showed no significant differences in precuneus of the POST group, suggesting POST-specific GMV recovery. As
this analysis was restricted to specific clusters, our secondary endpoint was detection of group differences in the
entire search volume.
For ROI analyses, we used (i) mGLMs with post-hoc Sidak tests to test for ATP/PCr group differences in
regions showing CMRglc and CBF differences between POST and MALEPOST; and (ii) GLMs with post-hoc Sidak
to examine AD-mask PiB uptake for group effects and for APOE-4 status effects (as described above), at p < 0.05.
Biomarker changes post‑menopause. We investigated whether the structural and CMRglc effects of menopause
were persistent 2-years after the first examination in a subset of POST and M ALEPOST. Voxel-based changes in
GMV, WMV and CMRglc were examined by means of post-hoc t-tests on the baseline versus 2-year follow-up
scans for each group, and by comparing the maps of change between groups, using SPM12. This analysis allowed
us to identify brain regions showing (i) significant biomarker changes over time in each group, and (ii) different
rates of change in POST versus MALEPOST.
Our main endpoint was detection of biomarker changes within the implicit masks of POST-specific regional
effects, as described in (a). Therefore, we first tested for longitudinal changes within those pre-specified regions
of the POST group, and then compared the rate of change in those regions between POST and M ALEPOST. For
example, the POST group showed larger precuneus GMV compared to PERI. Longitudinally, the POST group
showed increased precuneus GMV over time, whereas MALEPOST did not, supporting evidence of POST-specific
GMV recovery in this region. We then tested for longitudinal differences in the entire search volume, e.g. bio-
marker changes outside of the implicit masks. Results were examined at p < 0.05, cluster-level corrected, adjusting
for time to follow-up and modality-specific confounds.
Cognitive measures: group effects and biomarker associations. We examined cognitive measures for differences
across groups using Kruskal–Wallis non-parametric tests for global cognition as this measure did not follow a
normal distribution, and GLMs with post-hoc Sidak tests for analysis of memory scores, adjusting by age, educa-
tion, and APOE-4 status, at p < 0.05. Cognitive measures were then tested for correlations with biomarker data.
Since cognitive measures were preserved in the POST group, we tested for associations between cognitive meas-
ures and regional biomarkers showing preservation in the POST group, e.g. precuneus GMV, temporo-parietal
ATP/PCr and CBF. For descriptive purposes, we examined these associations also among PRE and PERI groups.
Spearman’s Rho tests were used to test for correlations with global cognition, and Pearson’s r tests for correlations
with memory scores, at p < 0.05, 2-tailed.
Data availability
The datasets analyzed during the current study may be made available from the corresponding author on rea-
sonable request.
Scientific Reports | (2021) 11:10867 | https://doi.org/10.1038/s41598-021-90084-y 13
Vol.:(0123456789)www.nature.com/scientificreports/
Received: 12 January 2021; Accepted: 6 May 2021
References
1. Brinton, R. D., Yao, J., Yin, F., Mack, W. J. & Cadenas, E. Perimenopause as a neurological transition state. Nat Rev Endocrinol 11,
393–405. https://doi.org/10.1038/nrendo.2015.82 (2015).
2. Monteleone, P., Mascagni, G., Giannini, A., Genazzani, A. R. & Simoncini, T. Symptoms of menopause—global prevalence, physiol-
ogy and implications. Nat Rev Endocrinol. 14, 199–215. https://doi.org/10.1038/nrendo.2017.180 (2018).
3. McEwen, B. S., Alves, S. E., Bulloch, K. & Weiland, N. G. Ovarian steroids and the brain: implications for cognition and aging.
Neurology 48, 8S-15S (1997).
4. Yue, X. et al. Brain estrogen deficiency accelerates Abeta plaque formation in an Alzheimer’s disease animal model. Proc Natl Acad
Sci U S A 102, 19198–19203. https://doi.org/10.1073/pnas.0505203102 (2005).
5. Yao, J. et al. Mitochondrial bioenergetic deficit precedes Alzheimer’s pathology in female mouse model of Alzheimer’s disease.
Proc Natl Acad Sci U S A 106, 14670–14675. https://doi.org/10.1073/pnas.0903563106 (2009).
6. Comasco, E., Frokjaer, V. G. & Sundström-Poromaa, I. Functional and molecular neuroimaging of menopause and hormone
replacement therapy. Front Neurosci 8, 388. https://doi.org/10.3389/fnins.2014.00388 (2014).
7. Maki, P. M. The timing of estrogen therapy after ovariectomy—implications for neurocognitive function. Nat Clin Pract Endocrinol
Metabol 4, 494 (2008).
8. Bertram, L. & Tanzi, R. E. Thirty years of Alzheimer’s disease genetics: the implications of systematic meta-analyses. Nat Rev
Neurosci 9, 768–778. https://doi.org/10.1038/nrn2494 (2008).
9. Mosconi, L. et al. Increased Alzheimer’s risk during the menopause transition: a 3-year longitudinal study. PloS One 13, e0207885
(2018).
10. Mosconi, L. et al. Sex differences in Alzheimer risk Brain imaging of endocrine vs chronologic aging. Neurology 89, 1382–1390
(2017).
11. Rahman, A. et al. Sex-driven modifiers of Alzheimer risk. Neurology 95, e166. https://doi.org/10.1212/WNL.0000000000009781
(2020).
12. Le Bihan, D. et al. Diffusion tensor imaging: concepts and applications. J Magn Reson Imaging 13, 534–546. https://doi.org/10.
1002/jmri.1076 (2001).
13. Rahman, A. et al. Sex and gender driven modifiers of Alzheimer’s: the role for estrogenic control across age, race, medical, and
lifestyle risks. Front Aging Neurosci https://doi.org/10.3389/fnagi.2019.00315 (2019).
14. Deecher, D. C. & Dorries, K. Understanding the pathophysiology of vasomotor symptoms (hot flushes and night sweats) that occur
in perimenopause, menopause, and postmenopause life stages. Arch Womens Ment Health 10, 247–257. https://doi.org/10.1007/
s00737-007-0209-5 (2007).
15. Rossmanith, W. G. & Ruebberdt, W. What causes hot flushes? The neuroendocrine origin of vasomotor symptoms in the meno-
pause. Gynecol Endocrinol 25, 303–314. https://doi.org/10.1080/09513590802632514 (2009).
16. Cavanna, A. E. & Trimble, M. R. The precuneus: a review of its functional anatomy and behavioural correlates. Brain 129, 564–583.
https://doi.org/10.1093/brain/awl004 (2006).
17. Hoekzema, E. et al. Pregnancy leads to long-lasting changes in human brain structure. Nat Neurosci. 20, 287–296. https://doi.org/
10.1038/nn.4458 (2017).
18. Gross, C. G. Neurogenesis in the adult brain: death of a dogma. Nat Rev Neurosci. 1, 67–73. https://doi.org/10.1038/35036235
(2000).
19. Brunton, P. J. & Russell, J. A. The expectant brain: adapting for motherhood. Nat Rev Neurosci 9, 11–25. https://doi.org/10.1038/
nrn2280 (2008).
20. Kanaan, R. A. et al. Gender differences in white matter microstructure. PLoS ONE 7, e38272. https://d oi.o
rg/1 0.1 371/j ourna l.p
one.
0038272 (2012).
21. Bava, S. et al. Sex differences in adolescent white matter architecture. Brain Res 1375, 41–48. https://doi.org/10.1016/j.brainres.
2010.12.051 (2011).
22. Chan, R. W. et al. Structural and functional brain remodeling during pregnancy with diffusion tensor MRI and resting-state
functional MRI. PLoS ONE 10, e0144328. https://doi.org/10.1371/journal.pone.0144328 (2015).
23. Aanerud, J. et al. Brain energy metabolism and blood flow differences in healthy aging. J Cerebr Blood Flow Metabol 32, 1177–1187
(2012).
24. Iadecola, C. Neurovascular regulation in the normal brain and in Alzheimer’s disease. Nat Rev Neurosci 5, 347–360. https://doi.
org/10.1038/nrn1387 (2004).
25. Masamoto, K. New horizons in neurovascular coupling: a bridge between brain circulation and neural plasticity, 1st edn Vol. 225
(Elsevier Science, Amsterdam, 2016).
26. Brinton, R. D. The healthy cell bias of estrogen action: mitochondrial bioenergetics and neurological implications. Trends Neurosci
31, 529–537. https://doi.org/10.1016/j.tins.2008.07.003 (2008).
27. Ding, F., Yao, J., Rettberg, J. R., Chen, S. & Brinton, R. D. Early decline in glucose transport and metabolism precedes shift to
ketogenic system in female aging and Alzheimer’s mouse brain: implication for bioenergetic intervention. PLoS ONE 8, e79977.
https://doi.org/10.1371/journal.pone.0079977 (2013).
28. Mosconi, L. et al. Perimenopause and emergence of an Alzheimer’s bioenergetic phenotype in brain and periphery. PloS One 12,
e0185926 (2017).
29. Wang, Y. et al. Midlife chronological and endocrinological transitions in brain metabolism: system biology basis for increased
Alzheimer’s risk in female brain. Sci Rep 10, 8528. https://doi.org/10.1038/s41598-020-65402-5 (2020).
30. Riedel, B. C., Thompson, P. M. & Brinton, R. D. Age, APOE and sex: triad of risk of Alzheimer’s disease. J Steroid Biochem Mol Biol
160, 134–147. https://doi.org/10.1016/j.jsbmb.2016.03.012 (2016).
31. Sperling, R. A., Karlawish, J. & Johnson, K. A. Preclinical Alzheimer disease-the challenges ahead. Nat Rev Neurol. 9, 54–58. https://
doi.org/10.1038/nrneurol.2012.241 (2013).
32. Ferretti, M. T. et al. Sex differences in Alzheimer disease—the gateway to precision medicine. Nat Rev Neurol 14, 457–469 (2018).
33. Levine, M. E. et al. Menopause accelerates biological aging. Proc Natl Acad Sci 113, 9327–9332. https://d oi.o
rg/1 0.1 073/p nas.1 6045
58113 (2016).
34. Singh, P. P., Singh, M. & Mastana, S. S. APOE distribution in world populations with new data from India and the UK. Ann Hum
Biol. 33, 279–308. https://doi.org/10.1080/03014460600594513 (2006).
35. Small, G. W. et al. Memory self-appraisal in middle-aged and older adults with the apolipoprotein E-4 allele. Am J Psychiatry 156,
1035–1038 (1999).
36. Morrison, J. H., Brinton, R. D., Schmidt, P. J. & Gore, A. C. Estrogen, menopause, and the aging brain: how basic neuroscience
can inform hormone therapy in women. J Neurosci. 26, 10332–10348. https://doi.org/10.1523/jneurosci.3369-06.2006 (2006).
37. Lobo, R. A. Hormone-replacement therapy: current thinking. Nat Rev Endocrinol. 13, 220–231. https://doi.org/10.1038/nrendo.
2016.164 (2017).
Scientific Reports | (2021) 11:10867 | https://doi.org/10.1038/s41598-021-90084-y 14
Vol:.(1234567890)You can also read