Persistent loss of biologically-rich tropical forests in the Indian Eastern Himalaya - Silva Fennica
←
→
Page content transcription
If your browser does not render page correctly, please read the page content below
Silva Fennica vol. 54 no. 3 article id 10373
                                                                                  Category: research article

SILVA FENNICA
                                                                          https://doi.org/10.14214/sf.10373
                                                                                 http://www.silvafennica.fi
                                                                                  Licenced CC BY-SA 4.0
                                                             ISSN-L 0037-5330 | ISSN 2242-4075 (Online)
                                                                    The Finnish Society of Forest Science

Chintan Sheth 1, Aparajita Datta 2 and Devathi Parashuram 2,3

Persistent loss of biologically-rich tropical forests in the
Indian Eastern Himalaya

        Sheth C., Datta A., Parashuram D. (2020). Persistent loss of biologically-rich tropical forests
        in the Indian Eastern Himalaya. Silva Fennica vol. 54 no. 3 article id 10373. 16 p. https://doi.
        org/10.14214/sf.10373

            Highlights
        •     We found a high rate of deforestation occurring in a state managed reserve forest in Indian
              Eastern Himalaya.
        •     Fine-scale analysis showed considerable forest loss around nesting trees for hornbills.
        •     Forest monitoring, protection and honest governance are required to effectively protect forests
              in the Eastern Himalaya biodiversity hotspot.

            Abstract
        Using fine-resolution satellite imagery from multiple satellite data products, we assessed the
        change in forest cover of a state-managed Reserve Forest (RF) located in India’s Eastern Himalaya
        biodiversity hot-spot. 4.6% of forest cover was lost from Papum RF between 2013 and 2017 at the
        rate of 8.2 km2 year–1. Three species of hornbills: Great Hornbill Buceros bicornis Linnaeus, 1758,
        Wreathed Hornbill Rhyticeros undulatus (Shaw, 1811) and Oriental Pied Hornbill Anthracoceros
        albirostris (Shaw, 1808), that are functionally important are found here with nesting habitat in
        the areas affected by illegal logging. Therefore, we assessed the habitat loss within a 1 km radius
        around 29 nest trees. From 2011 to 2019, forest cover declined from 38.55 km2 to 21.94 km2
        around these hornbill nest trees. Illegal logging is the main driver that is depleting forest cover
        within this important bird area. Our results highlight the ongoing threats to biologically-rich
        forests and the need for urgent measures to halt this loss. We suggest that this study has practical
        implications for the monitoring and governance of state-managed forests in Arunachal Pradesh.

        Keywords Arunachal Pradesh; biodiversity hotspot; Buceros bicornis; deforestation; hornbill nest
        trees; illegal logging; north-east India
        Addresses 1 #4 Ananda Nilaya, 4th Main Road, Siddhivinayaka Layout, Bengaluru 560097,
        Karnataka, India; 2 Nature Conservation Foundation, 1311,“Amritha”, 12th Main, Vijayanagar 1st
        Stage, Mysore 570017, Karnataka, India; 3 Department of Geography, University of Cambridge,
        CB2 3EN, United Kingdom
        E-mail aparajita@ncf-india.org
        Received 9 May 2020 Revised 22 June 2020 Accepted 24 June 2020

                                                     1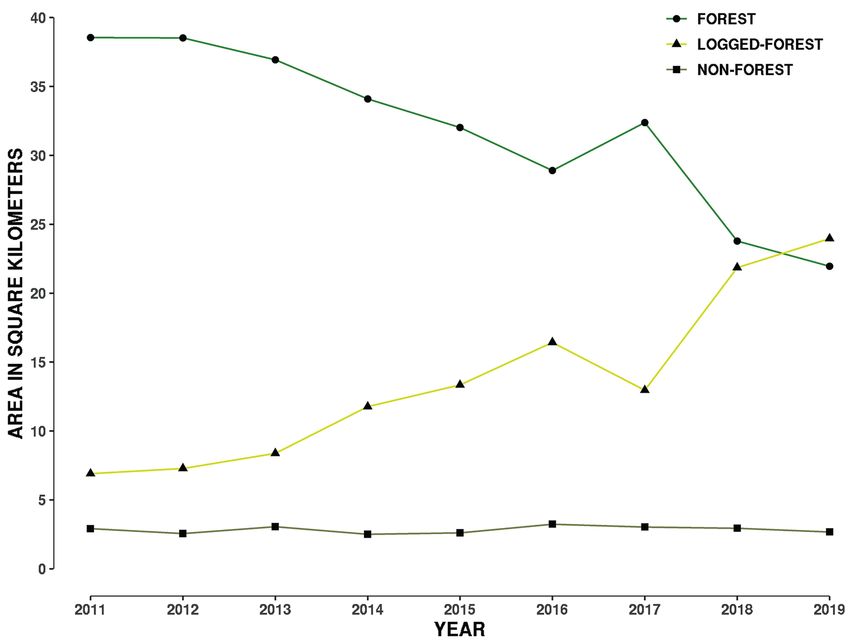
Silva Fennica vol. 54 no. 3 article id 10373 · Sheth et al. · Persistent loss of biologically-rich tropical forests in …

1 Introduction

1.1 The state of forest cover in India and the Indian Eastern Himalaya

Tropical forests are not only the most biodiverse terrestrial ecosystems on Earth (Gibson et al.
2011) but also amongst the most threatened. Globally, 3.86 million square kilometres (km2) of tree
cover was lost from 2001 to 2019, with tropical forests undergoing the highest losses (Hansen et
al. 2013; Global Forest Watch 2020). From 2001 to 2019 614 446 km2 of primary forest were lost
globally (Turubanova et al. 2018; Global Forest Watch 2020). Deforestation is one of the major
causes of biodiversity loss across the world (Gibbs et al. 2010; Curtis et al. 2018).
        India’s state of forest is assessed biennially by the Forest Survey of India (FSI) and accord-
ing to FSI, India has lost 80% of its native forest cover and forests continue to be lost at the rate
of 1.5 to 2.7% per year. However, this does not provide an accurate estimate of the true extent of
native forests and deforestation rates as these data combine native forests, secondary regrowth,
plantations and cropland and do not validate classifications with ground-truthing (Puyravaud et
al. 2010a,b). Puyravaud et al. (2010b) highlighted the cryptic destruction of India’s native forests
as a challenge to understanding the trends in the state of India’s forests.
        Global Forest Watch (GFW) data show that India lost about 17 955.5 km2 of tree cover with
>30% canopy cover between 2001 and 2019 amounting to 690.52 Mg of carbon dioxide (CO2)
emissions (Hansen et al. 2013; Global Forest Watch 2020). North-east India, which encompasses two
global biodiversity hotspots – Indo-Burma and the Himalaya (Mittermeier et al. 2004) – appears to be
severely affected by deforestation (Pandit et al. 2007). The GFW assessment estimated 12 551.4 km2
of tree cover loss from north-east India from 2001 to 2019 (a loss of 7.8% of the tree cover extent
in 2000; Global Forest Watch 2020). From 2002 to 2019, 2879 km2 of primary forest cover was
lost in north-east India (a loss of 23.72% of the total tree cover lost; Global Forest Watch 2020).
        Arunachal Pradesh in north-east India is the richest terrestrial biodiversity region in India
(Mishra and Datta 2007) with nearly 6000 flowering plants and 720 (54.8%) of the 1313 bird
species known from India (Praveen et al. 2019). Recent research has led to the discovery of new
records, range extensions and new species of fungi, plants and animals from the state (Gajurel et
al. 2001; Ahti et al. 2002; Sinha et al. 2005; Athreya 2006; Tamang et al. 2008; Siliwal et al. 2015).
        Forest cover in Arunachal Pradesh has been declining in the last decade although forests still
cover 74% of the total land area (Global Forest Watch 2020; Table S1 and Fig. S1 in Supplementary
file S1, available at https://doi.org/10.14214/sf.10373). FSI reports estimate that 486 km2 of forest
was lost from 2003 to 2017 in Arunachal Pradesh (Forest Survey of India 2003, 2005, 2009, 2011,
2013, 2017). However, GFW data show that 2093 km2 of tree cover was lost between 2001 and
2019, comparable to a 3.3% decrease in tree cover since 2000 (Global Forest Watch 2020; Table S2
in Suppl. file S1). From 2002 to 2019, 1110 km2 of primary forest was lost in Arunachal Pradesh
comprising 55% of the total tree cover lost (Global Forest Watch 2020).
        In terms of their legal status, 11.83 percent (9905.37 km2) of the geographical area of
Arunachal Pradesh is under the Protected Area (PA) network (Orchid Sanctuaries, Wildlife Sanc-
tuaries and National Parks, some of which also include Tiger Reserves) (Singh 2017). The PAs are
generally better protected than Unclassed State Forests (USF; 37.06% of area; 30 707.38 km2) and
Reserve Forests (RF; 12.04% of area; 10 089.39 km2) attributable to stronger implementation of the
country’s forest and wildlife laws (Naniwadekar et al. 2015a; Singh 2017). Unclassed State Forest
areas are in practice used and/or owned by the community (de facto rights), although recorded as
being under the Forest Department. The RFs, despite being legally under the control of the state
Forest Department, are often subject to various anthropogenic pressures such as agricultural expan-
sion, conversion to plantations and/or logging (Naniwadekar et al. 2015a).

                                                           2
Silva Fennica vol. 54 no. 3 article id 10373 · Sheth et al. · Persistent loss of biologically-rich tropical forests in …
With 80% of the population practicing subsistence farming in the hilly terrain, people are
primarily dependent on shifting cultivation which is mainly carried out in the USF or community
forests. Shifting cultivation was estimated to cover 2040 km2 in 2008–2009 (Wasteland Atlas 2011)
but is now in decline among many communities (Teegalapalli and Datta 2016). Although shifting
cultivation is usually cited as the main driver of forest loss in the state, there are several drivers
of forest loss such as: agricultural expansion, growth of plantation crops such as oil palm, rubber,
tea, opium, illegal logging and road expansion (Srinivasan 2014; Velho et al. 2016; Khandekar
2019). With an increasing population, need for agricultural land and development, and lack of land
demarcation and cadastral surveys, there is logging (mostly in Reserve Forests) for agriculture
expansion and plantations along with illegal logging in Arunachal Pradesh (Naniwadekar et al.
2015a; Velho et al. 2016; Rina 2017, 2019; Mamai 2018; Khandekar 2019).
1.2 Ethno-civil conflict and illegal logging
The main sources of revenue for Arunachal Pradesh were forest-based industries until 1996, after
which the Supreme Court of India banned logging. Despite the ban, illegal clearing driven by
ethno-civil conflict in Sonitpur district in neighbouring Assam resulted in the disappearance of
several RFs that bordered Nameri National Park (NP) in Assam in the last two decades (Srivastava
et al. 2002; Kushwaha and Hazarika 2004; Mazoomdar 2011; Velho et al. 2014; Srinivasan 2018).
Srivastava et al. (2002) estimated that 232 km2 of forests was cleared in Sonitpur District between
1994 and 2001 with the overall loss rate of 28.65%, possibly the highest deforestation rate in the
country. Kushwaha and Hazarika (2004) estimated 344 km2 forest loss between 1994 and 2002 in
the Kameng and Sonitpur Elephant Reserves, while Velho et al. (2014) reported continuing forest
loss in the same region around the southern boundaries of both Pakke Tiger Reserve (TR) and
Nameri NP. Between 2001 and 2019, 171 km2 of forest was lost from Sonitpur district (Global
Forest Watch 2020). Forest loss over twenty-five years has resulted in substantial habitat loss for
wildlife that include. the Tiger Panthera tigris Linnaeus, 1758, Asian Elephant Elephas maximus
Linnaeus, 1758, and large birds such as hornbills: Great Hornbill Buceros bicornis Linnaeus, 1758,
Wreathed Hornbill Rhyticeros undulatus (Shaw, 1811), and Oriental Pied Hornbill Anthracoceros
albirostris (Shaw, 1808) (mammal taxonomic names as per Wilson and Reeder 2005; bird taxo-
nomic names as per Integrated Taxonomic Information System 2020).
After the 1996 ban, selective logging has re-started in some forest divisions in Arunachal
Pradesh since 2008–2009. However, apart from these state-controlled and permitted logging activi-
ties, ground observations and local media reports indicate that illegal logging is becoming a major
driver of deforestation in Reserve Forests (Rina 2017; Sentinel Assam 2019) and other areas in
Arunachal Pradesh (Press Trust of India 2017; Mamai 2018).
The Pakke TR and its surrounding RF areas are among the few remaining areas of low-
elevation forest and is among the best areas for hornbills in South Asia (Datta 1998, 2001; Datta
and Rawat 2003, 2004; Dasgupta and Hilaluddin 2012; Datta et al. 2012; Datta and Naniwadekar
2015) due to protection measures by forest authorities (Velho et al. 2011) and control of hunting
by local people. Hornbills are an ecologically important functional group that act as effective seed
dispersers (Datta 2001; Naniwadekar et al. 2015b, 2019). The main nesting habitat for the Great
Hornbill, Wreathed Hornbill and Oriental Pied Hornbill, is in the low-elevation areas encompassing
the Pakke TR and surrounding RFs (Datta and Rawat 2004) where illegal logging occurs. In 2012,
the Hornbill Nest Adoption Programme (HNAP) was initiated to protect hornbill nest trees and
nesting habitat in the Papum RF (Fig. 1) outside Pakke TR in a partnership with local communities
and the state Forest Department (Datta et al. 2012; Rane and Datta 2015). Since the HNAP began,
it has resulted in increased local awareness about hornbills and nest trees of three hornbill species
3Silva Fennica vol. 54 no. 3 article id 10373 · Sheth et al. · Persistent loss of biologically-rich tropical forests in …
Fig. 1. A November 2018, false-colour composite image (RapidEye bands 3, 4, 1) of the study area, showing Pakke
Tiger Reserve (TR), Tenga Reserve Forest (RF) and Papum RF. The administrative boundaries of Arunachal Pradesh
are marked in the map of India. The border between Assam and Arunachal is also the lower boundaries of Pakke TR
and Papum RF. Shades of dark green indicate forests in different elevations. Lighter green shades are cropland, second-
ary vegetation, flooded grasslands and bamboo. Whites are indicative of clouds, river beds and landslides. Blue depicts
water. Notice the density of roads in the southwest of Papum RF.
have been protected with successful breeding and chick production. However, ground observations
indicate increasing levels of illegal tree felling from 2016, with the use of chainsaws, hired labour
from outside and the transport of timber outside the state.
1.3 Aims and objectives
In this study, we aimed to 1) assess the extent of forest loss in the Papum RF which adjoins the
Pakke TR. Given that hornbills are a key faunal group that is functionally important and their
main nesting habitat lies in the foothill areas which are affected by illegal logging, we also aimed
to assess the loss of hornbill nesting habitat. Our specific purpose is to 1) estimate forest loss in
the Papum RF using satellite data at a fine-scale resolution (3, 5 m) from 2013 to 2017 and 2) to
determine forest loss within 1 km of hornbill nest trees at a fine-scale.
4Silva Fennica vol. 54 no. 3 article id 10373 · Sheth et al. · Persistent loss of biologically-rich tropical forests in …
2 Methods
2.1 Study area
Papum RF covers an area of 1064 km2 and adjoins Pakke TR (Fig. 1; 861.95 km2, 92.5932°–
93.1006°N; 26.9351°–27.2283°E). Based on historical climate data (average monthly temperature
and precipitation 1970–2000; Fick and Hijmans 2017), Papum RF receives an average total annual
rainfall of 2289 mm. Most (93.4%) of the rainfall occurs during the monsoon months from April
to October. The dry season lasts from November to March and receives about 6.4% of the total
annual rainfall. The mean (± standard deviation) maximum temperature is 25.5 °C (±1.79) during
the month of August. Similarly, the mean (± standard deviation) minimum temperature is 13.6 °C
(±1.87) during the month of January. The annual mean (± standard deviation) temperature is 20.6 °C
(±4.35). The vegetation is classified as the Assam Valley tropical semi-evergreen forest (Champion
and Seth 1968). Papum RF has a similar floral and faunal composition to the adjoining Pakke TR.
Papum RF was constituted as a RF in 1960 where all extractive activities are prohibited
unless legally permitted (Indian Forest Act 1927). Part of Papum RF (346.25 km2) is included in
the buffer area of Pakke TR as per the National Tiger Conservation Authority (2012), India. Of
this 318.25 km2 is forested zone, while 28 km2 is demarcated as multiple use area (National Tiger
Conservation Authority 2012). Within Papum RF, there are 19 small towns/villages and settle-
ments with a population of 3789 (Census of India 2011). Towards the south and east, Papum RF
is bordered by Assam and Papum Pare district respectively. To the west, lies the Pakke river and
Pakke TR; and to the north are the community forests of Pakke Kessang. Nameri NP in neighbour-
ing Assam state is contiguous with Pakke TR in the south.
Although the total area is 1064 km2, for this study, we marked out an area of 737 km2 for
classifying the forest and analysis of change in forest cover (Fig. 1). We restrict our analyses to
70% of the total area for two reasons: 1) the geographical focus of the HNAP program is within this
area, 2) the boundary of entire Papum RF is uncertain and 3) the region of our analysis also forms
part of the buffer area of neighboring Pakke TR. A digitized boundary of Papum RF (737 km2,
including a 500-m buffer; 92.9209°–93.2826°N; 26.9446°–27.2116°E) was used for the analyses.
2.2 RapidEye and PlanetScope satellite data processing and image classification
To conduct a supervised image classification, all satellite images were pre-processed by Planet-
Labs before analysis. For example: ortho-rectified radiance/reflectance data of the RapidEye (5 m
spatial resolution in 5 spectral bands) and PlanetScope (3 m spatial resolution in 4 spectral bands)
constellations were obtained to ensure a complete cloud-free coverage of the Papum RF region
[for a list of images analysed refer to Table S3 in Suppl. file S1; refer Planet Labs Inc. (2019) for
dataset descriptions and spectral bands]. We used fine-scale satellite images for land-cover clas-
sification as this resolution can robustly resolve forest loss and other ecological phenomena below
the 30-m scale (Hansen et al. 2013; Milodowski et al. 2017). Ortho-rectification (a process of
image correction to account for irregular topography) is applied to ensure the same geographical
region is analyzed year-to-year within a region of interest (ROI) (Tucker et al. 2004). Scenes were
chosen if they were entirely cloud-free and taken by the same satellite on the same day, thereby
preventing complications of image stitching and loss of information due to cloud cover. Datasets
from both satellite constellations were combined to include the oldest possible year of fine-scale
data (2011), and whenever RapidEye data was unavailable for analyses (example data after 2016).
Each satellite scene (or partial scene) was independently classified as forest, non-forest and
logged-forest using the randomForest library 4.6-14 (Liaw and Wiener 2002) in the R software for
5Silva Fennica vol. 54 no. 3 article id 10373 · Sheth et al. · Persistent loss of biologically-rich tropical forests in …
statistical computing (R version 3.3. R Core Development Team 2016). Ground-control polygons
(GCPs) were identified within the three land-cover classes by using a combination of field sampling
(using a global positioning unit) and Google Earth imagery. Forest regions comprised GCPs of
closed canopy forests with little or no detectable anthropogenic disturbance. Non-forest regions
comprised water bodies, grasslands, permanent settlements, sand bars and landslides. Logged-forest
GCPs were defined using ground reports of active/past logging, studying satellite images at GFW
deforestation hot-spots, and for roads, new clearings, plantations and fire scars. Logged-forest GCPs
generally comprise areas previously under forest but currently with higher albedo than forest. The
shape of the clearings are often geometrical and close to older forest clearings. Roads are linear in
shape with the lower slope scarred with discarded debris. The training datasets of the above three
classes consisted of at least 40 GCP’s and ca. 29 million pixels, per year.
Land-cover classification of the entire Papum RF using fine-scale data was only possible for
the years (2013, 2014, 2017), where these scenes fulfilled the above coverage criteria. However,
the forest loss analysis around the hornbill nest trees utilized images from 2011–2019.
2.3 Land cover change around hornbill nest trees
The HNAP is confined to the lower and south-western parts of Papum RF (Fig. 1) that fall within
Seijosa circle – from Darlong up to Jolly/Lanka in the north and towards the Mabuso 2/Margasso
settlements to the east, within Pakke-Kessang district.
To investigate if the habitat around 29 protected hornbill nest trees (17 Oriental Pied Horn-
bill, 9 Great Hornbill and three Wreathed Hornbill nests) were affected by forest loss, scenes that
covered >90% of the hornbill nest sites were chosen. Cloud-free, single day scenes were avail-
able and could be analysed from 2011 to 2019. This allowed us to make comprehensive fine-scale
forest loss estimations for 9 years. Cloud-free satellite images for all years were from November-
December, except for 2018 and 2019 which were from April–May (dry season). During the dry
season, secondary vegetation in clear felled areas is visibly dissimilar from primary forest. While
we do not test for this difference, we think the visible difference may be attributed to the drying
and browning of vegetation in the summer season when soil moisture and rainfall are low. Sec-
ondary vegetation in winter months (post-monsoon October–February) are visibly greener as the
soil moisture is still high. An identical approach (to that used for classifying forest loss in Papum
RF) was implemented to classify the area around 29 hornbill nests. A 1-km buffer was created and
the satellite scenes were clipped to the buffered extent (48 km2). Three land-cover classes were
defined (see above) comprising 20 GCPs and ca. 2 million pixels (RapidEye data) or ca. 5 million
pixels (PlanetScope data, refer to Table S3 in Suppl. file S1).
The spatial accuracy of the land-cover classification was assessed by manual checking of
the scenes combined with a stratified random sampling method (Olofsson et al. 2014). A random
sample of every land-cover class in each training dataset was used to test the accuracy of the clas-
sified image providing a bias corrected estimate of land-cover area in each class. The associated
standard errors, prediction accuracy and rates of commission and omission errors were estimated
as recommended by Olofsson et al. (2014). The prediction accuracy and standard error of the
classification (for three years’ of RapidEye data) is 98.4 ± 3.0%. For forest loss estimates around
hornbill nest sites, the prediction accuracy is 96.4 ± 7.5%. Accuracy statistics and confusion matrices
for both Papum RF and the nest-sites are tabulated in the supplementary material (Table S4 and
Table S5 in Suppl. file S1).
Our analyses combined results from both satellite datasets as we found the prediction accura-
cies to be comparable. Image classification prediction accuracies were estimated using the methods
recommended in Olofsson et al. (2014). A two-sample randomization test was performed on the
6Silva Fennica vol. 54 no. 3 article id 10373 · Sheth et al. · Persistent loss of biologically-rich tropical forests in …
distribution of all possible differences between accuracies of the observed years and then compared
to the observed difference between the mean accuracies of the respective datasets (observed dif-
ference in mean accuracy = 0.03351667, p = 0.2457542; Manly 1991).
The annual rate of forest area loss was calculated on the classified land-cover images using
a modified compound-interest-rate formula from Puyravaud (2003) for its mathematical clarity
and biological relevance:
100 A
P ln 2 (1)
t2
t1 A1
where A1 and A2 is the forest area at time period t1 and t2, respectively. P is the annual percentage
of area lost; ln is the natural logrithm.
3 Results
3.1 Forest loss in Papum RF: 2013–2017
There was very high forest loss in Papum RF as determined from analysis at a fine-scale resolu-
tion. Table 1 shows the loss of forest from 2013–2017 within Papum RF. While 81% of the RF
was under forest in 2013, it declined to around 76% in 4 years. The area under forest, as of winter
2017, is 561 km2 (Fig. S2 in Suppl. file S1). From 2013 to 2017, there was a loss of 32.8 km2 of
forest, with an increase in logged-forest (27.22 km2) and of area under non-forest (4.76 km2). Out
of a total area of 737 km2 classified, 156 km2 was logged-forest by 2017.
Our analyses recorded forest loss to be lower in 2017 than in 2014, for two reasons: (1) an
area (ca. 5 km2) in the eastern part of Papum RF was logged in 2014 but shows growth of secondary
vegetation in 2017. The spectral nature of this 5 km2 area is very similar to forest and in 2017, the
area is classified as forest. (2) Images in 2017 had a higher illumination elevation angle (46.05°),
than in 2014 (39.48°), illuminating mountain slopes and forests that were previously under shadows.
The illumination of river beds in 2017 also explains the increase in non-forest areas. The annual
rate of forest area loss was 1.4% year–1 corresponding to 8.2 km2 year–1.
3.2 Forest loss around hornbill nests: 2011–2019
Forest area consistently dropped from 2011 to 2016, then increased in 2017, and decreased again
up to 2019 (Fig. 2). The increase in 2017 is perhaps a measuring error due to growth of secondary
vegetation in logged-forest and/or because two different satellite data products were used in 2016
Table 1. Forest loss in the Papum Reserve Forest (RF), Khellong Forest Divi-
sion, Arunachal Pradesh, north-east India. Forest loss was quantified using Rapi-
dEye data for 2013, 2014, 2017. The total area of the Papum RF that was classi-
fied was 737 km2. Numbers in parentheses indicate percentages (%).
Year Logged-forest in km2 (%) Forest in km2 (%) Non-forest in km2 (%)
2013 128.8 (17.5) 593.8 (80.8) 14.3 (1.9)
2014 166 (22.5) 556.5 (75.5) 14.3 (1.9)
2017 156 (21.2) 561 (76.2) 19 (2.6)
7Silva Fennica vol. 54 no. 3 article id 10373 · Sheth et al. · Persistent loss of biologically-rich tropical forests in …
Fig. 2. Plot showing change in area of three land-cover types from 2011 to 2019 within a 1 kilometre buffer
around the 29 hornbill nest sites in Papum Reserve Forest, Khellong Forest Division, Arunachal Pradesh, north-
east India.
and 2017. Different satellite data products may measure vegetation spectral information differently.
The error may also lie in the data collected by the land-cover class GCPs for 2017. Such an error
may arise from difficulties in ascertaining secondary and primary forest in this landscape.
By 2019, only 45% of the 48 km2 of the 1-km buffer area around 29 hornbill nests was
forested as compared to 80% in 2011 (Table 2). Forest loss is also evident from the construction
of roads, burn scars and clear-cut felling of primary forest areas (Fig. S3 in Suppl. file S1). During
the period from 2011 to 2015, the total forest loss around nest trees was about 6 km2, however
Table 2. Forest loss in a 1-kilometre (km) radius around 29
hornbill nests in the Papum Reserve Forest, Khellong Forest
Division, Arunachal Pradesh, north-east India; 2011–2019.
Year Forest area km2 Percentage Forest area
2011 38.55 79.71
2012 38.52 79.66
2013 36.92 76.35
2014 34.09 70.49
2015 32.01 66.75
2016 28.90 59.50
2017 32.37 66.93
2018 23.78 48.95
2019 21.94 45.17
8Silva Fennica vol. 54 no. 3 article id 10373 · Sheth et al. · Persistent loss of biologically-rich tropical forests in …
this increased to a loss of 4 km2 in just one year in 2016, followed by a gain shown in 2017, with
a loss of 8.59 km2 showing up in 2018 (Table 2). In the last 9 years, there has been a total loss of
16.61 km2 in a 1 km buffer around the 29 nest sites (Fig. 2). Annual rate of forest area loss around
the nest trees was 7% year–1, corresponding to 2.07 km2 year–1.
Our field observations and media reports show that tree felling increased after 2015 and coin-
cided with the use of chainsaws and hired labour from Assam. After 2015 we frequently observed
trucks transporting timber in the night using various routes for covert transport. From 2017, streams
were used as roads to transport logs effectively destroying the natural aquatic ecosystem.
4. Discussion
4.1 Forest loss and its consequences
Forest loss has serious consequences for tropical biodiversity, as the destruction of suitable habitat
threatens the survival of forest specialist species (Tracewski et al. 2016). Several prior studies in
the area have documented the negative effects of logging on key faunal groups, vegetation structure
and composition, food abundance and seed dispersal (Datta 1998; Datta and Goyal 2008; Sethi
and Howe 2009; Velho et al. 2012; Naniwadekar et al. 2015b). Selective logging on a commercial
scale was practiced in these RFs until the Supreme Court ban on timber extraction in 1996 (Datta
1998; Datta and Goyal 2008). However, illegal timber felling continued to occur in some pockets
despite the ban. Forest loss and degradation continued due to various other factors. Several cur-
rent settlements existed prior to the declaration of the RF, however the region’s population has
grown subsequently leading to ambiguity and conflict in terms of people’s land rights and legal
status of forests in the area. After devastating floods in May 2004, many families lost agricultural
land to erosion, and some areas along the Assam-Arunachal border were occupied in anticipation
of future needs. Over the last decade, most households stopped cultivating due to loss of land to
floods and crop damage by elephants (Tiwari et al. 2017). Rubber and tea plantations also came
up in the lower areas bordering Assam after 2007. These factors have led to some forest cover
loss along the border areas in the 2001–2009 period. Apart from the forest loss due to these fac-
tors, until 2011–2012, timber extraction in the Seijosa area was mainly for household needs and
subsistence use by people.
The loss of 32.8 km2 of forest over 4 years within Papum RF is a cause for concern also
because the area receives heavy rainfall often resulting in floods and landslides. The depletion of
tropical forests in Papum RF severely threatens the future subsistence needs of the local and regional
population. Although we do not explicitly test for these effects of deforestation, it is expected that
landslides will increase if forest cover is lost at such a rapid rate (Bradshaw et al. 2007; Kumar and
Bhagavanulu 2008; Horton et al. 2017; Stanley and Kirschbaum 2017). Soils along river valleys
are destabilized accelerating river erosion rates (Horton et al. 2017) and amplifying flood risk and
severity (Bradshaw et al. 2007). In mountainous regions, deforestation weakens slopes exacerbat-
ing rainfall-triggered landslides (Kumar and Bhagavanulu 2008; Stanley and Kirschbaum 2017),
significantly altering river sedimentation and geomorphology (Latrubesse et al. 2009).
Additionally, deforestation alters local climate resulting in drier, warmer conditions and
reduced agricultural productivity (Lawrence and Vandecar 2015), decreases access to clean drinking
water (Mapulanga and Naito 2019), and has been associated with outbreaks of zoonotic diseases
(Olivero et al. 2017). Furthermore, with climate change rapidly altering weather patterns, securing
forests for their ecosystem services will be a pragmatic goal for all privileged and underprivileged
stake-holders as per several sustainable development goals laid out by the United Nations.
9Silva Fennica vol. 54 no. 3 article id 10373 · Sheth et al. · Persistent loss of biologically-rich tropical forests in …
Based on our study we recommend a constant monitoring of the state of forest cover by an
external agency to ensure that illegal logging has been stopped. Additionally, for better governance,
clarity in the use and ownership of forest land needs to be addressed under the law given that some
of the designated forest area is under settlements and multiple use areas by people.
4.2 Possible effects of illegal logging on hornbills
The loss of around 35% of the forest area around the hornbill nest trees from 2011 to 2019 is
alarming. From ca. 38 km2 in 2011, the area under forest declined to 21.94 km2 in 2019. The forest
cover change analysis shows that there has been loss and degradation of the surrounding nesting
habitat and hornbill food trees. Although, the HNAP has protected individual hornbill nest trees
and the immediate habitat surrounding the nest tree (Rane and Datta 2015) with an estimated 138
hornbill chicks have fledged from the protected nest trees from 2012 to 2019 (Datta and Pradhan
2019), the area within 1 km radius of nest trees has been considerably degraded by illegal logging.
The long-term average nest occupancy, for 8 years (2012–2019), in Pakke TR was 80%, while
in Papum RF, it was 67% (±14 standard deviation). Data for the two large-bodied species (Great
Hornbill and Wreathed Hornbill) was combined as there were only 3 Wreathed Hornbill nests. The
long-term average nest occupancy for the large-bodied hornbills was 59.68%, while it was 72.58%
for the Oriental Pied Hornbill. Nest occupancy by large-bodied hornbills was below the long-term
average for these species in following years: 2013, 2015, 2016, 2017, 2018 (Fig. S4 in Suppl.
file S1). These results suggest some disturbance effects on nesting success due to illegal logging.
However, it is difficult to attribute it primarily to logging, as nest occupancy by hornbills can be
determined by factors such as nest cavity suitability, nest occupation by other birds and mammals,
inter-specific competition for nest cavities and decisions by hornbill pairs to nest in a given year.
However, the illegal logging will likely have negative consequences for hornbill nesting
and persistence in the Papum RF. Tree density/basal area and food and nest tree density is consid-
erably lower in the RF than in the Pakke TR (Datta et al. unpublished data). An earlier study has
documented the negative effects of logging on hornbills and vegetation structure and composition
in the area (Datta 1998; Datta and Goyal 2008). Logging also reduces food abundances for horn-
bills and together with hunting has consequences for seed dispersal by hornbills (Sethi and Howe
2009; Naniwadekar et al. 2015b). In any case, while most of the earlier studies have all looked at
the effects of “selective” logging after some years since logging or when the logging was officially
permitted before 1996, this study notes the alarming loss of forest (despite the 1996 Supreme Court
ban) and the lack of any government working plan under which the current logging is occurring
within Papum RF.
Hornbills are highly mobile species with large home ranges, and nesting males move from
the RF to the Pakke TR to forage for fruits. (Naniwadekar et al. 2019). However, despite their
ability to move between these areas, a continuing loss of forest cover will result in nest trees in
the RF becoming inactive. As the forest is becoming more degraded and is being logged it has
also become more common to find only nests of the more adaptable Oriental Pied Hornbill in the
RF (Datta and Pradhan 2019), which is more common in open secondary forests (Datta 1998).
The tree felling occurs mainly in the drier months starting from September to March-April,
but in some years, illegal logging activity has continued into the wet monsoon months. March is the
beginning of the breeding season for the Great Hornbill and Wreathed Hornbill when the females
start entering the nest cavities, sealing them and laying eggs. Apart from the direct loss of forest
habitat and individual trees, the sound of chainsaws, movement and presence of hired labour in
camps and trucks results in disturbance during this critical time in the hornbill breeding season. It
is likely that hornbill breeding is being negatively affected by the ongoing illegal logging activities
10Silva Fennica vol. 54 no. 3 article id 10373 · Sheth et al. · Persistent loss of biologically-rich tropical forests in …
which has increased in intensity in the last 2–3 years. Our long-term monitoring of hornbill roost
sites located along the southern boundary of Pakke TR near the Pakke River, also shows move-
ment of hornbills from Pakke TR to the Papum RF. The disturbance from illegal logging and loss
of habitat, may also affect the use of roost sites by hornbills in the future.
4.3 Challenges and lessons for forest classification in the Eastern Himalaya
One of the challenges in our study was the strict classification of land-cover as forest, non-forest
and logged-forest. Our ROI includes areas that often flood in the monsoon changing the percent-
ages of land-cover every year. New road construction or mining in recently logged forests can be
classified as non-forest, while previously cleared primary forest can show regrowth as secondary
vegetation. The difficult terrain in the region makes robust collection of ground-control points
challenging. Hence, we make the following suggestions: 1) dry summer season images are best to
distinguish secondary and non-woody vegetation from primary forest; 2) a binary classification
system of forest and non-forest; 3) forest loss estimations within a completely forested region such
that loss in later years can be detected using year-to-year image subtraction techniques; and 4)
pooling data from different satellite datasets can yield comparable and highly accurate estimates
of land-cover change in the Eastern Himalaya.
5 Conclusions
To conclude deforestation rates are alarming in Papum RF with annual loss rates as high as
8.2 km2 year–1, as per estimates from 2013–2017 where forest cover declined to 76% of the total
RF area. Our results show the loss and degradation of critical hornbill habitat underscoring the
need for habitat conservation efforts to aid ongoing protection of hornbill nest trees.
We also find that both 3 and 5 m datasets have comparable land-cover prediction accuracy,
indicating a trade-off between fewer bands and finer resolution versus more bands and coarser
resolution imagery. Creation of land-cover maps in the Eastern Himalaya require careful inter-
pretation of spectral data based on GCPs, as the influence of seasons and terrain on forest cover
classification can be confounding. We provide suggestions that can improve efforts in monitoring
and mapping forest cover in the Eastern Himalaya. Despite the limitations of our study, our work
is a step towards achieving accurate forest loss estimates in an under-explored, challenging region
with exceptional forests and biodiversity.
Code availability
The code for image classification is publicly available on https://github.com/monsoonforest/defor-
estation/blob/master/randomForest-image-classification.
Data availability
RapidEye and PlanetScope datasets are not openly available as Planet Labs (www.planet.com) is
a commercial company. CS obtained the datasets through Planet Lab’s Education and Research
program (www.planet.com/markets/education-and-research/). The classified land-cover datasets
can be made available upon request from the authors.
11Silva Fennica vol. 54 no. 3 article id 10373 · Sheth et al. · Persistent loss of biologically-rich tropical forests in …
Acknowledgments
We thank Rohit Naniwadekar, TR Shankar Raman, Divya Mudappa, Kulbhushansingh Suryawan-
shi, Charudutt Mishra for comments on earlier drafts of the paper. We thank the field staff and
nest protectors from the Nyishi community for monitoring and protecting the hornbill nests. CS
is grateful to M. Raghurama, S. Virdi and S. Pulla for suggestions that improved the analyses. We
are grateful to Planet Labs for providing free access to their data to CS via their education and
research program. We are grateful to J.-P. Puyravaud for reviewing the manuscript and for his valu-
able suggestions that have improved the article. We also thank Pekka Nygren and Matti Maltamo
for editing and reviewing our manuscript.
References
Ahti T., Dixit P.K., Singh K.P., Sinha G.P. (2002). Cladonia singhii and other new reports of Cla-
donia from the Eastern Himalayan region of India. The Lichenologist 34(4): 305–310. https://
doi.org/10.1006/lich.2002.0404.
Athreya R. (2006). A new species of Liocichla (Aves: Timallidae) from Eaglenest Wildlife Sanctu-
ary, Arunachal Pradesh, India. Indian Birds 2: 82–94.
Bradshaw C.J.A., Sodhi N.S., Peh K.S.H., Brook B.W. (2007). Global evidence that deforestation
amplifies flood risk and severity in the developing world. Global Change Biology 13(11):
2379–2395. https://doi.org/10.1111/j.1365-2486.2007.01446.x.
Census of India (2011). States census 2011. http://censusindia.gov.in/. [Cited 15 June 2019].
Champion H.G., Seth S.K. (1968). A revised survey of the forest types of India. Manager of Pub-
lications, Government of India, New Delhi, India. 404 p.
Curtis P.G., Slay C.M., Harris N.L., Tyukavina A., Hansen M.C. (2018). Classifying drivers of
global forest loss. Science 361(6407): 1108–1111. https://doi.org/10.1126/science.aau3445.
Dasgupta S., Hilaluddin (2012). Differential effects of hunting on populations of hornbills and impe-
rial pigeons in the rainforests of the Eastern Indian Himalaya. Indian Forester 138: 902–909.
Datta A. (1998). Hornbill abundance in unlogged forest, selectively logged forest and a plantation
in western Arunachal Pradesh. Oryx 32(4): 285–294. https://doi.org/10.1046/j.1365-3008.1998.
d01-58.x.
Datta A. (2001). An ecological study of sympatric hornbills and fruiting patterns in a tropical
forest in Arunachal Pradesh. Ph.D thesis submitted to Saurashtra University, Rajkot, Gujarat
(affiliate of Wildlife Institute of India). 245 p.
Datta A., Goyal S.P. (2008). Responses of diurnal squirrels to selective logging in western Arunachal
Pradesh. Current Science 95: 895–902.
Datta A., Naniwadekar R. (2015). Hope for hornbills. In: Hegan A. (ed.). No more endlings: saving
species one story at a time. Coalition Wild and The Wild Foundation.
Datta A., Pradhan K. (2019). Hornbill nest adoption program report. 34 p. https://www.ncf-india.
org/eastern-himalaya/hornbill-nest-adoption-program-2019-breeding-season.
Datta A., Rawat G.S. (2003). Foraging patterns of sympatric hornbills in the non-breeding
season in Arunachal Pradesh, north-east India. Biotropica 35(2): 208–218. https://doi.
org/10.1111/j.1744-7429.2003.tb00280.x.
Datta A., Rawat G.S. (2004). Nest site selection and nesting success of hornbills in Arunachal
Pradesh, north-east India. Bird Conservation International 14(S1): 249–262. https://doi.
org/10.1017/S0959270905000213.
Datta A., Rane A., Tapi T. (2012). Shared parenting: hornbill nest adoption program in Arunachal
12Silva Fennica vol. 54 no. 3 article id 10373 · Sheth et al. · Persistent loss of biologically-rich tropical forests in …
Pradesh. The Hindu Survey of the Environment. p. 88–97.
Fick S.E., Hijmans R.J. (2017). WorldClim 2: new 1 km spatial resolution climate surfaces for
global land areas. International Journal of Climatology 37(12): 4302–4315. https://doi.
org/10.1002/joc.5086.
Forest Survey of India (2003). State of Forest Report 2003. Ministry of Environment and Forests,
Government of India, Dehra Dun, India. https://fsi.nic.in/documents/sfr_2003_hindi.pdf.
Forest Survey of India (2005). State of Forest Report 2005. Ministry of Environment and Forests,
Government of India, Dehra Dun, India. https://fsi.nic.in/sfr2005/arunachal_pardesh.pdf.
Forest Survey of India (2009). State of Forest Report 2009. Ministry of Environment and Forests,
Government of India, Dehra Dun, India. https://fsi.nic.in/sfr2009/arunachal_pradesh.pdf.
Forest Survey of India (2011). State of Forest Report 2011. Ministry of Environment and Forests,
Government of India, Dehra Dun, India. https://fsi.nic.in/cover_2011/arunchal_pradesh.pdf.
Forest Survey of India (2013). State of Forest Report 2013. Ministry of Environment and Forests,
Government of India, Dehra Dun, India. https://www.fsi.nic.in/forest-report-2013.
Forest Survey of India (2015). State of Forest Report 2015. Ministry of Environment and Forests,
Government of India, Dehra Dun, India. https://www.fsi.nic.in/forest-report-2015.
Forest Survey of India (2017). State of Forest Report 2017. Ministry of Environment and Forests,
Government of India, Dehra Dun, India. https://fsi.nic.in/isfr2017/arunachal-pradesh-isfr-2017.
pdf.
Gajurel P.R., Rethy P., Kumar Y. (2001). A new species of Piper (Piperaceae) from Arunachal
Pradesh, north-eastern India. Botanical Journal of the Linnean Society 137(4): 417–419.
https://doi.org/10.1006/bojl.2001.0486.
Gibbs H.K., Ruesch A.S., Achard F., Clayton M.K., Holmgren P., Ramankutty N., Foley J.A.
(2010). Tropical forests were the primary sources of new agricultural land in the 1980s and
1990s. Proceedings of the National Academy of Science USA 107(38): 16732–16737. https://
doi.org/10.1073/pnas.0910275107.
Gibson L., Lee T.M., Koh L.P., Brook B.W., Gardner T.A., Barlow J., Peres C.A., Bradshaw
C.J.A., Laurance W.F., Lovejoy T.E, Sodhi N.S. (2011). Primary forests are irreplaceable for
sustaining tropical biodiversity. Nature 478: 378–383. https://doi.org/10.1038/nature10425.
Global Forest Watch (2020). Tree cover loss in India. https://gfw2-data.s3.amazonaws.com/count-
ry-pages/country_stats/download/IND.xlsx. [Cited 2 June 2020].
Hansen M.C., Potapov P.V., Moore R., Hancher M., Turubanova S.A., Tyukavina A., Thau D.,
Stehman S.V., Goetz S.J., Loveland T.R., Kommareddy A., Egorov A., Chini L., Justice C.O.,
Townshend J.R.G. (2013). High-resolution global maps of 21st-century forest cover change.
Science 342(6160): 850–853. https://doi.org/10.1126/science.1244693. http://earthenginepart-
ners.appspot.com/science-2013-global-forest/download_v1.6.html.
Horton A.J., Constantine J.A., Hales T.C., Goossens B., Bruford M.W., Lazarus E.D. (2017).
Modification of river meandering by tropical deforestation. Geology 45(6): 511–514. https://
doi.org/10.1130/G38740.1.
Indian Forest Act (1927). Act XVI of 1927 (as modified up to 15 June 1951). Government of India.
http://extwprlegs1.fao.org/docs/pdf/ind3171.pdf. [Cited 17 June 2019].
Integrated Taxonomic Information System (2020). Integrated taxonomic information system on-
line database. http://www.itis.gov. [Cited 5 June 2020].
Khandekar N. (2019). Between tradition and trafficking: opium in Arunachal. https://www.theth-
irdpole.net/en/2019/05/08/between-tradition-and-trafficking-opium-in-arunachal-pradesh/.
[Cited 8 May 2019].
Kumar S.V., Bhagavanulu D.V.S. (2008). Effect of deforestation on landslides in Nilgiris district
– a case study. Journal of the Indian Society of Remote Sensing 36 article 105. https://doi.
13Silva Fennica vol. 54 no. 3 article id 10373 · Sheth et al. · Persistent loss of biologically-rich tropical forests in …
org/10.1007/s12524-008-0011-5.
Kushwaha S.P., Hazarika R. (2004). Assessment of habitat loss in Kameng and Sonitpur Elephant
Reserves. Current Science 87: 1447–1453.
Latrubesse E.M., Amsler M.L., de Morais R.P., Aquino S. (2009). The geomorphologic response
of a large pristine alluvial river to tremendous deforestation in the South American tropics:
the case of the Araguaia River. Geomorphology 113(3–4): 239–252. https://doi.org/10.1016/j.
geomorph.2009.03.014.
Lawrence D., Vandecar K. (2015). Effects of tropical deforestation on climate and agriculture.
Nature Climate Change 5: 27–36. https://doi.org/10.1038/nclimate2430.
Liaw A., Wiener M. (2002). Classification and regression by randomForest. R News 2(3): 18–22.
Mamai J. (2018). Rampant destruction of forests in Namdang. Arunachal Times, November
26, 2018. https://arunachaltimes.in/index.php/2018/11/26/rampant-destruction-of-forests-in-
namdang/.
Manly B.F. (1991). Randomization, bootstrap and Monte Carlo methods in biology. Chapman and
Hall/CRC. 480 p.
Mapulanga A.M., Naito H. (2019). Effect of deforestation on access to clean drinking water. Pro-
ceedings of the National Academy of Sciences 116(17): 8249–8254. https://doi.org/10.1073/
pnas.1814970116.
Mazoomdar J. (2011). Where the forests have no trees. http://www.openthemagazine.com/article/
nation/where-the-forests-have-no-trees/. [Cited 19 May 2013].
Milodowski D.T., Mitchard E.T.A., Williams M. (2017). Forest loss maps from regional satel-
lite monitoring systematically underestimate deforestation in two rapidly changing parts
of the Amazon. Environmental Research Letters 12(9) article 094003. 11 p. https://doi.
org/10.1088/1748-9326/aa7e1e.
Mittermeier R.A., Gil P.R., Hoffman M., Pilgrim J., Brooks T., Mittermeier C.G., Lamoreux J., Da
Fonseca G.A.B., Saligmann P.A. (2004) Hotspots revisited: earth’s biologically richest and
most endangered terrestrial ecoregions cemex. CEMEX, Agrupación Sierra Madre, Mexico
City. 392 p.
Mishra C., Datta A. (2007). A new bird species from Eastern Himalayan Arunachal Pradesh – India’s
biological frontier. Current Science 92: 1205–1206.
Naniwadekar R., Mishra C., Isvaran K., Madhusudan M.D., Datta A. (2015a). Looking beyond
parks: the conservation value of unprotected area for hornbills in Arunachal Pradesh, Eastern
Himalaya. Oryx 49(2): 303–311. https://doi.org/10.1017/S0030605313000781.
Naniwadekar R., Shukla U., Isvaran K., Datta A. (2015b). Reduced hornbill abundance associated
with low seed arrival and altered recruitment in a hunted and logged tropical forest. PLoS
ONE 10(3) article e0120062. https://doi.org/10.1371/journal.pone.0120062.
Naniwadekar R., Rathore A., Shukla U., Chaplod S., Datta A. (2019). How far do Asian hornbills dis-
perse seeds? Acta Oecologica 101 article 103482. https://doi.org/10.1016/j.actao.2019.103482.
National Tiger Conservation Authority of India (2012). https://projecttiger.nic.in/content/109_1_
ListofTigerReservesCoreBufferAreas.aspxref. [Cited 15 June 2019].
Olivero J., Fa J.E., Real R., Márquez A.L., Farfán M.A., Vargas J.M., Gaveau D., Salim M.A.,
Park D., Suter J., King S. (2017). Recent loss of closed forests is associated with Ebola virus
disease outbreaks. Scientific Reports 7(1): 1–9. https://doi.org/10.1038/s41598-017-14727-9.
Olofsson P., Foody G.M., Herold M., Stehman S.V., Woodcock C.E., Wulder M.A. (2014). Good
practices for estimating area and assessing accuracy of land change. Remote Sensing of Envi-
ronment 148: 42–57. https://doi.org/10.1016/j.rse.2014.02.015.
Pandit M.K., Sodhi N.S., Koh L.P., Bhaskar A., Brook B.W. (2007). Unreported yet massive defor-
estation driving loss of endemic biodiversity in Indian Himalaya. Biodiversity and Conserva-
14Silva Fennica vol. 54 no. 3 article id 10373 · Sheth et al. · Persistent loss of biologically-rich tropical forests in …
tion 16: 153–163. https://doi.org/10.1007/s10531-006-9038-5.
Planet Labs Incorporate (2019). Planet imagery product specifications. August 2019. https://assets.
planet.com/docs/combined-imagery-product-spec-final-august-2019.pdf.
Praveen J., Jayapal R., Pittie A. (2019). Checklist of the birds of India (v2.3). http://www.indian-
birds.in/india/. [Cited 15 January 2019].
Press Trust of India (2017). Illegal logging on the rise in Arunachal PTI, India Today, Novem-
ber 24, 2017. https://www.indiatoday.in/pti-feed/story/illegal-logging-on-the-rise-in-
arunachal-1093159-2017-11-24.
Puyravaud J.P. (2003). Standardizing the calculation of the annual rate of deforestation. Forest Ecol-
ogy and Management 177(1–3): 593–596. https://doi.org/10.1016/S0378-1127(02)00335-3.
Puyravaud J.P., Davidar P., Laurance W.F. (2010a). Cryptic destruction of India’s native forests.
Conservation Letters 3(6): 390–394. https://doi.org/10.1111/j.1755-263X.2010.00141.x.
Puyravaud J.P., Davidar P., Laurance W.F. (2010b). Cryptic loss of India’s native forests. Science
329(5987): 1–32. https://doi.org/10.1126/science.329.5987.32-b.
R Core Team (2016). R: a language and environment for statistical computing. R Foundation for
Statistical Computing, Vienna, Austria. https://www.R-project.org/.
Rane A., Datta A. (2015). Protecting a hornbill haven: a community-based conservation initiative
in Arunachal Pradesh, north-east India. Malayan Nature Journal 67: 203–218.
Rina T. (2017). Large-scale timber logging in Papum Reserve Forest. Arunachal Times, April 20,
2017. https://www.arunachaltimes.in/archives/apr17 20.html.
Rina T. (2019). NGT steps in on illegal logging in Papum Reserve Forest. Arunachal Times, April
17, 2019. https://arunachaltimes.in/index.php/2019/04/17/ngt-steps-in-on-illegal-logging-in-
papum-reserve-forest/.
Sentinel Assam (2019). Illegal wooden logs worth Rs 4 lakh seized from LPG carrying truck in
Tezpur. The Sentinel, Assam. 28 January, 2019. https://www.sentinelassam.com/news/illegal-
wooden-logs-worth-rs-4-lakh-seized-from-lpg-carrying-truck-in-tezpur/.
Sethi P., Howe H.F. (2009). Recruitment of hornbill-dispersed trees in hunted and logged forests of
the Indian Eastern Himalaya. Conservation Biology 23(3): 710–718. https://doi.org/10.1111/
j.1523-1739.2008.01155.x.
Siliwal M., Molur S., Raven R. (2015). New genus with two new species of the family Nemesiidae
(Araneae: Mygalomorphae) from Arunachal Pradesh, India. Journal of Asia-Pacific Biodiver-
sity 8(1): 43–48. https://doi.org/10.1016/j.japb.2015.01.005.
Singh O., (2017). Forest statistics of Arunachal Pradesh. Government of Arunachal Pradesh. http://
arunachalforests.gov.in/notifications/Forest_statistics%20of%20Arunachal%20Pradesh-2017.
pdf.
Sinha A., Datta A., Madhusudan M.D., Mishra C. (2005). Macaca munzala: a new species from
western Arunachal Pradesh, northeastern India. International Journal of Primatology 26:
977–989. https://doi.org/10.1007/s10764-005-5333-3.
Srinivasan U. (2014). Oil Palm Expansion: Ecological threat to north-east India. Economic and
Political Weekly 49(36), 8 September, 2014.
Srinivasan U. (2018). Marginalisation, migration and militancy: the complexities of forest and
biodiversity loss on the Assam-Arunachal border. In: Srinivasan U., Velho N. (eds.). Conser-
vation from the Margins. Orient Black Swan. Hyderabad. p. 177–197.
Srivastava S., Singh T.P., Singh H., Kushwaha S.P.S., Roy P.S. (2002). Assessment of large-scale
deforestation in Sonitpur district of Assam. Current Science 82: 1479–1484
Stanley T., Kirschbaum D.B. (2017). A heuristic approach to global landslide susceptibility map-
ping. Natural Hazards 87: 145–164. https://doi.org/10.1007/s11069-017-2757-y.
Tamang L., Chaudhry S., Choudhury D. (2008). Erethistoides senkhiensis, a new catfish (Teleostei:
15Silva Fennica vol. 54 no. 3 article id 10373 · Sheth et al. · Persistent loss of biologically-rich tropical forests in …
Erethistidae) from India. Ichthyological Exploration of Freshwaters 19: 185–191
Teegalapalli K., Datta A. (2016). Shifting to settled cultivation: changing practices among the Adis
in Central Arunachal Pradesh, north-east India. Ambio 45: 602–612. https://doi.org/10.1007/
s13280-016-0765-x.
Tiwari S.K., Kyarong S., Choudhury A., Williams A.C., Ramkumar K., Deori D. (2017). Elephant
Corridors of North-Eastern India. Chapter 7 In: Menon V., Tiwari S.K., Easa P.S., Sukumar
R. (eds.). Right of passage: elephant corridors of India. Conservation Reference Series 3.
Tucker C.J., Grant D.M., Dykstra J.D. (2004). NASA’s global ortho-rectified Landsat data set.
Photogrammetric Engineering & Remote Sensing 70(3): 313–322. https://doi.org/10.14358/
PERS.70.3.313.
Tracewski L., Butchart S.H.M., Marco M.D., Ficetola G.F., Rondinini C., Symes A., Wheatley H.,
Beresford A.E., Buchanan G.M. (2016). Towards quantification of the impact of 21st century
deforestation on the extinction risk of terrestrial vertebrates. Conservation Biology 30(5):
1070–1079. https://doi.org/10.1111/cobi.12715.
Turubanova S., Potapov P.V., Tyukavina A., Hansen M.C. (2018). Ongoing primary forest loss in
Brazil, Democratic Republic of the Congo, and Indonesia. Environmental Research Letters
13(7) article 074028. https://doi.org/10.1088/1748-9326/aacd1c.
Velho N,. Srinivasan U., Prashanth N.S., Laurance W.F. (2011). Human disease hinders anti-
poaching efforts in Indian nature reserves. Biological Conservation 144: 2382–2385. https://
doi.org/10.1016/j.biocon.2011.06.003.
Velho N., Ratnam J., Srinivasan U., and Sankaran M. (2012). Shifts in community structure of
tropical trees and avian frugivores in forests recovering from past logging. Biological Con-
servation 153: 32–40. https://doi.org/10.1016/j.biocon.2012.04.028.
Velho N., Agarwala M., Srinivasan U., Laurance W.F. (2014). Collateral damage: impacts of ethno-
civil strife on biodiversity and natural resource use near Indian nature reserves. Biodiversity
and Conservation 23: 2515–2527. https://doi.org/10.1007/s10531-014-0735-1.
Velho N., Datta A., Datta-Roy A. (2016). An inclusive oil palm policy for people and biodiversity.
The Arunachal Times, 9 November, 2016. https://landportal.org/news/2016/11/inclusive-oil-
palm-policy-people-and-biodiversity.
Wasteland Atlas (2011). Wastelands atlas of India. National Remote Sensing Centre, Department
of Land Resources, Ministry of Rural Development, India. https://dolr.gov.in/sites/default/
files/Wastelands_Atlas_2011.pdf.
Wilson D.E., Reeder D.M. (eds.) (2005). Mammal species of the world: a taxonomic and geographic
reference. Johns Hopkins University Press.
Total of 82 references.
Supplementary files
S1.pdf, available at https://doi.org/10.14214/sf.10373.
16You can also read