D-region impact area of energetic electron precipitation during pulsating aurora - ANGEO
←
→
Page content transcription
If your browser does not render page correctly, please read the page content below
Ann. Geophys., 39, 135–149, 2021
https://doi.org/10.5194/angeo-39-135-2021
© Author(s) 2021. This work is distributed under
the Creative Commons Attribution 4.0 License.

D-region impact area of energetic electron precipitation
during pulsating aurora
Emma Bland1 , Fasil Tesema1,2 , and Noora Partamies1,2
1 Department   of Arctic Geophysics, University Centre in Svalbard, Longyearbyen, Norway
2 Birkeland   Centre for Space Science, University of Bergen, Bergen, Norway

Correspondence: Emma Bland (emma.bland@unis.no)

Received: 6 August 2020 – Discussion started: 18 August 2020
Revised: 14 December 2020 – Accepted: 17 December 2020 – Published: 10 February 2021

Abstract. A total of 10 radars from the Super Dual Auroral        thought to arise from chorus wave activity, whereby elec-
Radar Network (SuperDARN) in Antarctica were used to es-          trons from the radiation belts are scattered into the atmo-
timate the spatial area over which energetic electron precip-     spheric loss cone (Thorne et al., 2010; Kasahara et al., 2018).
itation (EEP) impacts the D-region ionosphere during pul-         The precipitating electrons typically have energies up to the
sating aurora (PsA) events. We use an all-sky camera (ASC)        order of 10–100 keV, depositing their energy into the up-
located at Syowa Station to confirm the presence of optical       per mesosphere/lower thermosphere region at approximately
PsAs, and then we use the SuperDARN radars to detect high         70–120 km altitude (Fang et al., 2008; Turunen et al., 2009;
frequency (HF) radio attenuation caused by enhanced ion-          Miyoshi et al., 2010; Tesema et al., 2020b). PsA-related elec-
isation in the D-region ionosphere. The HF radio attenua-         tron density enhancements have been observed at altitudes as
tion was identified visually by examining quick-look plots of     low as 68 km, corresponding to electron energies of at least
the background HF radio noise and backscatter power from          200 keV (Miyoshi et al., 2015; Turunen et al., 2016; Tesema
each radar. The EEP impact area was determined for 74 PsA         et al., 2020a).
events. Approximately one-third of these events have an EEP          Due to their high occurrence rates, PsAs are thought to
impact area that covers at least 12◦ of magnetic latitude, and    be a significant source of ionisation in the upper meso-
three-quarters cover at least 4◦ of magnetic latitude. At the     sphere/lower thermosphere region at high latitudes. Impact
equatorward edge of the auroral oval, 44 % of events have a       ionisation by EEP in this region leads to the production of
magnetic local time extent of at least 7 h, but this reduces to   odd-hydrogen (HOx = OH+HO2 ) and odd-nitrogen (NOx =
17 % at the poleward edge. We use these results to estimate       N + NO + NO2 ) chemical species, which act as catalysts in
the average size of the EEP impact area during PsAs, which        ozone depletion reactions. Tesema et al. (2020a) used the
could be used as a model input for determining the impact of      1D Sodankylä ion-neutral chemistry model (Verronen et al.,
PsA-related EEP on the atmospheric chemistry.                     2005; Turunen et al., 2009) to show that a typical PsA en-
                                                                  ergy spectrum applied for 120 min causes mesospheric odd-
                                                                  oxygen depletion of 69 %. This significant chemical response
                                                                  indicates that PsA-related EEP may also need to be in-
1   Introduction                                                  cluded in atmospheric/climate models, such as the Whole
                                                                  Atmosphere Community Climate Model (WACCM) (Marsh
Pulsating aurorae (PsAs) are diffuse auroral emissions which      et al., 2007), to properly capture the long-term impact of
exhibit quasi-periodic brightness fluctuations of about 2–20 s    EEP on natural climate variability. Currently, the EEP forc-
(Lessard, 2012; Nishimura et al., 2020). They are commonly        ing in WACCM is described using an Ap-index-based pa-
observed in the recovery phase of substorms, with the great-      rameterisation of particle flux measurements (van de Kamp
est occurrence rates in the early morning sector (Jones et al.,   et al., 2016) from the Polar Orbiting Environmental Satel-
2011; Bland et al., 2019; Grono and Donovan, 2020). The           lite (POES). Although the actual particle flux measurements
energetic electron precipitation (EEP) that produces PsA is

Published by Copernicus Publications on behalf of the European Geosciences Union.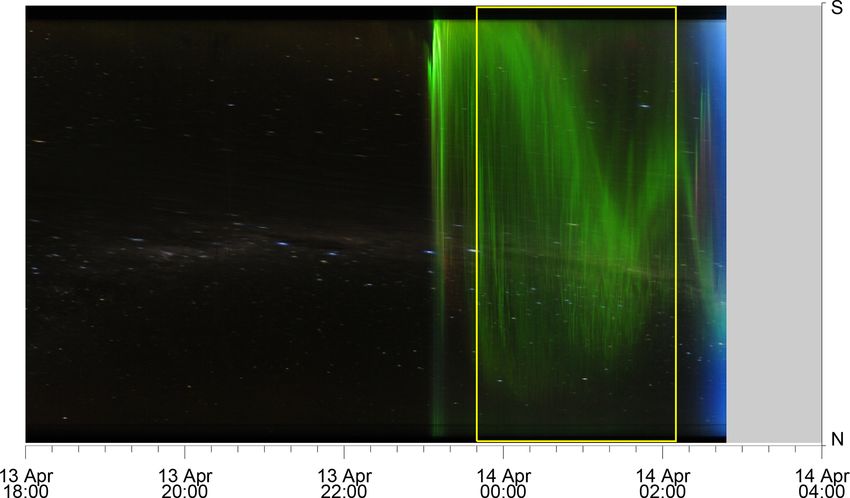
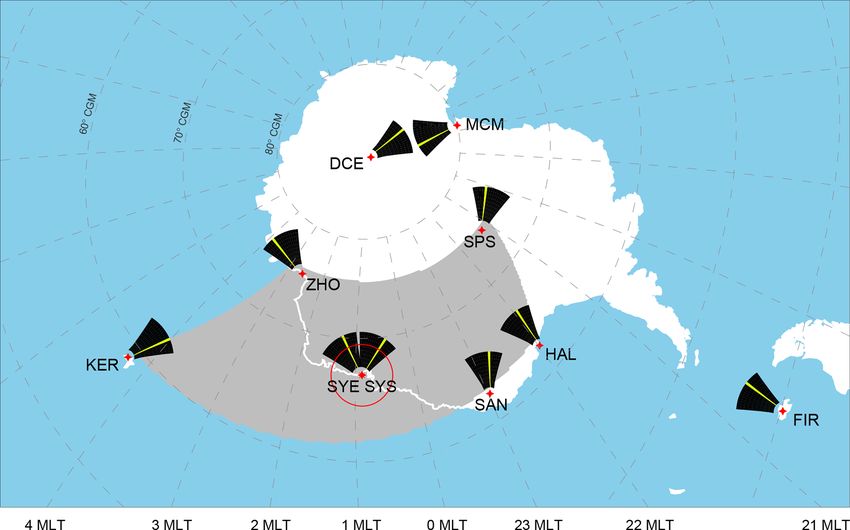
136                                                                                  E. Bland et al.: EEP impact area of PsA

from POES would include the PsA-related EEP, the param-            and imaging riometer (relative ionospheric opacity meter)
eterisation is unlikely to capture the contribution from PsAs      data, Tesema et al. (2020b) showed that the electron density
due to the poor correlation between PsA occurrence and ge-         enhancement below 100 km altitude was greatest for PPA-
omagnetic indices (e.g. Partamies et al., 2017). Pulsating au-     and PA-type events, indicating that these precipitating par-
rora may therefore represent a significant energy input to the     ticle populations have higher energies on average compared
atmosphere that is not currently captured in the forcing used      to APA. Although these conclusions are not consistent, they
for long-term modelling of natural climate variability.            show that it may be important to distinguish between the dif-
   To develop a more realistic EEP forcing for atmo-               ferent types of PsAs when characterising the middle atmo-
spheric/climate modelling applications that properly captures      spheric response to EEP.
the contribution from PsAs, characteristics of PsAs, such             Grono and Donovan (2019, 2020) provided new informa-
as occurrence rates, durations, energy spectra and spatial         tion about the occurrence probability of APA, PPA, and PA
coverage, need to be determined. PsA occurrence rates and          at different latitudes and MLTs. These results, however, do
event durations have been determined in several recent stud-       not provide information about the latitudinal and MLT ex-
ies which used observations from all-sky cameras (ASCs).           tent of individual events. This type of spatial coverage infor-
The median PsA event duration has been reported to be be-          mation is important for developing a realistic model input.
tween 1.4 and 2.25 h (Jones et al., 2011; Partamies et al.,        A single PsA event reported by Jones et al. (2013) spanned
2017; Bland et al., 2019), and one event lasting 15 h was re-      more than 10 h of MLT at its maximum, but this is proba-
ported by Jones et al. (2013). Jones et al. (2011) and Grono       bly much wider than average. Since optical observations of
and Donovan (2020) showed that PsAs are most common in             PsAs are possible only during periods of dark, clear skies,
the morning sector, with occurrence rates as high as 86 %          it is very difficult to obtain a data set that is large enough
at around 03:30–06:00 magnetic local time (MLT). Since             to estimate the statistical spatial coverage of PsAs. Further-
these occurrence rates were determined using optical data,         more, cameras provide no information about the precipitat-
the authors noted that the results are unreliable after about      ing particle energy spectrum, or, at best, they provide very
06:00 MLT when the observation time is restricted by sun-          limited information, such as the peak emission height (e.g.
light. Bland et al. (2019) made novel use of the Super Dual        Partamies et al., 2017). This type of information is important
Auroral Radar Network (SuperDARN) radar at Syowa Sta-              for determining whether a noticeable atmospheric chemical
tion, Antarctica, to show that D-region ionisation associated      response will occur. Tesema et al. (2020a) developed statisti-
with PsAs may continue up to about 10:00 MLT, when opti-           cal energy spectra for PsAs by combining satellite measure-
cal observations are not possible due to daylight.                 ments from 253 events and then used these results to model
   Our current knowledge of the spatial distribution of PsAs       the atmospheric chemical response to different levels of forc-
comes from a series of studies that used the Time His-             ing. They showed that not all PsAs have sufficient energy to
tory of Events and Macroscale Interactions during Substorms        produce a measurable chemical response. Therefore, PsA oc-
(THEMIS) all-sky camera network in Canada (Donovan                 currence rates and spatial coverage information determined
et al., 2006). THEMIS is well suited to studying the PsA spa-      from optical data alone may overestimate the forcing applied
tial coverage due to its large combined field of view. Grono       to the mesosphere–lower thermosphere region and the result-
and Donovan (2019) used three THEMIS cameras and two               ing chemical response.
meridian-scanning photometers to determine the upper and              The purpose of this study is to estimate the typical area
lower latitude boundaries of PsAs relative to the proton au-       over which PsA-related EEP has sufficient energy to reach
rora location to identify the source region of the precipitating   mesosphere–lower thermosphere altitudes (∼ 10–200 keV)
particle populations. Grono and Donovan (2020) then deter-         and, hence, produce a chemical response. We shall refer to
mined the occurrence probability of PsAs as a function of          this area as the EEP impact area. To perform this estimate, we
magnetic latitude and MLT. These studies made a distinction        use the fact that this higher energy precipitation causes en-
between different types of PsAs – amorphous PsAs (APA),            hanced ionisation in the D-region ionosphere, which in turn
patchy PsAs (PPA), and patchy aurora (PA) (see also Grono          attenuates high frequency (HF) radio waves. This attenuation
and Donovan, 2018) – based mainly on the spatial extent and        can be detected using SuperDARN HF radars, as previously
stability of the pulsations and their motion with the convec-      shown by Bland et al. (2019). In this study, we build upon
tion. These different PsA types were shown to have different       this work by using 10 SuperDARN radars in Antarctica to
source regions and occurrence distributions. APA was found         estimate the EEP impact area for different types of PsAs.
to have the highest occurrence rate and the widest spatial dis-
tribution in both latitude and MLT. APA was the dominant
PsA type observed in the pre-midnight sector, whereas all          2   Instrumentation
three types were detected in the early morning sector. Yang
et al. (2019) reported that APA were associated with stronger      SuperDARN is a global network of 36 HF radars primar-
cosmic noise absorption compared to PPA for a fixed auroral        ily designed for studying high-latitude plasma convection
brightness. In a larger study using incoherent scatter radar       (Greenwald et al., 1995; Chisham et al., 2007; Nishitani

Ann. Geophys., 39, 135–149, 2021                                                   https://doi.org/10.5194/angeo-39-135-2021
E. Bland et al.: EEP impact area of PsA                                                                                        137

et al., 2019). Recently, the radars have also been used            ionosphere. The Southern Hemisphere SuperDARN radars
to detect HF radio attenuation during shortwave fadeout            were chosen for this study because they generally detect
events (Watanabe and Nishitani, 2013; Berngardt et al., 2018;      larger amounts of backscatter on the nightside compared to
Chakraborty et al., 2018; Fiori et al., 2018), polar cap absorp-   the Northern Hemisphere radars. This is probably due to the
tion events (Bland et al., 2018; Chakraborty et al., 2019),        favourable orientation of the geomagnetic field relative to
and auroral absorption events including PsAs (Bland et al.,        the radar look directions and geographic latitudes. The near-
2019). HF radio attenuation events are identified in the Su-       continuous presence of backscatter on the nightside for most
perDARN radar data as periods of reduced backscatter power         Antarctic radars makes it straightforward to identify peri-
combined with a reduction in the background radio noise.           ods of reduced backscatter power caused by HF radio at-
The reduced backscatter power is caused by the attenuation         tenuation. An example of this procedure is given in Sect. 3.
of the transmitted radio waves in the ionosphere, which of-        Note that the three mid-latitude SuperDARN radars located
ten reduces the signal strength to below the detection thresh-     in Australia/New Zealand were not included in this study,
old (e.g. Bland et al., 2018). The reduced background noise        due to their very large spatial separation from the radars in
levels are caused by the attenuation of the background HF          Antarctica, so they are not shown in Fig. 1.
radio noise at the radar operating frequency. At the standard         The camera located at Syowa Station is a colour digital
SuperDARN operating frequencies of 8–20 MHz, this back-            camera fitted with a 8 mm f/2.8 fisheye lens. The imaging
ground radio noise is produced mainly by lightning activity        season lasts from April to October, and the camera is pro-
and propagates around the globe via ionospheric reflections.       grammed to capture images automatically whenever the Sun
The noise measurements can be used to estimate the attenu-         is more than 12◦ below the horizon. Exposure times are a
ation in decibels relative to a radar-specific quiet day curve,    few seconds, and the image cadence varies from about 6 to
using an approach analogous to riometry (Bland et al., 2018;       30 s. Daily keogram (quick-look) plots are constructed by
Berngardt, 2020). However, due to the high variability in the      taking a magnetic north–south slice through the all-sky im-
noise at the SuperDARN operating frequencies, producing            age and then placing these slices on a time axis. Similarly,
quiet day curves is not straightforward, and the methodology       an ewogram (east–west keogram) can be constructed using
is still being developed (Berngardt, 2020). Therefore, in this     a magnetic east–west slice. PsAs can be readily identified in
work, we adopt a more qualitative approach based on visual         these plots as patchy auroral displays (e.g. Jones et al., 2013;
identification of HF attenuation events in quick-look plots.       Partamies et al., 2017; Yang et al., 2017), but the original all-
   In this study we have used 10 SuperDARN radars located          sky images are normally required to determine the PsA type
in Antarctica and also an all-sky colour digital camera lo-        (APA, PPA, and PA).
cated at Syowa Station. The locations of the radars and the
all-sky camera are shown in Fig. 1. The grey shading and
magnetic local time (MLT) contours in Fig. 1 relate to the ex-     3   Example event – 14 June 2015
ample event described Sect. 3. The red circle shows the ASC
field of view projected to 100 km height. The radar fields of      Our method for visually identifying signatures of HF radio
view are shown in black, and beam 5 for each radar is shaded       attenuation is illustrated using Fig. 2. The 12 h time interval
yellow. For simplicity, we show only the near-range field of       shown commenced at 18:00 universal time (UT) on 13 June
view of each radar (180–600 km in range), which is the ap-         2015. This figure shows the magnetic north–south keogram
proximate area in which the transmitted radio waves pass           plot for the all-sky camera at Syowa Station and the back-
through the D-region ionosphere. This estimate is based on         ground noise and power measurements for each radar with
the vertical extent of the radars’ antenna radiation patterns      available data. The panels are arranged in order of magnetic
extending from roughly 10 to 50◦ from the horizontal (e.g.         latitude, but it should be noted that the radars are located over
Milan et al., 1997). Each radar’s total field of view extends to   a wide range of longitudes (see Fig. 1). The keograms are
over 3500 km in range, creating significant overlap between        identical in both columns, with magnetic south at the top. The
the fields of view, which is useful for measuring the F-region     yellow vertical lines in the keogram plots indicate the onset
ionospheric convection (e.g. Nishitani et al., 2019, Fig. 1b).     and end times of a PsA event observed over Syowa Station
Each SuperDARN radar consists of a linear array of log-            on 14 June 2015. This is an APA event which occurred in the
periodic or twin-terminated folded dipole antennas which are       recovery phase of a substorm. There is a second APA event
phased electronically to produce a beam which can be steered       in this time interval which commences at 04:20 UT, but for
in 16 different azimuthal directions. This beam is narrow in       the purposes of illustrating our event selection, we will fo-
azimuth (∼ 3.5◦ ) but has a wide vertical extent (∼ 40◦ ). The     cus on the first event at 00:40–02:20 UT. No data were avail-
16 beams are scanned sequentially every minute, with a ∼ 3 s       able from either the Falkland Islands (FIR) radar or the South
integration time for each beam.                                    African National Antarctic Expedition (SAN) radar during
   SuperDARN radars detect coherent backscatter from elec-         this time interval, so they are not included in the figure.
tron density structures in the E-region and F-region iono-            The first column of Fig. 2 shows the background noise
spheres and also from the ground, following reflection in the      measurements from each beam of each radar. The noise data

https://doi.org/10.5194/angeo-39-135-2021                                                    Ann. Geophys., 39, 135–149, 2021
138                                                                                            E. Bland et al.: EEP impact area of PsA

Figure 1. Locations and fields of view of the SuperDARN radars and all-sky camera used in this study. Instrument locations are shown by
red symbols. The red circle indicates the camera field of view, and the black shading indicates the radar fields of view. The position of beam 5
for each radar is shaded yellow. Only the first 600 km of the radar fields of view are shown, which is the area in which the radio waves are
expected to pass through the D-region ionosphere. The grey shading shows the spatial coverage of the energetic electron precipitation impact
area for the example pulsating aurora event on 14 June 2015, 00:40–02:20 UT. Dashed grey lines indicate corrected geomagnetic (CGM)
latitude and magnetic local time (MLT) contours.

have been binned into 10 min intervals and averaged sepa-                 from ionospheric electron density irregularities or from the
rately in each bin to remove spikes. These data have arbitrary            ground. The yellow vertical lines on these plots indicate the
units, and the colour scales were chosen to best match the dy-            time periods for which the background noise was attenuated
namic range of the noise measurements from each radar. The                (determined from the left panel). During these time peri-
colour scales contain 256 colours and are saturated at the top            ods, the backscatter returns from all six radars have reduced
end in order to emphasise the low-power features. For most                power or are completely suppressed. This indicates that the
radars there is some variation in the noise levels between dif-           radio waves transmitted by the radar have been attenuated.
ferent beams, which may arise from real spatial variations                This combination of reduced background noise and reduced
in the atmospheric noise production and ionospheric propa-                backscatter power is strong evidence that the D-region elec-
gation conditions or differences in beamforming across the                tron density has been enhanced near the radar site (Bland
radar field of view. For this work, we are not interested in the          et al., 2018), and we use these two signatures together in our
absolute values of the background noise. Instead, we look                 event selection for this study.
for sudden changes in the background noise over the entire                   For the example shown in Fig. 2, there are two radars that
field of view which indicate that the HF radio noise has been             did not detect a clear attenuation signature during the PsA
attenuated in response to enhanced D-region ionisation. For               event. These are the McMurdo (MCM) and Dome C East
the example event, reduced background noise levels during                 (DCE) radars, located at 80 and 89◦ corrected geomagnetic
the PsA event are observed for six out of the eight radars                (CGM) latitude, respectively. For these radars, there is nei-
shown, as indicated by the black vertical lines.                          ther a clear decrease in the background noise level nor a re-
   To justify that the reduced background noise measured at               duction in the backscatter power. Note that the background
the six radar sites was indeed caused by enhanced D-region                noise at MCM does decrease close to the event onset time.
ionisation, we also study the backscatter power measured                  This, however, is accompanied by an increase in the echo
by each radar. These measurements are shown in the right                  power, which indicates that the transmitted radio waves were
column of Fig. 2. Each panel shows the raw power levels                   not strongly attenuated in the ionosphere. Therefore, the re-
measured in each 45 km range gate along beam 5. The raw                   duced noise at MCM is probably related to the normal diurnal
power measurements also have arbitrary units and are dis-                 variation in the background noise at the radar site rather than
played on a logarithmic scale. High power values observed                 being a response to energetic particle precipitation.
across several range gates, and lasting from several minutes                 Based on the information in Fig. 2, we can now make a
to hours, indicate coherent backscatter returning to the radar            rough estimate of the spatial coverage of the EEP impact

Ann. Geophys., 39, 135–149, 2021                                                            https://doi.org/10.5194/angeo-39-135-2021
E. Bland et al.: EEP impact area of PsA                                                                                        139

area for this PsA event. This area is shown by the grey shad-      4   Event identification for statistical study
ing in Fig. 1, which is the region bounded by the six radars
that detected the event. This area actually represents the min-    To select PsA events for our statistical study of the EEP im-
imum EEP impact area for this event. The poleward edge             pact area, we began with a list of 102 optical PsA events iden-
of the EEP impact area extends to at least 75◦ CGM lati-           tified visually in keogram plots from the all-sky camera at
tude, where both the South Pole Station (SPS) and Zhong-           Syowa Station. This same event list was used by Bland et al.
shan (ZHO) radars detected attenuation, but it does not ex-        (2019) to determine PsA occurrence rates and durations us-
tend as far as the MCM radar at 80◦ CGM latitude. At the           ing the SYE SuperDARN radar paired with the all-sky cam-
event onset, the SPS and ZHO fields of view were located at        era data. This event list excludes all solar proton events based
20–21 and 03–04 MLT, respectively, indicating an instanta-         on the threshold of 10 protons cm−2 sr−1 s−1 with energies
neous MLT extent of about 7 h. A similar MLT extent at the         above 10 MeV. Excluding these events removes most of the
equatorward edge of the EEP impact area is inferred from           effects of polar cap absorption from this study. The optical
the Halley (HAL) and Kerguelen (KER) radar pair, extend-           PsA events were classified as APA, PPA, or PA by visually
ing from ∼ 22–04 MLT at the event onset. Since the event           studying the keogram and ewogram plots and also the 10 s
was detected at the KER radar site, we can conclude that the       cadence all-sky images for each event. The pulsating auroral
equatorward edge of the EEP impact area extends at least as        structures that we used to distinguish between the different
far as 60◦ CGM latitude in the morning sector. No data were        types are described in detail by Grono and Donovan (2018)
available from the SAN or FIR radars for this event, so we         and Yang et al. (2019). APA are identified as transient pulsat-
cannot determine whether the EEP impact area extends to            ing emissions with no persistent structure or sense of average
the locations of these radars.                                     motion. In contrast, PPA and PA consist of quasi-stable au-
   It is worth commenting briefly on the nature of back-           roral patches that last for tens of minutes and can be tracked
ground radio noise measurements from SuperDARN radars.             across the camera field of view. For PA, pulsations are ob-
The background noise consists of (1) natural atmospheric           served only within a small portion of the emission, such as
radio noise, (2) anthropogenic noise produced by electrical        near the edges, whereas for PPA the pulsations are observed
and electronic equipment near the radar site, and (3) inter-       over a much larger area. For the 56 events in our list, one
nal noise in the radar receiver system. The short- and long-       dominant type of PsA was observed throughout the whole
term variability in the background noise depends on the rel-       event. For the remaining 18 events, the dominant type of
ative contribution of these three sources to the total noise       PsA changed part-way through the event. For these events,
level. EEP-related attenuation signatures are easiest to iden-     we classified them based on the first type of PsA that was ob-
tify when the background radio noise exhibits a smooth diur-       served. There were only three events during which PA were
nal variation in the absence of any D-region enhancement.          observed, and in all cases, the PA were preceded by APA so
In Fig. 2, we observe this smooth noise variation in the           they were classified as APA. Note that our PsA classifications
DCE, MCM, ZHO, SPS, and Syowa East (SYE) data, and                 apply only to Syowa Station as we cannot determine the PsA
the sudden reduction in the background noise at the onset          type from the radar data. Due to this limitation, this study
of PsAs stands out clearly against the slowly varying back-        is designed to detect periods of enhanced D-region ionisa-
ground. This diurnal variation in the noise is controlled by the   tion that occur simultaneously with different types of optical
global atmospheric noise production and ionospheric propa-         PsAs observed at Syowa Station.
gation conditions. In contrast, the noise measurements from            Quick-look plots similar to Fig. 2 were produced for each
the Halley (HAL) radar are highly variable from one 10 min         PsA event in the list. For each radar, we determined whether
time bin to the next and also between neighbouring beams,          the background noise level and the echo power had been at-
which might arise from either internal receiver noise or an-       tenuated based on a visual inspection of the data. Often there
thropogenic noise near the radar site. This variability in the     was some uncertainty about whether a given radar had (or
noise measurements at Halley makes the visual identification       had not) detected an EEP signature. In particular, for some
of HF attenuation signatures more difficult. For this radar,       radars it was unclear whether the background noise had de-
the echo loss from 00:30–02:30 UT is clear (right column of        creased (e.g. Fig. 2; HAL and KER radars). To capture this
Fig. 2), so we rely more heavily on this parameter to deter-       uncertainty, the attenuation for each radar was classified as
mine whether any HF attenuation has occurred. This type of         clearly observed/not observed or probably observed/not ob-
variability in the background noise measurements for some          served. If we could not determine the presence or absence
radars is a key reason for adopting qualitative event selec-       of an attenuation signature either way for a given event, then
tion criteria in this study, as some judgement regarding the       that radar was excluded from the analysis. For an event to be
usability of the data is required in each case.                    included in this study, we required that at least one radar in
                                                                   addition to the Syowa Station instrumentation had data avail-
                                                                   able with sufficient quality to determine whether an atten-
                                                                   uation signature was present. The final event list contained
                                                                   74 events detected during the 2011, 2013, and 2015 Antarc-

https://doi.org/10.5194/angeo-39-135-2021                                                    Ann. Geophys., 39, 135–149, 2021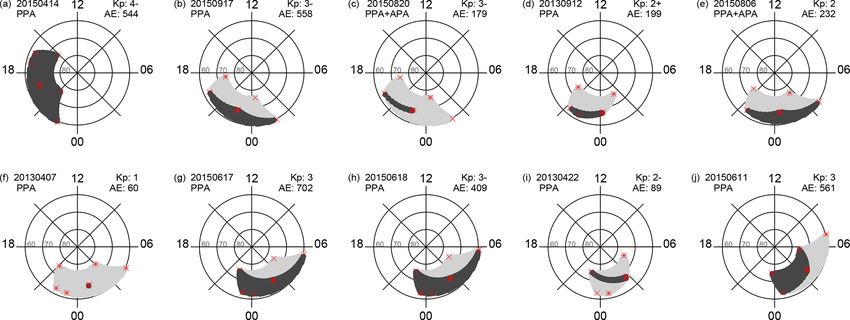
140                                                                                     E. Bland et al.: EEP impact area of PsA

Figure 2. Quick-look plots showing the background radio noise (left) and raw echo power (right) parameters for eight SuperDARN radars
from 13–14 June 2015. The magnetic north–south keogram from the all-sky camera (ASC) at Syowa Station is also shown in both columns.
The event start and end times are marked using black/yellow vertical lines.

Ann. Geophys., 39, 135–149, 2021                                                     https://doi.org/10.5194/angeo-39-135-2021
E. Bland et al.: EEP impact area of PsA 141
tic winter seasons. For each event we recorded the following
information:
– The availability of data from each radar;
– The start time and end time of the attenuation at each
radar site (if observed);
– A classification of our uncertainty regarding whether or
not any HF attenuation had occurred at each radar site.
In most cases, the onset times for each radar that detected
the event are within 30 min of the onset times recorded for
the SYE radar. For a few events, the onset times at ZHO,
KER, or SPS are delayed 1–3 h after the onset at SYE, but
there is still considerable temporal overlap between the two
sites. This might indicate a latitudinal expansion of the EEP Figure 3. Number of events observed and not observed by each
impact area as the event evolves. Similarly, there are three radar and the ASC. The instruments are sorted by magnetic latitude
events during which the HAL or KER radars detected atten- in (a) and by magnetic longitude in (b), except for DCE. Corrected
uation more than 1 h before the onset at SYE, which might in- geomagnetic coordinates are given in parentheses.
dicate that the particle precipitation began at lower latitudes
and later expanded over Syowa Station.
In this study, we have used the all-sky camera at Syowa
some evidence of HF attenuation, but this signature was less
Station to determine the presence of optical PsAs. Since HF
clear compared to the other events. For the KER and HAL
attenuation will occur in response to any process that en-
radars, most of the positive and negative identifications of
hances the D-region ionisation, we cannot confirm that the
HF attenuation were uncertain due to the variability in the
attenuation signatures observed by the radars were caused
background noise and lower backscatter occurrence for these
by PsAs specifically. For example, the attenuation observed
radars, similar to Fig. 2. The MCM and DCE radars rarely de-
by the SYE and Syowa South (SYS) radars in Fig. 2 com-
tect any attenuation during the PsA events. These two radars
mences at substorm onset at 00:20 UT, about 20 min before
had good data availability, high echo occurrence, and the
optical PsAs are visible in the keogram. This is very typi-
background noise exhibits smooth diurnal variations, so we
cal since PsAs are frequently observed in the substorm re-
conclude that the EEP impact area rarely extends to these lat-
covery phase, so the onset times determined from the radar
itudes. The lowest latitude radar, FIR, had very limited data
data will often be 10–30 min earlier than the onset of optical
availability, so it is not possible to draw conclusions about
PsAs (Bland et al., 2019). To increase the chances that the at-
the EEP response at that location.
tenuation signatures at all radar sites are due to PsA-related
To obtain a general overview of the spatial coverage of the
EEP, we require that the attenuation observed by any indi-
PsA events, it is helpful to first consider only those events
vidual radar lasts for at least 1 h to qualify as a positive event
that had data available from most of the radars. Therefore, we
identification at that site. Since substorm expansion phases
now take the subset of events with data available from at least
are relatively short (Juusola et al., 2011; Partamies et al.,
five of the following six radars: HAL, KER, SAN, SPS, SYE,
2013), this criterion should eliminate brief attenuation en-
and ZHO. These radars cover the spatial region extending
hancements during substorm expansion phases that are not
from 59 to 75◦ magnetic latitude over a ∼ 100◦ -wide mag-
accompanied by PsAs in the recovery phase.
netic longitudinal sector. The DCE and MCM radars are not
included in this list because the event-detection rate at these
5 Results sites was close to zero. The FIR radar was also excluded due
to the low data availability.
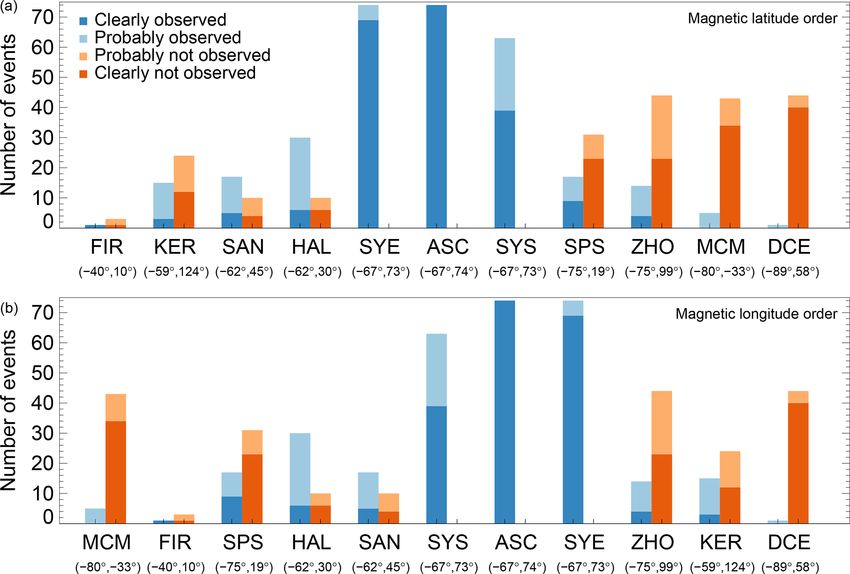
Figure 3 is a bar graph showing the number of events ob- In total, there were 17 APA and 10 PPA events with data
served and not observed by each radar. Colour coding is used available from at least five of the six radars listed above, and
to represent our uncertainty in determining whether any HF the EEP impact area for these events is shown in Figs. 4 and
attenuation had occurred. The ASC is also included in this 5, respectively. For events where the PsA type changed dur-
plot, with all 74 events clearly present. The data presented ing the event, we grouped the events according to the PsA
in both panels are identical, but the radars/ASC are ordered type observed at the event onset. The events have been sorted
by magnetic latitude in Fig. 3a and by magnetic longitude in and numbered according to the magnetic local time of the
Fig. 3b. The SYE and SYS radars detected attenuation during event onset at SYE. The red symbols are used to indicate our
all events for which data were available (74 and 63 events, re- uncertainty in whether attenuation occurred or did not occur
spectively). For the SYE radar, five of these events included at each radar site. The light grey shading shows the region
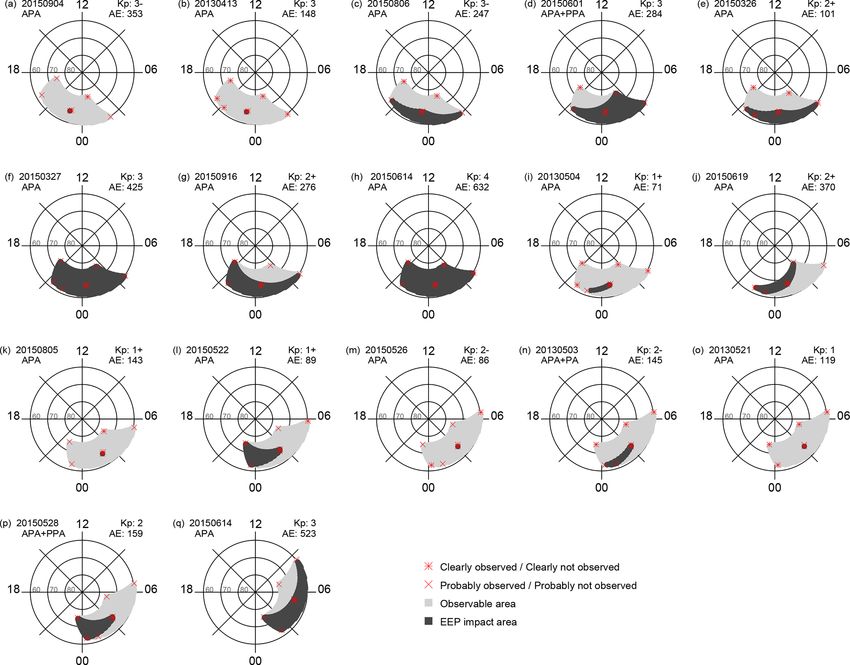
https://doi.org/10.5194/angeo-39-135-2021 Ann. Geophys., 39, 135–149, 2021142 E. Bland et al.: EEP impact area of PsA Figure 4. EEP impact area for amorphous pulsating aurora (APA) events with data available from at least five radars. The dark grey shading shows the EEP impact area, defined as the latitude/MLT region bounded by all radars that detected attenuation during that event (see text for details). The light grey shading shows the region bounded by the radars that did not detect any attenuation. Red symbols are used to indicate our uncertainty in determining whether any attenuation had occurred. Figure 5. Same as Fig. 4 but for patchy pulsating aurora (PPA). Ann. Geophys., 39, 135–149, 2021 https://doi.org/10.5194/angeo-39-135-2021
E. Bland et al.: EEP impact area of PsA 143
bounded by all radars with available data, and then a portion
of this area is shaded dark grey to show the region in which
the attenuation was detected. To determine the perimeter of
each region, we performed a linear interpolation between the
magnetic latitude and MLT coordinates of adjacent stations,
which produces the curved lines in the polar plots. The event
onset times are slightly different for each radar. To focus on
the presence/absence of attenuation events, we use the dark
grey shading to represent the total area in which attenuation
was observed during the event. The auroral electrojet (AE)
index and the planetary K-index (Kp) at the event onset time
are also shown, and we note that there is no obvious corre-
lation between geomagnetic activity and the size of the EEP
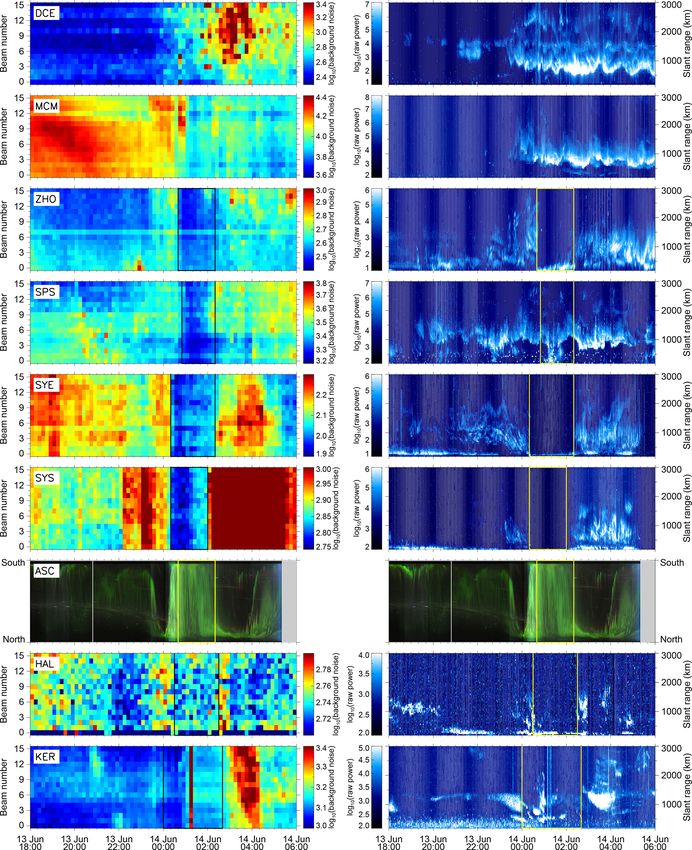
impact area. This highlights the need to move beyond the Figure 6. Magnetic north–south (N–S) keogram from the ASC at
geomagnetic-index-based descriptions of EEP forcing used Syowa Station for the period 13–14 April 2013. The yellow rectan-
gle indicates the time period during which the pulsating aurora was
for long-term climate modelling, since it does not adequately
observed.
capture the contribution from PsA-related EEP.
A total of two APA events and one PPA event were de-
tected by all radars simultaneously (dark grey shading only).
For these events, the EEP impact area extended over a mini- ages, and the numerical value is provided in each cell. The to-
mum of 7 h of MLT and 16◦ of magnetic latitude. For the re- tal number of events used to calculate the percentage is given
maining events, the latitude or MLT boundary of the EEP im- in parentheses. The total number of events varies widely be-
pact area can be identified. For example, APA events nos. 3 tween radar pairs because there were many events for which
and 5 are confined to the ∼ 60–70◦ CGM latitude range. data were not available from both radars simultaneously. The
There are also many events that do not extend over the en- radars/ASC are sorted by magnetic longitude on the horizon-
tire observable MLT range, such as APA event no. 9 and PPA tal axis and magnetic latitude on the vertical axis, except for
event no. 3. A total of five APA events and one PPA event DCE which is placed to the far right/top of the plot. The ge-
were observed only at Syowa Station. For these events, we omagnetic coordinates for each instrument are shown below
conclude that the EEP impact area is narrow in both latitudi- each three-letter radar/camera code. Cells with a dark blue
nal and longitudinal extent. Since the radar coverage is very outline identify instrument pairs that are separated by less
sparse, we checked ASC data from Syowa Station to deter- than 5◦ of magnetic latitude, which are useful for estimating
mine the spatial coverage of the optical PsAs for these events. the longitudinal extent of the EEP impact area at a particu-
For all events detected only by the Syowa Station radars, the lar latitude. Similarly, cells with a light blue outline identify
latitudinal extent of the optical PsA was narrower than the radar pairs that are separated by less than 15◦ of magnetic
camera field of view. We show an example of this in Fig. 6 longitude and can be used to estimate the latitudinal extent
for APA event no. 2, where the optical PsA covers about half of the EEP impact area.
of the north–south field of view. We found no examples in We will first discuss the probability that each radar detects
which the east–west extent of the optical PsA was smaller HF attenuation simultaneously with optical PsAs at Syowa
than the camera field of view. Station. A total of 100 % of the optical PsA events at Syowa
The results presented in Figs. 4 and 5 show that the EEP Station were accompanied by HF attenuation at SYE and
impact area associated with PsA events can vary signifi- SYS. This is expected because these instruments have similar
cantly. However, due to the limited number of events that fields of view. The HAL radar, which is located at a similar
met our data availability criteria, it is difficult to draw con- magnetic latitude to Syowa Station, but 44◦ to the west, de-
clusions about the average EEP impact area based on these tected HF attenuation with 75 % probability. For radars near
results. Therefore, we now use the observations from all 74 the poleward edge of the auroral oval, we see that 24 % of
events to build a statistical description of the EEP impact the optical PsA events were accompanied by attenuation at
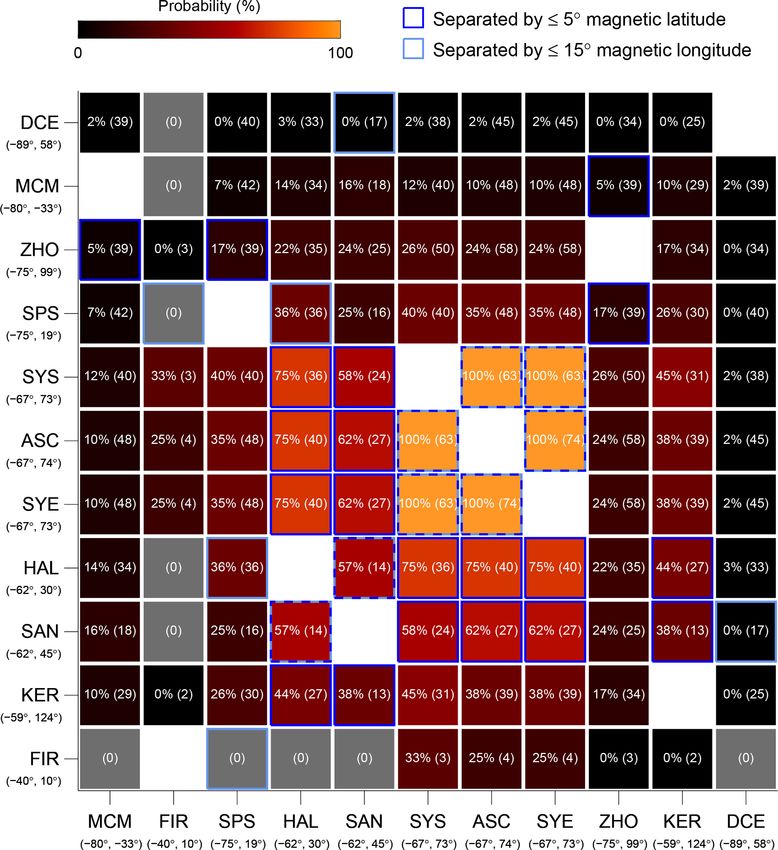
area. These results are presented in Fig. 7 using a format sim- ZHO (75◦ latitude), and this drops to just 10 % at 80◦ lati-
ilar to a correlation matrix. Each cell shows the percentage tude (MCM radar). For the lowest magnetic latitude station,
of optical PsA events that were accompanied by an attenu- FIR, data were available for just four events, and the radar
ation signature from both radars corresponding to that cell. detected attenuation for only one of these events, so the 25 %
For example, 36 % of the optical PsA events were accom- occurrence rate for this radar is unreliable.
panied by an attenuation signature from both the HAL and The KER–HAL and SPS–ZHO radar pairs provide infor-
SPS radars simultaneously. The percentage occurrence for mation about the MLT extent of the EEP impact area near the
the ASC paired with each individual radar is also included in equatorward and poleward edges of the auroral oval, respec-
Fig. 7. The cells are colour coded according to these percent- tively. The KER and HAL radars, located at 59–62◦ latitude,
https://doi.org/10.5194/angeo-39-135-2021 Ann. Geophys., 39, 135–149, 2021144 E. Bland et al.: EEP impact area of PsA
Figure 7. Probability of detecting HF radio attenuation for each pair of SuperDARN radars. In all cases, optical PsAs were also detected
simultaneously by the ASC at Syowa Station. The white text shows the probabilities for each radar pair, and the number of events used to
calculate these probabilities is given in parentheses. The probabilities for the ASC paired with each radar are also shown. The box shading
is used to represent these probabilities visually. The corrected geomagnetic coordinates for each radar are given in parentheses below each
three-letter station ID. The radars/ASC are sorted by magnetic longitude on the horizontal axis (except DCE) and by magnetic latitude on
the vertical axis. Dark and light blue box outlines indicate radars with a similar magnetic latitude and magnetic longitude, respectively.
both detected attenuation for 44 % of the PsA events. This probabilities between these pairs. However, both results in-
radar pair is separated by ∼ 6 h of MLT. At the poleward edge dicate that the latitudinal extent of the EEP impact area is
of the auroral oval (∼ 75◦ ), 17 % of events were detected by less than 12◦ for the majority of events.
both the SPS and ZHO radars, which have a 7 h MLT separa-
tion. We conclude from these results that the MLT extent of
the EEP impact area is, on average, larger at the equatorward 6 Discussion
edge of the auroral oval.
The results presented in this study provide some basic esti-
The HAL–SPS radar pair provides information about the
mates of the EEP impact area during pulsating aurora events.
latitudinal extent of the EEP impact area to the west of our
This type of information is necessary for developing realis-
reference location at Syowa Station. This pair detected HF
tic inputs to atmospheric models that are used to study the
attenuation simultaneously with a probability of 36 %. East
impact of EEP on the middle atmospheric chemistry and
of the reference location, the ZHO–KER radar pair detected
the contribution of EEP forcing to natural climate variabil-
HF attenuation simultaneously with a probability of 17 %.
ity. Our results show that 36 % of PsA events extend over at
The SPS–HAL and ZHO–KER pairs do not have the same
least 12◦ of magnetic latitude (SPS–HAL pair), and ∼ 60 %–
latitudinal spacing, so it is not appropriate to compare the
75 % extend over at least 4◦ of magnetic latitude (SYE–SAN
Ann. Geophys., 39, 135–149, 2021 https://doi.org/10.5194/angeo-39-135-2021E. Bland et al.: EEP impact area of PsA 145 and SYE–HAL pairs). At the equatorward edge of the auroral abilities are much higher due to the low data availability. oval, 44 % of events have a magnetic local time extent greater Based on the information presented in Fig. 3, we can de- than 7 h (KER–HAL pair). At the poleward edge, 17 % of termine which radars provide the most reliable informa- events cover this MLT range (ZHO–SPS pair). tion about PsA occurrence. These are the radars for which Our study has demonstrated a novel application of the Su- the large majority of events were either clearly observed or perDARN HF radars for estimating the spatial extent of the clearly not observed. This is the case for the two highest- EEP impact area during pulsating aurora events. The use of latitude radars, MCM and DCE, so we conclude that the very SuperDARN radars for this purpose provides an advantage low occurrence rates observed at 80 and 89◦ are reliable. over optical instruments because the radar observations are In contrast, there was significant uncertainty in identifying not restricted by daylight or cloud cover. This significantly events for the KER, SAN, and HAL radars. The SAN radar increases the availability of multi-point observations for our in particular has a low total number of events and high un- statistical study. However, the number of events used to de- certainties with respect to whether any attenuation occurred. termine the occurrence probabilities for each radar pair are Despite these uncertainties, it is apparent from Fig. 7 that the still relatively low (see Fig. 7). For validation purposes, we occurrence rates exhibit a smooth variation with the distance used the ASC data from Syowa Station as a starting point for from Syowa Station, both in latitude and longitude. identifying PsA-related HF attenuation in the SuperDARN To determine whether our results are realistic, we can data, which limits the observation time to periods of dark, make some simple comparisons to an earlier work. At the clear skies at Syowa Station. The four most important radars equatorward edge of the auroral oval, we found that 44 % of for estimating the EEP impact area in our study are KER, events have a MLT extent greater than 7 h (KER–HAL pair). ZHO, SPS, and HAL. These radars provide observations At the poleward edge, 17 % of events cover this MLT range from the equatorward and poleward edges of the Southern (ZHO–SPS pair). Optical observations by Grono and Dono- Hemisphere auroral oval over a wide longitudinal area. Un- van (2020) showed that APA occur over a wider MLT range fortunately, the HAL radar ceased operations in 2015, so it at ∼ 65◦ latitude compared to ∼ 75◦ latitude. Although their was not possible to extend the data set to include more re- study did not provide information about the instantaneous cent events from that location. Although the data set for the spatial coverage of optical PsAs, it is likely that the wider other radars could potentially be expanded to include more MLT range of APA observed at lower latitudes is due to a events, it may be more fruitful to repeat this analysis using wider instantaneous spatial coverage of the events in their the North American SuperDARN radars. This would pro- study and is therefore consistent with our results. It is also vide additional coverage from a larger number of radars and important to recognise that the latitudinal separation between allow comparisons with optical PsA observations from the Syowa Station and the ZHO–SPS and KER–HAL radar pairs THEMIS ASCs and with riometer observations of cosmic might contribute to the different MLT extents observed at noise absorption. ∼ 60 and ∼ 75◦ latitude. The ZHO–SPS pair is located about The Southern Hemisphere data were used in this study be- 8◦ poleward of Syowa Station, whereas the HAL and KER cause they generally detect large amounts of backscatter on radars are about 5 and 8◦ equatorward of Syowa Station, re- the nightside, which makes it straightforward to identify peri- spectively. Therefore, with this study design it is difficult to ods of reduced backscatter power. We speculate that the high decouple the effects of latitude and distance to the reference echo occurrence for the Southern Hemisphere radars is due to location when determining the MLT extent of PsAs. the low operating frequencies used and more favourable ge- Whatever the cause of these latitudinal differences in the ometry with the magnetic field for satisfying the aspect angle EEP impact area, we can conclude from our results that the condition for ionospheric scatter detection. Also, the South- optical PsA event reported by Jones et al. (2013) is prob- ern Hemisphere radars generally operate at just one or two ably quite rare. For that event, optical PsAs were observed frequencies, making it easier to identify attenuation signa- over 10 h of MLT, but our results indicate that a large ma- tures in the background radio noise, which is frequency de- jority of PsA events have an impact area covering less than pendent. With an improved understanding of the background 7 h of MLT. It is possible, however, that the EEP impact area radio noise measured by SuperDARN radars, it may be possi- is smaller than the spatial area over which optical PsAs are ble to reliably identify HF attenuation events using only the observed. This could be investigated further using the Su- background noise parameter. This would improve the suit- perDARN radars and riometers in North America combined ability of the North American SuperDARN radars for esti- with simultaneous observations from the THEMIS all-sky mating the EEP impact area. cameras. Due to the limited number of events in our statistical A key difference in our results compared to earlier work is study, some caution is required when interpreting the occur- the location of the poleward boundary of PsAs. Our results rence probabilities presented in Fig. 7. For most radar pairs, show that PsA-related attenuation frequently extends beyond the occurrence probabilities were calculated based on 30– ∼ 75◦ latitude. This was determined using the SPS–SYE and 40 events, so each event represents 2–4 percentage points. ZHO–SYE radar pairs, which detected PsA-related attenua- For the FIR and SAN radars, the uncertainties in the prob- tion with 35 % and 24 % probability, respectively. The MCM https://doi.org/10.5194/angeo-39-135-2021 Ann. Geophys., 39, 135–149, 2021
146                                                                                 E. Bland et al.: EEP impact area of PsA

radar (80◦ latitude) also detected attenuation with about 10 %    latitude extent of these morning sector substorm-related EEP
probability. This upper latitude boundary for PsAs is signifi-    fluxes matches well with our observations of HF attenuation
cantly poleward of the optical PsA boundary reported in ear-      at magnetic latitudes above 75◦ in connection with PsAs at
lier work. For example, Oguti et al. (1981) reported that op-     Syowa Station.
tical PsAs are restricted to ≤ 70◦ magnetic latitude, but that       Based on the results described above, we can make a rough
discrete aurora may occur up to 75◦ latitude. However, op-        estimate of the average EEP impact area that could be used
tical PsAs have been reported over Svalbard at 75◦ latitude       as input to an atmospheric model such as WACCM (Marsh
(Kvifte and Pettersen, 1969), and Grono and Donovan (2020)        et al., 2007; Verronen et al., 2016). As described above, the
reported PsAs up to about 74–75◦ but the occurrence was           majority of events cover less than 7 h of MLT. From the SYE,
very low.                                                         SYS, KER, SAN, and HAL pair combinations shown in
   Grono and Donovan (2020) also showed that the mag-             Fig. 7, we determine that roughly half of the PsA events have
netic latitude range of PsAs depends on the PsA type, with        an instantaneous MLT coverage of at least 2–3 h at ∼ 65◦
APA occurring over the magnetic latitude range 56–75◦ and         magnetic latitude. Therefore, the average MLT extent at this
PPA and PA restricted to slightly narrower ranges of 57–73        latitude is probably around 4–5 h. The average MLT extent
and 59–74◦ , respectively. They reported that the APA occur-      is much narrower at ∼ 75◦ magnetic latitude, with the large
rence probability above about 74◦ was . 15 % and zero for         majority (65 %–76 %) of events covering less than 2–4 h si-
PPA and PA. In our data set, there are several PPA events         multaneously (SYE–SPS and SYE–ZHO pairs). PsA occur-
for which HF attenuation was detected by the ZHO or SPS           rence rates reach a maximum in the early morning sector,
radars. This is particularly so for event nos. 1, 7, 8, 9, and    at about 04:00 MLT (Jones et al., 2011; Bland et al., 2019;
10 in Fig. 5, which is half of the events shown in that fig-      Grono and Donovan, 2020), and this result could be used to
ure. Kp and AE indices for these PPA events are higher than       centre the EEP impact area in a model PsA forcing. The av-
for the other PPA events, which might play a role in deter-       erage latitudinal extent of the EEP impact area is difficult to
mining the size and location of the EEP impact area. Differ-      estimate due to the very sparse latitudinal coverage of the
ences in the auroral oval location between the Northern and       SuperDARN radars and the latitude dependence of PsA oc-
Southern hemispheres may contribute to the different latitu-      currence. We have determined that approximately one-third
dinal coverage results in this study compared to Grono and        of the events cover 12◦ of latitude to the west of Syowa Sta-
Donovan (2020). We also note that the PsA type classifica-        tion (SPS–HAL pair), so the median latitudinal extent would
tion was determined only at Syowa Station, and it is likely       be a few degrees narrower. By combining this result with the
that other PsA types, and non-pulsating auroral emissions,        latitude-dependent optical PsA occurrence rates (Grono and
were present elsewhere for many events. Although we have          Donovan, 2020, Fig. 5), one could reasonably assume that the
excluded polar cap absorption (PCA) from our event list, it is    average EEP impact area covers the magnetic latitude range
possible that very weak PCA caused by proton fluxes below         of about 62–70◦ .
the 10 cm−2 sr−1 s−1 threshold may cause some detectable             Since our event detection procedure is qualitative, we can-
HF attenuation at above ∼ 75◦ magnetic latitude. However,         not draw conclusions about the magnitude of the D-region
the timing of the absorption detected at these polar latitude     electron density enhancements. This may be possible in the
radars matches well with the optical PsAs observed at Syowa       future with improved baselining of the background noise pa-
Station. It therefore seems more likely that the polar latitude   rameter (e.g. Berngardt, 2020) and a better understanding of
attenuation is caused by energetic electron precipitation that    the sensitivity of SuperDARN radars to PsA-related EEP. For
is related to the PsA activity occurring equatorward.             the purposes of atmospheric modelling, however, statistical
   Since PsAs are often observed in the recovery phase of         EEP energy spectra from satellite observations (e.g. Tesema
substorms, it is worth comparing our results with earlier stud-   et al., 2020b) would probably provide a more accurate esti-
ies of the spatial extent of substorm precipitation. For exam-    mate the relative impact of different types of PsAs than what
ple, riometer observations by Berkey et al. (1974) showed         is possible with the SuperDARN radars.
that substorm precipitation extends over the magnetic lati-
tude range ∼ 60–74◦ . This magnetic latitude range is simi-
lar to the optical results described above, except that PsAs      7   Conclusions
tend to remain further equatorward until the morning MLT
sector. Regarding the HF attenuation observed at latitudes        The spatial extent of the EEP impact area during 74 pulsat-
above 75◦ , Cresswell-Moorcock et al. (2013) reported that        ing aurora events has been estimated using observations of
there is an enhancement in the > 30 keV electron fluxes at        HF radio attenuation from 10 SuperDARN radars in Antarc-
L > 15 in the morning sector about 1–2 h after the substorm       tica. We defined the EEP impact area as the horizontal region
onset. This is likely to correspond to the substorm recovery      over which PsA-related EEP has sufficient energy to cause
phase when PsAs are commonly observed. Therefore, some            a detectable amount of HF attenuation in the D-region iono-
of the very high-latitude EEP fluxes reported by Cresswell-       sphere. This represents the area over which PsA-related EEP
Moorcock et al. (2013) are probably related to PsAs. The          may cause an atmospheric chemical response. For 75 % of

Ann. Geophys., 39, 135–149, 2021                                                  https://doi.org/10.5194/angeo-39-135-2021
E. Bland et al.: EEP impact area of PsA                                                                                                  147

the events studied, the EEP impact area extended over at least           ing the data from the all-sky colour digital camera at Syowa Sta-
4◦ of magnetic latitude, and 36 % of events extended over at             tion. This camera is part of the science programme of the Japanese
least 12◦ of magnetic latitude. The MLT extent was found to              Antarctic Research Expedition and NIPR.
be larger, on average, at lower latitudes compared to higher
latitudes. Based on our results, and earlier work using opti-
cal data, we estimated the average EEP impact area for PsAs              Financial support. This research has been supported by the Norges
that could be used as input to an atmospheric model such as              Forskningsråd (grant nos. 287427 and 223252).
WACCM. This average EEP impact area extends from about
62–70◦ magnetic latitude and covers about 4–5 h of MLT.
                                                                         Review statement. This paper was edited by Andrew J. Kavanagh
We emphasise that the SuperDARN radars have sparse spa-
                                                                         and reviewed by two anonymous referees.
tial coverage, and that the sample size used in our statistical
study was relatively small, so these results provide only a
rough estimate of the average EEP impact area.
                                                                         References

Code availability. Software for reading and analysing SuperDARN          Berkey, F. T., Driatskiy, V. M., Henriksen, K., Hultqvist, B., Jelly,
data is available at https://doi.org/10.5281/zenodo.801458 (Super-         D. H., Shchuka, T. I., Theander, A., and Ylindemi, J.: A synoptic
DARN Data Analysis Working Group et al., 2021).                            investigation of particle precipitation dynamics for 60 substorms
                                                                           in IQSY (1964–1965) and IASY (1969), Planet. Space Sci., 22,
                                                                           255–307, https://doi.org/10.1016/0032-0633(74)90028-2, 1974.
                                                                         Berngardt, O. I.: Noise level forecasts at 8–20 MHz and their use
Data availability. The SuperDARN data were obtained from
                                                                           for morphological studies of ionospheric absorption variations
the British Antarctic Survey data mirror (https://www.bas.ac.uk/
                                                                           at EKB ISTP SB RAS radar, Adv. Space Res., 66, 278–291,
project/superdarn; British Antarctic Survey, 2020). The all-sky
                                                                           https://doi.org/10.1016/j.asr.2020.04.005, 2020.
camera data were provided by the National Institute of Polar
                                                                         Berngardt, O. I., Ruohoniemi, J. M., Nishitani, N., Shepherd, S. G.,
Research, Japan (http://polaris.nipr.ac.jp/~acaurora/syowa_CDC_
                                                                           Bristow, W. A., and Miller, E. S.: Attenuation of decameter wave-
QL/; National Institute of Polar Research, Japan, 2020). Geomag-
                                                                           length sky noise during x-ray solar flares in 2013–2017 based on
netic activity indices were obtained from the GSFC/SPDF OMNI-
                                                                           the observations of midlatitude HF radars, J. Atmos. Sol.-Terr.
Web interface (https://omniweb.gsfc.nasa.gov; NASA, 2020).
                                                                           Phy., 173, 1–13, https://doi.org/10.1016/j.jastp.2018.03.022,
                                                                           2018.
                                                                         Bland, E. C., Heino, E., Kosch, M. J., and Partamies, N.: Su-
Author contributions. The SuperDARN data analysis was done by              perDARN Radar-Derived HF Radio Attenuation During the
EB. NP provided the original PsA event list from Syowa Station,            September 2017 Solar Proton Events, Space Weather, 16, 1455–
and FT performed the classification. All authors contributed to the        1469, https://doi.org/10.1029/2018SW001916, 2018.
discussion of the results and the writing of the paper.                  Bland, E. C., Partamies, N., Heino, E., Yukimatu, A. S.,
                                                                           and Miyaoka, H.: Energetic Electron Precipitation Occur-
                                                                           rence Rates Determined Using the Syowa East Super-
Competing interests. The authors declare that they have no conflict        DARN Radar, J. Geophys. Res.-Space, 124, 6253–6265,
of interest.                                                               https://doi.org/10.1029/2018JA026437, 2019.
                                                                         British Antarctic Survey: Super Dual Auroral Radar Network,
                                                                           available at: https://www.bas.ac.uk/project/superdarn, last ac-
Special issue statement. This article is part of “Special Issue on the     cess: 1 June 2020.
joint 19th International EISCAT Symposium and 46th Annual Eu-            Chakraborty, S., Ruohoniemi, J. M., Baker, J. B. H., and Nishi-
ropean Meeting on Atmospheric Studies by Optical Methods”. It              tani, N.: Characterization of Short-Wave Fadeout seen in Day-
is a result of the 19th International EISCAT Symposium 2019 and            time SuperDARN Ground Scatter Observations, Radio Sci., 53,
46th Annual European Meeting on Atmospheric Studies by Optical             472–484, https://doi.org/10.1002/2017RS006488, 2018.
Methods, Oulu, Finland, 19–23 August 2019.                               Chakraborty, S., Baker, J. B. H., Ruohoniemi, J. M.,
                                                                           Kunduri, B., Nishitani, N., and Shepherd, S. G.: A
                                                                           Study of SuperDARN Response to Co-occurring Space
Acknowledgements. Emma Bland has been supported by the Re-                 Weather Phenomena, Space Weather, 17, 1351–1363,
search Council of Norway (NRC; grant no. 287427). Noora Par-               https://doi.org/10.1029/2019SW002179, 2019.
tamies and Fasil Tesema have been supported by the NRC under             Chisham, G., Lester, M., Milan, S. E., Freeman, M. P., Bristow,
CoE (grant no. 223252). The authors acknowledge the use of Su-             W. A., Grocott, A., McWilliams, K. A., Ruohoniemi, J. M., Yeo-
perDARN data. SuperDARN is a collection of radars funded by the            man, T. K., Dyson, P. L., Greenwald, R. A., Kikuchi, T., Pin-
national scientific funding agencies of Australia, Canada, China,          nock, M., Rash, J. P. S., Sato, N., Sofko, G. J., Villain, J. P.,
France, Italy, Japan, Norway, South Africa, the United Kingdom,            and Walker, A. D. M.: A decade of the Super Dual Auro-
and the United States of America. We thank Hiroshi Miyaoka of              ral Radar Network (SuperDARN): Scientific achievements, new
the National Institute of Polar Research (NIPR), Japan, for provid-        techniques and future directions, Surv. Geophys., 28, 33–109,
                                                                           https://doi.org/10.1007/s10712-007-9017-8, 2007.

https://doi.org/10.5194/angeo-39-135-2021                                                            Ann. Geophys., 39, 135–149, 2021
You can also read