Flood risk assessment due to cyclone-induced dike breaching in coastal areas of Bangladesh - NHESS
←
→
Page content transcription
If your browser does not render page correctly, please read the page content below
Nat. Hazards Earth Syst. Sci., 19, 353–368, 2019
https://doi.org/10.5194/nhess-19-353-2019
© Author(s) 2019. This work is distributed under
the Creative Commons Attribution 4.0 License.

Flood risk assessment due to cyclone-induced dike
breaching in coastal areas of Bangladesh
Md Feroz Islam1 , Biswa Bhattacharya2 , and Ioana Popescu2,3
1 Copernicus  Institute, Department of Environmental Sciences, Utrecht University, 3584 CB Utrecht, the Netherlands
2 IHE Delft Institute for Water Education, 2611 AX Delft, the Netherlands
3 Faculty of Civil Engineering, Politehnica University of Timisoara, 300223 Timisoara, Romania

Correspondence: Md Feroz Islam (m.f.islam@uu.nl)

Received: 7 June 2018 – Discussion started: 9 July 2018
Revised: 16 January 2019 – Accepted: 18 January 2019 – Published: 14 February 2019

Abstract. Bangladesh, one of the most disaster-prone coun-         the developed scenarios, which was used to recommend the
tries in the world, has a dynamic delta with 123 polders pro-      need of appropriate land use zoning to minimize the vulner-
tected by earthen dikes. Cyclone-induced storm surges cause        ability to flooding. The developed hydrodynamic model can
severe damage to these polders by overtopping and breach-          be used to forecast inundation, to identify critical locations
ing the dikes. A total of 19 major tropical storms have hit the    of the dike requiring maintenance and to study the effect of
coast in the last 50 years, and the storm frequency is likely      climate change on flood inundation in the study area.
to increase due to climate change. The present paper presents         The frequency and intensity of the cyclones around the
an investigation of the inundation pattern in a protected area     world are likely to increase due to climate change, which
behind dikes due to floods caused by storm surges and iden-        will require resource-intensive improvement of existing or
tifies possible critical locations of dike breaches. Polder 48     new protection structures for the deltas. The identification
in the coastal region, also known as Kuakata, was selected as      and prioritization of the maintenance of critical locations of
the study area. A HEC-RAS 1-D–2-D hydrodynamic model               dike breaching can potentially prevent a disaster. The use of
was developed to simulate inundation of the polder under dif-      non-structural tools such as land use zoning with the help of
ferent scenarios. Scenarios were developed by considering          flood risk maps and probabilistic flood maps has the potential
tidal variations, the angle of the cyclone at landfall, possible   to reduce risk and damage. The method presented in this re-
dike breach locations and sea level rise due to climate change     search can potentially be utilized for deltas around the world
according to the Fifth Assessment Report (AR5) of the In-          to reduce vulnerability and flood risk due to dike breaching
tergovernmental Panel on Climate Change (IPCC). A storm            caused by cyclone-induced storm surge.
surge for a cyclone event with a 1-in-25-year return period
was considered for all the scenarios. The primary objective
of this research was to present a methodology for identify-
ing the critical location of dike breaching, generating a flood    1   Introduction
risk map (FRM) and a probabilistic flood map (PFM) for
the breaching of dikes during a cyclone. The critical location     Bangladesh is situated in a low-lying delta of three major
of the dike breach among the chosen possible locations was         rivers: Ganges, Brahmaputra and Meghna. A total of 80 % of
identified by comparing the inundation extent and damage           the country’s land is located below 10 m a.m.s.l. (above mean
due to flooding corresponding to the developed scenarios. A        sea level) (Heitzman and Worden, 1989), and it is formed of
FRM corresponding to the breaching in the critical location        sediments carried by the above-mentioned rivers. The pop-
was developed, which indicated that settlements adjacent to        ulation of Bangladesh was about 131.5 million by the year
the canals in the polders were exposed to higher risk. A PFM       2000 (World Bank, 2018), of which about 49 % were living
was developed using the simulation results corresponding to        in coastal zones (Neumann et al., 2015). The coastal areas of
                                                                   Bangladesh are flooded frequently due to cyclone-induced

Published by Copernicus Publications on behalf of the European Geosciences Union.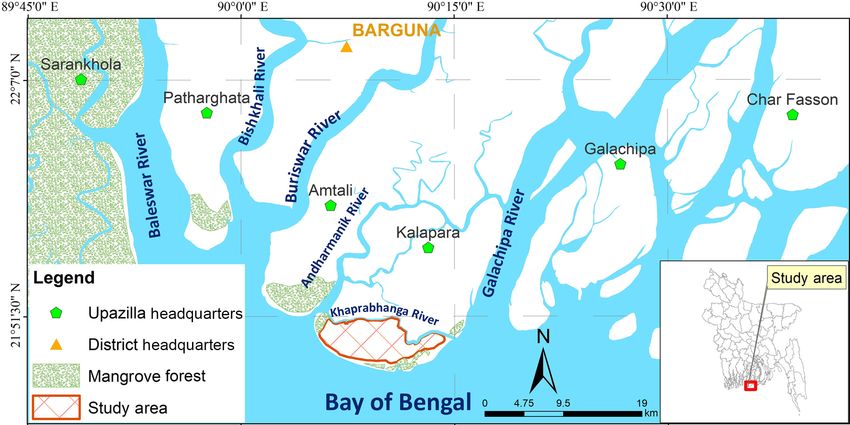
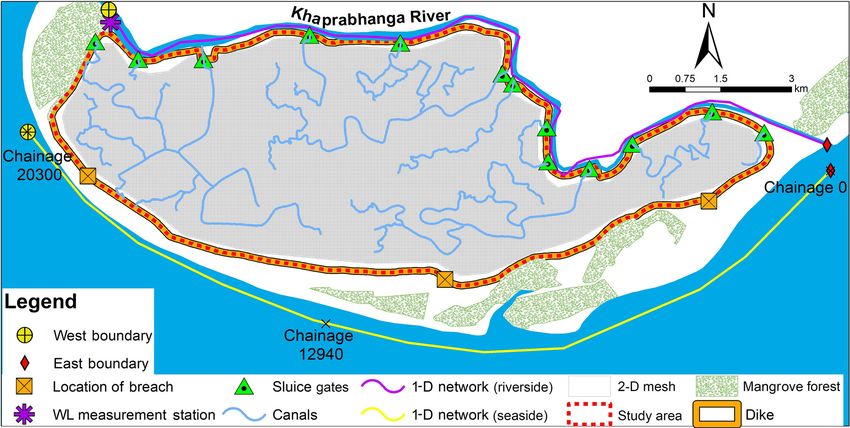
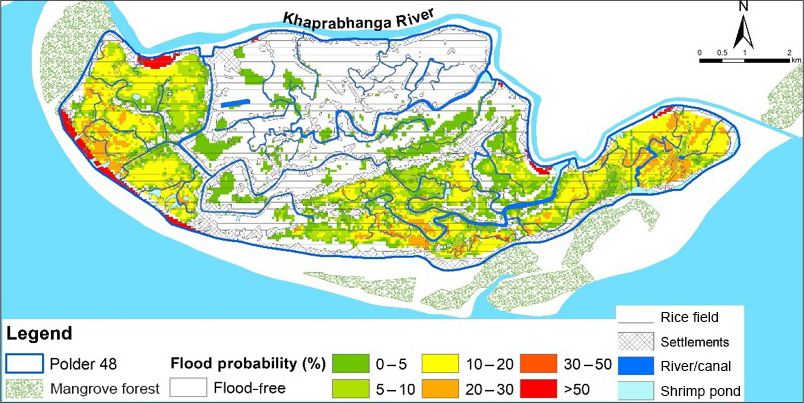
354                                                                      M. F. Islam et al.: Flood risk assessment due to cyclone

storm surges and occasionally due to high water levels in the        due to global warming (Knutson et al., 2010). Flooding by
rivers caused by heavy rainfall in the upstream catchments of        tropical cyclones will also increase in the future as a result of
Ganges, Brahmaputra and Meghna. The coast was hit by five            sea level rise (SLR) (Woodruff et al., 2013). SLR and sea
severe cyclones between 1995 and 2010, causing flooding,             surface temperature (SST) will affect the cyclone-induced
huge damage and loss of life (Dasgupta et al., 2014).                storm surge height in the Bay of Bengal (Karim and Mimura,
   Bangladesh has 123 polders in the coastal area, each sur-         2008). With increasing SST, the storm surge height may in-
rounded by earthen dikes, which are designed to protect the          crease from 21 % to 49 %, and with SLR, the flood depth
inland from flooding due to high tides. The existing crest           due to storm surges may increase by 30 %–40 % (Karim and
level of these dikes is only adequate enough to protect the          Mimura, 2008). The land subsidence in the delta will exac-
coastal area from cyclones with 5- to 12-year return periods         erbate the effect of SLR. By the year 2100 the annual es-
(Islam et al., 2013). These dikes usually get damaged and            timated damage due to tropical cyclones may increase by
sometimes breached by tropical cyclones of high intensity,           USD 53 billion (Mendelsohn et al., 2012).
which causes flooding inside the protected areas, damages to            At present, a flood forecasting system is not available for
properties and loss of life. For example, Cyclone Sidr hit the       the coastal region of Bangladesh. The BWDB, which is man-
coast of Bangladesh in 2007, affecting 8.9 million people and        dated to protect the area, does not have a clear picture about
causing USD 1.7 billion of damages (GOB, 2008; Dasgupta              the inundation patterns corresponding to various climatic
et al., 2014). In 2009, Cyclone Aila affected 3.9 million peo-       conditions. Moreover, identifying zones in the embankment
ple, with estimated damages of USD 270 million (EMDAT,               critical to flooding in the polder will help BWDB in prioritiz-
2009).                                                               ing their maintenance. This paper presents a methodology to
   Crest levels of the coastal dikes were recently designed          identify the critical location of dike breach due to cyclones,
for an event with a 25-year return period under the Coastal          generating a FRM and a PFM for the breaching of dikes by
Embankment Improvement Project (CEIP) (BWDB, 2013).                  cyclone-induced storm surges. Different scenarios of storm
A storm surge event with a 25-year return period was con-            surges were formulated by considering storms of different
sidered in this study for the generation of different scenar-        frequencies with varying tidal conditions, the angle of the cy-
ios. Under the CEIP, the crest levels of the dikes were de-          clone at landfall and SLR. A cyclone event with a 25-year re-
signed considering wave actions, astronomical tides and the          turn period was considered in this research. A coastal polder
required freeboard. Raising the crest level was considered the       (Polder 48) of southern Bangladesh was selected as the study
only mitigating measure. Various studies on the coastal areas        area.
of Bangladesh (e.g. Karim and Mimura, 2008; IWM, 2005;                  Resource-intensive adjustment of the protective structures
Azam et al., 2004; Madsen and Jakobsen, 2004; CSPS, 1998;            for the deltas around the world will be required as the fre-
Flather, 1994) considered flooding only due to overtopping           quency and intensity of cyclones will increase with climate
of the dikes during storm surges. The effects of breaching           change. Along with structural measures, non-structural tools,
of the dikes due to piping and scouring on the landside dur-         such as land use zoning with the help of flood risk maps and
ing cyclones have not been studied. The coast of Bangladesh          probabilistic flood maps, have the potential to reduce risk and
is frequently hit by severe cyclones (five cyclones between          damage. The identification of the critical locations of breach-
1995 and 2010, Dasgupta et al., 2014). The Bangladesh Wa-            ing and intensification of the maintained effort for these loca-
ter Development Board (BWDB) is responsible for the oper-            tions can potentially prevent a disaster. The method presented
ation and maintenance of these dikes and lacks fund to con-          in this research can be utilized for vulnerable deltas around
duct proper repair of damaged dikes subsequent to any severe         the world, even though the coastal region of Bangladesh was
cyclone. As a result the dykes remain vulnerable to breach-          selected as the case study area.
ing. Identifying the critical location(s) of dike breaching and
prioritizing the repair of the critical location are likely to re-
duce the breaching possibility.                                      2    Study area
   Moreover, non-structural measures for flood risk manage-
ment such as land use zoning using a flood risk map (FRM)            Polder 48, which was considered as the study area for
and a probabilistic flood map (PFM) to locate the vulnera-           this research, is surrounded by dikes and has a sea-facing
ble areas are currently unavailable for the coastal areas of         dike of about 20 km length on the southern side of the
Bangladesh. Flood zoning can be a useful risk mitigation             polder. The polder is located on the south-western coast of
measure as land use governs the exposure and may aggravate           the Bangladesh Delta (Fig. 1), stretching from 21◦ 500 2800 N
the hazard (Barredo and Engelen, 2010).                              90◦ 050 1700 E to 21◦ 500 0600 N 90◦ 140 1400 E. The outline of the
   Furthermore, the intensity and frequency of these tropi-          study area in Fig. 1 (also in Fig. 3) depicts the dike align-
cal cyclones are likely to increase in the future due to climate     ment of the study area as well. The area is also known as
change. It is projected that by the year 2100, the frequency of      Kuakata, and it is in the administrative zone of the Kalapara
the most intense cyclones will increase substantially and the        Sub-district (Upazilla) of Patuakhali District. It has an area
intensity of tropical cyclones will increase by 2 % to 11 %          of 50.75 km2 with 24 240 inhabitants according to the 2011

Nat. Hazards Earth Syst. Sci., 19, 353–368, 2019                               www.nat-hazards-earth-syst-sci.net/19/353/2019/
M. F. Islam et al.: Flood risk assessment due to cyclone                                                                        355

census (BBS, 2012). Most of the inhabitants are farmers and         3.1   Setting up of 1-D–2-D coupled model
fishermen (Nasreen et al., 2013). Shrimp culture and tourism
are also part of the economic activities. The land use is classi-   In order to build a 1-D–2-D inundation model, field mea-
fied by the Ministry of Land of Bangladesh into the following       surements (land level surveys, observed water levels, canal
four classes: rice fields, settlements, shrimp ponds and water      alignments and cross sections of the river and canals) and
bodies (rivers and canals). Climate and agricultural practices      information from remote sensing (satellite imagery) were
of Kuakata are similar to the climate and agricultural prac-        gathered (Fig. 3). The Institute of Water Modelling (IWM)
tices of the country (Bangladesh). The average yearly rainfall      of Bangladesh collected hydraulic, hydrologic and land-level
in Kuakata is 2590 mm (Climate-Data, 2016), and the annual          data of the study area (along with other polders) in the frame-
average temperature is 25.9 ◦ C (Climate-Data, 2016). Rabi          work of the feasibility study of the Coastal Embankment Im-
(November–February), Kharif-I (March–May) and Kharif-               provement Project (CEIP). The IWM has kindly provided the
II (June–October) are the three seasons for growing crops           measurement data for the study area.
(DAE, 2009). The elevation of 80 % of the area is 1.55 m be-           The digital elevation model (DEM) was generated by com-
low PWD, the vertical datum established by the Public Works         bining the land-level surveys conducted by the IWM and
Department of Bangladesh, which is 0.46 m below mean sea            FINNMAP. The land-level survey by the IWM (conducted
level. The land level surveys at different times have indi-         in 2012) did not cover the whole study area. FINNMAP
cated that this polder is facing land subsidence issues. Brown      conducted a topographic survey of the study area in 1988
and Nicholls (2015) reported the estimated mean subsidence          (MIWF, 1993). The differences in elevation between land
rate of the Ganges–Brahmaputra–Meghna (GBM) delta to be             surveys by IWM and FINNMAP indicated the land subsi-
5.6 mm yr−1 , with an overall median of 2.9 mm yr−1 .               dence. An average subsidence was computed, which was
   The area was severely affected by the recent storms Sidr,        used to update the elevations of the FINNMAP survey for
Aila and Mohasen in 2007, 2009 and 2013 respectively. For           the areas within Polder 48 for which survey data from the
example, during Cyclone Sidr, 94 people died and 45 % of            IWM were not available. The combined DEM has a resolu-
the crops were lost in the Kalapara Sub-district (Ahamed,           tion of 50 m. The same DEM was used for the simulations
2012).                                                              of the year 2100 without any corrections for further subsi-
   Andharmanik, Galachipa and Khaprabhanga rivers are               dence. Subsidence of the coast in the past has been reported
in the east, west and north of the study area respectively,         by Brown and Nicholls (2015) and was verified with the sur-
whereas the Bay of Bengal is on the southern side of the            vey data from the IWM and FINNMAP. Subsidence may
study area (Fig. 1). Galachipa River is the widest among the        continue in the future, but in the absence of scientific studies
rivers surrounding the area. On the southern side, the study        it was not considered for the future scenarios in this research.
area has a seashore of 20 km width, which is partly protected       It is noteworthy that if subsidence continues, then the effect
by the mangrove forest at several locations. There is a nar-        of the SLR may be increased, and the results reported in this
row sea beach on the south-western side of the area. The            research should be treated to some extent as underestimated
western part of the sea-facing dike was overtopped during           values.
Cyclone Sidr, causing flooding inside the polder (Hasegawa,            The bathymetry of the sea near the coast was collected
2008). The loss of livestock and food grains was such that it       from the Global Bathymetric Chart Of the Oceans (GEBCO)
created partial deficiency of food in Kuakata (TANGO Inter-         (Smith and Sandwell, 1997). The land use data were col-
national, 2010). The average crest level of Polder 48 on the        lected from the Ministry of Land of Bangladesh. MODIS re-
northern side is 4.5 m PWD, and on the southern side (sea-          flectance data were used for the analysis of previous flood
facing side), it is 6 m PWD (Islam et al., 2013). The existing      events. The methodology and equations suggested by Hoque
embankments of 17 polders of the region, including Polder           et al. (2015) were used to analyse the MODIS reflectance
48, were redesigned and rehabilitated during the first phase        data to determine flood extents during previous flood events.
of the CEIP (Islam et al., 2013). The CEIP proposed a crest         The intention was to utilize the flood extent generated from
level of 7.36 m PWD for the dike of Polder 48 (Islam et al.,        MODIS reflectance for calibration of the hydraulic model.
2013).                                                              However, no flood images from MODIS were available dur-
                                                                    ing the simulation period.
                                                                       The river analysis tool HEC-RAS (version 5.0) from the
3   Methodology                                                     US Army Corps of Engineers was used to develop the
                                                                    1-D–2-D coupled inundation model. The flow in the river
The methodology followed is presented in Fig. 2 and de-
                                                                    was modelled in 1-D, whereas the flow over the floodplain
scribed in the following sections.
                                                                    was modelled in 2-D. HEC-RAS 5.0 is a free tool which can
                                                                    simulate 1-D, 2-D and 1-D–2-D coupled models for steady
                                                                    and unsteady flow. The 2-D module of HEC-RAS provides
                                                                    the option to simulate flow of water either with the diffu-
                                                                    sion wave equation or with the full shallow water equation

www.nat-hazards-earth-syst-sci.net/19/353/2019/                              Nat. Hazards Earth Syst. Sci., 19, 353–368, 2019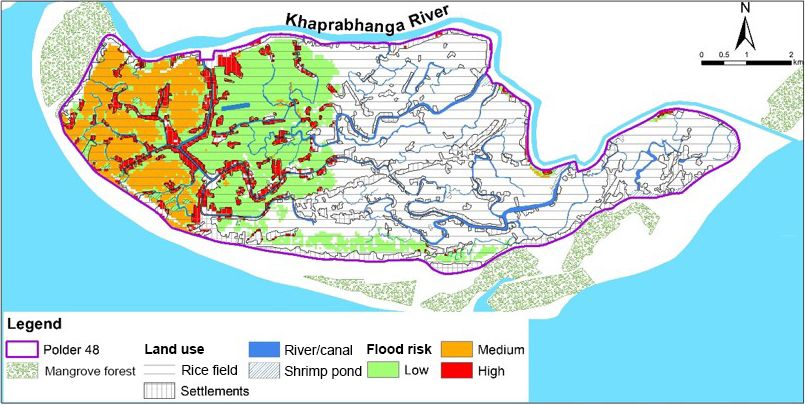
356                                                                M. F. Islam et al.: Flood risk assessment due to cyclone

Figure 1. Location map of the study area, Polder 48 (Kuakata).

                                                                 model was then coupled with the 2-D model of flow over the
                                                                 floodplain using the DEM of the study area.
                                                                    For the 1-D–2-D inundation model, a computational mesh
                                                                 with a flexible shape, was developed in HEC-RAS (Fig. 3).
                                                                 HEC-RAS generates meshes with irregular shapes. The rect-
                                                                 angular cells of the developed 2-D mesh had a resolution of
                                                                 25 m, and the non-rectangular cells had areas ranging from
                                                                 625 to 1282 m2 . The roughness coefficient (Manning’s n
                                                                 varying from 0.025 to 0.05) was provided according to the
                                                                 land use of each cell. A sensitivity analysis as suggested
                                                                 by Hall et al. (2005) was carried out by varying Manning’s
                                                                 roughness coefficient n before the calibration of the 2-D in-
                                                                 undation model.
                                                                    Building and calibrating the 1-D model was the prelimi-
                                                                 nary step for developing the 1-D–2-D coupled model. The
                                                                 water bodies surrounding the study area were included in
                                                                 the 1-D model. The study area has Khaprabhanga River on
                                                                 the northern side and the sea on the southern side (Fig. 3).
                                                                 The connection of Khaprabhanga River with other rivers was
Figure 2. Methodological approach followed in this study.        not considered in the model. This was due to the fact that
                                                                 storm surges are observed during the pre- or post-monsoon
                                                                 periods, whereas fluvial floods are observed during the mon-
                                                                 soon. Flow through rivers did not play a major role during
(St. Venant equation). The availability of irregular flexible    the previous cyclones. The western and eastern side of the
mesh in HEC-RAS and the option for faster simulations led        embankment have mangrove forests between the rivers and
to the selection of HEC-RAS 5.0 as the modelling tool. Data      the embankment (Fig. 3).
utilized for developing the model and their sources are pre-        For the river, the surveyed cross sections were used in the
sented in Table 1.                                               1-D model (Fig. 4). The storm surge on the sea was con-
   The 1-D section of the model was developed and cali-          ceptualized as a water surface profile in a 1-D channel on
brated using the information shared by the IWM. The 1-D          the southern side of the study area (Fig. 3). The GEBCO
part of the developed model was calibrated for non-flood         bathymetry (Fig. 5) was used for the channel. An alternative
conditions as measured discharge and water level data dur-       was to develop a 2-D model for the coastal hydrodynamics.
ing a cyclone event were unavailable. The model was simu-        However, as the coast of Bangladesh is flat and shallow a
lated using discharge as the west boundary and water level       large area of the sea would have been included in the model.
as the east boundary conditions (Fig. 3). The calibrated 1-D

Nat. Hazards Earth Syst. Sci., 19, 353–368, 2019                          www.nat-hazards-earth-syst-sci.net/19/353/2019/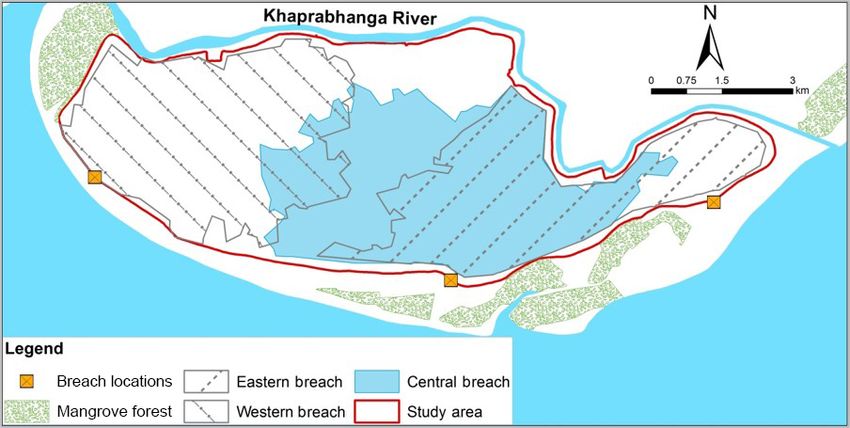
M. F. Islam et al.: Flood risk assessment due to cyclone                                                                            357

Table 1. The data used in developing the mathematical model and their sources. IWM, GEBCO and JSCE stand for the Institute for Water
Modelling, the General Bathymetric Chart of the Oceans and the Japan Society of Civil Engineers respectively.

         Component of the model      Data collected and used                     Source
                                     Alignment                                   River network: IWM; the network on the seaside:
                                                                                 satellite image (Google Earth)
         1-D networks                Cross section                               River: IWM; bathymetry of the seaside: GEBCO
                                     Water level                                 IWM
                                     Discharge                                   IWM
                                     DEM                                         IWM and FINNMAP
         2-D mesh                    Land use                                    Ministry of Land
                                     Dike alignment                              IWM
                                     Crest level of the existing dike            IWM
                                     Geometric properties of the dike            IWM
         1-D–2-D coupled model       Design crest level of the dike for          Islam et al. (2013)
                                     future development
                                     Storm surge height                          Azam et al. (2004), Islam et al. (2013)
                                                                                 and Dasgupta et al. (2014)
                                     Flood depths of previous events             JSCE

Figure 3. Schematic diagram of the study area with location of control structures and gauges and the considered breach locations.

As the focus was on studying the inundation of Polder 48 and              cyclones, making the canal network isolated. Therefore, the
not the coast, we followed a simpler representation of the                canal network inside the polder was not included in the 1-D
storm surges using a 1-D model. The synthetic water level                 model. However, the simulation of the overland flow conse-
data for boundaries of the model were generated by follow-                quent on breaching of the dike will be affected by the canal
ing the tidal water level pattern and the storm surge height              geometry, and therefore, the wider and larger canals were in-
considered for all the scenarios (Table 2). The water surface             cluded in the DEM.
profile corresponding to each scenario (Table 2, discussed in                The geometry and propagation of the breach of the dike
Sect. 3.2) was considered as the profile in the 1-D model of              depend primarily on the storm surge height, the angle of land-
the seaside (Fig. 6).                                                     fall, soil properties and wave action. The coastal embank-
   The dense canal network of 122 km, inside the study area,              ments of Bangladesh are usually earthen. The geometrical
is connected with the Khaprabhanga River, which regulates                 properties of the breaching of the dike and the time required
the in- and outflow into the river network through a system               for breaching were calculated following the instructions of
of 13 control structures. The regulators remain closed during             the US Bureau of Reclamation. An S curve was used for

www.nat-hazards-earth-syst-sci.net/19/353/2019/                                    Nat. Hazards Earth Syst. Sci., 19, 353–368, 2019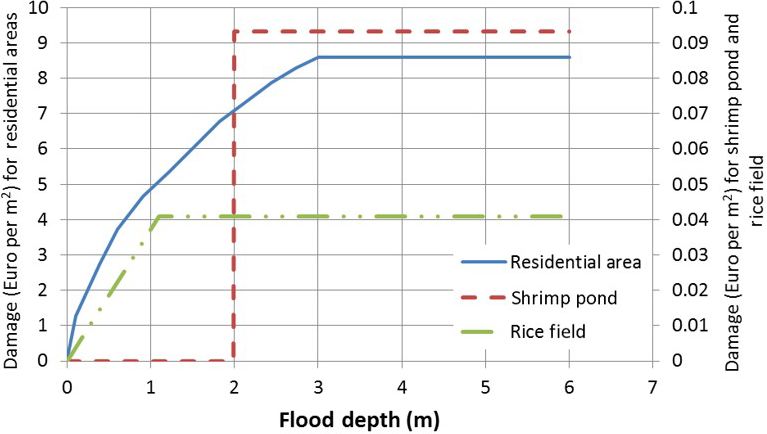
358                                                                    M. F. Islam et al.: Flood risk assessment due to cyclone

Figure 4. A typical cross section of the Khaprabhanga River.
                                                                     Figure 6. Variation of water level at three locations (chainage 0,
                                                                     12 940 and 20 300) along the 1-D channel on the seaside according
                                                                     to a specific scenario (out of 72 scenarios).

                                                                     SLR due to climate change, diurnal, semi-diurnal and sea-
                                                                     sonal variation of tides, locations of breaching of the dike
                                                                     and geometrical properties of the breach.

                                                                       – Frequency of the cyclone. A cyclone with a 1-in-25-
                                                                         year return period was considered for all the scenar-
                                                                         ios as this is used as the design criteria for the dikes
Figure 5. Cross section for the 1-D network on the seaside.
                                                                         (BWDB, 2013). A total of 19 previous cyclones for dif-
                                                                         ferent tidal conditions were simulated by the IWM using
                                                                         a 2-D model for the Bay of Bengal. A statistical analysis
breach propagation with time (Oumeraci, 2006). As the ge-                was conducted using these model results to generate the
ometry of the breach is not independent, it was not consid-              storm surge height corresponding to a cyclone with a
ered as a parameter for scenario development.                            25-year return period (Islam et al., 2013). Due to a lack
   In order to ensure model stability, a maximum spacing be-             of data, change in the probability of the occurrence of
tween the computational points was imposed and computed                  cyclones in the future was not considered.
using Samuels’ formula (1989), presented in Eq. (1):
                                                                       – Angle of landfall. The angle of landfall affects the height
1x ≤ 0.15 × D/S0 ,                                             (1)       of storm surges. The storm surge height increases with
                                                                         angle of the storm to the coastline (Azam et al., 2004).
where 1x is the spacing between the computational points,                The angle of attack governs the wind speed, which is
D is the average bank full depth of the channel and S0 is                one of the parameters for the height of cyclone-induced
the average slope of the channel. The maximum spacing be-                storm surges (Azam et al., 2013).
tween cross sections was calculated to be 300 m. The river
had a steeper bed slope than the long shore slope of the sea           – Tides. The difference between the storm surge at high
bathymetry, requiring smaller 1x to ensure stability, and the            tide and low tide is 1.2 m for the study area (Azam et
same 1x will reduce instability of the foreshore as well.                al., 2004). The average seasonal variation of the tidal
   As suggested by Fromm (1961), the Courant number was                  range is 1.3 m.
kept less than or equal to 1.0 to maintain the stability of the
numerical model by controlling the time step. The Courant              – Sea level rise. The coast of Bangladesh may be severely
number was calculated using the following Eq. (2):                       affected by SLR, and one-quarter of the land may be lost
                                                                         due to SLR by 2100, which will directly affect 3 million
Cr = V × 1t/1x,                                                (2)       people (Ericson et al., 2005). IPCC published their Fifth
                                                                         Assessment Report (AR5) in 2013. Among the scenar-
where Cr is the Courant number, V is velocity, 1t is the time            ios considered in AR5, RCP2.6 (Representative Con-
step and 1x is the spacing between the cross sections.                   centration Pathway 2.6) is the most optimistic one and
                                                                         RCP8.5 is the worst considering the carbon emission,
3.2   Cyclonic scenarios considered                                      rise in temperature and SLR. The mean SLR at the end
                                                                         of 21st century is estimated to be 0.4, 0.47, 0.48 and
Different scenarios were developed considering the proba-                0.63 m for RCP2.6, RCP 4.5, RCP6.0 and RCP 8.5 re-
bility of the occurrence of cyclones, the angle of landfall,             spectively (Stocker et al., 2013). For this study, RCP8.5

Nat. Hazards Earth Syst. Sci., 19, 353–368, 2019                              www.nat-hazards-earth-syst-sci.net/19/353/2019/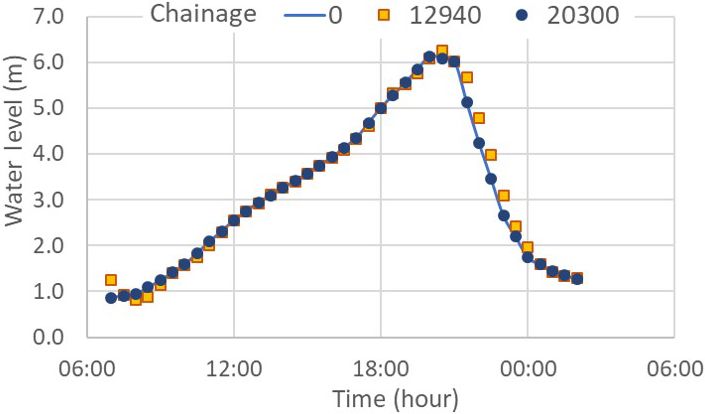
M. F. Islam et al.: Flood risk assessment due to cyclone                                                                       359

      with SLR of 0.63 m was considered for developing the         Eq. (3).
      scenarios.                                                        Xn
                                                                   D=       i=0
                                                                                x i × f (x i )  × Ai ,                         (3)
  – Location of breach. The sections of the sea-facing dike        where D is the total direct tangible damage in a flood event, n
    of the study area protected by mangrove forest, sand           is the total number of computational cells within the flooded
    dunes and a wide beach are least likely to be breached         area, xi is the flood depth of cell i, f (xi ) is the damage
    due to storm surges. The study considered breach loca-         function for the land use of the flooded cell i and Ai is the
    tions with the least protection. The locations considered      area of cell i.
    for dike breaching as well as the mangrove forest around          Depth–damage curves for different land classes for the
    the study area are shown in Fig. 3.                            study area were developed by adapting depth–damage curves
                                                                   found in the literature (Fig. 7). Reese et al. (2010) calcu-
A scenario matrix consisting of 72 scenarios was generated         lated flood damage as a percentage of the property value
by combining different phases of tides, angle of landfall, SLR     of buildings categorized based on the construction material.
and breach locations (Table 2). A single breach was consid-        The buildings of the study area are primarily built of timber
ered for all the scenarios. The highest storm surge height         due to its low cost and easy availability. The depth–damage
among all the developed scenarios was 7.2 m PWD, consider-         curve suggested by Reese et al. (2010) for buildings made of
ing the angle of landfall to be 230◦ , a high tidal phase during   timber was used as a basis for generating the depth–damage
spring tides and SLR and dike breaching at any of the cho-         curve for the settlements (residential area). Simple Action
sen locations. The highest storm surge height as the boundary      for the Environment (SAFE) carried out research on the av-
condition with breaching in the western, central and eastern       erage value of properties in rural areas of Bangladesh (SAFE,
parts of the dike was considered to be the worst-case sce-         2011). These property values were used to update the dam-
nario and was denoted as Scenario S1, S2 and S3 respec-            age values used by Reese et al. (2010). Muktadir and Hasan
tively (Fig. 2). Flooding due to overtopping of the dikes was      (1985) reported that rural houses of Bangladesh are built with
not considered as the crest level (7.36 m PWD) was higher          a large courtyard, and, as a result, houses have a lot of open
than the highest storm surge height (7.2 m PWD).                   and unoccupied space around buildings. The damage curve
   To identify the critical locations of breaching, results of     considered for the residential area was used for the dam-
the scenarios simulated with HEC-RAS corresponding to the          age to the buildings and not for the courtyard. Moreover, the
three worst-case scenarios S1, S2 and S3 were compared             satellite image of the area also indicated that about half of
based on the total area flooded and estimated damage due           the settlement was without buildings. A satellite image from
to flooding. Using the calculated damage and probability of        Google Earth was used for analysis. The satellite image of
occurrence of the event, a risk map was generated for the          the area was downloaded and georeferenced. Then, the areas
critical locations of the sea-facing dike. A probabilistic flood   for buildings and open areas for households were manually
map (PFM) was generated from the flood maps of the 72 sce-         calculated using ArcGIS. Therefore, 50 % of the settlement
narios (Table 2; Output 2 in Fig. 2). As the storm surge height    area was considered to have no damage.
suggested by Islam et al. (2013) corresponds to an event with         The cultivation of rice involves flooding the rice field with
a 25-year return period, the PFM generated in this study cor-      water up to a few centimetres. However, if the height of water
responds to a 1-in-25-year return period.                          increases and the rice plant goes under water, then the pro-
                                                                   ductivity decreases. The damage to rice plants also depends
3.3   Estimation of damage due to floods                           upon the flood duration. If the rice plant is continuously un-
                                                                   der water for more than 2–3 days, then the damage can be
A comprehensive damage calculation should involve both di-         up to 80 % (Chau et al., 2014). The simplified (with regards
rect and indirect damage due to floods (Büchele et al., 2006).     to flow velocity and flood duration) depth–damage curve for
Direct damage is caused by physical contact of properties          rice fields suggested by Chau et al. (2014) was used in this
and human beings with floodwater. Indirect damage is caused        study (Fig. 7).
by interruption of services, production and transportation and        Shrimp ponds are surrounded by embankments so that
degradation of health due to floods. Due to a lack of data,        there is no damage to shrimp ponds till the flood level crosses
only the direct damages to properties were calculated for the      the embankment level. However, when the flood level is
study area. The damage was considered a function of flood          higher than the embankment level, shrimps escape causing
depth. The land use of the study area was classified by the        a loss of the total investment. To take this into account,
Ministry of Land of Bangladesh as settlements, rice fields,        the investment made by farmers was assessed using a study
shrimp ponds and water bodies (rivers/canals). Only the tan-       conducted by Fatema et al. (2011). According to the study
gible damage was considered, and no environmental damage           the investment for shrimp pond in the study area was about
was calculated. Damage to the canal network was not con-           EUR 0.09 m−2 . Based on the practices in the study area, the
sidered. The damage in a flood event was calculated using          banks of the shrimp ponds were considered to be 2 m above

www.nat-hazards-earth-syst-sci.net/19/353/2019/                              Nat. Hazards Earth Syst. Sci., 19, 353–368, 2019
360 M. F. Islam et al.: Flood risk assessment due to cyclone
Table 2. Storm surge heights corresponding to different scenarios considered. The bold values are the storm surge height for the worst case
scenarios.
Angle of landfall Tidal variation Breach locations
East West Central
With SLR Without SLR With SLR Without SLR With SLR Without SLR
Storm surge heights
Spring tide 4.06 3.38 4.06 3.38 4.06 3.38
High tide
Neap tide 2.77 2.09 2.77 2.09 2.77 2.09
200
Spring tide 2.83 2.15 2.83 2.15 2.83 2.15
Low tide
Neap tide 1.54 0.86 1.54 0.86 1.54 0.86
Spring tide 6.16 5.48 6.16 5.48 6.16 5.48
High tide
Neap tide 4.86 4.18 4.86 4.18 4.86 4.18
215
Spring tide 4.93 4.25 4.93 4.25 4.93 4.25
Low tide
Neap tide 3.63 2.95 3.63 2.95 3.63 2.95
Spring tide 7.20 6.52 7.20 6.52 7.20 6.52
High tide
Neap tide 5.91 5.23 5.91 5.23 5.91 5.23
230
Spring tide 5.97 5.29 5.97 5.29 5.97 5.29
Low tide
Neap tide 4.68 3.99 4.68 3.99 4.68 3.99
carried out and a risk map was generated considering dike
breaching at the critical locations. Van Manen and Brinkhuis
(2005) and Klijn (2009), as part of the FLOODsite project,
carried out research to quantify the flood risk for the polders
in the Netherlands for dike failure defining the risk as a prod-
uct of the probability of occurrence of the event and the con-
sequences which was defined by Helm (1996). Equation (4)
was used to calculate the risk due to flooding:
R = PF × S, (4)
where R is risk, PF the probability of occurrence of the flood
hazard and S the consequences.
Figure 7. Depth–damage curves for different land use classes. The exceedance probability (return period) of the cyclone-
induced storm surge was used as the probability of occur-
rence of the hazard. The probability of flooding within a pro-
the adjacent land, and the depth–damage curve (Fig. 7) was tected area is not the same as the probability of the hazard
modified accordingly. and depends also upon the probability of failure of the dike.
The damage calculations were carried out using ArcGIS. It is a difficult probability to compute as the probability of
The simulated flood depth and land use for each grid cell dike failure also depends upon the dike maintenance, about
were used as input, and the damage in each grid cell was which information was not available. Here we have assumed
computed using the depth–damage curve corresponding to that the probability of occurrence of the hazard and the prob-
that land use. The damage for each scenario was estimated ability of failure of dike are the same.
using this procedure.
3.5 Probabilistic flood map
3.4 Calculation of flood risk and generation of risk
map Purvis et al. (2008) stated that the risk assessment for the
most probable scenario cannot take into account the impact
Flood risk assessment is an essential part of risk manage- of the scenario of low probability, stressing the necessity of a
ment. Spatial distribution of risk and areas requiring miti- probabilistic risk analysis. The equation suggested by Purvis
gation measures can be identified from flood risk maps. To et al. (2008) for probabilistic risk analysis was adjusted and
examine the spatial variation of risk, flood risk analysis was used for this research to calculate the probability of flooding
Nat. Hazards Earth Syst. Sci., 19, 353–368, 2019 www.nat-hazards-earth-syst-sci.net/19/353/2019/M. F. Islam et al.: Flood risk assessment due to cyclone 361
of each cell and is presented below in Eq. (5): Table 3. Flooded areas of different land classes corresponding to
the three worst-case scenarios.
Pi(i=1 to N) =
PM Land Flooded area (km2 )
j =1 Fij × Pfj
1, if flooded
PM and Fij = , (5) classes Scenario S1 Scenario S2 Scenario S3
0, if dry
j =1 Pfj
Rice fields 15.3 16.4 12.3
where Pi is the probability of flooding at cell i; Pfj is the Settlements 3.1 3.1 2.1
probability of reaching a certain storm surge level in simula- Shrimp ponds 0.2 0.1 0.1
tion number j ; Fij is the binary value indicating if the cell i is Canals 1.2 1.7 1.2
flooded or not in simulation j ; and j = 1, 2, 3, . . ., M, where Total 19.8 21.2 15.8
M is the number of scenarios considered (= 72) and i =
1, 2, 3, . . ., N are the computational grid cells on the polder
area and N is the number of cells.
Equation (5) was used in this study to calculate the prob- sitive. The sensitivity analysis was done for the breaching in
ability of flooding in each cell. The probabilistic flood map the western part of the dike only. It was considered that the
(PFM) was calculated using the results of all the scenarios. breaching in other locations will have similar effects as the
area inside the polder is flat and low-lying with mostly farm-
lands near the dike.
4 Results and discussion This 1-D–2-D model, which had limited calibration points,
was further used in simulating the developed scenarios. The
The developed 1-D–2-D model for the present study was simulated results were used to analyse flood depth, extent
calibrated for the 1-D part by comparing the observed and and damage due to flooding. The FRM and the PFM were
simulated values for discharge and water level. The corre- generated based on flood results of the model.
sponding performance indicators used for evaluation were
the coefficient of determination (R 2 ), the root mean square 4.1 Inundation corresponding to three worst-case
error (RMSE) and the mean absolute error (MAE), for which scenarios
values of 0.98, 2.15 and 1.68 m3 s−1 , respectively, were ob-
tained for discharge, and 0.98, 0.09, and 0.08 m, were ob- Among the simulated scenarios, the results of three worst-
tained for water level, respectively. The average values of the case scenarios (Scenario S1, S2 and S3) were compared to
discharge and water level for the considered simulation pe- identify the critical location of breaching. The correspond-
riod were 5.68 m3 s−1 and 0.82 m respectively. The period ing flood maps for the worst-case scenarios are presented in
of simulation for calibration coincided with the surges corre- Fig. 8.
sponding to Cyclone Sidr (from 14 to 17 November 2007). Flood extents corresponding to all different scenarios pre-
The simulation results indicate that the dike facing the sea- sented in Table 1 were compared to understand the effect of
side was overtopped and the area inside the polder was inun- SLR, diurnal and seasonal tidal variation and the angle of
dated. This conclusion is in line with the survey conducted cyclone at landfall. The flood extents of different scenarios
by the Japan Society of Civil Engineers (JSCE) (Hasegawa, considering the breaching in the central part of the sea-facing
2008). dike are presented in Fig. 9.
The coupled 1-D–2-D model has not been calibrated be- Moreover different land classes were considered while
cause there were no flood maps showing flood extents avail- computing the flood extent for the three worst-case scenarios
able for recent cyclones. However, the 2-D part of the model (Table 3). The analysis of the flood extent for different flood
was pseudo-calibrated considering MODIS reflectance data. depths, based on the considered land uses, is presented in
Such data were used in order to analyse the inundation ex- Fig. 10. The highest storm surge height among all the devel-
tent, though this also posed considerable challenges due to oped scenarios was 7.2 m PWD (Table 2). This storm surge
the cloud coverage during the cyclones. The survey con- height with breaching at the western, central and eastern parts
ducted by JSCE after Cyclone Sidr aimed to investigate the of the dike was considered as the worst-case scenario and
flood extent and depth, but only provided flood depth for one was denoted as Scenario S1, S2 and S3 respectively.
location inside the study area. This location was used for
the calibration of 2-D model. The difference between the re- 4.2 Comparison of calculated damages
ported and the simulated flood depth was 4.5 %. Prior to the
calibration of the 2-D model, sensitivity analysis was carried The damage due to flooding was calculated using the depth–
out regarding the roughness coefficient (Manning’s n). The damage curves for different land classes. The calculated
analysis indicated that the inundation model is not highly damage for different land classes and damage for different
sensitive to the roughness coefficient, and the areas of low flood depths corresponding to the three worst-case scenarios
flows (locations furthest from the dike breach) are most sen- are presented in Table 4 and Fig. 11.
www.nat-hazards-earth-syst-sci.net/19/353/2019/ Nat. Hazards Earth Syst. Sci., 19, 353–368, 2019362 M. F. Islam et al.: Flood risk assessment due to cyclone
Figure 8. Flood extent corresponding to three worst-case scenarios of dike breaching in the central, eastern and western section of the dike.
Table 4. Calculated flood damages for different land classes corre-
sponding to different scenarios.
Land Estimated flood damages (million Euros)
classes Scenario S1 Scenario S2 Scenario S3
Rice fields 0.4 0.4 0.3
Settlements 10.3 10.3 8.3
Shrimp ponds 0.0 0.0 0.0
Total 10.7 10.7 8.7
Figure 9. Comparison of flooded areas corresponding to different
scenarios considering the breaching in the central part of the sea-
facing dike.
Figure 11. Variation of estimated flood damages with varying
ranges of flood depths corresponding to Scenario S1, S2 and S3.
Figure 10. Flooded areas for different ranges of flood depths corre-
sponding to different scenarios.
4.3 Risk map for the worst-case scenario
The flood risk map for the scenario with the critical loca-
Figures 10 and 11 correspond to the flooded area and dam- tions of dike breaching is presented in Fig. 12. The risk map
age due to different ranges of inundation respectively. The presents the assessed risk of flooding due to breaching at crit-
flood area and damage were highest for inundation depths of ical locations of the dike. Comparison of the flooded area and
0.5 to 1.0 m. damage due to flooding for the three worst-case scenarios
Nat. Hazards Earth Syst. Sci., 19, 353–368, 2019 www.nat-hazards-earth-syst-sci.net/19/353/2019/M. F. Islam et al.: Flood risk assessment due to cyclone 363
led to the identification of Scenario S1 as the critical loca- est damage compared to other land use classes (Tables 3 and
tion of breaching. The identification of the critical location 4). This can be explained by the high damages in settlements
of breaching is described in Sect. 4.5. compared to rice fields (Table 4). The damage to crops de-
pends on the flood depth, duration and overland flow ve-
4.4 Probabilistic flood map locity. For simplification, only the damage related to flood
depth was used. As the probability of cyclones was consid-
Although the inundation maps are widely used for spa- ered the same for all the scenarios, the calculated damage
tial planning and flood mitigation measures, the uncertainty governed the estimated flood risk; i.e., higher damage to the
of mathematical modelling affects the output of inundation settlements translated as a higher risk of flooding. The pri-
maps (Alfonso et al., 2016). In order to account for un- mary economic activity of the inhabitants of the study area
certainty, probabilistic flood maps are suggested to be used is farming (BBS, 2011), and most of the inhabitants are poor
(Domeneghetti et al., 2013). The probabilistic flood map was (with a poverty rate of 0.628) (Alamgir et al., 2018). Even
calculated from the inundation maps corresponding to the 72 though the estimated damage and risk of flooding to crops
scenarios considered in the study. Probabilistic flood maps were much less compared to areas with other land uses, it
were calculated for a threshold of flood depth greater than will affect the people living in the study area most as they
0.5 m. The developed damage curves suggest that the damage depend on the farming of rice for their livelihood (Nasreen
for flood depth below 0.5 m is minimal. Moreover, consider- et al., 2013). Hasan et al. (2004) found out that the depen-
ing the widely accepted “living with floods” philosophy in dence on fishing (in the sea) by the inhabitants of Polder 48
Bangladesh, a threshold of 0.5 m was adopted. This thresh- is increasing due to loss of crops by flood, loss of produc-
old was used in developing the PFMs. This threshold was tivity, lack of jobs and poverty. Fishing in the coastal region
not considered while the estimation of damage due to flood- of Bangladesh yields lower economic returns, leading to en-
ing was conducted. The calculated probabilistic flood map is hanced poverty (Hasan et al., 2004).
presented in Fig. 13. The probabilistic flood map indicates The damage was maximum for flood depths of 0.1 to 0.5 m
the likelihood of being flooded. This will assist the planning for all the scenarios (Fig. 11). The damage due to inunda-
for future land use zoning, which can be used to restrict fur- tion less than 0.1 m was small and insignificant. Damage is
ther developments in the floodplains. a function of flood depth, but the unit is per unit area (per
m2 ). Therefore, if the flood extent for higher depths is lower,
4.5 Discussion on the results the damage due to flooding might be lower even though
the flood damage increases significantly for inundation more
The flood extent for the simulated result of 72 scenarios was than 0.5 m according to the depth–damage curves developed
compared. Flood extent varies for different scenarios with (Fig. 7).
different conditions such as the daily (high and low tide) and Generated the PFM indicated that the areas adjacent to the
biweekly (spring and neap tide) tidal variation, sea level rise dike facing the seaside have a higher probability of flood-
and the angle of landfall (Fig. 9). ing and the rice fields are more prone to flooding (Fig. 13).
Three worst-case scenarios (Scenario S1, S2 and S3) were Moreover, the areas protected by mangrove forest might also
compared by generating flood maps and calculating total be flooded if the unprotected location of the dike is breached
flooded areas and total damages. The flood maps for Sce- (Fig. 13), stressing the importance of proper maintenance of
nario S1, S2 and S3 (Fig. 8) demonstrated that a large area the dike everywhere.
was flooded for all the breach locations. At least 25 % of the The damage due to flooding was maximum for Scenario
total area of Polder 48 was inundated for the three scenarios S1, which results in a higher risk of flooding for Scenario
(Table 3). In the case of all three scenarios considered, the in- S1. The total flooded area for settlements of Scenario S1 was
undation area with flood depths from 0.5 to 1.0 m was larger lower than Scenario S2 (Table 3), but the estimated dam-
than the inundation areas with other flood depths (Fig. 10). age for settlements of Scenario S1 was more than Scenario
The inundation area with flood depths more than 1 m was S2 (Table 4). This indicates that the settlements in Scenario
largest for Scenario S3, due to the depressions close to the S1 were exposed to greater flood depth and a higher risk
dikes (Fig. 10). The rice fields were flooded most, while the of flooding than Scenario S2. Furthermore, Scenario S1 had
shrimp ponds were flooded least in all the scenarios (Table 3). similar total damage due to flooding, with a lower flood ex-
Flood risk was quantified with damage due to floods (neg- tent than Scenario S2 (Tables 3 and 4). Considering these
ative consequences) and the probability of occurrence. The facts, Scenario S1 was selected as the worst-case scenario,
total estimated damages due to flooding for Scenario S1, S2 and breaching in the western part of the sea-facing dike was
and S3 were EUR 10.7, 10.6 and 8.6 million, respectively identified as the critical location for breaching during cy-
(Table 4). For all the scenarios, a 1-in-25-year cyclone event clones.
was considered. The damages in the settlements were greater The scenarios with the effect of climate change (sea level
than other land classes for all the scenarios (Table 4). Rice rise) had more damage compared to the scenarios without cli-
fields were flooded most but they did not experience the high- mate change. Scenarios S1, S2 and S3 were associated with
www.nat-hazards-earth-syst-sci.net/19/353/2019/ Nat. Hazards Earth Syst. Sci., 19, 353–368, 2019364 M. F. Islam et al.: Flood risk assessment due to cyclone Figure 12. Flood risk map corresponding to the breaching at the critical location of the dike. The following three classes of risk are shown: high, medium and low. The four land uses considered are shown as well. Figure 13. Probabilistic flood map of the study area. Varying colours indicate probabilities of obtaining flood depths more than 0.5 m. the highest storm surge height. With the same set of condi- probability of flooding was considered the same as the prob- tions without climate change (sea level rise), the storm surge ability of occurrence of storm surges. The depicted risk map height was 6.52 m PWD (Table 2). The damage correspond- (Fig. 12) shows the areas adjacent to the dike breach are at ing to breaching of eastern, central and western locations of higher risk, and the risk reduces as the flood propagates to- the dike due to the storm surge without climate change im- wards the east. pact was 23.3 %, 20.5 % and 21.7 % lower than the damage Canals are used as a mode of transportation by the inhab- with the climate change impact respectively. The correspond- itants of the area. Most of the economic activities and resi- ing values for the flood extent were 30.1 %, 21.67 % and dential areas are near the canals. The risk analysis show that 27.21 % lower than the flood extent areas with the climate the areas at highest risk are the settlements by the canals change impact respectively. (Fig. 12). Therefore, although canals play a crucial role in The probability of occurrence of the storm surge and dam- the economy and social life of the area, they also increase age caused by inundation were taken into consideration for the risk of flooding and probability of higher damage to the the risk calculation. In the case of breaching of the dike, the adjacent areas. Nat. Hazards Earth Syst. Sci., 19, 353–368, 2019 www.nat-hazards-earth-syst-sci.net/19/353/2019/
M. F. Islam et al.: Flood risk assessment due to cyclone                                                                       365

   Land use planning plays an important role in the reduc-         the vulnerability. Similarly, developing land for infrastruc-
tion of vulnerability to disasters (Burby, 1998). Probabilistic    ture and household on the landside of the dikes increases vul-
flood maps (PFMs) can be used for land use planning (Al-           nerability. Combining the effects of increased vulnerability
fonso et al., 2016). For better understanding of the area at       and higher flood depth results in an elevated risk of flooding
risk of flooding due to the breaching of dikes, PFMs were          due to the breaching of dikes during a cyclone.
generated for the study area (Figs. 12, 13). The results of 72        Inundation maps of all 72 scenarios were compared to gen-
scenarios from the scenario matrix were used for the calcula-      erate the probabilistic flood map, which indicated that the ar-
tion of PFM. The areas adjacent to the sea dikes had a higher      eas with rice fields are the least probable areas to be flooded,
probability of flooding due to the breaching of dikes for both     and the settlements are the most probable areas to be flooded.
PFMs. The areas inland had a lower probability of flooding.        Although the inhabitants are mostly dependent on agricul-
Existing land use indicates that the areas with a lower prob-      ture, the flooding of settlements will cause most damage and
ability of flooding are mostly rice fields (Figs. 12, 13). Land    force relocation.
use zoning and management using the PFM can reduce the                Measured storm surge levels for previous cyclones were
vulnerability.                                                     unavailable. Therefore, for this research synthetic water
                                                                   level time series were generated considering the storm surge
                                                                   height presented by Islam et al. (2013), for a cyclone with a
5   Conclusions                                                    25-year return period. The probability of flooding in a pro-
                                                                   tected area is complicated, and it was assumed that the prob-
A 1-D–2-D coupled model was developed to investigate the           abilities of storm surge occurrence and breaching are the
inundation pattern inside a polder due to breaching of a dike      same. A limited number of field observations were available
by cyclone-induced storm surges. Different scenarios were          to compare the results of the 2-D model. The limited calibra-
formulated and simulated using a 1-D–2-D coupled model.            tion possibility of hydraulic models stresses the importance
The results of these simulations were used to calculate the        of field observations before, after and during flood events. As
total flooded area and damage due to flooding. Simulated           the future land use data were not available, current land use
results of three worst-case scenarios, S1, S2 and S3, were         has been used for the future scenarios as well.
compared based on the total flooded area and estimated dam-           The primary objective of the research was to present a
age. The comparison led to the identification of the critical      methodology for generating FRMs and PFMs for the breach-
location of dike breaching during a cyclone. The flood risk        ing of dikes during a cyclone. Due to the lack of data on the
map and probabilistic flood map were generated for the dike        existing conditions and previous history of breaching of the
breaching during a storm surge using the results of the devel-     dike, the probability of the dike breaching could not be de-
oped scenarios to identify the areas at higher risk and higher     termined. Comprehensive surveys should be conducted to de-
probability of flooding.                                           termine the physical conditions of the existing embankments
   Flood inundation for the three worst-case scenarios, S1,        and their breach history. Using these data, a joint probability
S2 and S3, indicated that the maximum flooded area was ob-         of flooding due to storm surges and breaching may be con-
tained corresponding to the breaching of the central part of       sidered in future studies. As the sea beach outside the dike
the sea-facing dike. The highest depth was obtained corre-         on the seaside was not included in the 2-D model, the ef-
sponding to Scenario S2 (breaching in the central part). The       fect of mangrove forest could not be determined. A single
damage for scenarios S1 (breaching in the western part) and        breach location was considered for all the scenarios devel-
S2 (breaching in the central part) was equal. From these find-     oped. The probability of multiple dike breaching for a polder
ings it can be concluded that the flood extent, flood depth        should be studied as well. Moreover, due to a lack of data,
and damage depended on the breach location. Moreover, the          the storm surge height for the present scenarios was used for
comparison of the flood damage and flood extent led to the         future scenarios as well. As the sea surface temperature will
identification of Scenario S1 as the worst-case scenario and       change in the future due to climate change, the height and in-
the western part of the sea-facing dike as the critical location   tensity of the storm surges will be affected as well. Research
for breaching.                                                     on the change of storm surge height and intensity due to cli-
   The scenarios considering the effect of climate change (sea     mate change should be conducted in the future. Bathymetric
level rise) indicated that the flood extent and damage due to      data with a coarse grid resolution from GEBCO were used as
flooding will increase with sea level rise.                        the measured bathymetric data for the sea were not available.
   Flood risk was calculated as the product of the probabil-       Furthermore, the study relied on the previous literatures for
ity of occurrence of a flood event and negative consequences       developing depth–damage curves. Conducting field surveys
(damage). The generated flood risk maps indicated that for         to generate these curves will provide a more reliable esti-
all the scenarios, areas adjacent to the dike and canals inside    mate of damages due to flooding. The developed and simu-
the polder had a higher risk of flooding. For better access to     lated model depended on the field measurements and logical
the canals, for transportation and for livelihood, development     assumptions which might be the source of errors. For dam-
of infrastructure and households nearby the canals increases

www.nat-hazards-earth-syst-sci.net/19/353/2019/                             Nat. Hazards Earth Syst. Sci., 19, 353–368, 2019
366 M. F. Islam et al.: Flood risk assessment due to cyclone
ages, only direct damages were included. Inclusion of indi- References
rect damages will provide more realistic estimates.
Bangladesh is a hazard-prone country, and cyclone- Ahamed, S., Rahman, M. M., and Faisal, M. A.: Reducing Cyclone
induced storm surges are one of many natural disasters that Impacts in the Coastal Areas of Bangladesh: A Case Study of
Kalapara Upazila, Journal of Bangladesh Institute of Planners,
affect the coast of Bangladesh. The storm surges cause se-
ISSN 2075, 9363, 185–197, 2012.
vere damage to the earthen embankments/dikes protecting Alamgir, M., Furuya, J., Kobayashi, S., Binte, M., and Salam, M.:
the coastal polders. The methodology presented in this paper Farmers’ Net Income Distribution and Regional Vulnerability to
to develop the 1-D–2-D inundation model, the PFMs and the Climate Change: An Empirical Study of Bangladesh, J. Climate,
risk maps and to identify the critical locations for breaching 6, 65, https://doi.org/10.20944/preprints201805.0306.v1, 2018.
can assist in better preparedness against flooding and help Alfonso, L., Mukolwe, M. M., and Di Baldasssarre, G.: Probabilis-
in damage reduction through land use zoning and manage- tic Flood Maps To Support Decision-Making: Mapping the Value
ment. At present, the PFM and FRM due to storm surges and of Information, Water Resour. Res., 52, 1026–1043, 2016.
breaching of the dikes are not available for the coastal pold- Azam, M. H., Samad, M. A., and Mahboob-Ul, K.: Effect of Cy-
ers. clone Track And Landfall Angle on The Magnitude of Storm
Climate change will likely cause increase in the frequency Surges Along the Coast of Bangladesh in the Northern Bay of
Bengal, Coast. Eng. J., 46, 269–290, 2004.
and intensity of cyclones around the world. This will call
Bangladesh Bureau of Statistics (BBS): Population Census
for large investments for the improvement of existing or 2011, available at: http://www.bbs.gov.bd/Census2011/Khulna/
new protection structures for the deltas. The identification Khulna/Khulna_C01 (last access: 25 February 2016), 2012.
and prioritization of maintenance of critical locations of dike Bangladesh Water Development Board (BWDB): Technical Fea-
breaching can potentially prevent a disaster. Non-structural sibility Studies and Detailed Design for Coastal Embankment
tools such as land use zoning, with the help of flood risk Improvement Programme (CEIP) (Main Report), Ministry of
maps and probabilistic flood maps, have the potential to re- Water Resources, Government of the People’s Republic of
duce the risk and the damage due to dike breaching. The Bangladesh, available at: http://bwdb.gov.bd/archive/pdf/364.pdf
method presented in this research can potentially be utilized (last access: 20 August 2016), 2013.
for the deltas around the world to reduce vulnerability and Barredo, J. I. and Engelen, G.: Land use scenario modeling for flood
flood risk due to the breaching of dikes caused by cyclone- risk mitigation, Sustainability, 2, 1327–1344, 2010.
Brown, S. and Nicholls, R. J.: Subsidence and human influences in
induced storm surges.
mega deltas: the case of the Ganges-Brahmaputra-Meghna, Sci.
Total Environ., 527, 362–374, 2015.
Burby, R. J. (Ed.): Cooperating with Nature: Confronting Natural
Data availability. The data used in this research were provided by Hazards with Land-Use, Planning for Sustainable Communities,
the Institute of Water Modelling (IWM) for research purposes only. Joseph Henry Press, 366 pp., 1998.
IWM is the owner of the data. Therefore, the authors do not have Büchele, B., Kreibich, H., Kron, A., Thieken, A., Ihringer, J.,
the authority to share the data publicly. Oberle, P., Merz, B., and Nestmann, F.: Flood-risk mapping:
contributions towards an enhanced assessment of extreme events
and associated risks, Nat. Hazards Earth Syst. Sci., 6, 485–503,
Author contributions. All the authors contributed to the conceptu- https://doi.org/10.5194/nhess-6-485-2006, 2006.
alization, development of methodology, writing and editing of the Center for Research on the Epidemiology of Disaster (EMDAT):
manuscript. In addition to these MFI carried out the model simula- The International Disaster Database, available at: http://www.
tion and analysis, and BB and IP supervised the research. emdat.be/database (last access: 16 May 2016), 2009.
Chau, V. N., Cassells, S. M., and Holland, J.: Measuring Direct
Losses to Rice Production From Extreme Flood Events in Quang
Competing interests. The authors declare that they have no conflict Nam Province, Vietnam, in: 2014 Conference (58th), 4–7 Febru-
of interest. ary 2014, Port Maquarie, Australia (No. 165813), Australian
Agricultural and Resource Economics Society, 2014.
Climate-Data: Climate: Kuakata, available at: http://en.climatedata.
Acknowledgements. The support of the Institute of Water Mod- org/location/969757/, last access: 11 March 2016.
elling (IWM), Dhaka, Bangladesh, in providing the surveyed data Cyclone Shelter Preparatory Study (CSPS): Mathematical Mod-
is gratefully acknowledged. elling of Cyclone Surge and Related Flooding, Cyclone Risk
Area Development Project, Vol. I., Bangladesh Disaster Pre-
Edited by: Bruno Merz paredness Center, 1998.
Reviewed by: Alex Curran and one anonymous referee Dasgupta, S., Huq, M., Khan, Z. H., Ahmed, M. M. Z., Mukher-
jee, N., Khan, M. F., and Pandey, K.: Cyclones in A Changing
Climate, The Case of Bangladesh, Clim. Dev., 6, 96–110, 2014.
Domeneghetti, A., Vorogushyn, S., Castellarin, A., Merz, B., and
Brath, A.: Probabilistic flood hazard mapping: effects of uncer-
tain boundary conditions, Hydrol. Earth Syst. Sci., 17, 3127–
3140, https://doi.org/10.5194/hess-17-3127-2013, 2013.
Nat. Hazards Earth Syst. Sci., 19, 353–368, 2019 www.nat-hazards-earth-syst-sci.net/19/353/2019/You can also read