Hydrogeomorphic Impacts of Floods in a First-Order Catchment: Integrated Approach Based on Dendrogeomorphic Palaeostage Indicators, 2D Hydraulic ...

Page created by Sidney Gallagher
 
CONTINUE READING
Hydrogeomorphic Impacts of Floods in a First-Order Catchment: Integrated Approach Based on Dendrogeomorphic Palaeostage Indicators, 2D Hydraulic ...
water
Article
Hydrogeomorphic Impacts of Floods in a First-Order
Catchment: Integrated Approach Based on
Dendrogeomorphic Palaeostage Indicators,
2D Hydraulic Modelling and
Sedimentological Parameters
Radek Tichavský, Stanislav Ruman and Tomáš Galia *
 Department of Physical Geography and Geoecology, Faculty of Science, University of Ostrava, Chittussiho 10,
 710 00 Ostrava, Czech Republic; radek.tichavsky@osu.cz (R.T.); stanislav.ruman@osu.cz (S.R.)
 * Correspondence: tomas.galia@osu.cz; Tel.: +420-553-46-2307
                                                                                                    
 Received: 22 November 2019; Accepted: 10 January 2020; Published: 12 January 2020                  

 Abstract: Floods represent frequent hazards in both low- and first-order catchments; however,
 to date, the investigation of peak flow discharges in the latter catchments has been omitted due to
 the absence of gauging stations. The quantification of flood parameters in a first-order catchment
 (1.8 km2 ) was realised in the moderate relief of NE Czechia, where the last flash flood event in 2014
 caused considerable damage to the infrastructure. We used an integrated approach that included
 the dendrogeomorphic reconstruction of past flood activity, hydraulic modelling of the 2014 flash
 flood parameters using a two-dimensional IBER model, and evaluation of the channel stability using
 sedimentological parameters. Based on 115 flood scars, we identified 13 flood events during the
 period of 1955 to 2018, with the strongest signals recorded in 2014, 2009 and 1977. The modelled
 peak flow discharge of the last 2014 flood was equal to 4.5 m3 ·s−1 (RMSE = 0.32 m) using 26 scars
 as palaeostage indicators. The excess critical unit stream power was observed at only 24.2% of the
 reaches, representing predominantly bedrock and fine sediments. Despite local damage during the
 last flood, our results suggest relatively stable geomorphic conditions and gradual development of
 stream channels under discharges similar to that in 2014.

 Keywords: flood; dendrogeomorphology; palaeostage indicator; hydraulic modelling; peak flow
 discharge; unit stream power; bed shear stress

1. Introduction
      Extreme rainfall resulting in flood events is a common phenomenon in different environments,
including both mountain ranges and lowlands [1,2]. The systematic monitoring of flow stages at
gauging stations, including precipitation and flow discharge prediction, is currently well applied and
documented in many medium- and large-sized rivers [3–5]. In contrast, data from mountain steep
headwater catchments and, in general, first-order catchments [6] are still poor, due to the insufficient
network of stream gauges and the sporadic amount of processed documentary evidence [7]. Not only
do mountain headwater streams generate sediment-laden flows with aftermaths within and along
fans [8,9], but also streams and gullies of first-order catchments (up to 10 km2 ) in moderate relief can
be responsible for local damage to infrastructure. Ozturk et al. [10] analysed extraordinary flash flood
events (140 mm per 2 h) in a small catchment (6 km2 ) that resulted in damage to infrastructure and a
high amount of suspended sediments (t/km2 ) due to intense hillslope–channel coupling. In addition,
Terti et al. [11] pointed to a short response time of small catchments to flash floods, thereby increasing
the probability of trapping people during outdoor activities.

Water 2020, 12, 212; doi:10.3390/w12010212                                        www.mdpi.com/journal/water
Hydrogeomorphic Impacts of Floods in a First-Order Catchment: Integrated Approach Based on Dendrogeomorphic Palaeostage Indicators, 2D Hydraulic ...
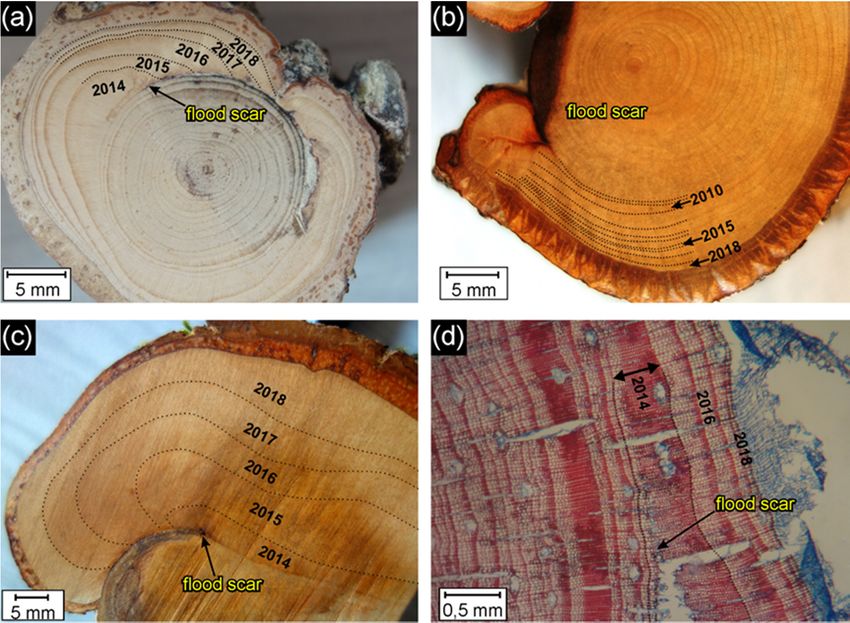
Water 2020, 12, 212                                                                                 2 of 19

      Despite the lack of gauging records from forested first-order catchments, several approaches exist
to describe the hydrogeomorphic impacts of extremely high flow stages. The dating of flood scars on
riparian vegetation using dendrogeomorphic methods [12,13] and recording their position and height
above the channel bottom with a combination of hydraulic models is a well-established approach for
the estimation of peak flood discharge, flow velocity, and unit stream power [14]. Using flood scars
as a palaeostage indicator (PSI; maximum height of the scar above the channel bottom) allowed the
interpretation of past flood events in medium- and large-scale rivers (catchment areas larger than
40 km2 ), for example, in the Western Mediterranean [15], North America [16,17], the Carpathians [18],
and the Himalayas [19]. The dendrogeomorphic response of flash floods in small catchments is
generally considered lower [20] but may increase due to the presence of erodible sediments amplifying
lateral bank erosion. In such conditions, while small streams may not generate flood waves as large as
those of large rivers, the presence of exposed and scarred tree roots [21] may complete a relatively low
number of scarred tree stems.
      The alluvial streams draining first-order catchments often do not display clear relationships
between channel geometry, bed substrate, unit stream power and drainage area, and their resulting form
and evolution trajectory are unpredictable unless local conditions (e.g., bedrock resistance, intensity
of hillslope-channel coupling processes, land use history, and presence of large instream wood)
are constrained [22–26]. These streams are characterized by a more or less developed stepped-bed
morphology with a wide range of sediment size, where individual steps controlling channel bed
stability consist of interlocked boulders, bedrock outcrops or large wood pieces [27]. This implies the
relative stability of their channel beds under relatively high discharges (up to floods of 20–50-year
recurrence intervals) and thus only limited adjustments of the channel morphology and geometry to
lower (e.g., bankfull) flows owing to the presence of generally shallow flows, particle-size interactions
(hide/protrusion effect) and additional bed form resistance [25,28–31]. The correlations between the
unit stream power, sediment calibre and prevailing fluvial process may exist at the reach scale when
spatially limited depositional reaches can be accompanied by local bed sediment fining and an abrupt
decrease in the unit stream power of a high-magnitude flood [23]. Nevertheless, our knowledge of the
direct relationships between the transport capacity of a particular flood event, bed stability and the
resulting fluvial processes in first-order catchments is still somewhat limited by the lack of detailed
post-flood field surveys of geomorphic consequences.
      As mentioned, two-dimensional hydraulic models have been successfully applied to peak
discharge reconstructions in ungauged or poorly gauged catchments of various sizes and
environments [18,32–35]. This peak discharge is mostly defined not as the single deterministic
value but rather as a range of values due to uncertainties inherent in the process of the estimation [36].
Discharges predicted in such a way could be used in flood frequency analyses [18], where they serve
as outliers to the measured discharges. Consequently, the predicted discharges could serve as a basis
for the evaluation and mitigation of flood risk [34] or as information about the flood magnitude in the
historical period [32]. Moreover, the results of hydraulic simulations can be used for the estimation
of stream transport capacity and channel stability during a particular flood event at a very detailed
scale. In this sense, the bed shear stress and unit stream power are relevant parameters for calculating
the incipient motion of coarse bed particles and thus evaluating the stability of stepped-bed channels
consisting of relatively stable cobble to boulder steps [30,37].
      For our purposes, we selected a first-order catchment (1.8 km2 ) in the moderate relief of the
Eastern Sudetes (NE Czechia), where, during the last 15 years, the occurrence of several flash flood
events caused substantial geomorphic imprints [38]. In particular, the last intense precipitation event
(27 May 2014) resulted in a moderate flood risk in the case of medium-sized rivers (2-year recurrence
interval), but a discharge of an approximately 100-year recurrence interval was estimated at ungauged
small streams. The short-lived storm, with a total rainfall amount of 40 mm (locally up to 80 mm),
had an intensity of between 40 and 60 mm/h. Its hydrogeomorphic response was primarily due to
Hydrogeomorphic Impacts of Floods in a First-Order Catchment: Integrated Approach Based on Dendrogeomorphic Palaeostage Indicators, 2D Hydraulic ...
Water 2020, 12, 212                                                                                                  3 of 19
Water 2020, 12, x FOR PEER REVIEW                                                                                    3 of 19

due to unprecedented
unprecedented       rainfallrainfall   intensity
                               intensity   and largeandantecedent
                                                         large antecedent      precipitation.
                                                                       precipitation.          The financial
                                                                                        The financial          costs
                                                                                                         costs of theof the
                                                                                                                      flash
flash flood
flood         aftermaths
       aftermaths    in thein    the affected
                              affected  regionregion      were calculated
                                                   were calculated            as approximately
                                                                       as approximately            EUR 200,000
                                                                                           EUR 200,000     [39]. [39].
     Our   aims   were    to (i) create the   chronology     of the  flash flood  events  in this
     Our aims were to (i) create the chronology of the flash flood events in this small catchment small  catchment    using
dendrogeomorphic          approaches,     (ii) estimate   the parameters      (peak  flow discharge,
using dendrogeomorphic approaches, (ii) estimate the parameters (peak flow discharge, flow velocity,   flow  velocity,  bed
shearshear
bed    stress,  and unit
             stress,  and stream      power)
                             unit stream         of theoflast
                                             power)        the2014
                                                                last flash
                                                                      2014 flood   event event
                                                                            flash flood  using using
                                                                                                 the combination     of PSI
                                                                                                         the combination
and  2D   hydraulic     modelling,     and   (iii) describe   the  stream    transport  capacity
of PSI and 2D hydraulic modelling, and (iii) describe the stream transport capacity and channel     and  channel   stability
during the
stability      2014theflash
          during         2014flood    eventevent
                               flash flood     based   on the
                                                     based       hydraulic
                                                            on the   hydraulic simulation
                                                                                 simulationdata
                                                                                              dataand
                                                                                                    and sedimentological
                                                                                                         sedimentological
parameters.    Such    a  comprehensive        approach    may   help   to better  quantify  the
parameters. Such a comprehensive approach may help to better quantify the flash flood parameters  flash flood  parameters
of ungauged      streams     and   thus  contribute    to  more   reliable   management
of ungauged streams and thus contribute to more reliable management of small streams in      of small   streams   in future
                                                                                                                     future
extreme climate
extreme   climate events.
                     events.

2. Materials and Methods

2.1. Study Site
2.1. Study Site
      The
      The hydrogeomorphic
           hydrogeomorphic impactsimpacts of of floods
                                                floods were
                                                         were studied
                                                               studied onon aa small
                                                                                small tributary
                                                                                      tributary ofof the
                                                                                                     the Bělá
                                                                                                         Bělá River
                                                                                                                River in
                                                                                                                       in
the foreland   of the   Eastern  Sudetes   (NE   part of Czechia,   Central  Europe;   50 ◦ 170 N, 17◦ 170 E; Figure 1).
the foreland of the Eastern Sudetes (NE part of Czechia, Central Europe; 50°17’N, 17°17’E; Figure 1).
The
The area
      areacomprises
            comprisesa Proterozoic
                           a Proterozoicandand
                                             Palaeozoic    basement
                                                  Palaeozoic          composed
                                                                basement           of orthogneiss,
                                                                             composed                which iswhich
                                                                                           of orthogneiss,     overlaid is
by  glacifluvial
overlaid          deposits ofdeposits
           by glacifluvial      the Saalian    andSaalian
                                          of the   Elsterian  glaciations
                                                            and   Elsterianwith   different
                                                                             glaciations     grain-size
                                                                                           with          distributions
                                                                                                  different  grain-size
of till sediments.
distributions   of tillThese  deposits
                        sediments.   Thesearedeposits
                                              the result  ofthe
                                                        are  deglaciation    phases in proglacial
                                                                 result of deglaciation    phases in areas   on the
                                                                                                      proglacial      ice
                                                                                                                   areas
margins
on the iceand   were recently
             margins     and were covered
                                     recentlybycovered
                                                 the Holocene
                                                          by thesandy     loamsandy
                                                                   Holocene      colluvium
                                                                                       loam [40,41].
                                                                                              colluvium The[40,41].
                                                                                                             study The
                                                                                                                     site
is characterised   by   a temperate    climate,   with a mean    annual   precipitation   between
study site is characterised by a temperate climate, with a mean annual precipitation between 850 and 850 and   900  mm.
Most
900 mm. precipitation   falls during
            Most precipitation         theduring
                                    falls   springthe
                                                    andspring
                                                          summer  andmonths
                                                                       summer  [42], with an
                                                                                  months       occasional
                                                                                            [42], with an occurrence
                                                                                                             occasional
of extreme daily
occurrence           rainfalldaily
              of extreme       (more   than 50
                                    rainfall     mm than
                                              (more   per day).
                                                            50 mm  Documentary      evidence provides
                                                                     per day). Documentary                information
                                                                                                   evidence    provides
about   several flood   events  (e.g., 1903, 1921,  1971,  1977,  2007, 2009,  and  2014), relating  to
information about several flood events (e.g., 1903, 1921, 1971, 1977, 2007, 2009, and 2014), relating toboth  advective
rains  and short-term
both advective    rains intense   rainfall events
                          and short-term     intensethat are currently
                                                      rainfall           responsible
                                                               events that             for intense
                                                                              are currently         gully incision
                                                                                              responsible           and
                                                                                                            for intense
damage    to infrastructure
gully incision   and damage    within   the studied within
                                 to infrastructure    region [38,43].
                                                              the studied region [38,43].

      Figure 1.
      Figure  1. Location
                 Location of
                          ofthe
                             thestudy
                                 studysite:
                                        site:position
                                              positionwithin
                                                        within Central
                                                             Central   Europe
                                                                     Europe (a),(a), within
                                                                                 within  thethe Eastern
                                                                                             Eastern    Sudetes
                                                                                                     Sudetes (b),
      (b), and (c) orthophoto  image  of the  studied  catchment (1—study   channel   reach,  2—main
      and (c) orthophoto image of the studied catchment (1—study channel reach, 2—main road, 3—railway road, 3—
      railway
      and      and 4—cycle
           4—cycle  path). path).

     We focused
         focused on  on an
                         an approximate
                             approximate 700-m-long reach of an unnamed first-order stream draining a
catchment area of  of 1.8  km22with
                       1.8 km   witha amean
                                        meanelevation
                                              elevationofof  417.5
                                                           417.5 mm    a.s.l.
                                                                    a.s.l.     Fields
                                                                            Fields andand   dwellings
                                                                                        dwellings       dominate
                                                                                                     dominate  the
the upper
upper  andand    middle
             middle         catchment
                        catchment      area,
                                    area,    while
                                           while thethe lowerpart
                                                      lower    part(i.e.,
                                                                     (i.e.,the
                                                                            thestudy
                                                                                study reach)
                                                                                       reach) is predominantly
covered
covered by
         by aa mixed
               mixed forest
                        forest(Figure
                               (Figure1c).
                                       1c).The
                                            Themean
                                                meanstream
                                                       streamgradient
                                                               gradientofofthethestudy
                                                                                  studyreach
                                                                                         reachisis0.05
                                                                                                   0.05m/m,
                                                                                                        m/m,with
                                                                                                             witha
maximum
a maximumup   uptoto0.17
                     0.17m/m.
                           m/m.The
                                 Thechannel
                                     channelcuts
                                              cutsinto
                                                   intothe
                                                        thePleistocene
                                                            Pleistoceneand and Holocene
                                                                                Holocene deposits,
                                                                                           deposits, with typical
alternations of stepped-bed morphology and bedrock outcrops (Figure 2a) accompanied by poorly
Hydrogeomorphic Impacts of Floods in a First-Order Catchment: Integrated Approach Based on Dendrogeomorphic Palaeostage Indicators, 2D Hydraulic ...
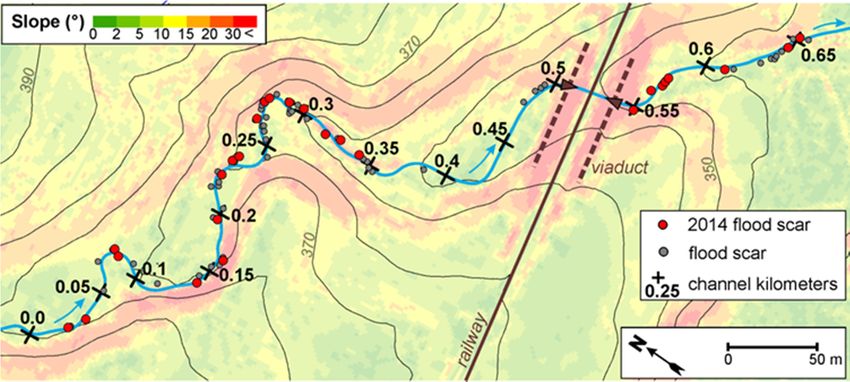
Water 2020, 12, 212                                                                                                            4 of 19

alternations of stepped-bed morphology and bedrock outcrops (Figure 2a) accompanied by poorly
      Water 2020, 12, x FOR PEER REVIEW                                                                            4 of 19
sorted bed sediments (Figure 2b,c). Fresh slope/bank failures (up to 50 m long and 10 m high) and
generally
      sortedunstable     banks have
              bed sediments            caused
                                 (Figure   2b,c). channel    widening
                                                  Fresh slope/bank      during
                                                                      failures    recent
                                                                                (up to 50floods,
                                                                                           m long resulting
                                                                                                   and 10 m in  the and
                                                                                                              high)  frequent
occurrence
      generally unstable banks have caused channel widening during recent floods, resulting in thereach
              of  exposed     tree  root  systems    and   flood  scars  on  riparian    vegetation  along  the entire
(Figure   2b–d).occurrence
      frequent      In contrast,    there istree
                               of exposed      no evidence
                                                   root systemsof and
                                                                   deepflood
                                                                          channel
                                                                               scars incision   due
                                                                                      on riparian   to the resistant
                                                                                                  vegetation  along the gneiss
      entire
bedrock    andreach
                 large (Figure  2b–d). In
                         interlocked        contrast,
                                       boulders      atthere  is no
                                                        several      evidence
                                                                 reaches         of deep
                                                                            within         channel Slopes
                                                                                     the stream.   incisionand
                                                                                                             duefloodplains
                                                                                                                  to the
      resistant the
surrounding      gneiss   bedrock
                       channel   areand  large interlocked
                                     overgrown      by a mixedboulders
                                                                   forestatcomposed
                                                                            several reaches   within the stream.
                                                                                         predominantly           Slopes
                                                                                                          of Pinus   sylvestris
      and  floodplains    surrounding    the  channel   are overgrown    by  a mixed   forest composed  predominantly
L., Picea abies (L.) Karst., Alnus glutinosa (L.) Gaertn, and Tilia cordata Mill. At 0.5 river km (r. km),
      of Pinus sylvestris L., Picea abies (L.) Karst., Alnus glutinosa (L.) Gaertn, and Tilia cordata Mill. At 0.5
the stream    drains to a 50-m-long concrete trough within a viaduct under a railway. Moreover, culverts
      river km (r. km), the stream drains to a 50-m-long concrete trough within a viaduct under a railway.
are presented under a cycle path in the lower part and under a road through a village in the middle
      Moreover, culverts are presented under a cycle path in the lower part and under a road through a
part of  the catchment.
      village in the middle part of the catchment.

      FigureFigure  2. Morphological
               2. Morphological        featuresofofthe
                                    features        thestudy
                                                        study channel
                                                               channel reach:
                                                                        reach:(a)
                                                                                (a)channel
                                                                                     channelbottom
                                                                                               bottomcomposed
                                                                                                        composed of gneiss
                                                                                                                      of gneiss
            bedrock;
      bedrock;         (b) channel
                  (b) channel      widening
                                widening     evidencedby
                                            evidenced      by the
                                                              the system
                                                                  systemofofexposed
                                                                              exposed  tree roots
                                                                                          tree    in boulder-step
                                                                                               roots                reach;reach;
                                                                                                      in boulder-step
            (c) step-pool
      (c) step-pool   reachreach with
                              with thethe presenceofofchannel
                                        presence        channel widening
                                                                 widening and
                                                                            andfresh,   shallow
                                                                                   fresh,  shallowslope failure;
                                                                                                     slope       (d) flood
                                                                                                            failure;   (d) flood
            scars (higher older, and lower younger) on the tree stem of A. glutinosa in the direction of flow (note
      scars (higher older, and lower younger) on the tree stem of A. glutinosa in the direction of flow (note the
            the remnants of concrete parts of centring transported by past floods).
      remnants of concrete parts of centring transported by past floods).
     2.2. Dendrogeomorphic
2.2. Dendrogeomorphic      Fieldwork
                       Fieldwork     andAnalyses
                                   and   Analyses
            First, the terrain fieldwork focused on dendrogeomorphic sampling to create the chronology of
     First, the terrain fieldwork focused on dendrogeomorphic sampling to create the chronology
     past flood events and to select the flood scars caused by the 2014 flood event. The tree sampling
of past  flood events
     followed             and to
                 the standard     select the flood scars
                                dendrogeomorphic             caused
                                                      procedure         by thereconstruction
                                                                   for flood     2014 flood event.
                                                                                              [13,44].The
                                                                                                       The tree   sampling
                                                                                                             sampling
followed
     was focused on flood scars occurring either on tree stems or exposed tree roots. In the case ofsampling
            the standard     dendrogeomorphic        procedure      for  flood  reconstruction    [13,44].  The     tree
was focused    on flood cores
     stems, increment     scarswere
                                 occurring   either
                                       extracted    onthe
                                                 from   tree  stems
                                                           edge       or scar
                                                                  of the  exposed   tree roots.
                                                                               and from         In the case
                                                                                         the undisturbed      of of
                                                                                                           part  treethestems,
increment    cores
     tree stem     were
                 using  theextracted  from the edge
                             Pressler increment   borerof the
                                                        (40    scar
                                                             × 0.5    andTree
                                                                   mm).     fromstems
                                                                                  the undisturbed   part of(up
                                                                                       of a small diameter    thetotree
                                                                                                                      10 stem
usingcm)
       thewere    cut by
            Pressler      handsawborer
                       increment     in the(40
                                             position  of the Tree
                                                × 0.5 mm).     floodstems
                                                                       scar toofgain the stem
                                                                                 a small       disc or
                                                                                          diameter     wedge
                                                                                                     (up  to 10while
                                                                                                                  cm) were
     approximately
cut by  handsaw in 2-cm-wide
                        the positioncross-sections
                                        of the floodwere
                                                      scarsampled
                                                            to gainfrom      exposed
                                                                       the stem   discand
                                                                                       or scarred
                                                                                           wedge living
                                                                                                   whileroots.    Only
                                                                                                           approximately
     those   scars oriented   against the  supposed   direction  of  the  flow  path were  considered
2-cm-wide cross-sections were sampled from exposed and scarred living roots. Only those scars          for  sampling.
oriented against the supposed direction of the flow path were considered for sampling. In addition,
Hydrogeomorphic Impacts of Floods in a First-Order Catchment: Integrated Approach Based on Dendrogeomorphic Palaeostage Indicators, 2D Hydraulic ...
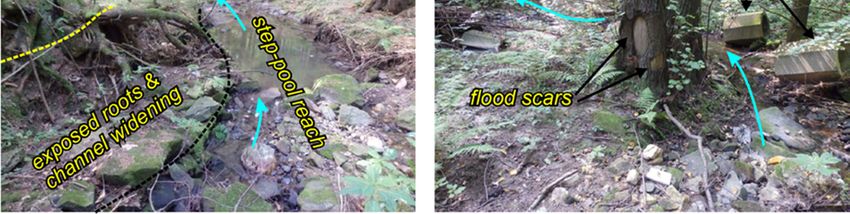
Water 2020, 12, 212                                                                                                          5 of 19

only scars   that12,occurred
      Water 2020,    x FOR PEER onREVIEW
                                    exposed but stabilized roots with the lowest tendency to flex during                      higher
                                                                                                                         5 of 19

discharges were used to avoid the underestimation of modelled peak flow discharge [45]. All sampled
      In addition, only scars that occurred on exposed but stabilized roots with the lowest tendency to flex
trees were carefully described, and the height of the sampled scar was carefully noted, labelled with a
      during higher discharges were used to avoid the underestimation of modelled peak flow discharge
visible  object, photographed, and targeted using GPS. Reference trees growing near the study reach
      [45]. All sampled trees were carefully described, and the height of the sampled scar was carefully
without    any
      noted,     geomorphic
              labelled             influence
                         with a visible   object,on  tree growthand
                                                   photographed,       were    sampled
                                                                           targeted   usingtoGPS.
                                                                                               cross-date
                                                                                                   Reference with
                                                                                                               treesthe  disturbed
                                                                                                                      growing
samples
      nearand    to eliminate
            the study             false and
                         reach without     anymissing
                                                 geomorphicrings.
                                                                influence on tree growth were sampled to cross-date
      Laboratory     processing
      with the disturbed     samplesfollowed
                                        and to the    standard
                                                 eliminate   falsedendrogeomorphic
                                                                    and missing rings. procedure [13,46]. All increment
cores were glued into woody supports and—together withdendrogeomorphic
            Laboratory      processing     followed     the   standard       cross sections—dried   procedure    [13,46].
                                                                                                        and polished        Allready
                                                                                                                        to be
      increment     cores  were    glued   into  woody     supports    and—together       with  cross
for dendrogeomorphic analysis. The tree rings of the increment cores and stem discs were counted and    sections—dried     and
      polished
measured     usingto be ready forand
                     TimeTable      dendrogeomorphic
                                         PAST4 softwareanalysis.
                                                               [47], andThe   treegrowth
                                                                            their   rings ofpatterns
                                                                                             the increment
                                                                                                       were cores    and stem
                                                                                                              compared     with the
      discs were counted and measured using TimeTable and PAST4 software [47], and their growth
appropriate reference chronology (compiled in Arstan software [48] using a double detrending procedure)
      patterns were compared with the appropriate reference chronology (compiled in Arstan software
to ensure the reliability of dating. As root segments are more problematic regarding the occurrence of
      [48] using a double detrending procedure) to ensure the reliability of dating. As root segments are
missing    and wedging rings, the zig-zag segment tracing method [49] was applied to carefully count
      more problematic regarding the occurrence of missing and wedging rings, the zig-zag segment
the years   of method
      tracing  each ring. [49]In
                               wastheapplied
                                       case oftoproblematic
                                                  carefully count roots
                                                                      the (i.e.,
                                                                           yearsdense
                                                                                  of eachgrowth
                                                                                           ring. Inincrement
                                                                                                     the case ofand    small roots),
                                                                                                                 problematic
we used    microslides     cut  by  GLS-1    microtome      and  processed       according   to standard
      roots (i.e., dense growth increment and small roots), we used microslides cut by GLS-1 microtome      chemical    procedures
to precisely   define the
      and processed          position
                        according       of the flood
                                     to standard         scar within
                                                    chemical            the root
                                                               procedures           sectiondefine
                                                                              to precisely   [50,51].
                                                                                                    the position of the flood
      scar
      In thewithin
              nextthe    root
                     step,   wesection  [50,51].the years with the occurrence of scars and onset of callus tissues
                                 identified
(Figure 3)Inandthe compiled
                    next step, wetheidentified
                                      chronology  the years
                                                       of pastwith   the occurrence
                                                                 flood   events. Scars of scars  and onset
                                                                                            represent        of callus tissues
                                                                                                         an unequivocal        signal
      (Figure   3) and  compiled     the chronology      of past  flood  events.   Scars  represent
of flood events and are considered the most reliable growth disturbance in dendrogeomorphic flood     an unequivocal    signal
      of flood events and are considered the most reliable growth disturbance in dendrogeomorphic flood
reconstructions      [44]. The event identification was based on the event-response index (It index [52]),
      reconstructions [44]. The event identification was based on the event-response index (It index [52]),
calculated as:
      calculated as:
                                                               P
                                                                  Rt
                                                        It = P        × 100%                                                      (1)
                                                            ∑ At
                                                         =       ∑          100%                                           (1)
where R is the number of scars in a year t and A is the total number of sampled trees living in a year t.
Then,where   R is the number of scars in a year t and A is the total number of sampled trees living in a year
        a certain  event was considered when It ≥ 10% and the number of scars ≥ 3, while a probable
      t. Then, a certain event was considered when It ≥ 10% and the number of scars ≥ 3, while a probable
event was determined when 10% > It ≥ 5% and the number of scars ≥ 2. From the whole dataset of
      event was determined when 10% > It ≥ 5% and the number of scars ≥ 2. From the whole dataset of
scars,scars,
        we eventually    selected the scars dated to 2014 as a PSI of the May 2014 flash flood event, whose
             we eventually selected the scars dated to 2014 as a PSI of the May 2014 flash flood event, whose
parameters    werewere
      parameters     modelled.
                         modelled.

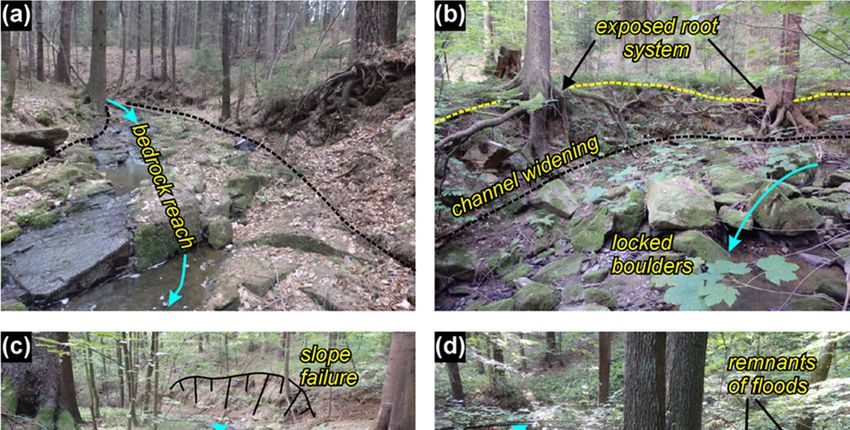
      FigureFigure 3. Identified
              3. Identified      flood
                              flood    scars:
                                    scars:  (a)(a)the
                                                   the2014
                                                       2014 flood
                                                             flood scar
                                                                   scaron
                                                                        onthe
                                                                           theroot
                                                                               rootsection of P.
                                                                                     section  ofabies; (b) the
                                                                                                 P. abies; (b) 2009 floodflood
                                                                                                               the 2009
            scar on the root section of T. cordata; (c) the 2014 flood scar on the stem wedge of A. glutinosa; and (d)
      scar on the root section of T. cordata; (c) the 2014 flood scar on the stem wedge of A. glutinosa; and (d)
      the 2014 flood scar on the root microsection of P. sylvestris, with the obvious position within earlywood
      cells indicating the flood event on 27 May.
Hydrogeomorphic Impacts of Floods in a First-Order Catchment: Integrated Approach Based on Dendrogeomorphic Palaeostage Indicators, 2D Hydraulic ...
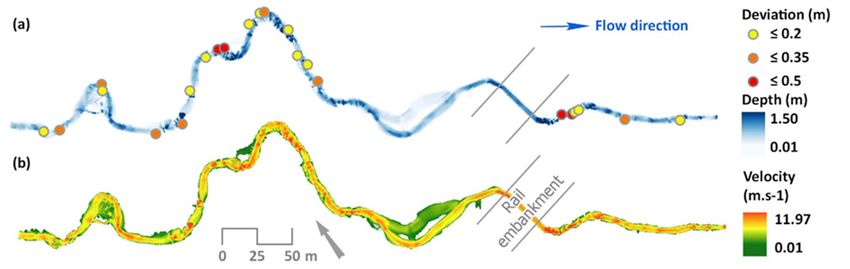
Water 2020, 12, 212                                                                                   6 of 19

2.3. Channel Parameters and Channel Geometry
      This part consisted of (i) the measurement of the longitudinal profiles (channel/floodplain
geometry) to model the 2014 flood behaviour and (ii) the classification of erosive/depositional segments
and the measurement of the largest clasts for the determination of channel stability during the
2014 floods:
      (i) The channel/floodplain geometry and the height of the 2014 scars (PSI) were measured in cross
sections using a total station (GTS-212) with an accuracy of ±2.5 cm and a GNSS geodetic receiver
(Trimble R2) with an accuracy of ±4 cm. All measurements were taken in the spring of 2019. To register
the complexity of the channel geometry, the density of cross sections was as follows: the position of
the first cross section was located directly in the position of the scars. Afterwards, five cross sections
were measured, with the distance of one meter among each other, followed by two cross sections at a
distance of 2.5 m and one cross section at a distance of 5 m. Next, cross sections were measured at
a distance of 10 m. In the case of close distances between the scars, no overall process was applied.
In total, 341 cross sections were measured, resulting in 4300 surveyed points. The GNSS geodetic
receiver was only applied to place the relative position of points to the absolute location based on the
local geographical reference system. A digital terrain model (DTM) in raster format was created from
these cross sections with a grid size equal to 0.1 m and was used as a source for the hydraulic modelling.
      (ii) To reveal the channel stability during the last flood event, the middle axes of the five largest
bed particles were measured by a tape (with ±0.01 m accuracy; with a less-precise ±0.05 m accuracy
only in a few cases of partially buried boulders) in 10 ± 1 m intervals along the stream’s longitudinal
profile, except for the reach located in the culvert (0.51–0.54 r. km). Only the particles within the
bankfull channel were accounted for. Consequently, the representative mean boulder diameter MBD
(mm) for each of the channel cross sections was calculated as the arithmetical mean of these five
measurements [23]. We classified each cross section as erosional, stable, or depositional by the observed
signs of the present stability of the adjacent channel reach. The erosional reaches indicated trends of
incision together with the frequent presence of exposed roots or bedrock outcrops in the channel banks,
whereas the depositional reaches were typified by the occurrence of locally widened channels with
developed unvegetated bars. The stable reaches represented the transport-balanced segments without
evident signs of recent incision or bed aggradation. We observed no wood obstructions in the channel
that would influence the channel bed stability and sediment transport processes.

2.4. Hydraulic Modelling
      This phase comprised three steps: (i) hydraulic model creation, setup and calibration; (ii) estimation
of scar peak discharges (SPD) and reach peak discharge; and (iii) scenario modelling of the 2014 flood
event. The two-dimensional IBER model (version 2.5.1) was applied to the hydraulic modelling of the
selected reach [53]. This is an established software that was applied to the estimation of palaeoflood
discharges of small [18] to large rivers [35,45]. An unstructured mesh, which comprised almost
200,000 elements with an average size of 0.3 m, was developed over the reach. As an initial condition
at t = 0, the river was set dry. The flow was subcritical throughout the whole domain for all used
discharges. We imposed inlet boundary conditions based on the uniform discharge and the critical
depth at the outlet of the studied reach. The first PSI was located 20 m from the outlet of the reach, which
allowed the model to overcome inaccuracy in the selected boundary conditions. A wet–dry threshold
of 0.01 m and 2nd order roe scheme was chosen. The Courant–Friedrichs–Lewy was set to 0.9 and the
mixed length turbulence model was selected. Although the erosion and accumulation of alluvium
could occur during the 2014 flood, we considered the stable riverbed during the modelling [54]. The
model was calibrated to a single value of water stage in the cross section where we measured the
discharge (equal to 25.23 cubic litres per second), using the velocity meter. The cross section was
located in the downstream part of the selected reach and the measurement took place at the end of
May 2019. Based on the calibration results, a uniform value for Manning’s roughness coefficient (n)
equal to 0.08 was applied to the overall reach. The selection of the roughness value was based on the
Hydrogeomorphic Impacts of Floods in a First-Order Catchment: Integrated Approach Based on Dendrogeomorphic Palaeostage Indicators, 2D Hydraulic ...
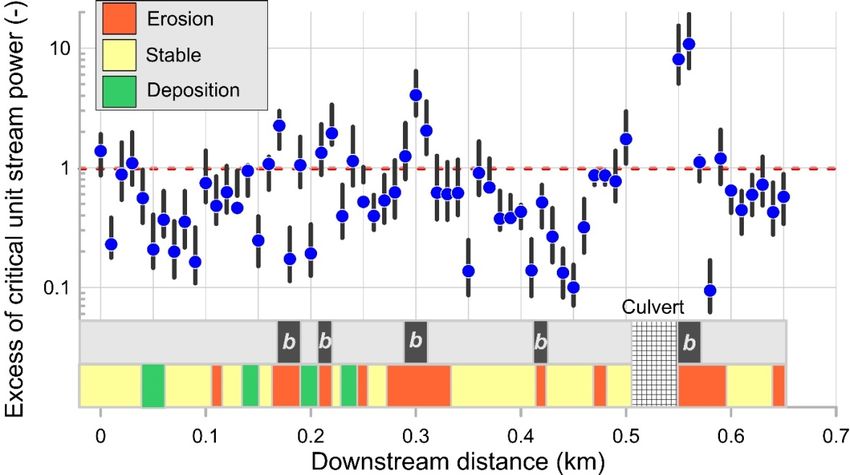
Water 2020, 12, 212                                                                                   7 of 19

studies dealing with high-gradient streams [55,56]. In the second step, an iterative process was run to
find the SPD [57] that produced the best fit between the scars and modelled water depths [58] and to
select the reach peak discharge that produced the best RMSE value [32]. Finally, the three scenarios
were established to model the characteristics (unit stream power and bed shear stress) of the 2014
flood event: Qmin (discharge equal to the 1st quartile of the SPD), Qoptimum (reach peak discharge which
produced the optimum/lowest value of RMSE), and Qmax (the 3rd quartile of the SPD). Although the
main results were created for the Qoptimum, the remaining scenarios allowed the evaluation of the
uncertainty inherent in palaeoflood discharge estimation [36].

2.5. Relations between the Hydraulic and Sedimentologic Parameters and Calculation of Channel Stability
      To evaluate the flow competence of the 2014 flood (i.e., the ability of this flood to transport coarse
bed material and destabilize the channel bed), we used the critical unit stream power ωci –transported
particle diameter Di (mm) relationship. To approximate the local conditions of the frequent occurrence of
a stepped-bed morphology, relatively high channel gradients and a small catchment area, we applied the
relationship developed by field observations in similar steep channels (0.06 ≤ S ≤ 0.14 m/m) draining
small catchments (0.2 ≤ A ≤ 2.2 km2 ) in Central European medium–high mountain settings [23,59]:

                                             ωci = 0.72Di 1.02                                            (2)

     This relationship (2) was derived from direct observations of the largest boulders that were
transported by a high-magnitude flood event and from the displacements of marked particles during
lower discharges (covering grain-sizes 20–400 mm) in stepped-bed streams with poorly sorted bed
sediments. As Di , we substituted MBD and calculated the potential critical unit stream power ωcMBD ,
which will lead to the incipient motion of MBD in a given cross section. The resulting value was
compared with the unit stream power ω simulated for the 2014 event, and the excess critical unit
stream power ωE was expressed in the following form:
                                                       ω
                                              ωE =                                                        (3)
                                                     ωcMBD

       This implies that ωE ≥ 1 indicates a potentially unstable bed structure consisting of coarse grains
(i.e., rapids or individual step units) during the 2014 event. We simulated ωE for all three scenarios
(Qmin , Qoptimum and Qmax ).
       In addition, we employed the peak bed shear stress of the 2014 event (τb ) to find a possible
relationship between the parameters of τb , ω and MBD and to assess potential differences between the
groups of cross-sections by their present stability (erosional, vertically stable and depositional) during
the Qoptimum scenario. Due to the non-normality of the data, we used Spearman’s correlation rsp to test
the potential relationships between τb , ω and MBD. A non-parametric Kruskal–Wallis test was used to
compare τb , ω and MBD between the reaches with depositional, transport-balanced and erosional
tendencies when the Z-value test with Bonferonni corrections was used to distinguish significantly
different groups. We used a significance level of 0.05 for all the tested data.

3. Results

3.1. Chronology of Past Flood Events and Botanical Evidence of the May 2014 Flash Flood Event
      In total, we successfully sampled and dated 75 scarred individuals (20 tree stems and 55 scarred
roots) with a predominance of samples from P. sylvestris (37.3%), P. abies (18.7%), and A. glutinosa
(17.3%), whereas five samples (root cross sections) had to be excluded from the chronology due to
uncertainties during the dating procedure (Table 1). Eventually, it was possible to date 115 scars
(1.5 scars per tree). Overall, we determined 13 flood events (seven certain and six probable events)
during the period of 1955 to 2018 (limited by the minimum number of 10 sampled trees; Figure 4).
Hydrogeomorphic Impacts of Floods in a First-Order Catchment: Integrated Approach Based on Dendrogeomorphic Palaeostage Indicators, 2D Hydraulic ...
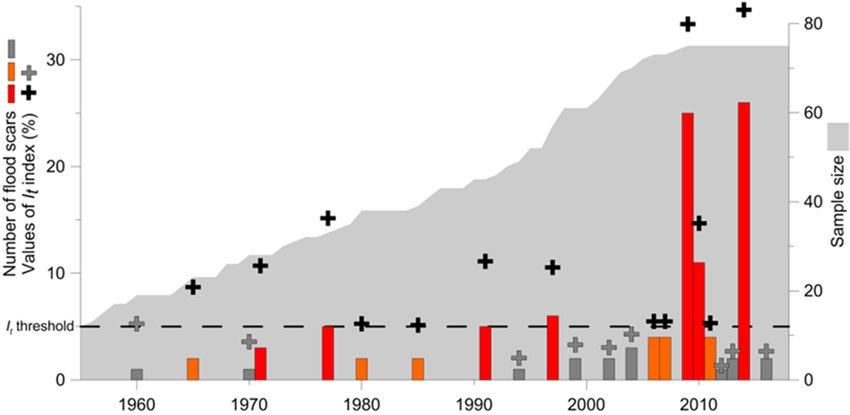
were identified during 2014 (26 scars; It = 34.7%), 2009 (25 scars; It = 33.3%), and 1977 (5 scars; It =
15.2%).
      Focusing on the botanical evidence of the 2014 flood event, we identified 26 scars throughout
the whole study reach (6 scars on tree stems and 20 scars on exposed roots; Table 1). The mean height
of the2020,
Water  scars12,above
               212    the thalweg was 96.6 ± 34.6 cm. The minimum height (41 cm) was observed at8 0.33       of 19
r. km at a straight channel reach, while the maximum height (156 cm) was recorded at 0.07 r. km at
the failure of a concave bank. The distribution of the 2014 scars (Figure 5) was zero at the reach
The oldest
between       (probable)
            0.35 and 0.5 event
                           r. km,was recorded
                                  where        in 1965.
                                        the total  number Theofstrongest
                                                                 scarred signals (i.e.,generally
                                                                         trees was       the highest value
                                                                                                  lower,   of the
                                                                                                         and  the
It index)   were   identified  during 2014 (26 scars;
scars were generally of older dates. In contrast, the I t = 34.7%),  2009  (25 scars;
                                                            highest abundance of the    I  = 33.3%), and  1977
                                                                                          t 2014 flood scars was(5
scars; It =between
recorded     15.2%). 0.2 and 0.35 r. km (11 scars overall).

     Table 1.
     Table      Overall number
            1. Overall  number of
                               of sampled
                                  sampled and
                                          and dated
                                              dated trees
                                                     trees and
                                                           and the
                                                                the distribution
                                                                    distribution of
                                                                                 of samples
                                                                                    samples containing
                                                                                            containing the
                                                                                                       the
     2014 scar.
     2014 scar.
                                                                                             Number of Samples
                         Nr. of   Percentage     Nr. of Root    Nr. of Stem                 Number of
     Tree Species          Nr. of ofPercentage                                             Containing theSamples
                                                                                                          2014 Scar
      Tree Species       Trees       Trees (%) of Sections
                                                   Nr. of Root Sections/Cores
                                                                 Nr. of Stem
                                                                                          Containing the 2014 Scar
                           Trees       Trees (%)        Sections      Sections/Cores         Root             Stem
    Pinus sylvestris       28           37.3             28                  0                Root
                                                                                               5              Stem
                                                                                                                0
     Pinus
       Piceasylvestris
              abies        14 28           37.3
                                        18.7             13 28               10                65               00
        Piceaincana
     Alnus      abies      13 14           18.7
                                        17.3              6 13               71                46               20
      Tilia
      Alnus cordata
               incana       9 13        12.0
                                           17.3           7 6                27                44               02
          Acer
       Tilia cordata       6 9          8.012.0           0 7                62                04               20
    pseudoplatanus
   Acer pseudoplatanus         6           8.0              0                 6                 0                2
   Sorbus aucuparia         5           6.7              1                   4                 1                2
    Sorbus aucuparia           5           6.7              1                  4                1                2
          Total            75          100.0             55                 20                 20               6
          Total               75          100.0             55               20                20                6

     Figure 4.
             4. Number
                Numberofof    identified
                           identified floodflood
                                              scarsscars  andfinal
                                                    and the    thechronology
                                                                    final chronology
                                                                               of flood of  flood
                                                                                        events    events
                                                                                                (based     (based on
                                                                                                       on thresholds:
     It ≥ 5% andItnumber
     thresholds:   ≥ 5% and    scars ≥ 2).
                            ofnumber        The red
                                       of scars  ≥ 2).column
                                                       The redindicates   a certain aevent,
                                                                column indicates      certainand the orange
                                                                                               event, and thecolumn
                                                                                                              orange
     indicatesindicates
     column    a probable  event. The
                        a probable     grey The
                                     event.   column
                                                   greyand  grey cross
                                                         column         indicate
                                                                  and grey  crossyears that could
                                                                                   indicate  years not
                                                                                                   thatbe considered
                                                                                                        could  not be
     flood events.
     considered  flood events.

     Focusing on the botanical evidence of the 2014 flood event, we identified 26 scars throughout the
whole study reach (6 scars on tree stems and 20 scars on exposed roots; Table 1). The mean height
of the scars above the thalweg was 96.6 ± 34.6 cm. The minimum height (41 cm) was observed at
0.33 r. km at a straight channel reach, while the maximum height (156 cm) was recorded at 0.07 r. km
at the failure of a concave bank. The distribution of the 2014 scars (Figure 5) was zero at the reach
between 0.35 and 0.5 r. km, where the total number of scarred trees was generally lower, and the scars
were generally of older dates. In contrast, the highest abundance of the 2014 flood scars was recorded
between 0.2 and 0.35 r. km (11 scars overall).
Hydrogeomorphic Impacts of Floods in a First-Order Catchment: Integrated Approach Based on Dendrogeomorphic Palaeostage Indicators, 2D Hydraulic ...
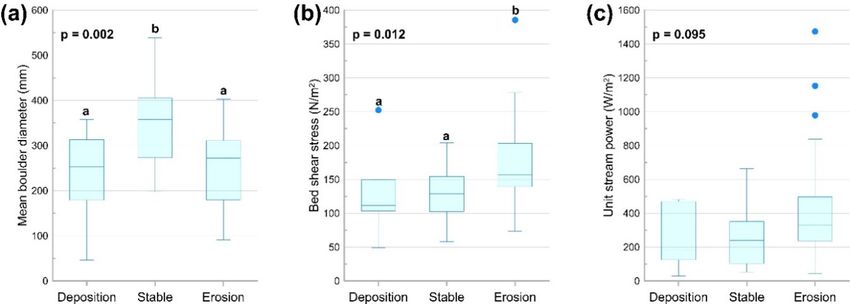
Water 2020, 12, 212                                                                                          9 of 19
Water 2020, 12, x FOR PEER REVIEW                                                                            9 of 19

                 Figure
                 Figure 5.
                        5. Localization
                           Localization of
                                        of the
                                           the 2014
                                               2014 flood
                                                    flood scars
                                                          scars within
                                                                within the
                                                                       the studied
                                                                           studied channel
                                                                                   channel reach.
                                                                                           reach.

3.2. Results
3.2. Results of
             of Hydraulic
                Hydraulic Modelling
                          Modelling
      The flow
     The    flow conditions
                  conditions during
                               duringthe
                                       thesimulations
                                           simulationswere
                                                        weresubcritical
                                                              subcriticalininthe
                                                                              themajor
                                                                                  majorpart
                                                                                         partofofthe
                                                                                                   thereach (91–94%
                                                                                                        reach (91%–
of theoftotal
94%       the area)
               total for allfor
                     area)   simulated  flow scenarios
                                all simulated           (Table 2).
                                               flow scenarios      Other
                                                                (Table 2).flow   characteristics
                                                                             Other                 (depth, velocity,
                                                                                    flow characteristics     (depth,
and Froude
velocity,  andnumber)     resultingresulting
                 Froude number)      from the from
                                              rasterthe
                                                     of raster
                                                        hydraulic  modelling
                                                               of hydraulic      are described
                                                                               modelling          in Table 2.
                                                                                          are described     in Table
2.
                  Table 2. Selected flow characteristics for flow scenarios applied in this study.
                Table 2. Selected flow characteristics for flow−1scenarios applied in this study.
            Flow                Depth (m)       Velocity (m·s )           Froude        Area of Supercritical
    Characteristics/Scenario Mean Depth Max (m) Mean VelocityMax
                                                               (m·s−1) MeanFroude
                                                                               Max             Flowof
                                                                                               Area  (%)
                  Flow
            Qmin               0.35     1.41      1.05       9.43      0.59    3.67         Supercritical
                                                                                                  6.43
       Characteristics/Scenario     Mean Max Mean                Max     Mean Max
          Qoptimum             0.43     1.50      1.17       11.97     0.61    3.79           Flow  (%)
                                                                                                  7.37
            QmaxQmin           0.59 0.351.95 1.41 1.44 1.05 12.029.43  0.64
                                                                          0.59 3.88
                                                                                 3.67             9.01
                                                                                                6.43
                Qoptimum             0.43    1.50      1.17     11.97     0.61   3.79           7.37
                  Qmax               0.59    1.95      1.44     12.02     0.64   3.88           9.01
     The characteristics of the RMSE curve of Qoptimum during the 2014 flood and the SPD characteristics
are shown in Figure 6. The value of the reach peak discharge (Qoptimum ) of the 2014 flood estimated by
     The characteristics of the RMSE curve of Qoptimum during the 2014 flood and the SPD
the RMSE (0.32 m) was equal to 4.5 m3 ·s−1 . The values of the SPD showed high variability (coefficient of
characteristics are shown in Figure 6. The value of the       reach peak discharge (Qoptimum) of the 2014 flood
variability = 0.79) when the minimal SPD was 1.5 m3 ·s−1 and the maximal SPD was equal to 16.5 m3 ·s−1 .
estimated by the RMSE (0.32 m) was equal to 4.5 m3·s−1. The values of the SPD showed high variability
The values of the Qmin and Qmax scenarios were calculated from all estimated         SPD and were equal to 2.63
(coefficient3of−1variability = 0.79) when the minimal SPD was 1.5 m3·s−1 and the maximal SPD was equal
and 9.38 m    ·s   , respectively.  The deviation   between   the  measured  PSI  elevations and the simulated
to 16.5 m3·s−1. The values of the Qmin and Qmax scenarios were calculated from all estimated SPD and
water level for Qoptimum ranged3from     −0.60  to 0.63 m  with  a median equal  to −0.05 m. Similarly, the Qmin
were equal to 2.63 and 9.38 m ·s−1, respectively. The deviation between the measured PSI elevations
deviations ranged from −0.30 to 0.75 m, and the median was equal to 0.08 m. For Qmax , we registered
and the simulated water level for Qoptimum ranged from −0.60 to 0.63 m with a median equal to −0.05
deviations from −1.07 to 0.42 m, and the median was equal to −0.31 m. The highest magnitudes of
m. Similarly, the Qmin deviations      ranged from −0.30 to 0.75 m, and the median was equal to 0.08 m.
velocity (up to 11.97 m·s−1 ; Figure 7) and bed shear stress (up to 1787.10 N.m−2 ) were registered at the
For Qmax, we registered deviations from −1.07 to 0.42 m, and the median was equal to −0.31 m. The
positions of the highest changes in riverbed topography.
highest magnitudes of velocity (up to 11.97 m·s−1; Figure 7) and bed shear stress (up to 1787.10 N.m−2)
were registered at the positions of the highest changes in riverbed topography.
     We further investigated the effect of the hydraulic conditions in the positions of the PSIs using
non-parametric Spearman’s correlation. However, we did not observe any significant relationship
between the PSI deviations and the velocity magnitudes for all three scenarios: Qoptimum (rsp = 0.19, p =
0.36), Qmin (rsp = 0.08; p = 0.71), and Qmax (rsp = 0.004; p = 0.98; Figure 8).
Water 2020, 12, x FOR PEER REVIEW                                                                                            10 of 19
Water 2020, 12, 212                                                                                                         10 of 19
Water 2020, 12, x FOR PEER REVIEW                                                                                           10 of 19

Water 2020, 12, x FOR PEER REVIEW                                                                                           10 of 19

      Figure 6. Parameters of the 2014 modelled flood discharge: (a) RMSE curve for the reach peak
      discharges   where three scenarios     are visualized    with the(a)uncertainty    definedtheby  Qminpeak
                                                                                                            and discharges
                                                                                                                  Qmax (filled
     Figure
     Figure   6. Parameters
             6.  Parametersofofthethe2014  modelled
                                        2014         floodflood
                                              modelled       discharge:
                                                                   discharge: RMSE
                                                                                 (a) curve
                                                                                     RMSEfor  curve reach
                                                                                                      for the   reach peak
      rectangle);  (b)
     where threewhere   the
                   scenarios box   plot  of scar peak    discharges;    (c)  the   box
                                                                          defined by Q  plots  of deviation
                                                                                                   Qmax        between      the
     discharges           threeare  visualized
                                scenarios   are with  the uncertainty
                                                visualized    with the uncertainty        min andby
                                                                                        defined      Qmin(filled
                                                                                                           and Qrectangle);
                                                                                                                   max (filled
      measured
     (b)          PSI elevation
         the box plot              and simulated (c)water   level.
                                                               plotsWhiskers    in (b) and (c)the
                                                                                                aremeasured
                                                                                                    equal to PSItheelevation
                                                                                                                    10th and
     rectangle);  (b) of
                       thescar
                            boxpeak
                                 plotdischarges;
                                        of scar peak thedischarges;
                                                         box         of(c)
                                                                        deviation
                                                                            the boxbetween
                                                                                       plots of deviation     between      the
      90th percentiles   (n = 26).
     and simulated
     measured        water level.
                 PSI elevation   andWhiskers   in (b,c)
                                       simulated   waterarelevel.
                                                             equalWhiskers
                                                                    to the 10thin and 90th (c)
                                                                                  (b) and      are equal(nto= the
                                                                                            percentiles        26).10th and
     Figure 6. Parameters of the 2014 modelled flood discharge: (a) RMSE curve for the reach peak
     90th percentiles (n = 26).
     discharges where three scenarios are visualized with the uncertainty defined by Qmin and Qmax (filled
     rectangle); (b) the box plot of scar peak discharges; (c) the box plots of deviation between the
     measured PSI elevation and simulated water level. Whiskers in (b) and (c) are equal to the 10th and
     90th percentiles (n = 26).

      Figure7.7. Raster
     Figure      Raster outputs
                         outputs ofofhydraulic
                                      hydraulicmodelling
                                                 modellingfor    theQQ
                                                             forthe     optimum scenario:
                                                                      optimum             (a) water
                                                                                scenario: (a) water depth
                                                                                                    depth and
                                                                                                           and (b)
                                                                                                                (b)
     velocity. Colored  circles illustrate the position of the 2014  PSI  (scars)  and deviations of their heights
      velocity. Colored circles illustrate the position of the 2014 PSI (scars) and deviations of their heights
     Figure 7. Raster outputs of hydraulic modelling for the Qoptimum scenario: (a) water depth and (b)
     from
      fromthe
            themodelled
                modelledflow.
                           flow.
     velocity. Colored circles illustrate the position of the 2014 PSI (scars) and deviations of their heights
     from the modelled
     We further           flow. the effect of the hydraulic conditions in the positions of the PSIs using
                   investigated
non-parametric      Spearman’s
     Figure 7. Raster              correlation.
                          outputs of             However,forwe
                                     hydraulic modelling       thedid not observe
                                                                    Qoptimum scenario:any   significant
                                                                                       (a) water  depth relationship
                                                                                                         and (b)
between    the  PSI   deviations  and  the  velocity magnitudes     for  all three scenarios:   Q optimum (rsp = 0.19,
     velocity. Colored circles illustrate the position of the 2014 PSI (scars) and deviations of their heights
p = 0.36),  Q
     from the     (r sp
                modelled
              min       = 0.08;
                           flow.p = 0.71), and Q     (r
                                                 max sp   = 0.004;  p =  0.98; Figure   8).

      Figure 8. Plot describing the relationships between the flow velocity and absolute deviation of the PSI
      for Qoptimum scenario.
     Figure 8. Plot describing the relationships between the flow velocity and absolute deviation of the PSI
     for Qoptimum scenario.
 3.3. Channel Stability and Relations between the Hydraulic and Sedimentologic Parameters
3.3. Channel    Stability
       A positive          and Relations
                      significant          between
                                   relationship     the Hydraulic
                                                  exists between and     Sedimentologic
                                                                    the bed  shear stressParameters
                                                                                          and the unit stream power
                  Plot describing
      Figure 8. Plot    describing the relationships
                                       relationships between the flow velocity and absolute deviation of the PSI
 calculated
      A        for  all cross  sections   (n = 62) and  the Q optimum scenario during the 2014 event (rsp = 0.65, p <
      forpositive
          Qoptimum   significant
                      scenario. relationship exists between the bed shear stress and the unit stream power
           optimum scenario.

calculated for all9a).
 0.0001)  (Figure          In sections
                       cross   contrast,(nthere
                                            = 62)were   no significant
                                                  and the                correlations
                                                           Qoptimum scenario  during between    the parameters
                                                                                      the 2014 event  (rsp = 0.65,of
                                                                                                                   p
Water 2020, 12, x FOR PEER REVIEW                                                                                                     11 of 19

15 cross-sections assigned to deep pools or bedrock sections containing a limited number of coarse
grains, the final relationship was significant for τb and MBD (rsp = 0.33, p = 0.024) and remained
Water 2020, 12, 212
insignificant    for ω and MBD (rsp = 0.13, p = 0.38).                                       11 of 19

3.3. Channel Stability and Relations between the Hydraulic and Sedimentologic Parameters
       A positive significant relationship exists between the bed shear stress and the unit stream power
calculated for all cross sections (n = 62) and the Qoptimum scenario during the 2014 event (rsp = 0.65,
   < 0.0001)
pWater         (Figure 9a). In contrast, there were no significant correlations between the parameters11ofofτ19b
       2020, 12, x FOR PEER REVIEW
and MBD (rsp = 0.05, p = 0.68) or ω and MBD (rsp = −0.04, p = 0.74) (Figure 9b,c). After the removal of
15
 15 cross-sections
    cross-sections assigned
                       assigned to
                                to deep
                                    deep pools
                                           pools or
                                                  or bedrock
                                                     bedrock sections
                                                                 sections containing
                                                                          containing aa limited
                                                                                          limited number
                                                                                                   number of
                                                                                                           of coarse
                                                                                                              coarse
grains,
 grains, the
          the final
                final relationship
                      relationship was
                                    was significant
                                           significant for
                                                        for ττbb and
                                                                 and MBD       sp =
                                                                      MBD (r(rsp    0.33, pp =
                                                                                  = 0.33,      0.024) and
                                                                                             = 0.024) and remained
                                                                                                          remained
insignificant
 insignificant forfor ω and MBD
                      ω and  MBD (r  sp ==0.13,
                                   (rsp    0.13,pp==0.38).
                                                     0.38).

       Figure 9. Plots between (a) the bed shear stress and unit stream power, (b) the bed shear stress and
       mean boulder diameter, and (c) the unit stream power and mean boulder diameter. The grey points
       in plots (b) and (c) indicate cross sections located in bedrock reaches or deep pools.

      The mutual comparison of the MBD of cross sections located in depositional (n = 8), stable (n =
30) and erosional reaches (n = 24) showed significant differences between the groups (p = 0.002), when
the cross sections of stable reaches indicated significantly higher values of MBD than those of
locations with contemporary signs of prevailing depositional or erosional processes (Figure 10a). The
analysis of the bed shear stress revealed significant differences between these groups (p = 0.012) when
the cross sections of erosional reaches indicated significantly higher values of τb than those of the
otherFigure
        groups     (Figure
                9. Plots        10b). (a)
                          between        Onthethebedother
                                                       shearhand,
                                                                stresswe
                                                                       andobserved
                                                                             unit stream  nopower,
                                                                                              significant
                                                                                                      (b) thedifferences
                                                                                                               bed shear stressamong andthese
groups   in   terms
      mean boulder     of ω   (p
              boulder diameter,   =  0.095),
                          diameter,and  and(c)although
                                              (c)the
                                                  theunit    the
                                                       unitstream erosional
                                                              streampower
                                                                       powerandreaches
                                                                                andmean
                                                                                      mean were   again
                                                                                             boulder
                                                                                           boulder        characterised
                                                                                                        diameter.
                                                                                                      diameter.   TheThe      by
                                                                                                                           grey
                                                                                                                        grey      somewhat
                                                                                                                                  points
                                                                                                                               points   in
higher   values
      in plots
     plots   (b,c)  ofand
                        ω than
                 (b)indicate
                           (c) crossthesections
                                indicate other
                                            crossreaches
                                                   sectionsin
                                                   located    (Figure
                                                               located
                                                                 bedrock 10c).
                                                                         in bedrockor
                                                                            reaches    reaches   or deep pools.
                                                                                         deep pools.
      The evaluation of flow competence and the potential stability of coarse bed material in
      The
      The mutual
individual      cross comparison
            mutual      sections
                        comparison        ofofthe
                                      during    the
                                               the MBD2014ofevent
                                                      MBD       cross
                                                               of      sections
                                                                      showed
                                                                  cross   sectionslocated
                                                                                  that       in62
                                                                                         15 of
                                                                                      located    depositional
                                                                                                 in cross         (n =(n
                                                                                                            sections
                                                                                                     depositional        8),= stable
                                                                                                                        (24.2%)       (n =(n30)
                                                                                                                                   indicated
                                                                                                                              8), stable      =
and
30)  erosional
ωE and
    ≥1 for         reaches
               the Qoptimum
          erosional            (n
                         reaches    =  24)
                                 scenario   showed
                                      (n = 24)(Figure
                                                showed  significant
                                                           11).         differences
                                                                  These cross
                                                              significant              between
                                                                                   sections
                                                                             differences           the  groups
                                                                                                were frequently
                                                                                            between                (p =   0.002),
                                                                                                         the groupsrepresentative  when
                                                                                                                         (p = 0.002), when  the
                                                                                                                                             of
cross
bedrock
the    sections
     cross  reaches of stable
              sections   with     reaches
                                  erosional
                            of stable         indicated
                                                 tendencies
                                            reaches           significantly
                                                        indicated               higherfine
                                                                   withsignificantly
                                                                          relatively      values    of MBDcharacter
                                                                                               grain-size
                                                                                          higher     values     than
                                                                                                               of  MBD those of of
                                                                                                                             thanthelocations
                                                                                                                                       limited
                                                                                                                                     those   of
with  contemporary
alluvial cover.
locations                  signs     of
                     An extraordinarily
            with contemporary           prevailing
                                           signshigh    depositional
                                                           excess was
                                                    of prevailing         or  erosional    processes
                                                                           observed immediately
                                                                       depositional                      (Figure    10a).
                                                                                                           downstream
                                                                                         or erosional processes             The   analysis
                                                                                                                              of the
                                                                                                                         (Figure             of
                                                                                                                                       culvert
                                                                                                                                    10a).   The
the bed shear
(0.56–0.57
analysis   ofr.the stress
                  km).
                     bedFor  revealed
                           shear      Qmaxsignificant
                                thestress    scenario,       differences
                                                            half
                                             revealed significant           between
                                                                  of the differences
                                                                           cross         these
                                                                                   sections      groups
                                                                                               (31
                                                                                           between     62;(p
                                                                                                    of these   = 0.012)
                                                                                                            50.0%)
                                                                                                               groups were(pwhen    thewhen
                                                                                                                              =perceived
                                                                                                                                0.012)    cross
                                                                                                                                             as
sections
those      of
        with    erosional
                unstable     reaches
                              alluvial    indicated
                                           cover,        significantly
                                                     still  leaving   the  higher
                                                                            part     values
                                                                                   upstream    of τ
                                                                                                 of
the cross sections of erosional reaches indicated significantly higher values of τb than those of the
                                                                                                    b than
                                                                                                     the     those
                                                                                                          culvert    of  the
                                                                                                                     (0.38–0.48otherr. groups
                                                                                                                                        km)  as
(Figure
other    10b).
relatively
        groups     On
              stable.   the
                         Onother
                   (Figure     the
                                10b).  hand,
                                      other
                                        On hand,weother
                                              the     observedQmin no
                                                        the hand,       significant
                                                                    scenario
                                                                      we               differences
                                                                                 predicted
                                                                            observed                   among
                                                                                                only seven
                                                                                          no significant         these groups
                                                                                                               unstable
                                                                                                             differences      cross
                                                                                                                               among in  terms
                                                                                                                                      sections
                                                                                                                                          these
of ω  (p
(11.3%)in
groups   =  0.095),
          with
             terms     although
                   a notable
                       of ω (p =excess the  erosional
                                    0.095),ofalthough      reaches
                                                 critical unit        were    again
                                                                   stream power
                                                             the erosional     reachescharacterised
                                                                                        immediately      by   somewhat
                                                                                                          downstream of
                                                                                           were again characterised           higher
                                                                                                                              bythe     values
                                                                                                                                       culvert
                                                                                                                                  somewhat
of ω than
(0.56–0.57
higher        the
         values    other
               r. km).      reaches
                    of ω than      the (Figure      10c). (Figure 10c).
                                         other reaches
      The evaluation of flow competence and the potential stability of coarse bed material in
individual cross sections during the 2014 event showed that 15 of 62 cross sections (24.2%) indicated
ωE ≥1 for the Qoptimum scenario (Figure 11). These cross sections were frequently representative of
bedrock reaches with erosional tendencies with relatively fine grain-size character of the limited
alluvial cover. An extraordinarily high excess was observed immediately downstream of the culvert
(0.56–0.57 r. km). For the Qmax scenario, half of the cross sections (31 of 62; 50.0%) were perceived as
those with unstable alluvial cover, still leaving the part upstream of the culvert (0.38–0.48 r. km) as
relatively stable. On the other hand, the Qmin scenario predicted only seven unstable cross sections
(11.3%) with a notable excess of critical unit stream power immediately downstream of the culvert
(0.56–0.57 r. km).

      Figure 10. Boxplots of mean boulder diameter, bed shear stress and unit stream power calculated for
      the 2014
      the 2014 event
               event (Q
                     (Qoptimum
                        optimum scenario)
                                 scenario)ininerosional,
                                               erosional,stable
                                                          stableand
                                                                and depositional
                                                                    depositional cross sections. The letters above
                      significantly different
      the boxes show significantly    differentgroups
                                                 groupsby byZ-value
                                                             Z-valuetest
                                                                     testwith
                                                                         withBonferonni
                                                                              Bonferonnicorrections.
                                                                                           corrections.

     The evaluation of flow competence and the potential stability of coarse bed material in individual
cross sections during the 2014 event showed that 15 of 62 cross sections (24.2%) indicated ωE ≥1
Water 2020, 12, 212                                                                                                           12 of 19

for the Qoptimum scenario (Figure 11). These cross sections were frequently representative of bedrock
reaches with erosional tendencies with relatively fine grain-size character of the limited alluvial cover.
An extraordinarily high excess was observed immediately downstream of the culvert (0.56–0.57 r. km).
For the Qmax scenario, half of the cross sections (31 of 62; 50.0%) were perceived as those with unstable
alluvial cover, still leaving the part upstream of the culvert (0.38–0.48 r. km) as relatively stable. On the
other hand, the Qmin scenario predicted only seven unstable cross sections (11.3%) with a notable
excess of critical unit stream power immediately downstream of the culvert (0.56–0.57 r. km).
Water 2020, 12, x FOR PEER REVIEW                                                                                             12 of 19

      Figure 11.11. Downstream
                      Downstream  variations   in the
                                      variations      excess
                                                  in the       of critical
                                                           excess           unit stream
                                                                    of critical            powerpower
                                                                                  unit stream      for thefor
                                                                                                           2014 event
                                                                                                              the  2014(critical
                                                                                                                         event
      threshold
      (critical    1 is indicated
                threshold          by the red
                           1 is indicated       dashed
                                           by the         line) and
                                                   red dashed    line)dominant
                                                                        and dominantfluvialfluvial
                                                                                             processes.  The individual
                                                                                                   processes.              blue
                                                                                                               The individual
      points
      blue     represent
            points         values
                     represent      calculated
                               values           forfor
                                       calculated    thethe
                                                          Qoptimum scenario
                                                             Qoptimum          forfor
                                                                        scenario     individual
                                                                                        individualcross
                                                                                                    crosssections;
                                                                                                          sections;the
                                                                                                                    the scatter
             around these
      lines around     these points
                             pointsindicate
                                     indicatethe
                                              thevalues
                                                   valuesofofthe
                                                               theQQmin   and Q
                                                                      min and  Qmax
                                                                                  max scenarios.
                                                                                       scenarios. The
                                                                                                   Theoccurrence
                                                                                                        occurrence of
                                                                                                                    of bedrock
                                         rectangles marked
      reaches is indicated by black rectangles        marked by by ‘b’
                                                                    ‘b’ letters.
                                                                         letters.

4. Discussion
4. Discussion
     The
      The dating
          dating ofof flood
                       floodevents,
                               events,together
                                        togetherwith
                                                   withthethedetermination
                                                                determinationofofthe the2014
                                                                                          2014flash
                                                                                                 flashflood  parameters
                                                                                                         flood  parameters in
the moderate    relief of Central    Europe,   were   introduced    using   the  combination
in the moderate relief of Central Europe, were introduced using the combination of                 of dendrogeomorphic
methods,   2D hydraulic
dendrogeomorphic              modelling,
                        methods,            and sedimentological
                                     2D hydraulic      modelling, andparameters.          Based parameters.
                                                                           sedimentological        on these approaches,
                                                                                                                   Based on
we
these approaches, we provide a quantitative estimation of the last flash flood eventchannel
    provide   a  quantitative     estimation    of the  last  flash flood   event   and   a  determination       of   and a
reaches  that tended
determination           to be reaches
                 of channel    (un)stable.
                                         thatUnlike
                                              tendedthe    palaeoflood
                                                        to be  (un)stable.reconstructions       from larger
                                                                            Unlike the palaeoflood             catchments,
                                                                                                           reconstructions
we
fromincluded   scarred roots
      larger catchments,      weasincluded
                                    a possible   PSI inroots
                                             scarred     the first-order
                                                               as a possiblecatchments
                                                                              PSI in the due      to the generally
                                                                                            first-order    catchments lower
                                                                                                                         due
peak  flow  discharges    and    lower   volume    of transported     sediments.     If the
to the generally lower peak flow discharges and lower volume of transported sediments. If thescarred    root  is a  part of a
stable root system    and   does   not evidence    a high  rate  of flexibility, it can  be  used   not
scarred root is a part of a stable root system and does not evidence a high rate of flexibility, it can beonly  as a helpful
tool
usedtonot
        date theastime
          only           of (flood)
                    a helpful   tool erosion   [21,60,61],
                                      to date the  time of but   alsoerosion
                                                             (flood)   as a PSI[21,60,61],
                                                                                 of recent floods.
                                                                                              but also as a PSI of recent
floods.
4.1. Hydrogeomorphic Response of Flash Floods in the First-Order Catchment
     The dendrogeomorphic
4.1. Hydrogeomorphic   Response results
                                 of Flashconfirm
                                          Floods inthat, despite theCatchment
                                                    the First-Order  strong geomorphic impact of the last
2014 flash flood, there is evidence of former flood events within this catchment. We recorded the
     The dendrogeomorphic results confirm that, despite the strong geomorphic impact of the last
hydrogeomorphic impacts of floods in years with the occurrence of debris flows and rockfalls in
2014 flash flood, there is evidence of former flood events within this catchment. We recorded the
the surrounding mountains (e.g., in 1991, 2006 and 2010 [62,63]). In addition, several identified
hydrogeomorphic impacts of floods in years with the occurrence of debris flows and rockfalls in the
years coincided with documentary data about local and/or regional flooding there (e.g., in 1971, 1977,
surrounding mountains (e.g., in 1991, 2006 and 2010 [62,63]). In addition, several identified years
1997 and 2009). Polách and Gába [43] described a spatially limited downpour in July 1971 after strong
coincided with documentary data about local and/or regional flooding there (e.g., in 1971, 1977, 1997
antecedent precipitation, resulting in local damage to small streams within this region. This situation
and 2009). Polách and Gába [43] described a spatially limited downpour in July 1971 after strong
was likely similar to that of the last 2014 flash flood, which was considered unprecedented regarding
antecedent precipitation, resulting in local damage to small streams within this region. This situation
was likely similar to that of the last 2014 flash flood, which was considered unprecedented regarding
the rainfall intensity, but the hydrogeomorphic response seems to be comparable to that of the 1971
event. Moreover, the transported parts of damaged culverts within the channel and several older
scars on tree stems (Figure 2d) suggest an even higher hydrogeomorphic impact in the past.
You can also read