BOOHOO: THE CATCH 2022 - ShadowFall
←
→
Page content transcription
If your browser does not render page correctly, please read the page content below

BOOHOO: THE CATCH 2022
  FOR PROFESSIONAL CLIENTS ONLY. ShadowFall Fund is short BOOHOO Group Plc (BOO).

  At £4.6bn market cap, BOO is the largest listed company on AIM.
  Since 2014, we believe that BOO has provided a misleading impression of its cumulative Free Cash Flow (FCF) by 67%. Most recently, in 2020 we calculate that BOO’s FCF was misrepresented by £32.2m or
  65%. We take this view since:
        1.    BOO doesn’t appear to include any tax payment within its FCF, even though its own auditor guides that this should be included. Maybe BOO sees tax as a discretionary payment?
        2.    BOO includes in FCF all cash generated by PrettyLittleThing (PLT), as though it were 100% wholly owned. However, by 2022, we calculate that BOO could be due to pay dividends of at least £77m to
              PLT’s 34% Non-Controlling Interest (NCI), aka the son of BOO’s Chairman.
        3.    In 1H20, BOO even began paying out some of this cash to PLT’s NCI yet still excluded this pay-out from its FCF.
  By early 2022, BOO has the option to buy out the 34% PLT NCI. The son of BOO’s Chairman must be rubbing his hands with glee at the prospect of a near £1bn pay day, driven by further potential dividend
  distributions (which BOO doesn’t account for in its FCF) and the proceeds of a buy-out. Two weeks ago, BOO made a sizeable c. £200m cash call. We reckon there’s a risk that BOO doesn’t end up using this for
  M&A opportunities but instead combines it with its already considerable £241m net cash balance to cover the PLT NCI dividends and buy-out price with as much cash as possible. Either way, if BOO elects not to
  significantly deplete its cash for this, then we believe that BOO’s shareholders should likely brace themselves for further dilution to acquire this NCI interest.
  In the meantime, we believe that PLT’s numbers are flattered by other segments of BOO wearing some of PLT’s costs; we estimate that this boosted PLT’s profit by c. £10.7m in FY19. The upshot is that it presents
  PLT as more profitable than it might ordinarily be without this arrangement, which could lead to a higher buy out price paid to PLT’s NCI. For example, if PLT’s NCI was bought out today at BOO’s current multiple,
  then we calculate that this £10.7m effective “profit boost” could result in an additional £193m being paid to the NCI for no other reason than other BOO entities absorbing PLT costs which should instead be
  attributable to PLT. We suppose that if it’s not used for M&A, then BOO’s recent cash call for c. £200m could cover this.
  Meanwhile, BOO’s shareholders had better look out. BOO and PLT have competition: ISawItFirst (ISIF). ISIF appears to us to have a similar supply chain as BOO and PLT, as well as a virtually identical product
  offering and pricing point to the same demographic. Senior PLT personnel have even joined ISIF. ISIF is majority owned by the brother of BOO’s Chairman. Perhaps after BOO buys out the Chairman’s son’s NCI in
  PLT, it will set its sights on buying the Chairman’s brother’s stake in ISIF? Or maybe, since ISIF is gaining considerable traction on Instagram and search rankings, ISIF will continue to compete with BOO? Either-
  way, it doesn’t seem clear to us how BOO’s shareholders would benefit.
                                                                                                                                                  This research report was first published on the ShadowFall website at 2pm BST on Tuesday 26 May 2020.
  Authors:         Matthew Earl        -    Director
                   Brandon Cole        -    Analyst                                                                                                                                                                                                       1
ShadowFall Publications Limited. All rights reserved. This document may not be reproduced or redistributed in whole or in part without prior written permission from ShadowFall Publications Limited.
Contact: research@shadowfall.com
Responsible for this research: Matthew Earl, Director, ShadowFall Publications Limited, and Brandon Cole, Analyst, ShadowFall Publications Limited (the “authors”).
This is non-independent research
This research report, which contains an implicit investment recommendation, has been produced by ShadowFall Publications Limited which is an Appointed Representative (FRN 842414) of ShadowFall Capital & Research
LLP which is authorised and regulated by the Financial Conduct Authority in the United Kingdom (FRN 782080) (together “ShadowFall”).
This research report was completed and first distributed at 5pm BST on Friday 24th April 2020 and an updated version was published on the ShadowFall website at 2pm on Tuesday 26th May 2020.
Any information presented which could be construed as investment research has not been prepared in accordance with legal requirements designed to promote the independence of investment research. Further it is not
subject to any prohibition on dealing ahead of the dissemination of investment research.
Website Terms & Conditions: ShadowFall’s website terms and conditions (collectively, these “Terms”) are available here on the ShadowFall website (www.ShadowFall.com) and set out the basis on which you may make
use of the ShadowFall website and its content, whether as a visitor to the ShadowFall website or a registered user. Please read these Terms carefully before you start to use the ShadowFall website. By using, downloading
from, or viewing material on the ShadowFall website you indicate that you accept these Terms and that you agree to abide by them. If you do not agree to these Terms, you must not use the ShadowFall website nor any of
its content. You must not communicate the contents of this report and other materials on this website to any other person unless that person has agreed to be bound by these Terms. If you access this website, download or
receive the contents of reports or other materials on this website as an agent for any other person, you are binding your principal to these same Terms.
Disclaimer: Unless otherwise specified, the information and opinions presented or contained in this document are provided as of 2pm on 26th May 2020. ShadowFall is under no obligation to update, revise or affirm this
research report.
ShadowFall has taken all reasonable steps to ensure that factual information in this research report is true and accurate. However, where such factual information is derived from publicly available sources ShadowFall has
relied on the accuracy of those sources. Some of the open source data contained in this report may have been sourced from public records made available by Companies House, which is licensed under the Open Government
License; https://www.nationalarchives.gov.uk/doc/open-government-licence/version/3/.
All statements of opinion contained in the research report are based on ShadowFall’s own assessment based on information available to it. That information may not be complete or exhaustive. No representation is made
or warranty given as to the accuracy, completeness, achievability or reasonableness of such statements of opinion.
This research report is only intended for and will only be distributed to investors who qualify as FCA defined Professional Clients (the “Recipient(s)”), who are expected to make their own judgment as to any reliance that
they place on the research report). This document is not suitable for, nor intended for any persons deemed to be a “Retail Client” under the FCA Rules. In addition, distribution is not intended for any jurisdiction outside of
which ShadowFall has permissions to distribute research.
This research report is for informational purposes only and is not an offer or solicitation to buy or sell any investment product. This report is the property of ShadowFall.
ShadowFall does not take responsibility or accept any liability for any action taken or not taken by the Recipient of a research report as a result of information and/or opinions contained in a research report. Specifically,
Recipients of this document agree to hold harmless ShadowFall and its affiliates and related parties, including, but not limited to any partners, principals, officers, directors, employees, members, clients, investors, consultants
and agents (collectively, the “ShadowFall Related Persons”) for any direct or indirect losses (including trading losses) attributable to any information and content on the ShadowFall website or in a research report. In no
event shall ShadowFall or any ShadowFall Related Persons be liable for any claims, losses, costs or damages of any kind, including direct, indirect, punitive, exemplary, incidental, special or, consequential damages, arising
out of or in any way connected with any information or content on the ShadowFall website or in this document.
Recipients must exercise their own judgment and where appropriate take their own investment, tax and legal advice prior to taking or not taking action in reliance on the contents of this research report. Forward-looking
information or statements in this report contain information that is based on assumptions, forecasts of future results, estimates of amounts not yet determinable, and therefore involve known and unknown risks, uncertainties
and other factors which may cause the actual results, performance or achievements of their subject matter to be materially different from current expectations. ShadowFall makes no representation herein that forward-
looking predictions shall come to pass.
Disclosures: ShadowFall Capital & Research LLP manages an alternative investment fund (the “fund”) which inter alia takes positions in traded securities. At the time of publication of this research report on the website
the fund holds positions in the issuers mentioned in this report, which includes; Boohoo Plc, ASOS Plc and Zalando SE, which may include through options, swaps or other derivatives relating to the issuers. The fund may
take further positions in the issuers (long or short) at a future date.
For US recipients: This report is being distributed in the US in compliance with the “Foreign Private Adviser” exemption under rule 202(a)(30) of the Investment Advisors Act 1940. The information contained in this
report is intended solely for institutional investors only and may not be used or relied upon by any other person for any purpose. Such information is provided for informational purposes only and does not constitute a
solicitation to buy or an offer to sell any securities under any U.S. federal or state securities laws, rules or regulations.
For Hong Kong recipients: This report is intended for Professional Investors only under the rules of the Hong Kong Securities and Futures Commission and is not intended to constitute a public offer.

                                                                                                                                                                                                                                   2
ShadowFall Publications Limited. All rights reserved. This document may not be reproduced or redistributed in whole or in part without prior written permission from ShadowFall Publications Limited.
DRESSED FOR SUCCESS
On the face of it, boohoo (BOO) is a remarkable success story. Brought to the market by Zeus Capital in March
2014, BOO’s market valuation has risen c. 650% since its IPO, making it the largest AIM listed company.

When it comes to profitability, for an online fashion retailer, BOO breaks the mould. Whereas its much larger
(by revenue) peers, ASOS (ASC LN) and Zalando’s (ZAL GR) respective FY19 gross margins are 48.8% and
42.5%, BOO’s FY20 gross margin is 54.0%; an astonishing 514bp above ASOS’ and a dazzling 1,140bp higher
than Zalando’s. 1

As far as operating margins go, BOO’s stand apart. BOO’s FY20 operating margin of 8.7% is nearly 7x greater
than that of ASOS (FY19: 1.3%) and 3.4x that of Zalando (FY19: 2.6%).

In recent years, BOO’s growth driver has largely been PrettyLittleThing.

It took BOO’s original businesses, boohoo.com UK, seven years to grow its revenue from £24m to £374m. It
took PrettyLittleThing three years to get from £22m in 2016 to £374m in 2019, and then rise to £516m in FY20.

Whilst boohoo.com UK reported a FY19 operating margin of 7.5% (FY18: 9.2%), we calculate that
PrettyLittleThing’s FY19 operating margin was an extraordinary 11.1% (FY18: 8.9%).

PrettyLittleThing has grown its revenue over twice as fast as boohoo.com UK and is considerably more
profitable.

Unfortunately for BOO’s shareholders, BOO doesn’t own 100% of PrettyLittleThing. BOO owns 66%
of PrettyLittleThing. The remaining 34% is mostly owned by 32-year-old, Umar Kamani, the son of
Mahmud Kamani.

Mahmud Kamani hoo? The Chairman, co-founder and majority shareholder of BOOHOO.                                                                                                    Figure 1 Los Angeles, Ca, USA. 30th June, 2019. Ashanti (left), Umar Kamani
                                                                                                                                                                                   (right, CEO of PrettyLittleThing). Source: MediaPunch Inc, Alamy Stock Photo.

1   BOO’s year end is to 28 February. ASOS’ year end is to 31 August. Zalando’s year end is to 31 December.
                                                                                                                                                                                                                                                                   3
ShadowFall Publications Limited. All rights reserved. This document may not be reproduced or redistributed in whole or in part without prior written permission from ShadowFall Publications Limited.
SUMMARY OF FINDINGS
                                                                                 A MISLEADING IMPRESSION OF FREE CASH FLOW? (PAGE 13)
Since 2014, we calculate that BOO has provided a misleading impression of its cumulative Free Cash Flow (FCF) by 67%.

We believe that this misleading impression has been produced by the company since:

      1. BOO fully consolidates PrettyLittleThing (PLT) as though it were 100% wholly owned and then at the base of its Income Statement details the profits attributable to the
            non-controlling interest (NCI), aka the son of BOO’s Chairman, in PLT. However, within neither its Cash Flow Statement or reported FCF, BOO does not separate
            out – or provide guidance – on the cash which is attributable to the NCI in PLT. As such, we believe that this provides the reader with little to no understanding of
            the true cash generation and more specifically FCF, which is attributable to shareholders of BOO.

            To put this into context as to how significant this may be, in FY20, PLT was the most profitable segment of BOO. BOO reported £72.9m in profit after tax (PAT) in FY20.
            PLT is indicated by BOO to have achieved £45.2m in PAT. PLT accounted for 62% of BOO’s PAT in FY20. However, in both its Operating Cash Flow section of its
            Cash Flow statement and its reported FCF for FY20, BOO includes all the cash generated by PLT as though PLT were 100% wholly owned. If PLT is owned 34% by a
            NCI, then 34% of PLT’s profit is attributable to the NCI and 34% of the corresponding cash generation is attributable to the NCI.

            For example, in calculating its FCF for FY20, BOO begins its calculation with PAT of £72.9m. However, we believe that 34% or £15.4m of this accrues to the NCI and
            would have nothing to do with BOO’s shareholders. We note that in FY20, BOO reports that it converted 112% of its PAT into FCF. If this rate of conversion was applied
            to the £15.4m of PAT that had nothing to do with BOO’s shareholders, then we believe that £17.2m or 21.5% of BOO’s FY20 reported FCF is not attributable to
            BOO’s shareholders.

      2. NCI attributable profits are scheduled to be distributed to PLT’s NCI by February 2022. BOO has an option to acquire the 34% NCI in PLT on 14 March 2022. 2
            Ahead of any potential buy out by BOO of PLT’s NCI, according to the original disclosure of the PLT acquisition, if the option to acquire is not exercised by 28 February
            2022, then a dividend of up to all of PLT’s distributable reserves will be paid to its shareholders on a pro rata basis. In the original announcement of the acquisition of 66%
            of PLT, this was detailed as follows (our bold):

2 boohoo 2019 Annual Report (page 72): The company has an option to buy the non-controlling interest of 34% of the share capital of PrettyLittleThing.com Limited (formerly 21Three Clothing Company Limited) on

14 March 2022 for market value or less, subject to performance criteria. Umar Kamani, the son of Mahmud Kamani, Executive Chairman and director of boohoo Group plc, is a director and shareholder of
PrettyLittleThing.com Limited.
                                                                                                                                                                                                              4
ShadowFall Publications Limited. All rights reserved. This document may not be reproduced or redistributed in whole or in part without prior written permission from ShadowFall Publications Limited.
“If the boohoo Group does not exercise the option to acquire the remaining 34% of PLT by 28 February 2022, a dividend of up to all of the PLT distributable reserves at
                         that time will be payable to all PLT shareholders including boohoo, pro rata to their shareholdings. ” 3
            Clearly the distributable reserves within PLT is the accumulated profit after tax (PAT) or retained earnings. For the year ended 28 February 2019, PLT’s retained earnings
            were £43.9m (FY18: £13.6m). By February 2022, these retained earnings (together with any retained earnings which might be achieved in FY20, FY21 and FY22), will be
            eligible to be paid out to PLT’s shareholders in accordance with their respective shareholdings. If any dividends are distributed, then the NCI will expect to receive 34% of
            these dividends. However, since the 66% of PLT was acquired by BOO in December 2016, BOO has been reporting the cash generation of PLT in its Cash Flow Statement
            and reported FCF as though PLT was 100% wholly owned. Any reasonable reader could be led to believe that BOO’s cash generation and reported FCF is entirely
            attributable to BOO’s shareholders and not that a significant portion of this will become due to be paid to PLT’s NCI in February 2022.

            Since BOO is scheduled to pay out 34% of PLT’s retained profits to its NCI, we believe that BOO’s inclusion of PLT’s cash generation as though it were 100%
            wholly owned, makes a mockery of BOO’s reported FCF. Further, we’re unconvinced that the market realises this potential large cash dividend pay out to PLT’s NCI
            exists. We believe this highlights the importance of adjusting for minorities in the FCF calculation and that investors should instead focus on a Free Cash Flow to Equity
            Holders metric (FCFE).

       3. PLT’s NCI have already begun receiving dividends, which are unaccounted for in BOO’s reported FCF. On 10 May 2019, the Directors of PLT approved a
            dividend of £10m. Within the six-month period to 31 August 2019, BOO reported a £3.4m cash “dividend paid to non-controlling interests”. As would be expected, the
            £3.4m was paid in accordance with the shareholdings of PLT (i.e. 34% or £3.4m of the declared dividend of £10m is payable to the PLT NCI). However, BOO does not
            account for this cash payment by subtracting it from its reported FCF. Clearly this cash dividend payment to the PLT NCI has nothing to do with BOO’s shareholders
            since it is in relation to the profits which have accrued to PLT’s NCI. Again, we believe that the presentation of BOO’s FCF in this manner could be misleading and that
            FCFE is a more reflective measure.

            If BOO had deducted this dividend payment to PLT’s NCI from its 1H20 reported FCF, then this alone would have reduced reported 1H20 FCF by 11.3%.

       4. BOO doesn’t account for taxes in its reported FCF. Whereas it is common practice for a company to calculate its FCF inclusive of cash corporate taxes paid, BOO
            elects not to subtract its corporate tax paid from its FCF figure and instead subtracts it lower down in the cash statement. We believe that this presents a further misleading
            impression of BOO’s true FCF. Indeed, we would highlight that under IAS 7 “Statement of Cash Flows”, it states that “cash flows arising from taxes on income are normally classified
            as operating, unless they can be specifically identified with financing or investing activities [IAS 7.35]”.

            We note that BOO’s own auditor, PwC, itself guides to deriving FCF by subtracting corporate taxes, so we are surprised that this is not reflected in BOO’s financial
            statements. Moreover, the disclosure appears to be internally inconsistent. In the calculation of FCF and the first mention of the “Consolidated cash flow statement”, “Tax

3
    https://otp.tools.investis.com/clients/uk/boohoo/rns1/regulatory-story.aspx?cid=798&newsid=828784
                                                                                                                                                                                                        5
ShadowFall Publications Limited. All rights reserved. This document may not be reproduced or redistributed in whole or in part without prior written permission from ShadowFall Publications Limited.
paid” comes below “Operating cash flow” however in the second “Consolidated cash flow statement”, “Tax paid” comes before “Net cash generated from operating
            activities”. We believe this is potentially misleading to the reader. Maybe BOO sees tax as a discretionary payment?

To put this all into context as to its significance, we note that within the publication of its final results for the year ended 29 February 2020, BOO details its FY20 FCF as £81.7m
(FY19: £65.1m). However, this FCF figure is arrived at after adding back £19.3m (FY19: £12.4m) in P&L tax expense. Neither this P&L tax expense nor cash tax of £11.6m (FY19:
£10.4m) is subtracted to arrive at BOO’s reported FCF. When combining the above £17.2m in likely PLT NCI related FCF with the fact that also in FY20, BOO did not subtract
£11.6m in cash tax expense, we believe that BOO’s true FCF would have been £28.8m lower in FY20. Then there is also the £3.4m in cash for dividends paid to PLT’s NCI.

In reporting £81.7m FCF in FY20, we believe that BOO has provided a misleading impression of its true FCF by £32.2m or by 65% against this true FCF figure.

In general, we believe that if management is unclear with how it reports cash generation to its equity holders (the key factor in determining its value), then we question
if other important financial disclosures can be relied upon?

                                                                      STRANGER THINGS: INCONSISTENCIES AND A P&L GIMMICK? (PAGE 19)
BOO has the option to acquire the remaining 34% in PLT by 28 February 2022. Or is it on 14 March 2022? It depends on which section and set of BOO’s financial statements you
read. If it’s not by 28 February 2022, then the original PLT acquisition disclosure suggests that PLT’s NCI will receive a dividend for 34% of PLT’s cumulative profit since acquisition.

As inconsistent, in our view, is whether any price paid for PLT’s NCI, would be based on 79% or 100% of the market value if maximum performance conditions are met. Again, it
depends on which set of BOO’s financial statements you read.

Things become apparently stranger still in FY20. In its full year results for the year to 29 February 2020, BOO highlights a change of accounting policy for the NCI in PLT. We
believe that this restatement provides for more confusion to readers of BOO’s financial statements and is nothing other than a gimmick, which could misleadingly
suggest to BOO’s shareholders that they are entitled to a greater share of PLT’s profits than they are due between now and February 2021. In our view, that thinking would be
flawed since, as mentioned above, by 28 February 2022, PLT’s NCI would apparently be due its share of total cumulative distributable reserves on a 34% basis.

               SIGNIFICANT DIVIDENDS TO PRETTYLITTLETHING’S NON-CONTROLLING INTEREST (AKA THE SON OF BOO’S CHAIRMAN) (PAGE 25)
We calculate that PLT’s NCI could be due total dividends of at least £77m by FY2022. As detailed above, BOO is liable to pay dividends to PLT’s NCI in proportion to the
NCI share of PLT’s distributable reserves by February 2022.

In FY20, we calculate that c. £30.4m in dividends is due to PLT’s NCI. £3.4m of this was paid in 1H20; an 88% pay-out ratio of the NCI FY19 earnings. Meanwhile ZERO dividends
are paid to BOO’s shareholders. We’re unconvinced that this expected cash outflow is realised by the market.

                                                                                                                                                                                                        6
ShadowFall Publications Limited. All rights reserved. This document may not be reproduced or redistributed in whole or in part without prior written permission from ShadowFall Publications Limited.
While BOO’s shareholders receive zero dividends paid out, nor any other capital returns, they may be heartened to at least see so much cash being built up on BOO’s balance sheet.
On 15 May 2020, this cash balance was bolstered even further by a c. £200m cash raise. However, considering these growing potential NCI dividend pay-outs, there is a risk
that BOO’s sizeable cash pile is merely sat there to later cover these potential dividends in cash.

     THE BIG COST FOR THE BUY-OUT OF PRETTYLITTLETHING’S NON-CONTROLLING INTEREST (AKA THE SON OF BOO’S CHAIRMAN)? (PAGE 28)
BOO announced its acquisition of 66% of PrettyLittleThing (PLT), in December 2016. The remaining 34% NCI was deemed to be used “to incentivise CEO Umar Kamani and
PrettyLittleThing’s senior management”. BOO has an option to acquire the NCI (34%) in PLT at a “market value” by early 2022.

Exactly how BOO will arrive at the valuation determinants for a “market value” is, in our view, somewhat unclear. In its original announcement BOO merely states that it would be
determined by a “Big Four accounting firm”. If PLT were acquired at the average market multiples as BOO and its peers trade at today, then this cost to buy-out the
NCI could be almost £1 billion. Maybe this is why BOO continues to build up so much cash and not distribute it to its shareholders?

                                                                                                 THE £200M CASH CALL FOR….? (PAGE 30)
On 14 May 2020, BOO announced its intention to raise approximately £200m and in the event raised gross proceeds of £197.7m. Despite BOO reporting net cash of
£241m as at 29 February 2020, BOO felt it needed a further £200m in order to “take advantage of numerous opportunities that are likely to emerge in the global fashion industry
over the coming months.” We place an emphasis on the term “likely to emerge”, suggesting that opportunities are yet to emerge.

We find it odd that even though BOO held £241m in net cash, it required a further £200m for such opportunities. Further, should such opportunities emerge, then given the group’s
sizeable cash balance, we believe that it would have been more beneficial for BOO to tap into this or to use either debt or its own paper to conduct any M&A. In our view, there’s
a risk that if few opportunities emerge, then BOO might end up using a significant portion of its £241m in net cash and the proceeds of its £197.7m cash call to fund
the dividend pay-out to and the buy-out of the PLT NCI.

                                                                                                        CONSENSUS CONFUSION (PAGE 32)
Broker notes from several Sell Side analysts on BOO are available to download from Bloomberg Finance L.P. We were surprised to find that some brokers do not appear to
recognise that BOO is likely to have to pay-out a dividend by February 2022 of up to all PLT’s distributable reserves on a pro-rata basis to its NCI. For example, in one
Sell Side analyst’s model, they already appear to forecast distributable reserves to PLT’s NCI of £72.7m by FY22 but do not appear to have this distribution factored into their cash
flow. This appears to be reflected by several Sell Side analysts.

                                                                                                                                                                                                        7
ShadowFall Publications Limited. All rights reserved. This document may not be reproduced or redistributed in whole or in part without prior written permission from ShadowFall Publications Limited.
HOO WHO WEARS THE COSTS? (PAGE 33)
PrettyLittleThing achieves, in our view surprisingly, far superior EBIT margins as compared to other BOO group entities, and even more noticeably to its much larger peers (ASOS
and Zalando). A main driver of PLT’s margin supremacy appears to be due to it administering and delivering orders to its customers at a much lower cost than peers and other BOO
group holdings. Since PLT was acquired by BOO, these costs have significantly fallen. Also, after it was acquired, PLT began making payments to boohoo.com UK for distribution
and administrative costs. Effectively boohoo.com UK is fulfilling distribution and administrative functions on behalf of PLT and then being reimbursed for these costs. But is PLT
paying boohoo.com UK enough?

We calculate that if PLT’s total distribution and administrative costs per order were in line with those of the wider BOO group, then its EBIT would have been £10.7m
lower and its EBIT margin would have been 8.3% as compared to a reported 11.1% in FY19.

If PLT’s NCI were bought-out today at BOO’s current multiple, we calculate that this £10.7m effective “profit boost” would result in an additional £193m being paid to
PLT’s NCI for no other reason than other BOO entities potentially absorbing some of PLT’s costs which should instead be attributable to PLT. We suppose that if not used on
M&A, then the recent £200m cash call would prove useful in settling this.

If BOO is now paying dividends to PLT’s NCI and might be asked to buy out that NCI on the basis of PLT’s relative profit supremacy, then we believe BOO’s
shareholders had better be sure that PLT’s super profits are sustainable and not bolstered by a subsidy from other entities in the BOO group.

                                           THE COMPETITION OR THE NEXT BUY-OUT TARGET?: THE BROTHER OF BOO’S CHAIRMAN (PAGE 47)
BOO and PLT have competition. Incorporated in 2016, ISawItFirst.com appears to a have a similar supply chain as BOO and PLT, as well as a virtually identical product offering
to the same demographic. Key personnel such as PLT’s Head of Commercial Marketing and Head of Merchandising have even jumped shop to join ISawItFirst. Perhaps they see
ISawItFirst as having greater potential in a competitive market? Recent Instagram data and internet search trends certainly give the impression that the competition is heating up.
In August 2017, PLT led I Saw It First by a ratio of 26:1 in terms of the number of Google searches in the UK. By May 2020, this had fallen to a c. 7:1 ratio.

ISawItFirst is majority owned by Jalaludin Kamani, the brother of BOO’s Chairman. Perhaps, after the PLT NCI (BOO’s Chairman’s son) is bought out, BOO will set its sights on
buying out its Chairman’s brother? Or maybe the Kamanis will continue to sell down their BOO stock and go head to head? Either-way, it doesn’t seem clear to us what
significant barriers to entry exist in BOO’s market, if a virtual replica company to BOO and PLT can be set-up and grown relatively quickly, nor how BOO’s
shareholders would stand to benefit?

                                                                                                                                                                                                        8
ShadowFall Publications Limited. All rights reserved. This document may not be reproduced or redistributed in whole or in part without prior written permission from ShadowFall Publications Limited.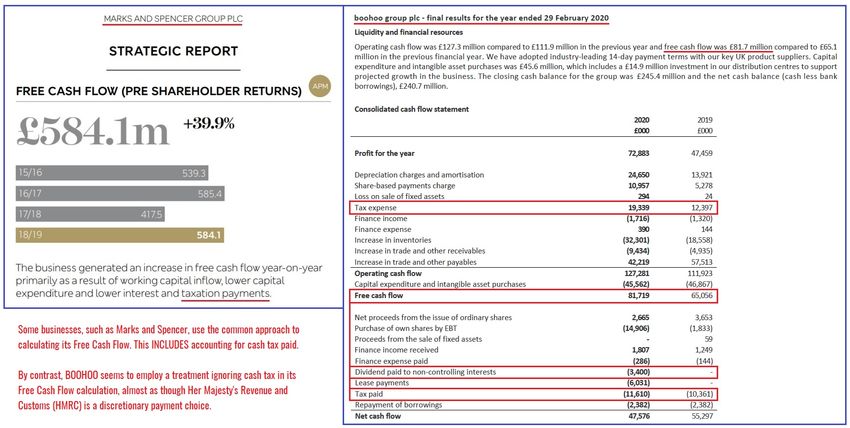
HOO WHO WORE IT BETTER?

                                                      Figure 2 Clothing samples from PrettyLittleThing.com and isawitfirst. Source: www.prettylittlething.com, www.isawitfirst.com, ShadowFall.

                                                                                                                                                                                                        9
ShadowFall Publications Limited. All rights reserved. This document may not be reproduced or redistributed in whole or in part without prior written permission from ShadowFall Publications Limited.
COMPANY DESCRIPTION
boohoo (BOO) is a Manchester based online fashion retail group which operates a number of
brands. These include boohoo, boohooMAN, PrettyLittleThing, Nasty Gal, Karen Millen and
                                                                                                                                                                                                        Revenue, £m
                                                                                                                                                            1400
Coast. The group designs, sources, markets and sells clothing and other fashion products to                                                                                 boohoo.com UK               PrettyLittleThing
customers. The group focuses on trending styles and targets a younger value-orientated audience.                                                            1200
                                                                                                                                                                            Nasty Gal                   Other

In FY20 boohoo group plc generated total revenues of £1,234m with boohoo generating 49%,                                                                   1000

PrettyLittleThing 42% and Nasty Gal 8%. The group generated Segment result (gross profit after                                                               800
distribution costs, but before distribution expenses) of £381m with boohoo generating 50%,                                                                   600
PrettyLittleThing 42% and Nasty Gal 9%.
                                                                                                                                                             400
                                                                                                                      Bloomberg consensus
Summary Financials (Reported)                 2015         2016          2017         2018          2019         2020     2021E    2022E                     200

Revenue                                      139.9        195.4         294.6        579.8         856.9      1,234.9       1,484.3      1,841.0                0
  % change                                               39.7%         50.8%        96.8%         47.8%        44.1%         20.2%        24.0%
                                                                                                                                                                            FY16                FY17             FY18         FY19                FY20
Gross Profit                                  85.0        112.9         160.8        306.4         469.0        666.2         791.6        839.5          Figure 4: boohoo reported revenue split by segment. Source: boohoo plc filings, ShadowFall.
 % change                                                32.8%         42.4%        90.5%         53.1%        42.0%         18.8%         6.0%
 % margin                                   60.8%        57.8%         54.6%        52.8%         54.7%        53.9%         53.3%        45.6%
                                                                                                                                                                                                Segment Result, £m
EBITDA                                        12.9         18.7          37.0         56.9          84.5        126.5         137.9        176.9
                                                                                                                                                             400
 % change                                                45.4%         97.6%        54.0%         48.5%        49.6%          9.0%        28.3%                             boohoo                      PrettyLittleThing
 % margin                                    9.2%         9.6%         12.5%         9.8%          9.9%        10.2%          9.3%         9.6%
                                                                                                                                                                            Nasty Gal                   Other
Adj. EBIT                                     10.9         15.7          32.6         50.4          75.1        107.0         116.4        152.7             300
 % change                                                44.0%        108.5%        54.4%         48.9%        42.5%          8.8%        31.2%
 % margin                                    7.8%         8.0%         11.1%         8.7%          8.8%         8.7%          7.8%         8.3%

Net Debt/(Cash)                              (54.1)       (58.3)       (58.4)       (133.0)      (190.7)       (240.7)      (317.0)       (394.8)            200
 ND/EBITDA                                    -4.2x        -3.1x        -1.6x         -2.3x        -2.3x         -1.9x        -2.3x         -2.2x

FCF*                                           5.8           6.5          5.4          29.9          65.1         81.7         73.3         80.0             100
 % EBITDA                                  45.4%        34.6%         14.7%          52.4%        76.9%        64.6%         53.1%        45.2%
                            * note IFRS 16 was implemented in 2020, potentially skewing the consensus and 2020 figures

                                                                                                                                                                0
Figure 3 boohoo summary financials, Source: boohoo plc filings, Bloomberg Finance L.P. ShadowFall calculations.
                                                                                                                                                                            FY16                FY17             FY18         FY19                FY20
                                                                                                                                                          Figure 5: boohoo segment result. Source: subsidiary filings, ShadowFall calculations.

                                                                                                                                                                                                                                                         10
ShadowFall Publications Limited. All rights reserved. This document may not be reproduced or redistributed in whole or in part without prior written permission from ShadowFall Publications Limited.
BOO: KEY INFORMATION
BooHoo Group plc market information BooHoo share price (indexed) and key events
London Stock Exchange 750 Mr Kamani and Ms Kane place 35m and 15m shares respectively
Ticker BOO LN at 285 GBp per share, a 7% discount to the prior close
700
Share price 360 GBp FY EBITDA margin expectations reduced and Joint
Market Cap (M) £4,404 650 CEO Ms. Kane sells 4.65m shares at a price of c.230 1H20 trading update upgrading guidance
3 month average daily volume 7,757,886 GBp, an 11% discount to the prior close
600
3 month average daily value (M) £27.9 FY19 results announced
Short interest 1.1% 550 Trading update and £50m equity raised to fund warehouse capacity
Days to cover 0.6 improvements. Additionally, Joint CEO Mr Kamani and other members of John Lyttle appointed
500 as CEO
Active available quantity (M) 115.6 the Kamani family sell 36.6m shares at the placing price of 220 GBp
Active available value (M) £416.2 450
Upgraded guidance for
400 FY17 results
Top holders % Out
1 Mr Mahmud Kamani 12.5% 350
BooHoo completes its IPO in March 2014 Acquisition of Nasty Gal
2 Merian Global Investors 11.1% 300 announced
3 Invesco 7.0%
4 Baillie Gifford 4.7% 250
Guidance upgraded and
5 Rabia Kamani 4.7% 200 acquisition of PLT announced
6 Hargreaves Lansdown 3.8%
150
7 Franklin Resources 2.9%
8 Eleva Capital 2.9% 100
9 Standard Life Aberdeen 2.6%
50
10 Ms Carol Kane 2.6%
Total 54.8% 0
Mar-14 Sep-14 Mar-15 Sep-15 Mar-16 Sep-16 Mar-17 Sep-17 Mar-18 Sep-18 Mar-19 Sep-19 Mar-20
Figure 6: Key market information, Source: Bloomberg Finance L.P, Apps BOO
Black, Data as of 22 May 2020
Figure 7: BooHoo share price indexed to 100 and key events. Source: ShadowFall, Bloomberg Finance L.P.
11
ShadowFall Publications Limited. All rights reserved. This document may not be reproduced or redistributed in whole or in part without prior written permission from ShadowFall Publications Limited.OUTPERFORMANCE VS ASOS AND ZALANDO
Since its IPO in 2014, BOO has outperformed its two closest peers, in our view, ASOS
and Zalando, in a remarkable fashion. BOO has grown its revenue at a 57% CAGR Gross margin for BOO against ASOS & Zalando, %
vs. 24% and 22% for ASOS and Zalando, gross profit has grown at 53% CAGR vs
60%
24% and 20% for ASOS and Zalando, while EBIT has grown at 62% vs -7% and 17%
56%
for ASOS and Zalando, respectively.
52%
Against this backdrop, despite what we would assume to be an industry with significant
48%
economies of scale, gross and operating margins have always been substantially ahead
44%
of the two closest peers BOO despite being a fraction of their size.
40%
2015 2016 2017 2018 2019 2020E 2021E 2022E 2023E
Revenue (normalised 2015 = 100 )
1800 BOOHOO Group ASOS Zalando
1600 Figure 9 Gross margins for boohoo and peers. Bloomberg consensus for (BOO FY20A) FY20E-22E, Source:
company filings, Bloomberg Finance L.P., ShadowFall calculations.
1400
1200
Operating margin for BOO against ASOS & Zalando, %
1000
12%
800 10%
8%
600
6%
400
4%
200 2%
0 0%
2015 2016 2017 2018 2019 2020E 2021E 2022E 2023E 2015 2016 2017 2018 2019 2020E 2021E 2022E 2023E
BOOHOO Group ASOS Zalando BOOHOO Group ASOS Zalando
Figure 8: Revenue indexed to 100 in 2015, boohoo, ASOS and Zalando. Bloomberg consensus (BOO FY20A) for Figure 10: Operating margins for boohoo and peers, Bloomberg consensus for (BOO FY20A) FY20E-22E. Source:
FY20E-22E, Source: company filings, Bloomberg Finance L.P., ShadowFall calculations. company filings, Bloomberg Finance L.P., ShadowFall calculations.
12
ShadowFall Publications Limited. All rights reserved. This document may not be reproduced or redistributed in whole or in part without prior written permission from ShadowFall Publications Limited.A MISLEADING IMPRESSION OF FREE CASH FLOW?
Figure 11 Stretched Dollar. Making money go further. Source: Ian McKinnell, Alamy Stock Photo.
Since 2014, we calculate that BOO has provided a misleading impression of its cumulative Free Cash Flow (FCF) by 67%. We believe that this repetitive misrepresentation
has been produced by the company since:
1. BOO includes in its FCF all cash generated by PrettyLittleThing (PLT) as though it were 100% wholly owned. However, by 2022, we calculate that BOO could be due to
pay dividends of at least £77m to PLT’s 34% Non-Controlling Interest (NCI), aka the son of BOO’s Chairman. On this basis, we believe that BOO’s inclusion of PLT’s
cash generation as though it were 100% wholly owned, makes a mockery of BOO’s reported FCF. Further, we’re unconvinced that the market realises this large cash
dividend disbursement is likely. We believe this highlights the importance of adjusting for minorities in the FCF calculation and that investors should instead focus on a
Free Cash Flow to Equity Holders metric (FCFE).
2. In FY20, BOO even began paying out some of this cash to PLT’s NCI and yet still excluded this pay-out from its reported FCF. If BOO had deducted this dividend
payment from its 1H20 reported FCF, then this alone would have reduced reported 1H20 FCF by 11.3%.
3. BOO doesn’t appear to include any tax payment within its FCF, even though its own auditor guides that this should be included. Maybe BOO sees tax as a discretionary
payment?
Most recently in FY20, by excluding any tax (either £19.3m in P&L tax or £11.6m in cash tax), and including a full cash contribution from PrettyLittleThing (where
we estimate £17.2m could have been attributable to PLT’s NCI), we calculate that BOO’s true FY20 FCF was misrepresented by £32.2m or 65%.
13
ShadowFall Publications Limited. All rights reserved. This document may not be reproduced or redistributed in whole or in part without prior written permission from ShadowFall Publications Limited.PRETTYLITTLETHING.COM (PLT)
BOO announced its acquisition of 66% of PrettyLittleThing (PLT), on 14 December 2016. The 66% of PLT was acquired for a relatively modest cash consideration of £3.3m. The
remaining 34% minority interest was deemed to be used “to incentivise CEO Umar Kamani [the son of Mahmud Kamani, the founder and Chairman of BOO] and PLT’s senior
management”. According to the latest ownership filing, Umar Kamani retains 31.5% of PLT’s equity and 2.5% is held by PLT’s Chief Operating Officer, Paul Papworth.
At the time of the 66% purchase of PLT, BOO highlighted that:
PLT had grown its revenue by 400% to £17.0m in the financial year to 29 February 2016 (FY15: £3.1m);
PLT had delivered revenue of £19.0m in the six months to 31 August 2016 (1H16: £6.4m); and
PLT was expected to achieve revenue growth in excess of 150% in the financial year to 28 February 2017 and be broadly breakeven at the EBITDA level.
We believe it’s fair to say that the addition of PLT has been a tremendous success for BOO. Within four years of its acquisition, PLT’s revenue has grown to £516m in FY20. We
calculate that PLT has contributed 56% to BOO’s overall revenue growth in 2018-20.
In terms of profitability, by FY20, PLT was BOO’s most profitable brand. We calculate that PLT accounted for 62% of BOO's reported FY20 Profit After Tax. PLT’s filings show
that it reported adjusted EBIT of £41.7m in FY19, as compared to boohoo.com UK reporting £32.5m and the recent addition to BOO’s brands, Nasty Gal a loss of £3.1m.
Revenue, £m Profit After Tax, £m
1400 80 70%
boohoo.com UK PrettyLittleThing BOO ex-PLT
1200 70 60%
Nasty Gal Other PrettyLittleThing
60 PLT as % of Group PAT (rhs)
1000 50%
50
800 40%
40
600 30%
30
400 20%
20
200 10 10%
0 0 0%
FY16 FY17 FY18 FY19 FY20 FY16 FY17 FY18 FY19 FY20
Figure 12 Revenue by brand. Source: Company filings, ShadowFall. Figure 13 Adjusted EBIT by brand. Source: Company filings, ShadowFall.
14
ShadowFall Publications Limited. All rights reserved. This document may not be reproduced or redistributed in whole or in part without prior written permission from ShadowFall Publications Limited.INCLUDE MINORITY CASH BUT FORGET TAX AND MINORITY DIVIDENDS
The top half of figure 15 below, is BOO’s reconciliation and presentation of its Free In FY20, by excluding tax, whether £19.3m in P&L tax or £11.6m in cash tax,
Cash Flow to its investors within its financial statements. An example of BOO’s actual and including a full cash contribution from PLT, of which we estimate £17.2m
presentation from its FY20 statement is also presented in figure 16.
could have been attributable to and £3.4m was attributable to PLT’s NCI, we
As can be seen from BOO’s presentation, in FY20, BOO reported £81.7m in FCF believe BOO provided a misleading impression of its FCF by £32.2m or 65%.
(FY19: £65.1m). However, in arriving at this figure for FY20:
1. BOO adds back the P&L tax expense of £19.3m (FY19: £12.4m) but elects
BOOHOO Free Cash Flow, £m
250 90
not to include the actual cash tax paid of £11.6m (FY19: £10.4m). In effect Cumulative difference in Reported minus SFe Free Cash Flow (rhs)
BOO excludes both P&L and actual cash tax paid from its calculation of its Cumulative BOOHOO reported Free Cash Flow 80
FCF. We question if BOO’s management is inclined to believe that tax Cumulative Free Cash Flow - ShadowFall calculation 197.5
payments to HMRC are a discretionary payment? 200
70
2. BOO paid out a dividend to the NCI in PLT in 1H20 of £3.4m (FY19: £0).
Clearly this cash has nothing to do with BOO’s shareholders. However, BOO 60
does not exclude this dividend payment from the £81.7m in FCF it announced
150
to its shareholders that it achieved. 50
118.5
In calculating its FCF for FY20, BOO begins its calculation with Profit After Tax
(PAT) of £72.9m (FY19: £47.5m). In FY20, we calculate that 62.0% or £45.2m of 40
100
BOO’s total PAT was attributable to PLT. BOO presents its FCF as though PLT were
30
100% wholly owned, however, 34% or £15.4m of PLT’s PAT contribution accrues to
the NCI and has nothing to do with BOO’s shareholders. Considering that these
12.3 20
earnings are due to be paid out to the PLT NCI in 2022, in our view, this is a perversion 50
of calculating FCF; especially when there is no clarifying guidance in the notes. We 4.5 7.1
10
note that in FY20, BOO converted 112% of its PAT into FCF. If this rate of 1.8
conversion was applied to the £15.4m of PAT that had nothing to do with BOO’s 23.1 46.7 79.0
0 0
shareholders, then we believe that BOO has provided a misleading impression of its
2014 2015 2016 2017 2018 2019 2020
FCF by an additional £17.2m in FY20 (FY19: £13.3m).
Figure 14 BOOHOO reported cumulative FCF since 2014 & cumulative FCF if tax & dividends to PLT Minority Interest had been deducted,
& estimated FCF to PLT MI had been excluded in 2018 & 2019. Source: BOOHOO financial statements, ShadowFall calculations.
15
ShadowFall Publications Limited. All rights reserved. This document may not be reproduced or redistributed in whole or in part without prior written permission from ShadowFall Publications Limited.BooHoo Reported Free Cash Flow, £m 2014 2015 2016 2017 2018 2019 2020 Total
BooHoo Group Profit After Tax (PAT) 8.4 8.4 12.4 24.7 36.0 47.5 72.9 210.3
Depreciation charges and amortisation 1.0 2.0 3.1 4.8 11.0 13.9 24.7
Share-based payments charge 0.0 0.3 0.6 1.9 3.3 5.3 11.0
Loss on sale of fixed assets -0.1 0.0 0.0 0.0 0.0 0.0 0.3
Tax expense 2.3 2.7 3.2 6.3 7.3 12.4 19.3
Finance income 0.1 -0.5 -0.6 -0.6 -0.8 -1.3 -1.7
Finance expense 0.0 0.0 0.0 0.0 0.1 0.1 0.4
Increase in inventories -3.0 -1.4 -7.5 -11.9 -14.1 -18.6 -32.3
Increase in trade and other receivables -3.2 -0.5 -3.2 -4.1 -5.4 -4.9 -9.4
Increase in trade and other payables 2.1 3.1 12.1 15.2 38.8 57.5 42.2
Operating cash flow 7.8 14.0 20.1 36.1 76.2 111.9 127.3 393.4
Capital expenditures and intangible asset purchases -4.6 -8.2 -13.6 -30.7 -46.4 -46.9 -45.6 -195.9
REPORTED FREE CASH FLOW 3.1 5.8 6.5 5.4 29.9 65.1 81.7 197.5
Cash tax paid -1.8 -2.7 -2.6 -5.2 -7.2 -10.4 -11.6 -41.5
Dividends paid to non-controlling interests 0 0 0 0 0 0 -3.4 -3.4
SFe FREE CASH FLOW 1.3 3.2 3.8 0.2 22.6 54.7 66.7 152.6
Difference in Reported minus SFe FREE CASH FLOW 1.8 2.7 2.6 5.2 7.2 10.4 15.0 44.9
% Difference in Reported vs. SFe FREE CASH FLOW 139% 83% 68% 2356% 32% 19% 23% 29%
BooHoo Group Profit After Tax (PAT) 8.4 8.4 12.4 24.7 36.0 47.5 72.9 210.3
PrettyLittleThing PAT 3.3 12.8 28.4 45.2 89.7
PrettyLittleThing PAT as % of BooHoo Group PAT 35.5% 59.9% 62.0% 42.7%
34% of PLT PAT attributable to Minority Interest 1.1 4.3 9.7 15.4 30.5
BooHoo conversion of PAT to reported FCF 37.0% 69.5% 52.0% 22.0% 82.9% 137.1% 112.1% 93.9%
Estimated FCF attributable to PLT Minority Interest if same conversion as wider BooHoo Group 3.6 13.3 17.2 34.1
SFe FREE CASH FLOW IF PLT Minority Interest is deducted 1.3 3.2 3.8 0.2 19.0 41.4 49.5 118.5
Difference in Reported minus SFe FREE CASH FLOW 1.8 2.7 2.6 5.2 10.8 23.6 32.2 79.0
% Difference in Reported vs. SFe FREE CASH FLOW 139% 83% 68% 2356% 57% 57% 65% 67%
Figure 15 BOOHOO reported FCF since 2014 and FCF if tax and dividends to PLT Minority Interest had been deducted, and estimated FCF to PLT MI had been excluded in 2018 and 2019. Source: BOOHOO financial statements, ShadowFall calculations.
16
ShadowFall Publications Limited. All rights reserved. This document may not be reproduced or redistributed in whole or in part without prior written permission from ShadowFall Publications Limited.Figure 16 Comparison of Free Cash Flow accounting between Marks and Spencer Group and BOOHOO Group. Source: Company filings, ShadowFall.
17
ShadowFall Publications Limited. All rights reserved. This document may not be reproduced or redistributed in whole or in part without prior written permission from ShadowFall Publications Limited.BOO’S AUDITOR SEEMS TO CALCULATE FCF DIFFERENTLY TO ITS CLIENT
The great irony we find in all this, is that PricewaterhouseCoopers (PwC), which
has been auditor to BOO for over five years, indicates in its valuation guide that
corporate taxes should be deducted in a calculation of FCF. In PwC’s guide for
calculating discounted FCF, PwC states (our bold for emphasis):
“The starting point for the determination of the free cash flows are the
forecasted EBIT of the budgeted financial years. First, corporate
taxes are subtracted from EBIT under the assumption that
the company is debt-free.”
PwC guide to calculating Enterprise Value from future free cash flows
PwC specifically states that corporate taxes should first be deducted from EBIT.
However, in arriving at its reported FCF, BOOHOO adds back its P&L tax to
its starting point of Profit for the Period, and then seems to ignore the second
step of subtracting any cash tax paid. Quite why BOO feels that tax paid should
not be deducted for calculating FCF is beyond us. Maybe BOO’s
management feel that tax payments to HMRC are a discretionary
payment? Either way, we find it remarkable that it goes against the definition
as provided by its own auditor and are surprised that PwC would not flag this
method of calculation as odd in BOO’s accounts.
As figure 16 demonstrates above, BOO’s definition of FCF also appears to be
against its industry – and for that matter the market’s – standard definition. For
example, in arriving at its FCF for 2019, Marks and Spencer Group deducts
taxation payments in its calculation. Maybe this is an “old fashioned” approach? Figure 17 PricewaterhouseCoopers derivation of Free Cash Flow. Source: PwC, ShadowFall.
Further, to be fair to some of the covering sell side analysts, they appear to
amend BOO’s FCF calculation to the more standard method.
18
ShadowFall Publications Limited. All rights reserved. This document may not be reproduced or redistributed in whole or in part without prior written permission from ShadowFall Publications Limited.STRANGER THINGS:
INCONSISTENCIES AND A P&L GIMMICK?
Figure 18 Stranger Things, Winona Ryder. Source: Everett Collection Inc, Alamy Stock Photo.
BOO has the option to acquire the remaining 34% in PLT by 28 February 2022. Or is it on 14 March 2022? It depends on which section and set of BOO’s financial statements you
read. If it’s not by 28 February 2022, then the original PLT acquisition disclosure suggests that PLT’s NCI will receive a dividend for 34% of PLT’s cumulative profit since acquisition.
As inconsistent, in our view, is whether any price paid for PLT’s NCI, would be based on 79% or 100% of the market value if maximum performance conditions are met. Again, it
depends on which set of BOO’s financial statements you read.
We reckon things become stranger still in FY20. In its full year results for the year to 29 February 2020, BOO highlights a change of accounting policy for the NCI in PLT. We
believe that this restatement provides for more confusion to readers of BOO’s financial statements and is nothing other than a gimmick, which could misleadingly
suggest to BOO’s shareholders that they are entitled to a greater share of PLT’s profits than they are due between now and February 2021. In our view, that thinking would be
flawed since, as mentioned above, by 28 February 2022, PLT’s NCI would apparently be due its share of total cumulative distributable reserves on a 34% basis.
19
ShadowFall Publications Limited. All rights reserved. This document may not be reproduced or redistributed in whole or in part without prior written permission from ShadowFall Publications Limited.THE HISTORY OF THE CALL OPTION AND TARGETS
Originally, BOO had a call option (entered on 5 March 2014) to purchase 100% of PLT for £5m before March 2017. However, when it acquired 66% of PLT, BOO highlighted
that this consideration was below the fair value of the net assets of PLT due to its high growth (i.e. valuation wise this was seemingly better for BOO’s shareholders). Instead of
acquiring the entire 100% of PLT for a relatively low value, BOO elected to purchase 66% of PLT and leave 34% with PLT’s senior management and retain the option to buy the
remaining 34% later at an implied higher cost to shareholders.
Having bought 66% of PLT, BOO then revised the payment terms for this remaining 34%, from the original £5m price, to reflect a more open-ended valuation which would be
determined by the market value of the equity at the time of any exercise.
PLT VALUATION FACTORS
The price payable for the remaining 34% of the equity in PLT could be 100% of the market value if the maximum performance conditions are met.
The principal factors for valuation are:
Market value; and
A minority interest discount factor.
Market value The minority discount factor
Exactly how BOO will arrive at the valuation determinants for a “market BOO also indicates that:
value” is, in our view, somewhat unclear. In its original announcement BOO
“The market value used in the calculation will take into account a minority
stated that this would be determined by a “Big Four accounting firm”. When
interest discount of up to 30%.”
considering that there are three main European listed online fashion retailers,
ASOS, Zalando and BOO, we believe it’s likely that any Big Four accounting We find this somewhat ambiguous. Does this imply that the Big Four audit
firm will simply refer to the prevailing market valuation of BOO or a firm’s valuation would include a minority discount and thus the market value
combination of the average valuation for the three. In terms of valuation could be higher by 42.9%, or does it imply that BOO will pay a discount for
metric, obvious candidates to use would be EV to: Sales, EBITDA, or EBIT. the stake? If it were a discount which would be preferable to BOO’s
shareholders, then why is it not more prominently highlighted by BOO?
20
ShadowFall Publications Limited. All rights reserved. This document may not be reproduced or redistributed in whole or in part without prior written permission from ShadowFall Publications Limited.Figure 19 Announcement of acquisition of 66% of PrettyLittleThing. Source: Company filings, ShadowFall.
21
ShadowFall Publications Limited. All rights reserved. This document may not be reproduced or redistributed in whole or in part without prior written permission from ShadowFall Publications Limited.THE INCONSISTENCIES IN THE FILINGS
Within BOO’s and its subsidiary filings, we find several inconsistencies regarding the timing and cost of exercising the call option for PLT.
For example:
Inconsistency 1 Inconsistency 2
In December 2016, the time of its announcement of the acquisition In BOO’s 2018 annual filing, it highlights the details of any share-based
of 66% of PLT, BOO indicated that it had the option to acquire the payment charge should the option to acquire the remaining 34% of PLT be
remaining 34% in PLT by 28 February 2022. exercised at any time after 28 February 2022. PLT states that (our bold):
In its 2017 annual filing, BOO indicates that it can acquire the
“The price payable for the shares could be based on 34% of £1.9 million
remaining 34% PLT on 14 March 2022.
plus either 79% of the market value if maximum
The 2018 filing indicates that it can acquire 34% of PLT at any time
performance conditions are met or 74% of the market value if
after 28 February 2022.
none of the performance criteria are met.”
As does the 2019 filing state any time after 28 February 2022.
However, also in the 2019 filing it states it can acquire the remaining However, a year later, in BOO’s 2019 annual filing, it highlights:
34% on 14 March 2022.
“The price payable for the shares could be based on 100% of the
It is unclear to us why BOO’s filings are so inconsistent and ambiguous as market value if maximum performance conditions are
to when the option can be exercised. However, the ambiguity of timing may met, or £0.6 million plus 74% of the market value if none of the
have something to do with a pay-out of retained earnings within PLT to performance criteria are met.”
the minorities by way of dividend ahead of any exercise of the option (see
the next section on: Significant Dividend’s to PrettyLittleThing’s Non- Seemingly in between 2018 and 2019, the price to pay rose from 79% to
Controlling Interests. 100% of the market value! It is unclear to us why or how the price rose,
effectively by 26.6% within a year. We would have assumed that the terms
of the buy-out would have remained consistent.
22
ShadowFall Publications Limited. All rights reserved. This document may not be reproduced or redistributed in whole or in part without prior written permission from ShadowFall Publications Limited.Figure 20 The range of exercise dates available to BooHoo to acquire the remaining 34% of PrettyLittleThing.com. Source: BooHoo Plc filings, ShadowFall.
23
ShadowFall Publications Limited. All rights reserved. This document may not be reproduced or redistributed in whole or in part without prior written permission from ShadowFall Publications Limited.A STRANGE TURN OF EVENTS
By the time of the FY20 results, announced on 22 April 2020, BOO restates its accounting for PLT’s NCI, highlighting:
Following a review of the accounting treatment of the non‐controlling interest of shareholders in PrettyLittleThing.com Limited [PLT], it has been determined that the restrictions imposed
by the Shareholders' Agreement require the proportion of the non‐controlling interests' share of the profits of PLT to accrue in accordance with certain terms of the agreement and not as 34%
as previously stated. The accumulated profit attributable to non‐controlling interests of £8,761,000 as at 28 February 2018 has been adjusted to £4,018,000 and the share of profits for
the year to 28 February 2019 from £9,687,000 to £3,875,000 and the difference added to retained earnings. The share of profits recognised by the non‐controlling interest increases each
year by 20% of 34% of the earnings of PLT from 20% of 34% to 100% of 34% over the five‐year period of the agreement, as does the non‐controlling interests' share of the net assets.
Basic earnings per share of boohoo group plc in 2019 has changed from 3.27p to 3.78p and diluted earnings per share from 3.22p to 3.71p. The adjusted diluted earnings per share is
calculated on the same basis as in previous years at 34% of the net assets and profits, reflecting the fact that the reported non‐controlling interest will accumulate to 34% at the end of the
five‐year period of the Shareholders' Agreement in February 2022.
This seems to us to be a strange turn of events for the following reasons:
1. It is odd that this restatement is implemented some three years after a controlling interest in PLT was acquired. Surely BOO would have understood the accounting treatment
from the point of acquisition?
2. Section 15.2 of the Resolutions filed for PrettyLittleThing indicates that although BOO holds 660 of the A shares in PLT and Mr Umar Kamani and Mr Paul Papworth
hold 315 B shares and 25 B shares respectively, that (our bold for emphasis):
On a return of capital on liquidation or capital reduction or otherwise, the surplus assets of the Company remaining after the payment of its liabilities
shall be distributed first in the repayment to the C Ordinary Shares [Paul Papworth holds 28 C shares] of their Issue Price and then amongst the holders of the A Ordinary
Shares and the B Ordinary Shares pari passu as if the same constituted one class of Share in proportion to the number of Shares held by them in
the Company . The holders of the C Ordinary Shares shall have no other rights to participate in the surplus assets of the Company.
3. On 10 May 2019, PLT announced a dividend (see figure 22 below). This dividend was for £10m. In 1H20, a £3.4m dividend was paid in cash to the PLT NCI. Hence, the
PLT NCI is benefiting as of now from the returns of PLT in accordance with its 34% equity interest.
4. By February 2022, all the distributable reserves of PLT can be distributed to PLT’s shareholders on a pro rata basis. Hence, between now and February 2022, if more
dividends are paid out then presumably this will again be on a 66%/34% weighting. If not, then by February 2022, PLT’s NCI ends up with 34% of the accumulated profits
anyway.
We believe that this restatement provides for more confusion to BOO’s shareholders and is nothing other than a gimmick, which could misleadingly suggest to BOO’s shareholders
that they are entitled to a greater share of PLT’s profits than they are due between now and February 2022.
24
ShadowFall Publications Limited. All rights reserved. This document may not be reproduced or redistributed in whole or in part without prior written permission from ShadowFall Publications Limited.You can also read