GLOBAL MARKET OUTLOOK - For Photovoltaics 2014-2018
←
→
Page content transcription
If your browser does not render page correctly, please read the page content below
GLOBAL
                 MARKET
                OUTLOOK
                For Photovoltaics
                      2014-2018

Supported by:
GLOBAL
 MARKET
OUTLOOK
For Photovoltaics
      2014-2018
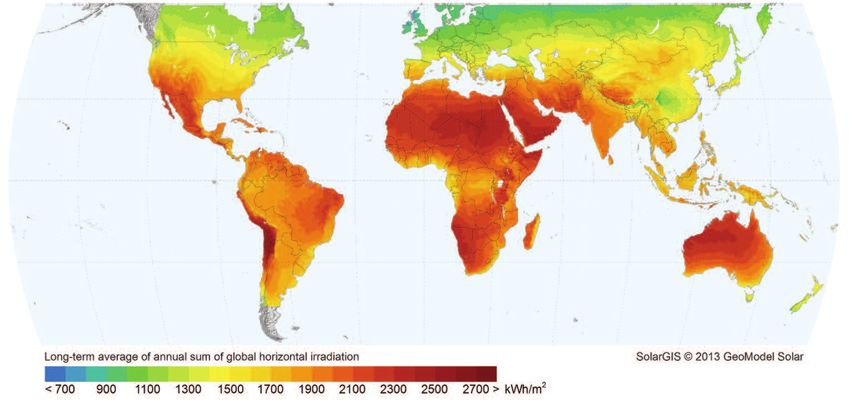
Principal authors and analysts: Gaëtan Masson (iCARES Consulting), Sinead Orlandi, Manoël Rekinger

Publication coordination: Benjamin Fontaine, Sinead Orlandi

External contributors: AECEA, APERe, APESF, APISOLAR, APREN, assoRinnovabili, Australian PV Association, BPVA, BSWSolar,
CANSIA, CREIA, CRES, CZEPHO, Danish PV Association, EDORA, ENERPLAN, Fronius, GENSED, GIFI, Goldbeck, HELAPCO,
Holland Solar, HUPIA, IEA-PVPS, JPEA, KOPIA, Martifer, PV AUSTRIA, PV Russia, PV Poland, PV Vlaanderen, Renewable
Association of Israel, RPIA, RTS Corporation, SAPI, SAPVIA, SASIA, SEIA, SEMI Taiwan, SolarMax, SolarTrade Association,
SunEdison, Swissolar, TOTAL, UNEF, Wacker, ZSFI

Editor: Tom Rowe

Design: Onehemisphere, Sweden

Images: iStock.com/CaiaImage (cover), REC – Renewable Energy Corporation ASA (page 8), Sharp (page 10), ENEL (page 12),
First Solar (page 14), First Solar (page 16), Kyocera Fineceramics, Stromaufwart Photovoltaik GmbH (page 26), Sharp (page 48),
JA Solar (page 54).

Supported by: Intersolar Europe

Solar irradiation world map has been derived from the SolarGIS database:
http://solargis.info (© 2014 GeoModel Solar)

Disclaimer: Please note that all historical figures provided in this brochure are valid at the time of publication and will be revised
when new and proven figures are available. All forecast figures are based on EPIA knowledge at the time of publication. Please
also note that forecast figures have been rounded.

EPIA’s methodology includes only systems connected to the grid and not those that have been installed but not yet connected.
The difference between installations and systems connected to the grid can be quite significant in some cases. Installed capacity
considers all photovoltaic technologies.

FOREWORD

Dear EPIA Members,
Dear Friends of EPIA,

Since its creation in 1985, EPIA – the European Photovoltaic Industry Association – has experienced great
changes and challenges. Just like the solar photovoltaic (PV) industry. Only a niche market a few years
ago, PV is now becoming a mainstream electricity provider, changing the way the world is powered.
As the voice of photovoltaics in Europe, EPIA is leading the way to this energy transition.
To ensure PV gets favourable and sustainable framework conditions, EPIA is intensively engaging
in the European decision making process on all relevant regulations shaping the energy sector. EPIA is
also proactively engaging on key issues for the future development of PV, such as the energy market
design and the integration of PV into the electricity grid. Our profound intelligence work on these issues
is further reinforcing the PV sector’s credibility and our ability to secure a sustainable development
pathway for PV.
Over the years, EPIA has established itself as an opinion leader and a credible information hub on
markets and policy, reinforcing its key role in the European energy sector. The 2014 edition of our
flagship report “Global Market Outlook for Photovoltaics”, with comprehensive historical market data,
five-year forecasts for the main global markets under different policy assumptions, hopefully not too
optimistic, as well as an analysis of the role that PV is playing in the European energy system, will once
again be an indispensable tool for the global PV sector and energy stakeholders alike.
Even during a difficult period of industry consolidation and economic crisis, PV installations saw another
record-year in 2013: at least 38.4 GW of newly-added capacity around the globe, and almost 11
GW in Europe. While the latter figure represents a significant decrease compared to the year before, it
should however be put into perspective. In 2013, apart from wind, no other source of electricity
reached the levels of new installations that PV did in Europe. Some, such as gas, even experienced
negative net numbers, with more capacity decommissioned than installed.
This proves, if need be, that solar photovoltaics is on the way to becoming a major part of the electricity
system, delivering clean, safe and affordable energy to the greater number all around the globe.
The energy transition is underway, let’s embrace it!

Enjoy your reading.
Best regards,
Oliver Schäfer
EPIA President

                                                EPIA • GLOBAL MARKET OUTLOOK FOR PHOTOVOLTAICS 2014-2018 • 5
table of contents

Foreword                                                                                                  5

1.   introduction                                                                                     8

2.   methodology and scenarios                                                                      12
       1. Installations and connections                                                              14
       2. The role of off-grid installations                                                         14
       3. AC-DC numbers: Counting comparable numbers                                                 15

3.   market evolution                                                                               16
     A. Historical PV market development                                                             17
        1. World cumulative installed capacity                                                       17
        2. World PV market development                                                               18
        3. European market development                                                               21
     B. The market in Europe in 2013 and the forecast until 2018                                     25
        1. Relevant European markets in 2013                                                         25
        2. Segmentation                                                                              28
        3. Forecasts of PV in Europe until 2018                                                      30
        4. 2020 potential and targets in the EU                                                      33
        5. Medium-term scenario for 2030: How much can PV contribute to a binding 2030 target?       35
        6. Support schemes in Europe and prospects for PV                                            36
     C. The global market in 2013 and the forecast until 2018                                        37
        1. Global PV market growth                                                                   37
        2. Global PV capacity                                                                        38
        3. Forecasts until 2018                                                                      39
        4. Forecasts per segment                                                                     43
        5. Future prospects for market development                                                   46

4.   Photovoltaics in the energy sector                                                             48
     A. Positioning PV in the electricity generations mix                                            49
        1. PV positioning in 2013                                                                    49
        2. Historical PV positioning                                                                 51
        3. Share of PV in the EU 28                                                                  52
        4. PV and the electricity system                                                             53

5.   conclusion                                                                                     54

     Glossary                                                                                        56
     List of figures and tables                                                                      57

                                           EPIA • GLOBAL MARKET OUTLOOK FOR PHOTOVOLTAICS 2014-2018 • 7
1 INTRODUCTION
1. INTRODUCTION
With at least 38.4 gigawatts (GW) of newly-installed solar photovoltaic (PV) capacity
worldwide and a global cumulative installed capacity of 138.9 GW, 2013 was another historic
year for solar PV technology.
Compared to the two previous years, where installed capacity hovered only slightly above 30 GW
annually, the PV market progressed remarkably in 2013. Despite this, the global PV market is at a turning
point which will have profound implications in the future. For the first time in more than a decade, the
European PV market was no longer the top regional PV market in the world. Asia surpassed Europe in
a dramatic way, representing around 56% of the world PV market in 2013. This Asian progress
occurred in parallel with the relative decline in Europe already observed in 2012. Vigorous growth
in non-European markets kept global PV development on an upward trajectory and largely compensated
for the European slowdown.
EPIA’s major findings for 2013 include:
• At least 38.4 GW of PV systems were installed globally in 2013, up from 30 GW in 2012; PV
remains, after hydro and wind power, the third most important renewable energy source in terms
of globally installed capacity
• Almost 11 GW of PV capacity were connected to the grid in Europe in 2013, compared to
17.7 GW in 2012 and more than 22.4 GW in 2011
• For the first time since 2003 Europe lost its leadership to Asia in terms of new installations
• China was the top market in 2013 with 11.8 GW of which 500 MW represent off-grid systems.
Statistics released in May 2014 report that the country may have installed an additional 1.1 GW
on top of the 11.8 GW estimated by EPIA. Since it is unsure whether these installations were
connected to the grid EPIA did not take them into account. China was followed by Japan with
6.9 GW and the USA with 4.8 GW.
• Germany was the top European market with 3.3 GW. Several other European markets exceeded
the one GW mark: the UK (1.5 GW), Italy (1.4 GW), Romania (1.1 GW) and Greece (1.04 GW)
• Several European markets that performed well in the past went down in 2013, a consequence of
political decisions to reduce PV incentives, Belgian installations went from 600 megawatts (MW)
to 215 MW, French went from 1,115 MW to 613 MW, and Danish went down from 300 to around
200 MW
• Aside from the significant decline in Germany and Italy, the size of the remaining European PV market
was stable, with around 6 GW per year in the last three years
• Outside Europe, several markets continued to grow at a reasonable pace: India with 1,115 MW,
Korea with 442 MW, Thailand with 317 MW, Canada with 444 MW and many others
EPIA • GLOBAL MARKET OUTLOOK FOR PHOTOVOLTAICS 2014-2018 • 9
1. INTRODUCTION Changing regional trends, new market leaders Europe’s role as the unquestioned leader in the PV market has come to an end. While Europe accounted for 74% of the world’s new PV installations in 2011, and even around 55% the year after, the region only represented 29% of the world’s new PV installations in 2013. That said, various markets in Europe still have strong and almost untapped potential for significant PV growth in the coming years. In 2013, growth came mainly from Asian countries and especially China and Japan, which now rank as the first and second global markets respectively. Markets in the Americas grew less quickly than expected, but growth was observed in the USA, Canada and Mexico. In other regions of the world, interest in PV has not yet translated into significant market development. Increasing competitiveness PV markets in Europe and around the world continued to make rapid progress toward competitiveness in the electricity sector in 2013. Strong PV technology price decreases and electricity prices on the rise have helped drive momentum toward “dynamic grid parity” - when the savings in electricity cost and/or the revenues generated by selling PV electricity on the market are equal to or higher than the long-term cost of installing and financing a PV system. Competitivenes is being reached progressively in some market segments of several EU countries. 10 • EPIA • GLOBAL MARKET OUTLOOK FOR PHOTOVOLTAICS 2014-2018
1. INTRODUCTION
PV as a policy-driven market
In most countries however, PV remains a policy-driven market. The introduction, modification or phasing-
out of national support schemes, which heavily impact the development of PV markets and industries
in these countries, also significantly influence EPIA’s forecasts and scenarios. Indeed, declining political
support for PV has led to reduced markets in several European countries (Germany, Italy, Belgium,
France and Spain for instance) while the implementation of new feed-in tariff policies has led to a dramatic
increase of the markets in other countries (such as China and Japan).
PV in the electricity mix
For the third year in a row, PV in 2013 was amongst the two most installed sources of electricity
in the European Union. While wind energy exceeded PV in 2013 by some hundreds of MW, these two
sources of electricity are the clear leaders of new generation sources of installations. PV now covers 3%
of the electricity demand and 6% of the peak electricity demand in Europe. As the share of PV in the
electricity mix increases, grid and market integration challenges are becoming more and more important
for the future development of PV.
EPIA • GLOBAL MARKET OUTLOOK FOR PHOTOVOLTAICS 2014-2018 • 112 METHODOLOGY
AND SCENARIOS2. METHODOLOGY AND SCENARIOS
Forecasting PV market evolution has become more complex than it was in the past. The PV market is
clearly driven by policy, but as we are now in an era of energy market integration, the market potential
of PV also depends on electricity savings and/or potential sales on the wholesale electricity market.
While EPIA’s latest analyses indicate that in 2014 a part of the European market will still be driven by
incentives, several key markets are already entering the transition phase from an investor-driven market
to a market driven by savings on the energy bill through self-consumption in the construction segment
(residential, commercial and industrial).
In addition, economic uncertainty in several European countries has in some cases led policymakers to
make decisions that have a negative effect on the PV market, such as imposing retrospective measures.
These decisions severely erode investor confidence even as PV technology and competitiveness improve
– slowing market development in a way that is not easily predictable. In 2013, several retrospective
measures were taken, severely damaging the reputation of PV. Moreover, such measures harm the
credibility of the countries beyond PV, affecting their whole financing sector.
In March 2014, EPIA completed an extensive data-collection exercise from a highly representative sample
of the PV industry, electric utilities, national associations and energy agencies. Based on the cross-
checking of data and the consolidation of complementary market projection methods, EPIA has derived
three scenarios for the future development of PV markets:
• The High Scenario assumes the continuation, adjustment or introduction of adequate support
mechanisms, accompanied by a strong political will to consider PV as a major power source in
the coming years. Achieving this will also require removing unnecessary administrative barriers
and streamlining grid connection procedures. Although market booms caused by inadequate
support mechanisms are less likely to happen because of the growing exchange of best practices
when designing support policies, they can still be observed in some cases.
• The Low Scenario assumes rather pessimistic market behaviour with no major reinforcement or
adequate replacement of existing support mechanisms, or a strong decrease/limitation of existing
schemes, or no adequate policies. In this scenario, it is assumed that in countries close to
transition, markets significantly slow down when Feed-in Tariffs (FiTs) are phased out.
• The Medium Scenario weights the two previous scenarios according to the probability of
achieving them. This new scenario defines the most probable market development forecast,
according to the information available in March 2014.
Under these three scenarios, this report analyses the historical development of the PV market and its
potential for the future. Based on a bottom-up approach at country level, it presents aggregated figures
and scenarios. In this approach, consolidated forecasts should be understood as a range of possible
PV market developments, with a high probability between the Low Scenario as the lower boundary and
the High Scenario as the top of the range. Lower or higher forecasts are of course possible as the history
of PV market development has shown, although with a lower likelihood.
EPIA • GLOBAL MARKET OUTLOOK FOR PHOTOVOLTAICS 2014-2018 • 132. METHODOLOGY AND SCENARIOS Installations and connections EPIA’s methodology includes only systems connected to the grid and not those that have been installed but not yet connected. Therefore, the cumulative installed capacity refers to installations that can make a real contribution to meeting energy demand. This also reflects both the energy system point of view and the regulatory point of view, as PV electricity tariffs are paid only to systems that are connected and producing electricity. The difference between installations and systems connected to the grid can be quite significant in some cases, as was detailed in previous editions of the “Global Market Outlook”. The role of off-grid installations Long before PV became a reliable source of power connected to the grid, it was largely used to provide electricity in remote areas that lay out of the reach of electricity grids. While off-grid systems in Europe account for less than 1% of the installed PV capacity, they represent a significant power source in other parts of the world. For this reason, off-grid systems are also taken into account in the total installed capacity. In the USA, off-grid systems represented 10% of the overall market in 2009 and declined since then. In Australia and South Korea, dozens of megawatts of off-grid capacity are installed every year and are accordingly taken into account in the total installed capacity in those countries. In countries such as India or Peru, the development of PV in the coming years could originate at least partially from hybrid systems and micro-grid applications. In that respect the notion of on-grid or off-grid installations could be more difficult to assess outside Europe. 14 • EPIA • GLOBAL MARKET OUTLOOK FOR PHOTOVOLTAICS 2014-2018
2. METHODOLOGY AND SCENARIOS
AC-DC numbers: counting comparable numbers
PV panels generate direct-current (DC) electricity; electricity systems are based on alternating-current
(AC) electricity. Most countries refer to installed PV systems by counting DC power, but some report AC
power. The major difference lies in the small percentage of energy lost during the DC-AC conversion in
the inverters and the inverter parameters, which could deliver non-comparable data. This report presents
data as they are produced by national authorities to ensure the compatibility of historical data, whatever
the conventions used. However, in the case of countries reporting AC power, this report also calculates
DC power numbers. All forecasts and consolidated data are presented in DC power, while electricity
production data must consider AC power. In such cases, a realistic loss during conversion is assumed.
In Europe, Spain falls into this category. Canada and Japan, amongst others are also reporting (at least
partially for the latter) in AC.
EPIA • GLOBAL MARKET OUTLOOK FOR PHOTOVOLTAICS 2014-2018 • 153 MARKET
EVOLUTION3. MARKET EVOLUTION
A. HISTORICAL PV MARKET DEVELOPMENT
The PV market has grown over the past decade at a remarkable rate – even during difficult economic
times – and is on the way to becoming a major source of power generation for the world. After record
growth in 2011, the global PV market stabilised in 2012, and grew again significantly in 2013.
1. World cumulative installed capacity
At the end of 2009, the world’s cumulative installed PV capacity was more than 23 GW. One year later
it was 40.3 GW and at the end of 2011 it was 70.5 GW. In 2012, the 100 GW mark was reached and
by 2013, almost 138.9 GW of PV had been installed globally —an amount capable of producing
at least 160 terawatt hours (TWh) of electricity every year. This energy volume is sufficient to cover
the annual power supply needs of over 45 million European households. This is also the equivalent of
the electricity produced by 32 large coal power plants. The global cumulative installed capacity could
have even reached 140 GW in 2013 if the additional 1.1 GW in China were taken into account.
Europe remains the world’s leading region in terms of cumulative installed capacity, with 81.5
GW as of 2013. This represents about 59% of the world’s cumulative PV capacity, down from 70% in
2012 and about 75% of the world’s capacity in 2011. Asia Pacific countries are growing fast, with 40.6
GW now installed. Next in the rankings are the America’s (13.7 GW).
160,000
138,856
140,000
120,000
100,504
100,000
MW 80,000 70,469
60,000
40,336
40,000
23,185
20,000 15,844
6,660 9,183
2,069 2,635 3,723 5,112
1,288 1,615
0
2000 2001 2002 2003 2004 2005 2006 2007 2008 2009 2010 2011 2012 2013
RoW 751 807 887 964 993 1,003 1,108 1,150 1,226 1,306 1,590 2,098 2,098 2,098
MEA n/a n/a n/a n/a 1 1 1 2 3 25 80 205 570 953
China 19 24 42 52 62 70 80 100 140 300 800 3,300 6,800 18,600
Americas 21 24 54 102 163 246 355 522 828 1,328 2,410 4,590 8,365 13,727
APAC 368 496 686 916 1,198 1,502 1,827 2,098 2,628 3,373 4,951 7,513 12,159 21,992
Europe 129 265 399 601 1,306 2,291 3,289 5,312 11,020 16,854 30,505 52,764 70,513 81,488
Total 1,288 1,615 2,069 2,635 3,723 5,112 6,660 9,183 15,844 23,185 40,336 70,469 100,504 138,856
RoW: Rest of the World. MEA: Middle East and Africa. APAC: Asia Pacific.
Methodology used for RoW data collection has changed in 2012.
Figure 1 - Evolution of global PV cumulative installed capacity 2000-2013
EPIA • GLOBAL MARKET OUTLOOK FOR PHOTOVOLTAICS 2014-2018 • 173. MARKET EVOLUTION
Many of the markets outside the EU - in particular the USA or India - have tapped only a very small part
of their enormous potential. In 2013, Asian countries took the lead and started to develop faster than
traditional European markets. Several countries from large Sunbelt regions like Africa, the Middle East,
South East Asia and Latin America are on the brink of starting their development. The cumulative
installed capacity outside Europe almost doubled from 30 GW as of 2012 to close to 60 GW in
2013, demonstrating the ongoing rebalancing between Europe and the rest of the world and more
closely reflecting the patterns in electricity consumption.
2. World PV market development
The global PV market progressed in 2013: after two years of around 30 GW of installations annually, the
market reached more than 38 GW in 2013, establishing a new world record. But the most important fact
from 2013 is a rapid development of PV in Asia combined with a sharp drop of installations in Europe.
This record could have been even higher. In fact almost 40 GW have been installed in 2013 if we consider
the 1.1 GW more installed by China.
38,352
40,000
35,000
30,133 30,011
30,000
25,000
MW 20,000
17,151
15,000
10,000
6,661 7,340
5,000 2,524
1,088 1,389 1,547
293 324 454 566
0
2000 2001 2002 2003 2004 2005 2006 2007 2008 2009 2010 2011 2012 2013
RoW 88 56 80 77 29 10 105 42 76 80 284 508 n/a n/a
MEA n/a n/a n/a n/a 1 0 0 1 1 22 55 125 365 383
China 19 5 19 10 10 8 10 20 40 160 500 2,500 3,500 11,800*
Americas 2 3 30 48 61 82 110 166 306 500 1,082 2,181 3,774 5,362
APAC 126 128 190 230 282 304 325 271 530 745 1,578 2,562 4,646 9,833
Europe 58 133 134 202 705 985 997 2,023 5,708 5,833 13,651 22,259 17,726 10,975
Total 293 324 454 566 1,088 1,389 1,547 2,524 6,661 7,340 17,151 30,133 30,011 38,352
RoW: Rest of the World. MEA: Middle East and Africa. APAC: Asia Pacific.
Methodology used for RoW data collection has changed in 2012.
*This number could be increased to 12,920 MW.
Figure 2 - Evolution of global annual installations 2000-2013
18 • EPIA • GLOBAL MARKET OUTLOOK FOR PHOTOVOLTAICS 2014-20183. MARKET EVOLUTION
China became the top PV market in the world in 2013 and achieved the world’s largest PV
installation figure in one year with 11.8 GW connected to the grid, after Italy installed 9.3 GW in 2011
and Germany installed between 7.4 GW and 7.6 GW from 2010 to 2012. Japan scored 6.9 GW and
took the second place in 2013, while the USA installed 4.8 GW.
Europe’s market had progressed rapidly over the past decade: from an annual market of less than 1
GW in 2006 to a market of over 13.7 GW in 2010 and 22.3 GW in 2011 - even in the face of difficult
economic circumstances and varying levels of opposition to PV in some countries. But the record
performance of 2011, driven by the fast expansion of PV in Italy and a continued high level of installations
in Germany, was not repeatable and the market went down to 17.7 GW in 2012 and almost 11 GW in
2013, the lowest market level since 2009.
After holding the world’s top PV market position seven times in the last 14 years, Germany was
only fourth in 2013 with 3.3 GW, and yet still by far the largest European market. The UK was the
second European market with 1.5 GW. Italy, which was the second European market in 2012, installed
more than 1.4 GW in 2013, down from 3.6 GW the year before and 9.3 GW in 2011. Other European
countries that installed more than 1 GW are Romania (around 1.1 GW) and Greece (1.04 GW).
Together, China, Japan, the USA, Germany and the UK accounted for nearly 28.3 GW, or three-
quarters of the global market over the last year. This is even higher than in 2012 when together the
top-five global markets represented around 65%.
Regionally, the Asia-Pacific (APAC) region, which in addition to China and Japan includes Korea,
Australia, Taiwan and Thailand, scored first place in 2013 with close to 56% of the global PV market.
Europe came second with almost 11 GW out of 38.4 GW or 29%. The third leading region is North
America, with Canada developing steadily alongside the USA. Elsewhere, the Middle East and North
Africa (MENA) region represents untapped potential for the medium term. PV also shows great potential
in South America and Africa, where electricity demand will grow significantly in the coming years and
numerous projects that have started will lead to installations in 2014 and after.
EPIA • GLOBAL MARKET OUTLOOK FOR PHOTOVOLTAICS 2014-2018 • 19Europe Asia
Cumulative 2013 81,488 MW Cumulative 2013 37,344 MW
W/habitant 2013 125.1 W/hab W/habitant 2013 11.5 W/hab
North America
Cumulative 2013 13,446 MW
Middle East
W/habitant 2013 28.6 W/hab
Cumulative 2013 530 MW
W/habitant 2013 10.9 W/hab
Figure 3 - Global PV regional installations per habitant
20 • EPIA • GLOBAL MARKET OUTLOOK FOR PHOTOVOLTAICS 2014-2018
Latin America
Cumulative 2013 281 MW
W/habitant 2013 0.9 W/hab
Oceania
Africa
Cumulative 2013 3,248 MW
Cumulative 2013 422 MW
W/habitant 2013 108.3 W/hab
W/habitant 2013 1.1 W/hab3. MARKET EVOLUTION
3. European market development
Europe’s strong PV market development until 2012 was the result of a few countries taking the lead year
after year, with German policymakers showing a constant commitment to supporting the development
of PV. After the Spanish boom in 2008, Germany alone was the leading market in 2009, and
consequently European growth as a whole was limited. In retrospect this can be seen as a consequence
of the first phase of the financial crisis but also as a year of stabilisation after the boom PV experienced
in 2008. Major growth returned in 2010, with Germany achieving unprecedented installation numbers,
and Italy and the Czech Republic adding together close to 3.8 GW of PV systems.
Spain and the Czech Republic demonstrated that overheated market development can produce a
boom in one year and a bust in the next, as a result of pressure from conventional energy producers and
policymakers concerned about the rapid growth of the market. In 2011, the combined boom in Italian
connections and German installations led again to huge growth. France’s growth in 2011 was at least partly
due to its connection of projects installed in 2010 and consequently in 2012 the French market went down
as expected. In 2012, the record year for Germany allowed the European market to maintain a reasonable
level of 17.7 GW of installations, with 11.4 GW coming from Germany and Italy alone. Aside from these two,
the UK, Greece, Bulgaria and Belgium provided a large part of the European market development.
In 2013, the decline of Germany and Italy as the main drivers of the European market was
confirmed. While the sum of the market in other countries remained around 6 GW, the drop in
installations in Germany and Italy decreased the total European market to nearly 11 GW. In 2013,
the decline of markets that performed well in recent years, such as Belgium or France, was compensated
by the boom in Greece and Romania, although, depending on the political circumstances, these latter
markets could see a serious decline in the coming years. The rest of the European market development
took place in the UK, but also smaller-sized markets such as Switzerland, the Netherlands, Austria, and
Belgium still showing progress.
25,000
22,259
20,000
17,726
15,000
13,651
MW 10,975
10,000
5,708 5,833
5,000
2,023
705 985 997
58 133 134 202
0
2000 2001 2002 2003 2004 2005 2006 2007 2008 2009 2010 2011 2012 2013
Spain Belgium United Kingdom Austria Rest of Europe
Germany Italy Greece Denmark Romania
Total Europe (until 2004) Czech Republic France Bulgaria Netherlands
Figure 4 - Evolution of European new grid-connected PV capacities 2000-2013
EPIA • GLOBAL MARKET OUTLOOK FOR PHOTOVOLTAICS 2014-2018 • 213. MARKET EVOLUTION
The cumulative evolution shows a similar story, with countries stabilising their installed capacity after
major growth years, as Germany continues to expand its PV base, albeit at a slower speed than in
previous years. While the 80 GW mark has been reached in Europe, the pace of PV market deployment
has been clearly reduced, which will have consequences for the ability of PV to reach high penetration
levels in the short to medium term in Europe.
90,000
81,488
80,000
70,513
70,000
60,000
52,764
50,000
MW
40,000
30,505
30,000
20,000 16,854
11,020
10,000 5,312
3,289
601 1,306 2,291
129 265 399
0
2000 2001 2002 2003 2004 2005 2006 2007 2008 2009 2010 2011 2012 2013
Spain Czech Republic Romania United Kingdom Rest of Europe
Germany Italy Belgium France Greece
Total Europe (until 2003)
Figure 5 - Evolution of European PV cumulative installed capacity 2000-2013
Germany saw steady growth for nearly a decade and clearly represents the most developed PV
market, despite the 2013 market downturn. Countries which got a later start – the Czech Republic,
Italy, Greece and Belgium – quickly reached high levels, and decreased rapidly afterwards. Next
to these leaders, Spain now appears quite low since its market has been constrained. The results for
France and the UK still reveal untapped potential in both countries, but with different trajectories.
While the French market significantly decreased in 2013, the UK unexpectedly almost doubled its
annual installed capacity during that year. Indeed, in 2013, the UK installed more than Italy, becoming
together with Germany the main drivers of the European market.
22 • EPIA • GLOBAL MARKET OUTLOOK FOR PHOTOVOLTAICS 2014-20183. MARKET EVOLUTION
Europe’s PV development was unrivalled for a decade until 2013. The USA and Japan, once PV pioneers,
used to be behind Europe in terms of PV penetration, yet China has reached their level with just a few
years of fast development. Apart from Australia, the rest of the world scores quite low in terms of PV
penetration, although in many countries there remains great untapped potential, especially in the Sunbelt.
For the most part, the development of PV has until now corresponded with economic development;
after taking root in OECD countries (Europe, North America, Japan, Australia), it has started to reach
emerging countries. While the BRIC countries score low as a bloc, China and India will lead Brazil
and possibly Russia by example. Africa scores last on the development list, though projects are piling
up fast.
EPIA • GLOBAL MARKET OUTLOOK FOR PHOTOVOLTAICS 2014-2018 • 232
0.02
4
0.1
0.3
98 2
0.7
56
0.2
40
14
207
97
72 2
92
103
5
26 0.2
28
54
Legend
Market Cumulative Market Cumulative W/habitant Market Cumulative Market Cumulative W/habitant
>750 W/habitant 2012 2012 2013 2013 2013 2012 2012 2013 2013 2013
500-750 W/habitant (MW) (MW) (MW) (MW) (MW) (MW) (MW) (MW)
350-500 W/habitant Austria 175 363 250 613 72 Lithuania 6 6 0 6 2
Belgium 683 2,768 215 2,983 268 Luxembourg 0 30 0 30 56
200-350 W/habitant
Bulgaria 843 1,010 10 1,020 140 Malta 4 16 7 23 54
100-200 W/habitant Croatia 0 0 20 20 5 Netherlands 195 360 305 665 40
50-100 W/habitant Cyprus 7 17 15 32 28 Norway 0 0 0 0 0.02
Czech Republic 116 2,087 88 2,175 207 Poland 4 7 1 7 0.2
10-50 W/habitant Denmark 316 332 216 548 98 Portugal 70 242 36 278 26
1-10 W/habitant Estonia 0 0 0 0 0.1 Romania 46 51 1,100 1,151 54
Finland 0 11 0 11 2 Slovakia 15 523 0 524 97
0-1 W/habitant
France 1,115 4,060 613 4,673 71 Slovenia 122 201 11 212 103
N/A Germany 7,604 32,411 3,304 35,715 436 Spain 332 5,221 118 5,340 116
Greece 912 1,536 1043 2,579 229 Sweden 8 22 18 40 4
Hungary 8 12 10 22 2 Switzerland 226 437 300 737 92
Ireland 0 3 0 3 0.7 Turkey 5 12 6 18 0.2
Italy 3,759 16,479 1,448 17,928 294 Ukraine 130 326 290 616 14
Latvia 0 1 0 1 0.3 United Kingdom 925 1,829 1546 3,375 53
Country regional data must be considered an approximation.
Figure 6 - European PV installations per habitant
EPIA • GLOBAL MARKET OUTLOOK FOR PHOTOVOLTAICS 2014-2018 • 24B. THE MARKET IN EUROPE IN 2013 AND THE FORECAST UNTIL 2018
With almost 11 GW of new PV capacity in 2013, Europe has increased its cumulative capacity base to
81.5 GW. This relatively low 2013 result was mainly caused by the significant decrease of two markets,
Germany and Italy, while the total size of other European markets remained stable around 6 GW
(including the UK which ranked second in 2013). Several other key countries also underperformed,
notably France, Belgium and Denmark.
1. Relevant European markets in 2013
The overall decline in Europe’s PV market in 2013 hides various realities at national level; market evolution
was very different from one country to another. The development until 2013 was accompanied by a
progressive evolution in market dynamics, with PV in 2013 becoming increasingly self-sustainable in several
market segments and countries. With PV’s levelised cost of electricity (LCOE) now lower than the price of
retail electricity, at least in the residential and commercial segment in Germany or Italy, PV development
could be at least partially driven by self-consumption rather than only FiTs or similar support schemes.
But the competitiveness of PV installations not only depends on the ability of PV to reduce electricity
bills, but also to sell excess electricity on the markets. From this point of view, 2013 was a difficult year,
with several countries backtracking from previous commitments, through measures aimed at
discouraging prosumers (Spain) or increasing grid costs for PV systems (Bulgaria, Belgium – although
subsequently revoked). In addition, several countries took retrospective measures that reduced the
revenues of existing PV plants in the last few years (Spain, Czech Republic, Greece…), damaging the
attractiveness of PV as a long-term investment and penalising the market in these countries.
For the first time in years, the installations in Germany went down to 3.3 GW. Germany saw three
consecutive years with a roughly stable 7.4-7.6 GW of connections, leading to a total installed capacity
in the country of a record 35.7 GW. However, regulatory changes pushed the market down.
While the UK has approached the one GW mark in recent years, 2013 can be considered as a record
year for the country. With 1.5 GW installed last year, the UK took the position of second European market
over Italy.
Rest of Europe (3%)
Belgium (2%)
Denmark (2%)
Austria (2%)
Ukraine (3%)
Switzerland (3%)
Netherlands (3%) Germany (30%)
France (6%) Total installed
capacity
10,975 MW
Greece (9%)
Italy (13%)
Romania (10%)
United Kingdom
(14%)
Figure 7 - European PV market split in 2013
EPIA • GLOBAL MARKET OUTLOOK FOR PHOTOVOLTAICS 2014-2018 • 253. MARKET EVOLUTION In Italy, 1.4 GW of PV were connected to the grid in 2013, a sharp decrease compared to 2011 and 2012, causing it to lose the second place position it held for some years. In fact, after the rush of 2011 and 2012, the Italian market has dropped down to a level that nevertheless remains the third highest in Europe. Having reached a financial cap for FiTs, the Italian market is now experiencing the transition to the post-FiT era with a substantial market level decrease. Other European markets together represented roughly the same level of installations as in 2011 and 2012, but the countries that significantly contributed were rather different from one year to another. In 2013, two countries installed slightly more than 1 GW of PV: after several years of expectations, Romania installed around 1.1 GW in only one year, a fast development level that is probably not going to be maintained there. A vigorous market saw Greece cross the one GW mark again with 1.04 GW installed, but without clear perspectives for 2014. Amongst the countries that installed at least 1 GW in the last few years, France disappointed with only 613 MW installed in 2013, a sharp decline compared to 2011 and 2012, due to political uncertainty and a lack of political will to develop PV. In addition, government decisions to hastily freeze or reduce support mechanisms as well as opposition from the main conventional stakeholders led to a negative image of PV technology in the public eye. With 613 MW of PV in 2013, the country is still performing at rather low levels compared to the largest European markets and below 2011 when it scored 1.77 GW. While the government reconfirmed in 2013 its will to allow 1 GW of new capacity be installed every year, the constraints on market development remain significant. 26 • EPIA • GLOBAL MARKET OUTLOOK FOR PHOTOVOLTAICS 2014-2018
3. MARKET EVOLUTION

Denmark had been one of the surprises of the year 2012 with 316 MW, but the boom was stopped in
2013 by a change in the net-metering policy: the compensation period which was an entire year in 2012
was reduced to an hour, reducing the attractiveness of PV in this country. Nevertheless the market level
established itself at 216 MW. Austria installed around 250 MW and Switzerland 300 MW, in a growing
market. The net-metering system in the Netherlands performed quite well and the country installed
around 305 MW of new PV installations in 2013.
Belgium installed only 215 MW in 2013, after having reached high levels in 2011 and 2012, in a context
of strong political concern over the cost of support schemes and long discussions about retrospective
measures and additional grid fees for prosumers. Bulgaria experienced a boom in 2012, with a total of
843 MW installed before the government reacted with harsh retroactive measures to slow the market
growth. The consequence in 2013 was clear with the country’s market slowing down to only 10 MW.
The Czech Republic’s boom is a story from the past and the market only reached 88 MW in 2013,
significantly below the 2012 level when 116 MW were installed. Some countries, notably Poland, failed
to fulfil expectations in 2013 and the prospects for 2014 remain weak, despite some potential.
In the Spanish context of economic crisis, huge overcapacities in the electricity sector and strong
opposition to PV from the authorities and some electricity stakeholders, the decisions taken in 2013
resulted in a reduction of the market to a very low level. Only 118 MW were connected to the grid in 2013
in a country which has the potential to be among the European leaders. The long-expected net-metering
scheme was never introduced and the self-consumption policy that was presented in 2013 will not allow
PV to develop in the coming years: the levy imposed on prosumers, combined with dissuasive tariffs for
grid connection, appears to be the most constraining regulation in Europe for self-consumption.
Ukraine’s PV development continued in 2013 with 290 MW installed, a level that can be compared to
2011 and 2012. The turmoil in the country didn’t really affect the market in 2013 but could be much
more damaging in 2014, especially in the Crimea, where the Ukrainian government stopped support
schemes due to the geopolitical crisis. Slovakia, which experienced a relative boom at the end of 2011
and the first semester of 2012, went down to zero in 2013. Slovenia, which grew over several years
and installed 122 MW in 2012, went down in 2013 to 11 MW.
The development level in Russia remained quite low with only a few MW installed and few prospects in
the short term. Sweden has seen several MW installed each year (18 MW in 2013) but without significant
policies and prospects.
Turkey remained quite low at around 6 MW despite its potential, but the situation could change in 2014.
Several other countries have reported some MW installed but without representing any significant change
at European market level.

                                              EPIA • GLOBAL MARKET OUTLOOK FOR PHOTOVOLTAICS 2014-2018 • 27
3. MARKET EVOLUTION
2. Segmentation
The European PV market remains quite varied, with very diverse segmentation from one country
to another (Figure 8). The market segmentation has been split to distinguish between ground-mounted
systems, commercial and industrial rooftop applications and residential applications.
100
90
80
70
60
% 50
40
30
20
10
0
s
ia
en
m
ce
ia
ia
ry
n
k
ia
e
ria
ly
nd
m
y
ic
nd
l
nd
ga
ar
ai
ec
an
ar
en
ak
an
do
Ita
ga
bl
iu
ed
an
st
la
la
Sp
nm
rla
lg
rtu
re
pu
m
lg
ov
ov
m
un
ng
Au
er
Po
Fr
Sw
Bu
G
Be
er
he
Ro
Po
De
Re
itz
Sl
Sl
H
Ki
G
et
Sw
d
ch
N
te
ze
ni
C
U
Ground mounted Industrial Commercial Residential
Figure 8 - European PV market segmentation by country in 2013
The segmentation is not classified according to standard sizes, since the size of system largely depends
on the respective structure of support schemes, country by country. In general, the commercial segment
should be distinguished from the residential segment not only according to the system size but also the
nature of the investor (private or public person) and the respective regime of retail electricity prices. The
same classification can be applied to distinguish between commercial and industrial segments, according
to the electricity price contracts.
28 • EPIA • GLOBAL MARKET OUTLOOK FOR PHOTOVOLTAICS 2014-20183. MARKET EVOLUTION
2012 2013
Ground mounted Residential (21%) Ground mounted Residential (22%)
(28%) (34%)
Total installed Total installed
capacity capacity
17,726 MW 10,975 MW
Industrial (19%) Commercial (32%) Industrial (17%) Commercial (27%)
Figure 9 - European PV market segmentation in 2012 and 2013
Market segmentation in Europe evolved in 2013 compared to previous years. Given the 2012 and
2013 changes in regulatory frameworks, the ground-mounted segment was expected to decline in
Europe in 2013. This was not the case and ground-mounted plants represented a higher share of a
reduced market in 2013. Overall a very large share of the market in Europe is still concentrated in
the commercial and industrial rooftop segments; this trend will continue, based on the foreseen
evolution of the legal framework. The residential segment has developed very rapidly in some
countries, such as Belgium (where 1 out of 13 households are now equipped with a PV system),
Denmark, Greece and the UK.
100
90
80
70
60
% 50
40
30
20
10
0
a
ry
ria
s
om
ria
ce
ly
ia
ic
en
y
e
ia
d
l
n
m
k
nd
ga
nd
i
an
ec
ar
ai
an
an
Ita
ga
en
bl
ak
iu
st
ga
an
ed
la
d
Sp
rtu
nm
rla
pu
m
re
lg
m
l
Au
ov
un
ov
ng
Po
er
Fr
l
Sw
Bu
er
G
Be
Ro
Po
he
Re
De
itz
Sl
Sl
H
Ki
G
et
Sw
ch
d
N
te
ze
ni
C
U
Ground mounted Industrial Commercial Residential
Figure 10 - European PV cumulative capacity segmentation by country in 2013
EPIA • GLOBAL MARKET OUTLOOK FOR PHOTOVOLTAICS 2014-2018 • 293. MARKET EVOLUTION
The top five countries per segment show the relative domination of the largest markets (Germany, Italy,
UK and France).
Residential Commercial
Rest of Europe
Rest of Europe Germany (24%) (16%) Germany (38%)
(25%)
France (8%)
Total installed Total installed
capacity capacity
Denmark (9%) 2,415 MW Italy (9%) 2,963 MW
United Kingdom
(17%)
Netherlands (10%) Greece (11%)
United Kingdom
Italy (15%) (18%)
Industrial Ground mounted
Rest of Europe Rest of Europe
(9%) (9%)
Belgium (2%) Italy (5%)
Italy (32%) Germany (31%)
Switzerland (10%)
France (9%)
Total installed Total installed
capacity capacity
1,866 MW 3,731 MW
Germany (23%)
United Kingdom
(16%)
Greece (24%) Romania (30%)
Figure 11 - Top 5 European markets per segment in 2013
3. Forecasts of PV in Europe until 2018
Forecasts for PV installations in the previous edition of the Global Market Outlook proved to be correct.
The 2013 global market figure of 38.4 GW indeed represents the average from the Low Scenario (28
GW) and the High Scenario (48 GW) in last year’s edition.
The European PV market peaked in 2011 with more than 22 GW installed. Such a high level was not
sustainable and the market went down to 17.7 GW in 2012. The 2013 market declined further to nearly
11 GW, which is the lowest level since 2009 in Europe. While the market slowdown in Germany and Italy
was predictable and expected, the stability of the rest of Europe (considered as a whole) should not be
misinterpreted. What could appear at first sight as a sign of more sustainable market development in these
countries is revealed as something different after an in-depth examination of the remaining 5-6 GW. Each
year, some markets boomed before experiencing a bust in the following years, and the market was shored-
up by different countries every year. The picture is clearer when looking at the countries that installed close
to or at least 1 GW each year (outside of the top two countries); in 2011, Belgium, France, and the UK; in
2012, France again, the UK, Greece and Bulgaria; in 2013, Italy and Greece again, and Romania.
30 • EPIA • GLOBAL MARKET OUTLOOK FOR PHOTOVOLTAICS 2014-20183. MARKET EVOLUTION
The instability of markets in Europe leads to the important conclusion, for market forecasts in Europe
that, with the exception of a comparably soft landing of the market in Germany, no country that
experienced a serious PV boom once has so far succeeded in restoring market confidence. On the
contrary, policymakers seem to have ensured that in these countries PV would not be allowed to reach
the same market levels reached previously. This was the case in Spain, Czech Republic, Slovakia,
Bulgaria, and most probably in Belgium and Italy. The number of markets in Europe where PV hasn’t
developed yet remains limited and considering past experience, a further overall market decline could
emerge if particular countries replicate the pattern of boom and bust seen elsewhere in Europe.
Overall, the future of the European market is uncertain for the coming years. The drastic decrease
of some FiT programmes will push some markets down in 2014, with a limited number of emerging
markets in Europe that could offset any major decline. Given these new conditions, the short-term
prospects for the European markets are stable in the best case, and could even decline. In the Low
Scenario, without support from policymakers for PV, the transition to a cost-competitive PV market driven
less by financial support schemes could be difficult over the five years to come, with a rather low market
in Europe (around 6-8 GW). In the High Scenario, the market could stabilise in 2014 and grow again
from 2015 onwards, driven by the approaching competitiveness of PV and emerging markets in Europe.
This would require a stabilisation in the largest European markets (Germany, Italy), a continuation of
current policies in the UK and a renewed uptake in Spain and possibly France, and a soft landing of
markets in the final years before 2018 (especially in Greece and Romania). The contribution of middle-
size markets such as Belgium, the Netherlands, Denmark, Switzerland, Austria and Portugal could help
maintain the market at its 2013 level during the coming years.
25,000
22,259
20,000
17,726
17,185
16,080
14,505
15,000 13,655
13,651 13,045
MW 10,975
10,000
7,955 8,290
6,983 7,449
6,852
5,708 5,833
5,000
2,023
705 985 997
202
0
2003 2004 2005 2006 2007 2008 2009 2010 2011 2012 2013 2014 2015 2016 2017 2018
Historical data High scenario Low scenario Medium scenario
Figure 12 - European annual PV market scenarios until 2018
EPIA • GLOBAL MARKET OUTLOOK FOR PHOTOVOLTAICS 2014-2018 • 313. MARKET EVOLUTION
In the highest probability situation, 2014 will see a new market decline in Europe that could limit
the amount of new connections to around 8-9 GW, while competitive PV in several key countries
could help maintain the market at around 10-12 GW in the second part of the decade.
The total installed capacity in Europe could reach between 119 and 156 GW in 2018, starting from 81.5
GW at the end of 2013. In the best case, the 100 GW mark could be reached by 2015 in Europe.
180,000
155,958
160,000
138,773
140,000
122,693
120,000
108,188
119,017
100,000 94,533 110,727
102,772
MW 81,488 95,323
80,000 70,513 88,340
60,000 52,764
40,000 30,505
16,854
20,000 11,020
2,291 3,289 5,312
601 1,306
0
2003 2004 2005 2006 2007 2008 2009 2010 2011 2012 2013 2014 2015 2016 2017 2018
Historical data High scenario Low scenario Medium scenario
Figure 13 - European cumulative PV market scenarios until 2018
The countries where PV has not developed until now will be interesting to follow in the coming years,
because of their untapped potential but also for the unique opportunity to witness a different market
development than what was experienced until now in most European countries. The history of PV
proves that a stable policy framework using support schemes in a sustainable way increases
market confidence. Poland, Croatia, Hungary and to a lesser extent Ireland could develop in the coming
years in various forms. Outside of the European Union, Turkey and some Balkan states will become focal
points. Amongst the “old” markets, the rebirth of France, at the heart of the European grid, should be
carefully followed and encouraged in a way that suits the specifics of this country. In a similar way, PV
will not redevelop in Spain unless solutions can be found to the relative isolation of the country from a
grid perspective. Finally, the concept of prosumers seems to increasingly generate interest, but its
materialisation in real markets remains unsure, depending also on regulatory framework
conditions, including the allocation of charges and taxes. In 2013, the sum of installations that
were at least partially driven by self-consumption in Europe amounted to over 2 GW. The question
is how fast prosumers will become central actors of PV development in Europe.
32 • EPIA • GLOBAL MARKET OUTLOOK FOR PHOTOVOLTAICS 2014-20183. MARKET EVOLUTION
4. 2020 potential and targets in the EU
Potential vs. market reality for PV deployment in the EU
EPIA’s report “Connecting the Sun: Solar photovoltaics on the road to large-scale grid integration”,
published in 2012, identifies several possible PV deployment scenarios to 2020 and 2030 that represent
the technology’s potential in line with the current economic and regulatory environment.
• The Baseline scenario envisages a 4% share of the electricity demand in the EU provided by PV
in 2020. This represents about 130 GW of cumulative capacity by 2020. In 2030, PV could
represent up to 10% of the electricity demand.
• The Accelerated scenario, with PV meeting 8% of the demand, represents about 200 GW of
cumulative capacity by 2020. In 2030, PV could target up to 15% of the electricity demand.
EPIA has compared various PV market forecasts until 2018 against the two scenarios developed in the
“Connecting the Sun” report as described above, as well as the NREAPs:
• The Low Global Market Outlook Scenario for PV until 2018 that used to be aligned with the
4% target (Connecting the Sun’s Baseline scenario) appears now to be slightly higher. This
represents a rather stable perspective compared to previous EPIA forecasts. Thus, it looks
reasonable to expect that 4-5% penetration for PV could be reached even in the low growth case
• The High Global Market Outlook Scenario for PV until 2018 appears increasingly unlikely to
be fully realised. While this scenario of reaching 8% by 2020 looked coherent and in line with
optimistic market expectations, the current political backlash has led to a revision of this objective
downwards to around 7%. Reaching a substantially higher share would require a real paradigm
shift in the way PV is supported and incentivised, even after cost-competitiveness is reached in
many countries and market segments. It is clear today that more ambitious scenarios are not
realistic options anymore and would require tremendous market developments, currently
unsupported by public policies in Europe
• The NREAPs as devised in 2009 are far from the reality of today’s PV market. Apart from Germany
and Greece (which defined ambitious targets), market evolution in most countries could easily
overtake the action plans. Future expectations largely reflect the current balance of installations,
with Germany and Italy dominating the market. In the EU forecasts, the NREAPs targets with the
intermediary value for 2015 have been taken into account. The extent to which they have
underestimated the market developments from 2012 and even 2013 is obvious (Figure 14)
EPIA • GLOBAL MARKET OUTLOOK FOR PHOTOVOLTAICS 2014-2018 • 333. MARKET EVOLUTION
The following table details for most EU markets the cumulative installed capacity at the end of 2013, the
official National Renewable Energy Action Plan (NREAP) target for PV by 2020 and the necessary yearly
market to reach this 2020 target (linear projection).
Cumulative NREAPs’ Necessary Target Market Market Market
installed 2020 target yearly market reached in… in 2011 in 2012 in 2013
capacity for PV until 2020
in 2013
Austria 613 322 n/a reached in 2012 92 175 250
Belgium 2,983 1,340 n/a reached in 2011 996 683 215
Bulgaria 1,020 303 n/a reached in 2012 135 843 10
Croatia 20 52 4.5 2014-2015 - - 20
Czech Republic 2,175 1,695 n/a reached in 2010 12 116 88
Denmark 548 6 n/a reached in 2010 9.6 316 216
France 4,673 4,860 26.7 2014-2015 1,777 1,115 613
Germany 35,715 51,753 2,291.2 2014-2015 7,485 7,604 3,304
Greece 2,579 2,200 n/a reached in 2013 426 912 1,043
Hungary 22 63 5.9 2014-2015 2.0 8 10
Italy 17,928 8,000 n/a reached in 2011 9,251 3,759 1,448
Netherlands 665 722 8.1 2014-2015 58 195 305
Poland 7 2 n/a reached in 2012 1.3 4 1
Portugal* 278 720 63.1 2016-2020 38 70 36
Romania 1,151 260 n/a 2014-2015 1.6 46 1,100
Slovakia 524 300 n/a reached in 2011 321 15 0
Slovenia 212 139 n/a reached in 2012 43 122 11
Spain 5,340 8,367 432.5 2016-2020 472 332 118
Sweden 40 8 n/a reached in 2011 4 8 18
United Kingdom 3,375 2,680 n/a reached in 2013 813 925 1,546
Rest of EU 28 99 308 29.9 2016-2020 24 17 42
Total EU 28 79,964 84,381 630.9 2014-2015 21,961 17,265 10,395
* In April 2013, a revised Renewable Energy Action Plan - REAP (2009/28/EC Directive) was published, adjusting the 2020 targets for each technology. For solar, the installed capacity target was reduced
from 1500 MW to 720 MW.
Target already reached in 2010-2013: Country has significantly underestimated PV’s potential.
Target to be reached by 2014-2015: Country has underestimated PV’s potential.
Target to be reached by 2016-2020: Country has either properly estimated PV’s potential (Germany) or has set measures constraining the market to meet the set target
not earlier than 2020.
Source: European Commission, DG Energy, Transparency Platform
Table 1 - NREAPs vs. reality of PV markets in the EU 28
34 • EPIA • GLOBAL MARKET OUTLOOK FOR PHOTOVOLTAICS 2014-20183. MARKET EVOLUTION
5. Medium-term scenario for 2030: How much can PV contribute to a binding 2030 target?
EPIA scenarios (published in 2012) show that PV penetration in Europe in 2030 could be between 10%
and 15% of electricity demand. As outlined before however, with current market trends it is quite unlikely
that the 8% scenario – which would have corresponded to a 15% share in 2030 - will be fully reached
by 2020. Building on these trends, and without major changes of policy, a share between 7% and
11% of PV in European electricity demand appears realistic.
The potential for 2020 is roughly twice as high as the levels foreseen in the NREAPs, pushing towards
at least 150 GW compared to 84 GW. In fact, with 81.5 GW installed by the end of 2013, the Europe-
wide NREAP target of 84 GW will already be reached in 2014.
600
500 15%
400
10%
GW 300
8%
200
4%
100
84 GW
0
00
01
02
03
04
05
06
07
08
09
10
11
12
13
14
15
16
17
18
19
20
21
22
23
24
25
26
27
28
29
30
20
20
20
20
20
20
20
20
20
20
20
20
20
20
20
20
20
20
20
20
20
20
20
20
20
20
20
20
20
20
20
High scenario Accelerated 2020 (8%) - “Connecting the Sun” Accelerated 2030 (15%) - “Connecting the Sun”
Low scenario Baseline 2020 (4%) - “Connecting the Sun” Baseline 2030 (10%) - “Connecting the Sun”
Historical data National targets (NREAPs) 2020 (2.4%)
EPIA, “Connecting the Sun: Solar photovoltaics on the road to large-scale grid integration”, 2012.
The percentage indicates the share of electricity demand.
Figure 14 - Cumulative capacity forecast compared to EPIA’s new 2030 scenarios
EPIA • GLOBAL MARKET OUTLOOK FOR PHOTOVOLTAICS 2014-2018 • 353. MARKET EVOLUTION
6. Support schemes in Europe and prospects for PV
This table provides an overview of the support framework status in the most relevant European markets
in early 2014.
General political Political support environment
support situation
Austria Clear FIT evolution in 2014. Self-consumption possible. Administrative barriers could limit market growth.
Belgium Reduced support to PV for all segments. Streamlined administrative processes. Grid tariff cancelled in Flanders but
could be reintroduced. In Wallonia, new scheme could recreate some confidence.
Bulgaria Very unstable environment. Retroactive grid fees revoked and re-established. Incentives for residential and commercial
projects available but administrative procedure complicated and slow.
Croatia Clear FIT evolution in 2014. Introduction of self-consumption in 2014. Very low cap.
Czech Republic Reduced tax but environment still hostile to rapid PV deployment. FiT no longer available for PV systems. New legislation
foreseen but no details published.
Denmark Net-metering transformed into quasi- self-consumption. New FiT scheme expected.
France Clear FiT evolution in 2014. Slow administrative process still in place. FiT bonus for local content no longer available.
Political willingness to increase the market up to 1 GW.
Germany Clear FIT evolution in 2014, but really low return on investment. Simple and lean administrative process. Risk of grid
tariff imposition that could harm the evolution towards self-consumption.
Greece Clear FIT evolution in 2014. Adverse financial environment limiting development of new projects. Residential PV favoured
over large-scale PV plants. Possibility of net-metering. Risk of retroactive changes and delays for FIT payments.
Italy No FiT available but some direct incentives. Possibility of large-scale PV development due to new support schemes
introduced in 2013. Risk of retroactive changes. Complex legislation not always easy to implement.
Netherlands Net-metering and high electricity prices allowing for a residential market to develop rapidly together with an investment grant.
Poland New FiT and green certificate scheme under discussion for over two years, no adoption foreseen before beginning 2015.
Could lead to lack of investor confidence.
Portugal Drastic changes in the FIT schemes affecting small-scale PV development. Large-scale development still slow due to
administrative barriers.
Romania Drastic reduction of the number of green certificates limiting the market growth.
Slovakia Very low FIT and heavy administrative barriers. Slow administrative process still in place. Very low cap for 2014 (30 kWp).
Spain Support to PV frozen since 2012 and any new development blocked for several reasons (overcapacity, tariff deficit, etc.).
Heavy and slow administrative processes. Many attempts to revitalise the utility-scale segment without incentives, but
no significant development so far. Risk of grid tariff imposition.
Switzerland Clear FIT evolution in 2014 for large systems. Self-consumption now allowed for residential sector. Long waiting list
progressively being cleared.
Turkey Net-metering scheme for systems up to 500 kW. Administrative process unclear.
United Kingdom Clear FIT evolution in 2014. Support scheme regularly adapted. Clear and lean administrative processes. Uncertainty
for large scale PV development.
Table 2 - Support schemes in Europe and prospects for PV
36 • EPIA • GLOBAL MARKET OUTLOOK FOR PHOTOVOLTAICS 2014-2018You can also read