Trading Favors? UN Security Council Membership and Regional Favoritism in Aid Receiving Countries
←
→
Page content transcription
If your browser does not render page correctly, please read the page content below
Trading Favors?
                     UN Security Council Membership and
                 Regional Favoritism in Aid Receiving Countries∗
                                  †‡
 Maria Perotta Berlin                      Raj M. Desai§¶k                  Anders Olofsgård†∗∗
      SITE/SSE                          Georgetown University                  SITE/SSE
                                           February, 2020

                                               Abstract
         We test the hypothesis that aid recipient governments are given greater discretion
         in distributing aid geographically for personal benefits during periods when they
         are non-permanent members of the United Nations Security Council (UNSC). More
         specifically, we analyze whether World Bank projects are targeted to regions in which
         the head of state was born or regions with a large fraction of co-ethnics of the leader.
         We find that all regions on average receive more aid projects during UNSC years,
         confirming previous results. We find less evidence for beneficial treatment of leaders’
         birth regions, in particular when focusing on variation within regions over time. We
         find no evidence of preferential treatment of co-ethnic regions in this respect, if any-
         thing the opposite, in particular in democracies and countries outside of Africa. Most
         importantly, we find no consistent differential impact of birth region or co-ethnicity
         during the years of UNSC membership, with the possible exception of co-ethnicity in
         non-African countries. World Bank aid thus seems to be affected by UNSC member-
         ship primarily in terms of number of projects rather than in terms of discretion over
         the regional allocation.

   ∗
     Preliminary draft prepared for the PEIO 2020 conference. The statements made herein are solely the
responsibility of the authors, and all errors and omissions are the authors’ own.
   †
    Stockholm Institute of Transition Economics (SITE) and Stockholm School of Economics, Sveavägen
65, SE-113 83 Stockholm, Sweden.
   ‡
       maria.perrotta@hhs.se
   §
  Walsh School of Foreign Service and Department of Government, Georgetown University, 3700 O St.,
NW, Washington, DC 20057, USA.
  ¶
       The Brookings Institution, 1775 Massachusetts Ave., NW, Washington, DC 20036, USA.
   k
       raj.desai@georgetown.edu
  ∗∗
       anders.olofsgard@hhs.se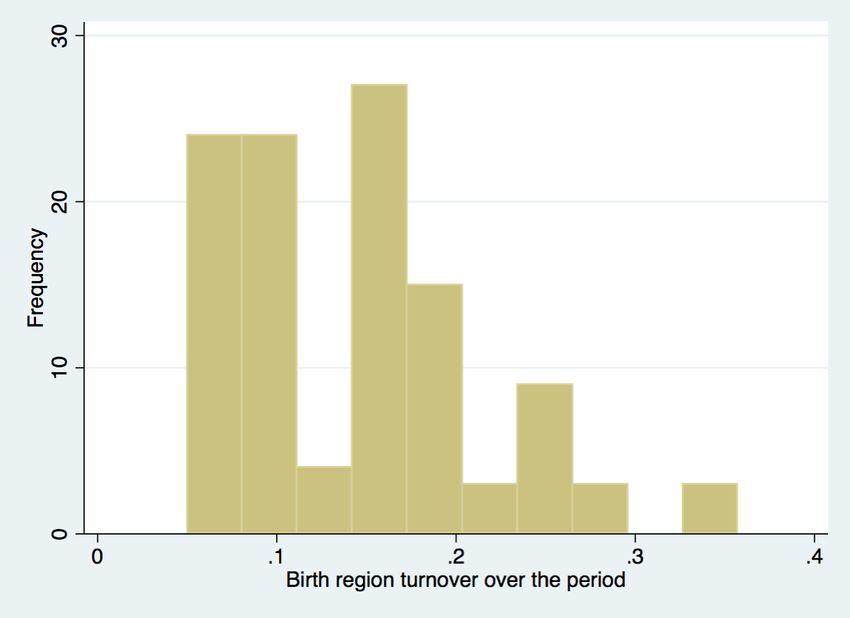
1     Introduction

        Two stylized facts regarding the politics of aid are, by now, well-known. First, aid

from certain donor governments tends to be strategic, namely, it conforms to commercial,

political, historical, and cultural affinities between donors and recipients. This strategic

use of foreign aid for political purposes has been most widely documented for bilateral aid

rather than multilateral aid (e.g., Alesina and Dollar, 2000; Maizels and Nissanke, 1984).

Yet, even where aid is channeled through multilateral organizations, donors can determine

allocation—by threatening to withhold contributions or by forming intra-organizational

coalitions (Mavrotas and Villanger, 2006; Schneider and Tobin, 2013). Second, aid recipi-

ents are also politically motivated. Recent evidence indicates that foreign aid allocation is

affected by recipients’ electoral cycles, and that recipient governments use disbursed funds

to increase their chances of reelection (Faye and Niehaus, 2012; Jablonski, 2014). Others

find that, more generally, leaders benefit through their ability to target assistance to (and

withhold funds from) particular regions (e.g., Dreher et al., 2019; Bommer et al., 2018;

Öhler and Nunnenkamp, 2014; Francken et al., 2012; Briggs, 2014).1

        If these statements are correct, they suggest a relatively unexplored interaction

between aid demand and supply, and a type of “two-level” game whereby aid-receiving

governments simultaneously negotiate with bilateral and multilateral partners for specific

types of commitments, while at the same time bargaining with domestic groups to determine

the sub-national geographic distribution of disbursed aid.

1
 This is by no means limited to aid from traditional donors. Chinese aid, in particular, appears susceptible
to political “capture” by recipient-country leaders (Dreher et al., 2019).

                                                     1
In this paper we revisit the evidence of strategic aid allocation at these two levels,
and suggest a new hypothesis stating that, at times of particular strategic importance,
aid receiving governments are more likely to allocate projects sub-nationally in a way that
maximizes personal benefits. The hypothesis rests on the logic that, as donors can gain
loyalty through generous aid giving, benefits to the recipient government depend not only
on the amount received but also on the discretion they are granted with regards to where to
spend the resources. This general argument is in line with that of Dreher et al. (2009a) who
find that, when countries are temporary members of the United Nations Security Council
(UNSC), not only they are more likely to participate in IMF programs, but these programs
also come with a smaller number of conditions, i.e. fewer strings attached. Similarly,
Dreher et al. (2009b) find that the internal quality thresholds for World Bank projects in
countries serving on the UNSC are lower than for other countries.
To capture the geographic allocation of aid spending within receiving countries we
rely on geo-coded data on aid project placements. These data are still limited, and due
to such limitations we are restricted to focus on aid allocation from one donor only, the
World Bank. It should thus be stressed that these results do not in any way represent the
universe of foreign aid, and that the literature suggests that donors differ substantially in
terms of the role of political or strategic motives in their aid policies. As discussed more
in the coming section, multilateral donors such as the World Bank are in fact generally
considered to be less likely to be affected by such considerations.
To identify strategic importance, we take advantage of the rotation of temporary
members of the United Nations Security Council (UNSC). Membership in the UNSC offers
a unique opportunity for less powerful countries to play a part in global geopolitics, and
2coalition formation is essential for the supreme powers to get support for their foreign policy
priorities (Vreeland and Dreher, 2014). A previous literature has found that membership is
associated with more foreign aid from both bilateral and multilateral donors (e.g. Kuziemko
and Werker, 2006; Dreher et al., 2009a). Of particular relevance for this paper, Dreher
et al. (2009b) find that UNSC temporary membership leads to an increase in the number
of committed World Bank projects at the country level.
To identify personal benefits of aid receiving governments, we rely on two different
measures capturing potential favoritism in the geographical allocation of aid projects. The
first such indicator is sub-national aid allocation in favor of the political leader’s home
region. Such home region bias in aid placement has previously been found in for instance
Öhler and Nunnenkamp (2014) and Dreher et al. (2019). The other indicator is targeting
of regions with many co-ethnics of the political leader. A couple of papers focusing on
Kenya have found evidence of such favoritism in terms of aid project placements (Briggs,
2014; Jablonski, 2014).
In order to test our main hypothesis, we bring together these two literatures and
analyze whether regional favoritism becomes particularly salient during years when an aid
receiving country is a non-permanent member of the UNSC. Ours is the first paper to
test whether this regional bias becomes stronger when the loyalty of the aid receiving
government has particular significance. This matters as it has been shown that when
aid is distorted for political reasons, the overall contribution to poverty alleviation and
inclusive economic growth falls. First, the allocation of aid matters for aid effectiveness,
both across countries and across regions within countries (e.g., Burnside and Dollar, 2000;
Alesina and Dollar, 2000; Dreher et al., 2018). Not only needs but also the institutional
3capacity to channel aid effectively differs, so misallocation of aid can substantially reduce its
effectiveness. Secondly, as pointed out by Dreher et al. (2018), since donors with strategic
motives care less about how aid is used, conditionality weakens. With weaker conditionality,
the risks of misallocation and inefficiency within the recipient grow, and selection of partner
countries based on aid effectiveness becomes less relevant. Consistent with this argument
they find that the effect of aid on growth is significantly lower during time periods in which
a country is a member of the UNSC. The analysis in this paper gives us an opportunity
to test if part of the explanation behind this finding is that weaker conditionality leads to
more biased allocation within the aid receiving country.
Through this analysis, we aim to make three principal contributions. First, we
offer an update on previous findings in the literature on the impact of UNSC member-
ship on the number of aid projects with a more recent and larger data set. Second, from
a methodological perspective, our hypothesis is the first to combine the insights from a,
mainly, cross-national literature focusing on political motivations of donors, with analyses
of political motivations by recipients in terms of sub-national aid allocation. This gives us
the opportunity to test whether recipient country governments are granted more leeway in
their allocation of aid projects in times when the loyalties of these governments are partic-
ularly important for major donors. Third, the literature correlating sub-national aid flows
with the connectedness of particular regions has been struggling with cleanly identifying
this as favoritism, given that it is difficult to control for all confounding variables related
to sub-national need, aid transaction costs, and absorptive capacity that may motivate
aid allocation to certain regions. The most relevant of these variables would primarily
vary across regions rather than within regions over time, though, and there is no reason
4to believe that within-region variation in such factors should co-vary systematically with
UNSC membership. Exploiting this time series variation thus helps with identifying the
existence of favoritism more cleanly. In other words, showing that the leaders’ birthplaces
receive more aid is still compatible with the explanation that these places need more aid, or
have larger potential to benefit from it. But if certain regions systematically receive even
more aid in years of UNSC membership, then a benevolent interpretation becomes more
far fetched.
Consistent with the literature at the country level, we find that the typical sub-
national region in an aid recipient country is more likely to receive a World Bank project
during years in which the country is a UNSC member. This is true for the complete time
period, and the pattern in the more recent time period is not different, suggesting that the
results of Dreher et al. (2009b) hold up also today. This is true also in both democracies
and autocracies, and using country or regional fixed effects. Looking at dollar commitments
rather than the number of projects, there is no significant difference in the full sample, but
there is a rather large and statistically strong effect of UNSC membership in the sub-sample
of African countries. Data on commitments need to be interpreted with some care, though,
as they are measured with more noise.
Using country fixed effects as in the previous literature we at first find that the
birth regions of leaders on average get more projects in our full sample. This result is
less robust, though, and holds only in autocracies and not in the sub-sample of African
countries. Furthermore, using regional fixed effects the coefficient becomes insignificant
and even changes sign. This is not due to lack of variation in the data, there is a fair
amount of leader turnover within countries over time. The fact that the results weaken so
5clearly when focusing on the time variation within regions casts some further doubt on the
interpretation in Öhler and Nunnenkamp (2014) that World Bank projects to the leader’s
birth region reflect personal favoritism. On the other hand it is in line with Dreher et al.
(2019) who find no bias towards the leader’s birth region for World Bank projects (though
they do find evidence of that for Chinese aid) and attribute this to a relatively stringent
set of project appraisal procedures that reduces the risk of political capture.
Looking at co-ethnicity, results point even more strongly in the opposite direction.
There is no evidence suggesting that aid projects are more likely to go to regions with
more co-ethnics in any group of countries, and in particular in democracies and outside of
Africa the results rather suggest the opposite. It is possible that co-ethnic regions benefit
from preferential treatment from governments in other ways, as suggested in e.g. Burgess
et al. (2015), Frank and Rainer (2012) and Kramon and Posner (2016), and that World
Bank projects are targeted to other regions to partly compensate for that. Also looking at
commitments, less money is going to co-ethnic regions and this is primarily driven by the
sub-sample of non-African countries.
Turning to our main hypotheses, we find very little evidence suggesting a differential
regional allocation of World Bank projects to either birth regions of the leader or co-ethnic
regions in years of UNSC membership. Using the most robust specification with regional
fixed effects, we find for the sub-sample of non-African countries that co-ethnic regions get
significantly more projects during UNSC membership years than what these same regions
receive in other years. As these regions are significantly less likely to receive World Bank
projects in non-membership years, though, the positive effect only makes up (partly) for
6that deficit. For all other specifications, interactions are insignificant, and in particular for
birth regions estimated coefficients are small.
The paper is organized as follows. In Section 2 we discuss shortly the literature on
strategic aid from both donors’ and recipients’ perspective. In Section 3 we present the
data and the empirical specification, and our results are presented and discussed in Section
4. We conclude in Section 5.
2 The Politics of Foreign Aid
There exists by now a very large literature in the social sciences on official develop-
ment aid. This literature can largely be divided into one branch focusing on the impact and
effectiveness of foreign aid, and another branch on its allocation and the underlying moti-
vations. This paper is positioned within the second branch, and more specifically focuses
on the quantitative analysis of how political and strategic interests affect the decisions on
where to allocate aid. To structure this further, we review first the literature on political
motivation from the donors’ side, including a closer look at contributions analyzing aid
and UNSC membership. We then turn to political motivation on the recipients’ side and
the literature using within-country variation in aid project placement. As the allocation of
aid also can affect its impact, we also briefly touch on a small number of papers making a
connection between political considerations and the effectiveness of foreign aid.
72.1 Donors’ Perspective
The empirical analysis of the underlying motives behind aid allocation has primar-
ily focused on the traditional bilateral donors, i.e., members of the OECD Development
Assistance Committee (DAC). Official Development Assistance (ODA) or Country Pro-
grammable Aid (CPA) are typically used to measure development aid. ODA is by defini-
tion designed to promote the economic development and welfare of developing countries.
Yet, there is ample evidence that bilateral aid also serves as a broader foreign policy in-
strument to further the strategic and commercial interests of donors, although the relative
importance of such interests varies across donors and over time.
The main line of research exploits cross-country variation among aid recipients in
areas such as income and poverty, economic and political institutions and policies (as
proxies of capacity to put aid to good use), commercial interests (primarily bilateral trade
and investment flows) and different proxies for political and strategic importance (e.g.
Dudley and Montmarquette, 1976; Alesina and Dollar, 2000). The underlying logic is
that if donors only care about the welfare of the partner country, then only measures of
need and institutional capacity should matter for aid allocation.2 Empirical results reveal,
however, that commercial and political interests affect cross-national aid allocation as much
as country need and institutional quality for many major bilateral donors (e.g. Alesina
and Dollar, 2000; Frot et al., 2014; Maizels and Nissanke, 1984).3 Beyond allocation, the
2
A related literature has suggested that the impact of aid on economic growth is conditional on the quality
of macroeconomic policies and the strength of political institutions (Burnside and Dollar, 2000; Svensson,
1999). The robustness of these results has been questioned, though (e.g., Easterly et al., 2004).
3
To capture political importance, a variety of indicators have been used. Former colonial status and regional
connections have been shown to carry strong weight for some donors such as France, United Kingdom,
Portugal, Belgium, Japan and the United States (e.g., Dudley and Montmarquette, 1976; Alesina and
Dollar, 2000). Other papers have used the value of arms transfers as a proxy for donors political and
8literature has also identified time periods in which global strategic alliances in general,
or particular partner countries, have become more politically salient. The substantial
reduction in aggregate ODA in the 1990s, for example, has been attributed to the end
of the Cold War (Boschini and Olofsgård, 2007), while the Global War on Terror led to
a tripling in US foreign aid along with a reduced emphasis on recipient need (Fleck and
Kilby, 2010).
For bilateral aid, donor-country political interests can be clearly delineated through
direct influence over aid appropriations. This is much less obvious in multilateral insti-
tutions such as the World Bank where governments with different political agendas claim
ownership and where decisions over aid allocation is the outcome of (explicit or implicit)
bargaining (Dreher et al., 2018). Numerous papers argue that donor-country political in-
terests are less consequential for multilateral aid (e.g., Maizels and Nissanke, 1984; Milner
and Tingley, 2013). Channeling aid through multilateral institutions can even be seen as
a commitment device to avoid idiosyncratic individual donor preferences and improve aid
effectiveness (Dreher et al., 2018).
Yet, national interests can influence multilateral aid in indirect ways. In addition to
influencing conditionality, strategically-minded donors may have other tools by which they
can affect multilateral aid flows to particular recipients. Mavrotas and Villanger (2006)
show how smaller donors with different foreign policy goals from more influential donors,
may reduce their aid contributions to multilateral organizations when faced with strategic
security interest (Maizels and Nissanke, 1984; Hess, 1989; Schraeder et al., 1998), while Alesina and Dollar
(2000) use voting patterns in the general assembly of the United Nations. Finally, Frot et al. (2014) use
nuclear status and distance to western Europe for the special case of aid to Eastern Europe and the former
Soviet Union in the transition period 1990-2010.
9behavior. Schneider and Tobin (2013) argue that coalition-building takes place within the
governing boards in order to bias multilateral agency policies towards desired countries,
policies, or programs.
Additionally, several papers have noted that UNSC membership increases multi-
lateral assistance to member countries. Kuziemko and Werker (2006) find that UN aid
increased by 8 percent when a country became a temporary member on the council. This
effect seemed driven by UNICEF, an organization largely controlled by the United States.4
They also found that the effect increased during years when particularly important diplo-
matic events took place, which they interpret as suggesting a vote buying mechanism rather
than just an effect of increased access to major powers.5 Dreher et al. (2009a) find a ro-
bust positive correlation between temporary UNSC membership and participation in IMF
programs. Interestingly they also find that programs come with a smaller number of con-
ditions, i.e. fewer strings attached. This suggests that beyond amounts of aid, loyalty can
also be influenced by the conditions under which aid is given. The authors allude to the
power of the United States, and provide the example of UNSC support for military action
against Iraq.6
4
This result is also consistent with their second main result, that bilateral US aid increases with as much
as 59 percent in response to UNSC temporary membership.
5
Note that an alternative to vote buying would be punishment in the form of withholding aid from a disloyal
temporary member, as apparently happened to Yemen in 1991 when they refused to endorse the council’s
authorization of use of force against Iraq (Kuziemko and Werker, 2006). In this case UNSC membership
could be correlated with less foreign aid, not more.
6
As Dreher, Sturm and Vreeland note: “During its time as a Security Council member, Zimbabwe voted on
several resolutions regarding Iraq that the United States cared a great deal about, including some resolutions
that did not receive support from other developing countries. When Zimbabwe failed to support just one
resolution against Iraq, however, the country was threatened by the IMF with new policy conditions to
receive continued installments of the loan (Pilger, 2002). Zimbabwe subsequently supported 11 Security
Council resolutions against Iraq. The United States apparently used its influence at the IMF to change
voting at the Security Council” (2009b, p. 742).
10Of particular relevance for this paper, political influence has also been documented
in World Bank lending. Andersen et al. (2006) study credits provided by the concessional
window of the World Bank, the International Development Association (IDA), during 1993-
2000. Their key political variable is the similarity in voting patterns between the partner
country and the United States in the United Nations General Assembly, on what the State
Department defines as key votes. Using panel data, accounting for sample selection bias
and controlling for a host of confounding variables they find a positive and significant
impact of UN voting similarity. Dreher et al. (2009b) use temporary membership on the
UNSC to indicate strategic importance, and analyze what it means for World Bank aid
disbursements. They find that membership leads to an increase in the number of committed
World Bank projects. On the other hand, they find no significant impact on the size of
World Bank loans. As mentioned in the Introduction, there is also evidence of lower quality
thresholds for World Bank projects in countries serving on the UNSC.7
In this context, it is interesting to think about the newer bilateral donors that have
scaled up operations in recent years. The Chinese, for example, have been known to abide
by a non-interference rule, providing what amounts to conditionality-free, but openly and
explicitly tied, aid—tied, in particular, to resource use contracts. Unfortunately, there is
virtually no overlap between Chinese aid disbursement and UNSC temporary membership.8
7
For more details on the work of the UNSC and the trade of aid for political support please see Vreeland
and Dreher (2014).
8
Only 14 countries among those who have at some point been UNSC members received some Chinese aid
during our observation period, however the years coincide in only one case, Vietnam 2009. In the cases of
Gabon and Pakistan, Chinese aid stopped the year the country joined the UNSC. All other cases are much
earlier membership tenures, before we have documentation on Chinese foreign aid.
11Therefore we cannot in a meaningful way analyze Chinese aid quantitatively in this context
at this time.
2.2 Recipients’ Perspectives
A recent literature has documented how domestic motivations of recipient govern-
ments influence the distribution of aid within a country. This literature uses new geo-
referenced information on aid project placement, hosted by the research lab AidData. This
literature has primarily focused on two indicators of political bias: the political leaders’
birth region and ethnic affiliation.
Öhler and Nunnenkamp (2014) look at the distribution of aid projects from the
World Bank and the African Development Bank (ADB) in 27 countries, focusing on sub-
national variation. There appears to be strong evidence of bias in ADB aid, in this case
the number of projects located in the leaders’ birth regions tends to be greater than those
located in other regions. For World Bank projects, they also find a significant difference
when they look at the full sample, but not when limiting themselves to African countries.
Dreher et al. (2019), looking at Chinese and World Bank aid in Africa, find that leaders’
birth regions receive larger amounts of Chinese aid, but no significantly different disburse-
ments from the World Bank. Finally, Bommer et al. (2018) look at humanitarian aid from
the Office of US Foreign Disaster Assistance (OFDA) in response to natural disasters. They
find that larger amounts of aid are distributed when natural disasters affect the birth region
of the countries’ leaders.
12A second indicator relates to regional populations’ co-ethnicity with the leader,
on the assumption that if the provision of public goods and services to fellow co-ethnics
was an important tool in political campaigning (e.g. Wantchekon, 2003), the allocation of
aid projects should be influenced by the distribution of ethnic groups across sub-national
regions. Studying Kenya in the first half of the 1990s, Briggs (2014) finds that project
aid (and local funds) were disproportionately directed to the Rift Valley and the Western
province, the homeland of president Moi’s ethnic base.9 This holds true for bilateral aid
and aid from the African Development Bank, but less so for the World Bank/IDA. Also
focusing on Kenya but over the time period 1992 to 2010, Jablonski (2014) finds that the
allocation of both World Bank and ADB projects has favored co-partisan and co-ethnic
voters consistently. Finally, Dreher et al. (2019) find similar, but less robust, results for
co-ethnicity as they observe with regards to birth region for Chinese aid but not for World
Bank aid.
Looking beyond aid to public policy more generally, the evidence for the co-ethnicity
factor is though more mixed. For example, Moser (2008) divides the ethnic groups of Mada-
gascar into swing, supporting or opposing, with respect to the two presidential candidates
in the 2001 elections, and examines the district allocation of public projects. He finds some
evidence of both swing voter targeting, in accordance with public choice theory, and ethnic
patronage, depending on the type of projects. Kasara (2007) shows that African leaders
tax their co-ethnics more heavily. This result is also interpreted in the spirit of swing-voter
9
Burgess et al. (2015) show evidence of ethnic favoritism in public investments in roads in Kenya over a
longer time period, in particular in times of weaker democratic checks and balances. It is interesting to
note that Briggs (2014) covers the late period of what Burgess et al. (2015) define as Moi’s autocratic
phase and the early period of what they define as his democratic phase. Later in the democratic phase
road construction is less biased by ethnic favoritism, so its possible to speculate that this may also have
been the case for aid investments.
13targeting: the politician does not need to favor core supporters who would vote for her
anyway, and can even extract surplus from them via taxation to instead benefit groups
that would not support her without a quid pro quo.
3 Data and Methods
Our data consist of 134 aid-recipient countries that have received official develop-
ment assistance at some point since 1995 across Africa, Asia, Latin America, and Eastern
Europe. Within these 134 countries we observe 2,043 sub-national provinces, states, gov-
ernorates, and other sub-national administrative units.
3.1 Geo-Referenced Aid Projects
Our foreign aid data contains information on the location of aid projects as well
as the total amount committed and disbursed in US dollars to these projects. Project
longitude and latitude were obtained from the AidData project at the College of William
and Mary. Specifically, we use the data set on the distribution of World Bank aid, version
1.4.2 covering the years 1995-2014, as this is the only donor for which there is a sufficiently
complete dataset on project placement to make our analysis meaningful (AidData, 2017).10
We use the information on project location to aggregate the data to the administrative
level 1 (ADM1).
10
We also collected data on the spatial distribution of Chinese aid from Bluhm et al. (2018). This Chinese
data, version 1.1.1., details the location of Chinese government-financed development aid projects between
2000 - 2014. The number of projects listed here is far smaller than that of World Bank projects, and in
particular the number of Chinese aid projects going to temporary members of the UNSC was too small for
any meaningful analysis.
14A complicating factor is that some projects span across more than one sub-national
unit, and we have no information on how the resources within a project are allocated across
these regions. When analyzing total committed spending, the best we can do is to average
the total sum across each region involved, but this introduces some noise in our data.
3.2 UN Security Council Membership
Information on each country’s UN Security Council membership is provided by
Dreher et al. (2009b). That data simply indicates whether a country is a temporary,
non-veto holding member of the UN Security Council in a given year. The data set is
continuously updated and contains information for the years 1951-2019.
3.3 Heads of State
The Archigos data (Goemans et al., 2009) has information on the head of state of
each country. The latest version 4.1. contains information on the effective leader (i.e. the
person actually exercising power) at each point in time for 188 countries between 1888 to
2015. From these data we obtain the names of the relevant leaders and the period during
which they were in power. These data were then combined with additional information on
the leaders of each country from a variety of sources. From Dreher et al. (2015) we extracted
information on the ethnicity and birth place of 117 African leaders that ruled between 2000
and 2012. Additionally, we have information on a variety of leaders around the world
that has been collected by Fearon, Kasara, and Laitin (2007). For all remaining leaders
we compiled information on ethnicity, birth place, and party membership from a number
15of other sources that provide leaders’ biographies, including Encyclopedia Britannica and
Wikipedia. Wherever the credibility of such information was unclear, we conducted an
additional Google search to confirm the information through additional sources such as
newspaper articles, government reports and academic papers.
3.4 Sub-National Ethnicity
We have also collected information on each region’s relationship to the country’s
leader based on ethnic composition.11 The information on the geographic distribution of
ethnic groups across countries was collected in three steps from three different sources.
First, we collected survey information from the Demographic and Health Surveys (DHS)
(2004-2017). The DHS provide over 300 surveys for 90 countries. Second, we aggregated
administrative data provided by the countries themselves that can be found on the web site
of the Integrated Public Use Microdata Series (IPUMS). IPUMS data consist of a repre-
sentative sample of the census that we aggregate to determine each ethnicity’s population
share by region. The collection spans 443 censuses and survey data sets from 98 countries.
Third, we match the information provided by the Geographic Referencing of Ethnic Groups
project of the ETH Zurich with the administrative boundaries of our countries (Weidmann
et al., 2010).
11
We are also collecting data on election results to analyze whether leaders prioritize swing regions or
regions where they have strong bases of electoral support beyond ethnicity. We use the Constituency-Level
Election Archive (CLEA) that has been collected by a group of researchers from the University of Michigan
(Kollman et al., 2019). The CLEA data set contains lower-chamber election results from approximately
1900 elections in 168 countries. These data are provided on a constituency level, so we plan to aggregate
them to match the ADM1 level of our aid data.
16Thereby we manage to create three different indicators of the geographic distribution
of ethnic groups in our countries of interest. Based on these data we create two variables; a
dummy variable for region-years where the dominant group belongs to the same ethnicity
as the political incumbent (Co-ethnic region), and a continuous measure of the share of the
regional population that belongs to the same ethnicity as the political leader (Co-ethnic
share). Through this process we have regional coverage of 40 countries, 21 of which are in
Africa.
3.5 Regime Type
Finally, to differentiate between the impact in democracies versus autocracies, we
collected data on the strength of democracy from the Polity data set (Polity IV Project,
2019). The data set has information on 167 countries and covers the years 1800 to 2017.
We define democracies by a Polity index higher than 6, which is the median value in our
sample.
3.6 Empirical Specification
To explore our question, we rely on two sets of empirical models. For the first set,
targeting primarily what we refer to as linear effects, the regression equations are specified
as follows:
Aijt = βU N SCit + γt + δi + [ξij ] + ijt (1)
Aijt = β 0 ConnectRegijt + γt0 + δi0 + [ξij0 ] + 0ijt (2)
17The dependent variable Aijt captures either i) the number of World Bank projects
started in region j of country i in year t; or ii) the USD commitments to projects imple-
mented in region j of country i in year t. U N SCit is an indicator for country i being a
temporary member of the UNSC in year t; ConnectRegijt is an indicator for region j of
country i being connected to the country’s ruler, and more specifically: (a) a dummy for
the ruler’s birth place; (b) a dummy for regions where majority of the population are the
leader’s co-ethnics; or (c) the continuous share of a region’s population which is co-ethnic
to the leader. Standard errors are cluster-robust at the country level.
Dreher et al. (2009b) show that country characteristics that predict World Bank
projects are generally not correlated with predictors of temporary UNSC membership.
Nevertheless, all regressions include country (δ) and year (γ) fixed effects to account for time
invariant country specific variables that may matter for the likelihood of receiving World
Bank projects as well as yearly variation in total accessible resources for project spending or
needs. More generally, as discussed in for instance (Kuziemko and Werker, 2006), a threat
to identification of a causal impact of UNSC membership is if temporary membership is
caused by for instance an increased recognition of a country’s international influence (which
may also feed into more aid). Similarly, if membership leads to an increased awareness of
country needs, membership may cause more aid flows without this reflecting the notion of
trading favors. In both cases the increase in aid should not be a temporary effect, though,
associated with only the two years of membership. We therefore also conduct a placebo
test where we create rolling two year indicators for all time intervals in our data set to
contrast the time period of UNSC membership to all other possible two year combinations,
including the years following membership.
18Regional-level shocks due to, inter alia, deaths from conflict, natural disasters, or
climatic shocks may also correlate with the allocation of aid disbursements within countries,
including World Bank projects. To deal with this we also include regional fixed effects in our
more rigorous specifications, i.e. we rely on variation within regions over time in our data.12
An identifying assumption in the model, though, is that the timing and regional location
of these shocks are not systematically correlated to the timing of UNSC membership. We
think such a correlation is highly unlikely, so we do not include additional controls in our
specifications.
In the second set of models we investigate interaction effects between regional con-
nectedness and membership in the UNSC. We estimate:
Aijt = αU N SCit + µConnectRegijt + νU N SC ∗ ConnectRegijt + γt000 + δi000 + [ξij000 ] + υijt (3)
This model captures the main new hypothesis of the paper, that the regional allocation of
World Bank projects look differently in years of temporary UNSC membership relative to
other years.
For both sets of models, we also investigate a few potential heterogenous patterns,
partly based on findings in the previous literature. On the assumption that democratic
leaders are less likely to hold large amounts of discretionary authority, given the presence
of other veto-holders (legislatures, courts, regulatory agencies, sub-national governments,
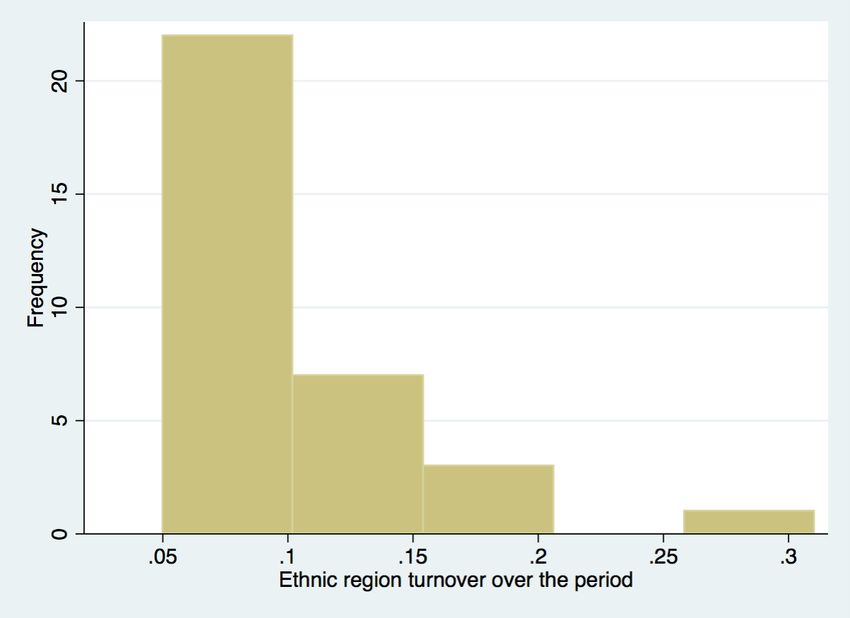
12
As we show in Figures 2 and 3 in the Appendix, due to leader turnover most countries change the birth
region of their leader between once in every 7 or once in every 4 years, while the ethnicity of the leader
changes less than once in every 10 years. This implies that the co-ethnic region indicator changes at
least once in most countries over our twenty years period, and the birth region indicator more than that.
Therefore, there is enough variation in our ConnectRegijt indicators to include region fixed effects.
19etc.), the patronage motive for sub-national distribution of aid resources should be stronger
in autocracies compared to democracies. If so, in the context of democracies we would
presumably observe to a lower extent allocations of aid that reward the head of state.
Furthermore, some studies have identified unique patterns of aid allocation in African
countries compared to other countries. Öhler and Nunnenkamp (2014) do for instance only
find a significant impact of leaders’ birth region in their full sample, not when restricting
attention to African countries, and Dreher et al. (2019) find no impact of birth region on
World Bank projects (although they do for Chinese aid projects) in their sample of African
countries. Based on these premises, we look separately at the subsets of democracies as
compared to autocracies, and at African countries as compared to the rest of the sample.
As appropriate to the nature of our dependent variables, and also standard in the lit-
erature, we estimate Poisson models with Pseudo Maximum Likelihood methods (PPML).
It is also relatively standard to present Negative Binomial together with Poisson models
in order to relax the assumption on variation imposed by the latter (sometimes referred
to as the issue of overdispersion). However, the Negative Binomial model has been shown
not to be the best option in a fixed-effects panel setting13 , and it is valid only under more
restrictive distributional assumptions. In contrast, the Fixed Effects Poisson estimator has
been shown to be valid under very general conditions, and consistent beyond the case of
count-type models, including binary, nonnegative continuous or discrete response variables
(Wooldridge, 1999). This is therefore our preferred specification as it also makes it possible
to use the same model for both the number of projects and total disbursements.
13
Allison and Waterman (2002); Guimaraes (2008); Greene et al. (2007)
204 Results
Before a more rigorous empirical analysis, some basic unconditional differences in
our key outcome variables can provide some preliminary insights. Between 1995 and 2014,
55 of the 134 countries in our sample sat as temporary members of the UNSC. Only 12
countries were on the security council twice or more during that time, with an average
tenure of 2.5 years and maximum of 8. The mean number of World Bank projects to these
countries during their tenure is 10.3 but the median is 0. Below in Table 1 we provide
some basic unconditional differences across groups of observations when it comes to World
Bank projects. Note that in these raw unconditional differences, countries and regions get
significantly more aid projects during the years of temporary UNSC membership. Birth
regions on average also get more aid projects than non-birth regions, but the difference
is very small. There is a more substantial difference between co-ethnic regions and non
co-ethnic regions on average, but it goes in favor of non co-ethnic regions. Finally, birth
regions and co-ethnic regions receive more aid projects during years of UNSC membership
than in other years, but this is even more so for other regions.
Starting with a focus on the number of World Bank projects allocated to each re-
gion, Table 2 reports the linear effect of our variables of interest in terms of incidence rate
ratios (IRR) from PPML estimations. For each focus variable we present first results from
a specification with country fixed effects and then with regional fixed effects. Looking first
at Columns 1 and 2, the interpretation is as follows: during a UNSC year, the number of
projects to the average region increases by a factor of roughly 1.4, or by 40%. This increase
is larger in autocracies than democracies, and larger outside Africa than in African coun-
21Table 1: Average number of projects in different samples
Average number All countries UNSC members (at any time)
of projects and regions ——————————————
All years non-UNSC years UNSC years Diff.
Country/Year 4.2 6.4 5.8 10.3 4.50***
N 2,680 1,100 962 138
Region/Year 0.28 0.32 0.29 0.50 0.21***
N 40,080 21,560 18,993 2,807
Birth regions 0.29 0.30 0.28 0.42 0.13**
N 1,892 927 836 122
non Birth regions 0.28 0.32 0.29 0.51 0.21***
N 36,538 20,633 18,157 2,685
Diff. 0.01 -0.02 -0.01 -0.09
Coethnic regions 0.29 0.26 0.25 0.38 0.13***
N 4,278 2,663 2,373 335
non Coethnic regions 0.37 0.40 0.37 0.64 0.27***
N 5,576 4,409 3,801 628
Diff. -0.08*** -0.14*** -0.11*** -0.25***
Notes: The table reports the average number of World Bank financed aid projects implemented in our
sample of 134 countries over the period 1995-2014. The last column and last row report differences between
averages in the sub samples along with conventional significance levels (** p < 0.05; *** p < 0.01).
tries, although these differences are not statistically significant (Dif f P val in the table).
Results are also very similar irrespective of whether country or regional fixed effects are
used.
Given the central role of UNSC membership being considered exogenous for us to
argue any causal impact, and a transitory effect to argue a trade of favors, we subject our
UNSC estimate to a placebo test in Figure 1. We report the coefficient and 95% confidence
intervals from running the same regression but where the UNSC indicator switches on one
to five years prior, or following, actual UNSC country membership. The number of projects
to the average region is never affected significantly except in year 0, i.e. during the actual
UNSC membership years.
22Looking at birth regions of leaders, using country fixed effects (Column 3), results
suggest more projects on average, although this effect, smaller and close to 10%, seems
to be driven by autocracies and countries outside of Africa. Introducing regional fixed
effects (Column 4), though, not only leads to much less precise estimates, but estimated
coefficients also become smaller than one, suggesting a negative impact. Though generally
not statistically significant, these results shed some doubt on the results of Öhler and
Nunnenkamp (2014) and are more in line with the results in Dreher et al. (2019).
In columns 5-8 we turn to measures of co-ethnicity. Note that this reduces our sam-
ple substantially, by some 75 percent. We find that regions whose population is co-ethnic
with the ruler, both measured as a majority dummy and as a continuous share, receive
fewer projects on average. This is true in the full sample using both country and regional
fixed effects and in all sub-samples, though it’s particularly evident in democracies and
outside of Africa (though differences between sub-samples are again not statistically signif-
icant). Given previous evidence of public policies favoring co-ethnic regions as discussed in
Section 2, this may be somewhat surprising. It is possible that World Bank projects partly
deliberately make up for such bias by targeting regions neglected through other means.
The fact that these results are largely similar also when including regional fixed effects
would in that case suggest that political transitions, even when crossing ethnic lines, tend
to preserve political authority among relatively favored groups or regions.
In Table 3 we introduce the interaction term with our different measures of connected
regions in the full sample. The model specification includes regional fixed effects. Note
that estimates of the linear effects are very similar to those in Table 2, i.e. the addition of
the interaction effects makes basically no difference to the estimates of the linear effects.
23Table 2: Number of projects - linear effects
UNSC Birth Region Coethnic Region Coethnic Share
b/p b/p b/p b/p b/p b/p b/p b/p
Full Sample
1.398 1.404 1.109 0.894 0.812 0.745 0.699 0.653
0.000 0.000 0.024 0.127 0.014 0.000 0.001 0.000
Groups 128 1963 117 1895 40 540 38 516
N 40080 40080 38424 38415 9854 9609 9277 9073
Democracies
1.432 1.447 1.048 0.834 0.816 0.577 0.682 0.534
0.002 0.000 0.474 0.066 0.064 0.000 0.001 0.001
Groups 75 1161 65 1103 22 324 20 293
N 20110 19824 18849 18549 4544 4308 4150 3959
Autocracies
1.479 1.470 1.129 0.901 0.941 0.931 0.875 0.819
0.014 0.000 0.064 0.304 0.550 0.306 0.380 0.047
DiffP-val 0.148 0.148 0.259 0.259 0.423 0.423 0.509 0.509
Groups 78 1002 78 1002 26 313 26 302
N 17466 16289 17285 16108 5023 4828 4874 4679
Africa
1.345 1.347 1.054 0.845 0.879 0.922 0.780 0.890
0.114 0.000 0.460 0.153 0.221 0.461 0.052 0.635
Groups 47 572 46 562 21 227 21 233
N 11800 11800 11594 11594 4760 4760 4675 4670
OutsideAfrica
1.480 1.490 1.146 0.921 0.754 0.643 0.620 0.542
0.000 0.000 0.024 0.361 0.005 0.000 0.000 0.000
DiffP-val 0.290 0.290 0.344 0.344 0.200 0.200 0.152 0.152
Groups 81 1399 71 1341 19 313 17 283
N 28280 28280 26830 26821 5094 4849 4602 4403
Country FE Yes Yes Yes Yes
Region FE Yes Yes Yes Yes
The table reports Incidence Rate Ratios from FE Poisson regressions. The dependent variable is the
number of World Bank projects started in each region and year. All regressions include year fixed.
effects. Standard errors are cluster-robust at the country level. P-values under the coefficients.
DiffP-values refer to the differences between the two panels above.
24More importantly, looking at the last row of results, none of the interaction effects are
statistically significant. For co-ethnic share the estimated coefficient is quite large and close
to significant at the 10 percent level, but since the linear effects are small, this suggests
at best that maybe some compensation takes place towards regions with a larger share
of co-ethnics during UNSC years, but not enough to fully compensate for the bias in the
opposite direction in normal years.
Table 3: Number of projects - Interaction effects
(1) (2) (3)
Birth Region Coethnic Region Coethnic Share
b/p b/p b/p
UNSC 1.413 1.475 1.399
0.000 0.000 0.000
BirthRegion 0.910
0.183
CoethnicRegion 0.754
0.000
CoethnicShare 0.666
0.000
UNSCInteraction 0.880 1.064 1.293
0.471 0.558 0.113
Regions 1895 540 516
N 38415 9609 9073
The table reports Incidence Rate Ratios from FE Poisson regressions.
The dependent variable is the number of World Bank projects started
in each region and year. All regressions include region and year fixed effects.
Standard errors are cluster-robust at the country level.
p-values under the coefficients.
Table 4 reproduces Table 3 splitting the sample into sub-samples of democracies
versus autocracies, and Africa versus non-Africa. For one sub-sample, countries outside of
Africa, the interaction effect on both measures of co-ethnicity is positive and statistically
significant. The estimated linear coefficient is substantially less than one, so again this
25Table 4: Number of projects - Interactions heterogeneity
Birth Co-ethnic Co-ethnic Birth Co-ethnic Co-ethnic
Region Region Share Region Region Share
b/p b/p b/p b/p b/p b/p
Democracies Autocracies
UNSC 1.465 1.765 1.803 1.473 0.924 0.920
0.000 0.000 0.000 0.000 0.387 0.427
BirthRegion 0.850 0.903
0.092 0.334
CoethnicRegion 0.540 0.926
0.000 0.299
CoethnicShare 0.474 0.802
0.001 0.030
UNSCInteraction 0.877 1.202 1.429 0.976 1.006 1.176
0.569 0.325 0.234 0.916 0.968 0.509
DiffP-val 0.271 0.331 0.430
Regions 1103 324 293 1002 313 302
N 18549 4308 3959 16108 4828 4679
Africa Outside Africa
UNSC 1.346 0.957 0.861 1.508 1.694 1.592
0.000 0.623 0.179 0.000 0.000 0.000
BirthRegion 0.841 0.956
0.147 0.596
CoethnicRegion 0.976 0.653
0.838 0.000
CoethnicShare 0.940 0.556
0.799 0.000
UNSCInteraction 1.058 0.659 0.480 0.798 1.351 1.649
0.806 0.070 0.154 0.298 0.055 0.022
DiffP-val 0.168 0.191 0.318
F-testPval 0.000 0.000 0.000 0.000 0.000 0.000
Regions 562 227 233 1341 313 283
N 11594 4760 4670 26821 4849 4403
The table reports Incidence Rate Ratios from FE Poisson regressions. The dependent variable is the number
of World Bank projects started in each region and year. All regressions include region and year fixed effects.
Standard errors are cluster-robust at the country level. P-values under the coefficients.
P-values at the bottom of columns (4) to (6) refer to the differences from columns (1) to (3).
261
Number of projects
0
−1
−2
−5 −4 −3 −2 −1 0 1 2 3 4 5
Date relative joining UNSC
Figure 1: Impact of UNSC membership on number of projects, placebo
can at most suggest that beneficial treatment during UNSC years somewhat compensate
for a bias against co-ethnic regions in the placement of World Bank aid projects in normal
years. For other interaction terms, we find no consistent evidence in favor of any differential
treatment of connected regions during UNSC years.
We now turn to analyze the impact on aid commitments. Commitments are mea-
sured at the project level, where projects may span more than one region. We do not
observe the allocation of spending within the project across regions, but we make the as-
sumption that resources are evenly distributed across the regions involved. This for sure
introduces noise in our data, but we have no reason a priori to believe that resources are
unevenly allocated in any systematic way towards certain regions, so this is the best we
27can do. Still, these results need to be interpreted with more care. Our observations are
thus measuring by year and region the amounts disbursed to new projects in that region
averaged over all regions included in respective projects.
Results on commitments are presented in Tables 5 to 7 along a similar structure as
that when looking at the number of aid projects. Similarly to Dreher et al. (2009b) we find
in general much weaker impact from temporary UNSC membership on aid commitments
relative to the impact on the number of aid projects, the exception being the sub-sample of
African countries where the estimated impact is of a similar size to that for number of aid
projects. Dreher et al. (2018) argue that commitments adjust more slowly to strategic or
political preferences, and thus it is often easier to spread aid flows across a larger number
of smaller projects. Birth region initially enters positive and significant but once regional
fixed effects are introduced the coefficient turns negative, though insignificant. This again
questions the interpretation that potential bias in favor of leaders’ birth regions in the
cross-regional allocation of aid cleanly reflects political favoritism. A similar result holds
for co-ethnicity, in particular in the sub-set of democratic countries, where an initially
positive impact flips when regional effects are introduced. Finally, looking at interaction
effects we find a surprising negative interaction between the UNSC years dummy and birth
region of the leader, a result that seems to be driven by the non-African sub-sample. This
would suggest that, outside of Africa, aid commitments to birth regions are lower during
UNSC membership years than in other years.
To summarize, our analysis offers a nuanced perspective on the politics of aid alloca-
tion when analyzing World Bank aid projects: (i) we find that recipients receive more World
Bank projects (but not necessarily larger overall commitments) when they are temporary
28Table 5: Commitments - linear effects
(1) (2) (3) (4)
UNSC Birth Region Coethnic Region Coethnic Share
b/p b/p b/p b/p
Full Sample
0.924 1.515 1.480 1.158
0.542 0.001 0.167 0.523
Countries 128 117 40 38
N 40080 38424 9854 9277
Democracies
0.788 1.545 1.951 1.376
0.328 0.059 0.001 0.079
Countries 75 65 22 20
N 20110 18849 4544 4150
Autocracies
1.189 1.442 1.049 1.095
0.305 0.016 0.582 0.648
DiffP-val 0.0557 0.738 0.00820 0.183
Countries 78 78 26 26
N 17466 17285 5023 4874
Africa
1.472 1.107 0.985 0.915
0.029 0.388 0.884 0.700
Countries 47 46 21 21
N 11800 11594 4760 4675
Outside Africa
0.878 1.705 1.662 1.158
0.462 0.001 0.120 0.625
DiffP-val 0.834 0.838 0.143 0.0449
Countries 81 71 19 17
N 28280 26830 5094 4602
The table reports Incidence Rate Ratios from FE Poisson regressions. The dependent
variable is equal shares of USD commitments to projects started in each region and year.
All regressions include country and year fixed effects. Standard errors are cluster-robust
at the country level. P-values under the coefficients.
DiffP-values refer to the differences between the two panels above.
29Table 6: Commitments - Interaction effects
(1) (2) (3)
Birth Region Co-ethnic Region Co-ethnic Share
b/p b/p b/p
UNSC 0.958 1.215 1.169
0.576 0.174 0.346
BirthRegion 0.796
0.121
CoethnicRegion 0.830
0.107
CoethnicShare 0.692
0.038
UNSCInteraction 0.536 0.931 0.839
0.020 0.827 0.746
Regions 1895 540 516
N 38415 9609 9073
The table reports Incidence Rate Ratios from FE Poisson regressions. The dependent
variable is USD commitments to projects started in each region and year. All
regressions include region and year fixed effects. Standard errors are cluster-robust
at the country level. P-values under the coefficients.
members of the UNSC, confirming previous results with updated data, and suggesting that
foreign assistance is affected by donor strategic interests; (ii) we find that the sub-national
allocation of World Bank projects within countries does not seem to be shaped by fa-
voritism towards certain regions, for co-ethic regions if anything the opposite; and (iii) that
sub-regional allocation doesn’t seem to be different in times of UNSC membership, with
the possible exception of co-ethnic regions outside of Africa.
30Table 7: Commitments - Interactions heterogeneity
Birth Co-ethnic Co-ethnic Birth Co-ethnic Co-ethnic
Region Region Share Region Region Share
b/p b/p b/p b/p b/p b/p
Democracies Autocracies
UNSC 0.815 0.952 0.968 1.218 1.250 1.338
0.087 0.807 0.885 0.058 0.407 0.397
BirthRegion 0.624 1.312
0.061 0.347
CoethnicRegion 0.417 1.064
0.002 0.638
CoethnicShare 0.389 0.954
0.023 0.813
UNSCInteraction 0.556 1.149 1.013 0.550 0.644 0.678
0.052 0.745 0.987 0.211 0.182 0.417
DiffP-val 0.598 0.115 0.474
F-testPval 0.000 0.000 0.000 0.000 0.000 0.000
Regions 1103 324 293 1002 313 302
N 18549 4308 3959 16108 4828 4679
Africa Outside Africa
UNSC 1.467 1.139 1.232 0.915 1.016 1.046
0.012 0.636 0.594 0.335 0.919 0.801
BirthRegion 0.903 0.788
0.641 0.215
CoethnicRegion 1.052 0.578
0.767 0.000
CoethnicShare 0.964 0.500
0.905 0.000
UNSCInteraction 1.171 0.453 0.120 0.478 1.218 1.092
0.640 0.086 0.155 0.004 0.581 0.882
DiffP-val 0.0512 0.00000669 0.0457
F-testPval 0.000 0.000 0.000 0.000 0.000 0.000
Regions 562 227 233 1341 313 283
N 11594 4760 4670 26821 4849 4403
The table reports Incidence Rate Ratios from FE Poisson regressions. The dependent variable is equal
shares of USD commitments to projects started in each region and year. All regressions include region
and year fixed effects. Standard errors cluster-robust at the country level. P-values under coefficients.
P-values at the bottom of columns (4) to (6) refer to the differences from columns (1) to (3).
31You can also read