Renewable Energy Costs - in the Pacific - Collation of renewable energy infrastructure project cost data in the Pacific - ITP Renewables
←
→
Page content transcription
If your browser does not render page correctly, please read the page content below
Renewable Energy Costs
in the Pacific

    Collation of renewable energy
             infrastructure project
            cost data in the Pacific

                            March 2019
The Pacific Region Infrastructure Facility (PRIF) is a multidevelopment partner coordination,
research and technical assistance facility that supports infrastructure development in the
Pacific. PRIF members include the Asian Development Bank, Australian Department of
Foreign Affairs and Trade, European Investment Bank, European Union, Japan International
Cooperation Agency, New Zealand Ministry of Foreign Affairs and Trade, United States
Department of State and the World Bank Group.

Acknowledgements
This report is published by PRIF, with the technical input of the consultant, Mr. Joseph
Wyder, ITP Renewables (ITP) Projects Manager, who undertook the Collation of renewable
energy infrastructure project cost data in the Pacific assignment in 2018. All data and
reports were reviewed by a Technical Implementation Committee and PRIF Member agency
representatives under the PRIF Energy Sector Working Group. Edited by PRIF Coordination
Office staff.

For further information, please contact:
PRIF Coordination Office
c/- Asian Development Bank
Level 20, 45 Clarence Street, Sydney NSW 2000, Australia
enquiries@theprif.org
www.theprif.org

The views expressed in this report are those of the authors and do not necessarily reflect the views and policies
of ADB, its Board of Governors, the governments they represent, or any of the other PRIF member agencies.
Furthermore, the above parties neither guarantee the accuracy of the data included in this publication, nor
do they accept responsibility for any consequence of their application. The use of information contained in
this report is encouraged, with appropriate acknowledgement. The report may only be reproduced with the
permission of the PRIF Coordination Office on behalf of its members.

Renewable Energy Costs in the Pacific - Final Report
Collation of Renewable Energy infrastructure project cost data in the Pacific

Cover Photo - Philippe McCracken, ITP. The Tokelau Renewable Energy Project involved the installation of solar
photovoltaic and battery systems on the three atolls of Tokelau in 2012.
All other photos courtesy of ADB.
Table of Contents

Executive Summary--------------------------------------------------------------------------------------------------- 1

1. Introduction----------------------------------------------------------------------------------------------------------- 3

2. Methodology--------------------------------------------------------------------------------------------------------- 5

   2.1 Literature Review------------------------------------------------------------------------------------------5

   2.2 Project Cost Template------------------------------------------------------------------------------------8

   2.3 Target Projects List----------------------------------------------------------------------------------------9

   2.4 Data Issues--------------------------------------------------------------------------------------------------9

3. Capital Cost Analysis---------------------------------------------------------------------------------------------13

   3.1 Other trend lines----------------------------------------------------------------------------------------- 16

   3.2 Key trends------------------------------------------------------------------------------------------------- 18

4. International Comparison--------------------------------------------------------------------------------------21

5. Conclusions-----------------------------------------------------------------------------------------------------------23

6. References------------------------------------------------------------------------------------------------------------24

Annex A: Renewable Energy Projects List------------------------------------------------------------------25

                         COLLATION OF RENEWABLE ENERGY INFRASTRUCTURE PROJECT COST DATA                                        i
RENEWABLE ENERGY COSTS IN THE PACIFIC

     Abbreviations

     ADB        Asian Development Bank
     ARENA      Australian Renewable Energy Agency
     CAPEX      Capital Expenditure
     DoD        Depth of Discharge for a battery bank
     DFAT       Australian Department of Foreign Affairs and Trade
     EIB        European Investment Bank
     EU         European Union
     FSM        Federated States of Micronesia
     GIZ        Deutsche Gesellschaft für Internationale Zusammenarbeit
     kW         kilowatt, unit of power
     kWp        kilowatt peak, photovoltaic DC power output under standard test conditions
     kWh        kilowatt hour, unit of energy
     IPP        Independent Power Producer
     IRENA      International Renewable Energy Agency
     IPP        Independent Power Producer
     ITP        IT Power Australia Pty Ltd, trading as ITP Renewables
     JICA       Japan International Cooperation Agency
     LCOE       Levelised Cost of Electricity
     MFAT       New Zealand Ministry of Foreign Affairs and Trade
     OPEX       Operations and Maintenance Expenditure
     PCO        PRIF Coordination Office
     PIC        Pacific Island Countries
     PNG        Papua New Guinea
     PPA        Pacific Power Association (or Power Purchase Agreement)
     PRIF       Pacific Region Infrastructure Facility
     PV         Photovoltaic
     PV-B       Photovoltaic and battery project
     RAR        Regional Australia’s Renewables, ARENA program
     RE         Renewable Energy
     SPC        Secretariat of the Pacific Community
     TA         Technical Assistance
     ToR        Terms of Reference
     USD        United States Dollars
     W          Watt, unit of power, Wp or WDC is Direct Current, WAC Alternating Current,
                where there is no subscript, the reference hasn’t specified.
     WB         World Bank

     Definitions
     LCOE              is the average price ($/kWh) over a generation project’s lifetime such that
                       the project breaks even.
     RE penetration    instantaneous RE power (kW) divided by instantaneous total power (kW).
     RE contribution   annual RE generation (kWh) divided by annual total generation (kWh).

ii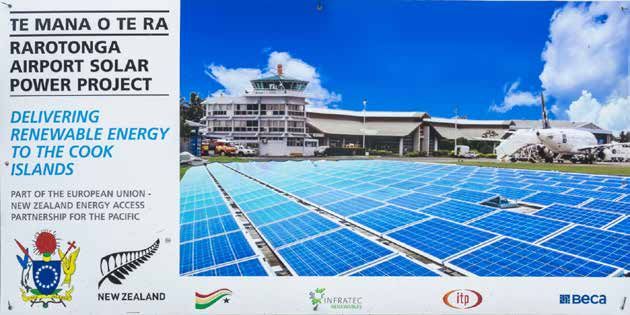
Executive Summary

The Renewable Energy Costs in the Pacific study analysed the capital
costs of large solar photovoltaic, wind and hydro generation projects
built in the Pacific over the past decade.
There is a large range of project costs for renewable generation projects in the Pacific.
This is due to a variety of factors including remoteness, scale, local capacity, perceptions of
risk, design parameters and any upgrades for existing infrastructure included in the project
scope. There are numerous challenges in obtaining cost breakdown data and making like-
with-like comparisons. Insufficient cost breakdown data was obtained from wind and hydro
generation projects to analyse trends.
This report focuses on capital costs (CAPEX) while the importance of operation and
maintenance costs (OPEX) and Levelised Cost of Electricity (LCOE) are acknowledged.
This is particularly so in the PV-battery-diesel mini-grid sector where there are examples of
CAPEX being minimised in a manner that increases OPEX and LCOE. As the deployment
of batteries is expected to increase in the Pacific region, the issue of assessing forecast
lifecycle costs and battery life are likely to increase in importance. In addition, the impacts
and costs of disposing of solar PVs and batteries is a growing concern in the Pacific. It is
being investigated in a separate PRIF study on “Pacific Region Solid Waste Management
and Recycling.”
The key overall findings from the PV systems analysis include:
nn The average, total installed cost of PV systems has fallen from around USD $12/W in 2008
   to $3/W in 2018. Key factors affecting installed costs include scale, location, and footing
   type (rooftop, concrete or piled), as well as the need for fencing, civil works and any
   requirements to bring in sand and repair/upgrade existing infrastructure.
nn The average, total installed cost of PV-battery systems has fallen from around $11/W in
   2014 to $5 to $8/W in 2018. Key factors affecting costs are similar to PV only systems
   with the added factors of battery type and inverters sizing plus function, as well as any
   requirements for new control systems and buildings to house battery banks and inverters.

                COLLATION OF RENEWABLE ENERGY INFRASTRUCTURE PROJECT COST DATA                    1
RENEWABLE ENERGY COSTS IN THE PACIFIC

    Analysis of the commercial in-confidence, system cost breakdowns obtained for this report
    provides the following generalised insights for component and other costs:
    nn PV modules have fallen from around $3/WDC in 2012 to $1/WDC by the end of 2013 and
       now can be as low as approximately $0.5/WDC.
    nn PV frames, show less of a downwards cost trend, possibly because this category
       sometimes includes footing components, with prices in the range $0.20 to $0.85/WDC.
    nn Grid-connected PV inverters have a range from around $0.15 to $0.40/WDC, with inverters
       for PV-battery systems being 30 to 75% more expensive. A better parameter for inverters
       is $/WAC.
    nn Where listed separately, civil costs show a wide range ($0.05 to $0.61/W for PV systems
       and $0.28 to $0.90/W for PV-battery systems, with two outliers at $3.52 and $9.88/W)
       with no clear trends over time. This indicates the location specific nature of preparing a
       site for a PV array and, if required, a new battery and inverter building plus the high costs
       of bringing in sand and earth moving equipment.
    nn Where listed separately, transport and insurance costs vary from $0.09 to $0.56/W (4%
       to 14% of total project costs) for PV systems and $0.31 to $3.19/W (6% to 15% of total
       project costs) for PV-battery systems. The wide range indicates the different logistical
       challenges of various locations in the Pacific, particularly outer islands.
    nn Large batteries and battery inverters varied from 22% of project costs to 42% of project
       costs. Small batteries varied from 14% of project costs to 38% of project costs.
    nn Batteries were costed between $200 to $750/kWh in the tenders examined, with no
       clear time-based trend. However, this range may be misleading for a variety of factors
       including that tenders were often unclear in their methodology for documenting
       inclusions/exclusions and specifying the capacity of the battery bank.
    There are also significant economies of scale factors applying to renewable generation projects.

2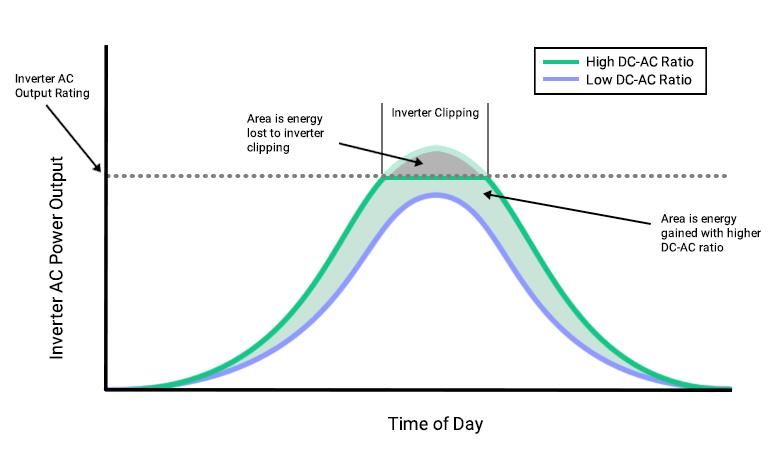
1.          Introduction

In the last decade, investment in Renewable Energy (RE) generation
infrastructure has significantly increased in many parts of the world,
including in the Pacific region.
In 2018, all the nations in the Pacific have established RE targets for their electricity sector
An overview of the countries examined in this report is shown in the following table.

Table 1: Pacific Island Countries’ Electricity Sector Overview1

                                                                       Electricity   Generation                     RE Target
                             Geography                 Population                                     RE Target
                                                                        Access        GWh pa                         by Year

Cook Islands                 14 islands                   15,200          99%             31.8          100%           2020

                             320 islands,                888,400          87%             900           100%           2030
Fiji
                             106 inhabited
FSM                          607 islands                 105,300          65%              72           > 30%          2020

                             32 widely scattered         120,100          >65%             23         23 - 40%         2025
Kiribati
                             atolls
                             34 islands, mostly           55,500          87%             101            20%           2020
Marshall Islands
                             atolls
Nauru                        single island                11,000          100%            31.7           50%           2020

Niue                         single island                1,520           99%             3.3            80%           2025

                             596 islands,                 17,900          98%             89.3           45%           2025
Palau
                             12 inhabited
PNG                          Over 600 islands           8,558,800         12%            217.3          100%           2030

Samoa                        10 islands                  196,700          100%            140           100%           2025

                             ~1000 islands, 350          682,500          23%              78            79%           2030
Solomon Islands
                             inhabited
Tokelau                      3 atolls                     1,400           100%            1.2           100%        long-term

                             176 islands,                100,300          89%             55.4           50%           2020
Tonga
                             36 inhabited
Tuvalu                       9 atolls                     10,200          98%             5.2           100%           2020

                             >80 islands,                304,500          33%             66.3          100%           2030
Vanuatu
                             65 inhabited

Power utilities are frequently making investments in renewable generation infrastructure
and increasingly signing renewable Power Purchase Agreements in order to:
i) reduce reliance on high cost diesel generation,
ii) improve energy security, and
iii) reduce greenhouse gas emissions.
This Renewable Energy Costs in the Pacific report aims to analyse the capital costs of large
solar photovoltaic (PV), wind and hydro generation projects built in the Pacific over the past
decade. The objective is to improve renewable energy project design and implementation
through the provision of reliable, comparable capital cost data.
All costs in this report are USD unless otherwise specified.

1      ITP analysis from various sources, including Pacific Energy Country Profiles, NZ MFAT 2016,
       geography from Fuelling the Pacific: Aid for renewable energy across Pacific Island countries, C Betzold, 2015, estimated
       2018 population data from SPC’s 2018 Pocket Statistical Summary.

                       COLLATION OF RENEWABLE ENERGY INFRASTRUCTURE PROJECT COST DATA                                              3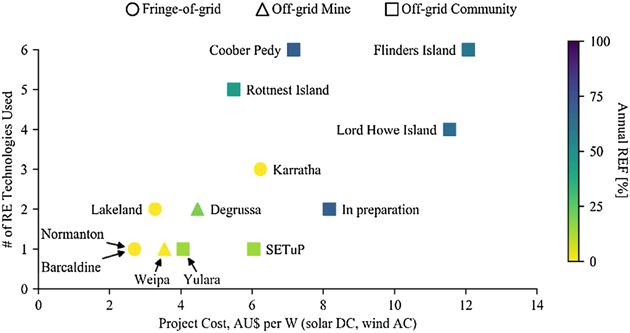
RENEWABLE ENERGY COSTS IN THE PACIFIC

4
2.           Methodology

An overview of the approach to developing this report was to:
nn undertake a relevant literature review,
nn develop a project data specification and target projects list,

nn consult with stakeholders to obtain cost breakdowns, and

nn analyse and graph key trends.

Further details on these activities follows.

2.1          Literature Review
è Costs of Renewables in Pacific Island Countries, ITP presentation, Oct 2011

This presentation to an IRENA workshop in Sydney identified:
nn data gaps as a key challenge for analysing renewable generation project costs,
   ‘information on real, on-site costs of RE technologies in the Pacific is very limited’,
nn data is not systematically collected and is difficult to access from utilities and private
   companies due to confidentiality,
nn cost data is not consistent due to inclusions and exclusions and different methodologies
   for itemising costs, and
nn long supply chains and limited transport options, along with small markets and harsh
   environments lead to increased costs.
The research examined solar home systems (SHS), off-grid PV systems and grid-connected
PV. A key figure from the presentation is shown below.

                  Solar PV costs over time
Figure 1: PV costs over time, from ITP, 2011
                                                                                 Grid-connected Pacific
     40.00
                    Installed cost of Solar PV USD/Wp                            Off-grid Pacific

     35.00                                                                       Europe Japan US Australia

                                                                                 Ground mounted grid-connected
     30.00                                                                       Pacific
                                                                                 SHS Asia & Africa
USD/Wp
                                                                                 SHS Pacific
     25.00
                                                                                 Linear (Grid-connected Pacific)

     20.00                                                                       Linear (Off-grid Pacific)

     15.00

     10.00

      5.00

      0.00
          2001   2002   2003   2004   2005   2006          2007   2008   2009   2010           2011          2012
                                                    Year

                   COLLATION OF RENEWABLE ENERGY INFRASTRUCTURE PROJECT COST DATA                                   5
1600
RENEWABLE ENERGY COSTS IN THE PACIFIC
1400
1200
capacity [kWp]
The analysis
1000 found the average cost of installed, grid-connect PV at just under $10/WDC≥ 201
(range $4.5 to $14/WDC), while ‘off-grid’ PV cost just under $20/W (range $10 to $34/ WDC),
800 the much higher costs when integrating PV and batteries on diesel mini-grids.
highlighting 51-200 kWp
For grid-connected PV, the costs of PV panels were just under 60% of the total project costs.
600 6-50 kWp
The analysis only had two wind projects and these were $4.0/WAC (Cooks 40 kWAC, 2003)
400 AC (Fiji 10 MWAC, 2006). The analysis had seven hydro generation projects ≤ 5 kWp
and $3.3/W in
the Pacific
200 and categorised their costs as micro-hydro $4 to $23/W AC and small-hydro $1.8
to $4/WAC.
The report0 concluded that:
1997 2008 2009 2010 2011 2012 2013 unknown
nncosts are not always directly comparable,
nn it is not feasible to generalise across PICs as there is so much variability across countries
(transport and logistics, labour, environment etc),
Fig. 9 system size installed per year.
nn institutional and regulatory environment and technical capacity have a big impact on
costs,
3.2.2 and
Costs
nn transaction costs are high and hard to predict.
3.2.2.1 Capital Costs PV Systems in the Pacific Island Region, GIZ_SPC, Aug 2013
è Grid-connected
The average costs per Wp (capital costs) of the given PV systems between 2008 and 2013 is
This report estimated there was a total of 3.2 MW of PV in the Pacific region as of July
9.27 USD/W . However, considering the rapid decline in cost in the last five years, it is more interest-
2013. It alsop estimated that this would increase to a total of 10 MW by the end of 2015.
ing to look‘where
It found, at costdata
in different years
is available, therather ancosts
capital averaging
ranged across
fromthis
USDfive year
$3.5 to period.
$15.5/WWhile
DC,
the pro-
(excluding
jects outliers)in
implemented with
2008an and
average
2010ofshow
$6.55/W DC.’
an average of 11.54 USD/Wp, projects since 2011 are
more widespread
The analysis (see the
reported Fig. 1.3
10)MW
butDCshow average
Maama capital
Mai solar costs
farm of 6.55installed
in Tonga, USD/Wp.inThe range of these
November
2011 as is
systems costing
between $5/W DC. USD/W
3.54 The contract
p and for thisUSD/W
26.54 project p, included
which is 5beyond
years of support
normal for Tonga
market mechanisms
Power Limited for management and maintenance advice.
and must be due to other factors, e.g. data inconsistency or special issues related to PV installations
This
in thereport also documented
PICs which is why somethe cost ofare
projects three Japaneseasfunded
considered outliersPVthat
systems butpart
are not theirof$/W
the average
costs are not listed here as they are considered to be above market value.
calculation (see below). Without outliers the range is between 3.54 and 15.49 USD/Wp. Fig. 10 fur-
This report
thermore indicated
reveals that the costs
that projects average capital
in the cost
Pacific for PVfollow
Region systems in 2014-15
a decreasing was since
trend expected
2008. Based
to be $8.9/WDC and provided the following figure on the installed costs of PV.
on the funding commitments of those projects planned in 2014/15, it appears this trend is set to
Figure 2:but
continue, Costtheper Wp, from
average GIZ_SPC,
capital Aug 2013
cost expected to be realised for this period is 8.90 USD/Wp.
Costs/Wp Outlier Linear (Costs/Wp)
30
25
Cost/Wp [USD]
20
15
10
5
0
2007 2008 2010 2011 2013
Fig. 10 Cost per Wp per project (linear = trend without outlier).
Though the report noted that, ‘since the analysis is relying on a small amount of projects
(14 from
Note that27 projects
some provided
upcoming usable
systems data), and
integrate even storage
battery less when taking
(e.g. outliers
in Niue andout of Vava’u and
Tonga,
consideration, the limited sample size precludes the possibility of finding a statistically
Vaini) to deal with grid stability issues, which will increase the project costs. But furthermore take
significant relationship.’
23
6The report analyses the performance of 10 PV systems where data was available. Though
it also noted that ‘polycrystalline panels are most common in the region, but for more than
40% of the systems, the panel technology was unknown’.
è Second Pacific Energy Investors Forum Final Report, Pacific Power Association,
Aug 2016
This report aimed to assist governments and utilities of 13 PICs to increase access to
renewable energy through private sector investments. It examined the many barriers to
private sector investment in the Pacific.
It listed the following costs for Independent Power Producer projects that had been built:
nn PNG Bulolo 15 MWAC Hydro, Morobe, commissioned March 2013, cost $3.33/WAC,
nn Samoa Upolu airport 2 MW PV, commissioned 2015, cost $3/W,
nn Samoa Upolu racecourse 2 MW PV, commissioned 2016, cost $3/W,
nn Vanuatu Devils Point 3.5 MWAC wind farm, commissioned December 2008, $2.33/WAC,
nn Vanuatu Undine Bay 0.5 MW PV, commissioned April 2016, $2.28/W.
The report provides a list of six recommendations aimed at addressing barriers to
IPP investments and provides the following four project proposals to be presented to
potential investors:
nn 2 MWAC hydro, Savai’I, Samoa,
nn 2.75 MWAC wind, Savai’I, Samoa,
nn 1.5 MW solar, Pohnlangas, Pohnpei FSM, and
nn 80 MWAC hydro, Naoro Brown, PNG.
The report provided estimated costs for these projects but, as they are estimates, they
haven’t been summarised here.
è Price of Solar PV Electricity in Developing Countries, Global Solutions Group,
Nov 2016
This paper focuses on the cost of utility-scale PV generated electricity on a cents/kWh
basis. It forecasts that module costs are expected to be below $0.3/WDC within the next two
years, though this is the manufacturing cost not the retail price.
The analysis is based on the 37 winning bids for utility-scale PV plants in 13 developing
countries. The projects examined were estimated to have costs from $2.7/W (75 MW, South
Africa, 2013) to $0.75/W (800 MW, UAE, to be commissioned in 2018).
None of the projects are in the Pacific and only one is below 10 MW. In addition, it is
unclear how the authors have dealt with the issue of fixed PPA rates vs rates that are
indexed through a variety of ways.
The analysis indicates that module costs are around one third of the cost. Adding in the
inverters and balance of plant takes this to around 60% of total costs. The remaining 40%
for engineering, procurement and construction plus other is described as very transaction,
site and country specific.
The authors are optimistic for further cost reductions and encourage Multilateral
Development Banks to assist driving PV electricity prices down by reducing financing
costs through de-risking projects by assisting with structuring of procurement and/or
providing guarantees.
COLLATION OF RENEWABLE ENERGY INFRASTRUCTURE PROJECT COST DATA 7RENEWABLE ENERGY COSTS IN THE PACIFIC
è Renewable Power Generation Costs in 2017, IRENA, Jan 2018
This report focuses on the LCOE (c/kWh) of utility-scale generation projects. It claims that PV
module prices have decreased by 81% since the end of 2009. The report provides the global
weighted average of total installed costs of utility-scale RE generation projects showing:
nn PV declining from $4.4/W to $1.4/W between 2010 and 2017,
nn Onshore wind declining from $1.8/W to $1.5/W between 2010 and 2017, and
nn Hydropower increasing from $1.2/W to $1.5/W between 2010 and 2017.
Though it is important to note that there is a wide range of project costs. This report is also
optimistic about cost reductions for PV and wind continuing out to 2020.
è Renewable Energy Island Index and Marketplace, Castalia, Oct 2017.
This presentation to the Caribbean Renewable Energy Forum (CREF) 2017 discusses
Castalia’s spreadsheet that tracks the enabling environment and renewable projects in the
Caribbean.
It contains the following figure examining PV (22 projects) and wind generation (13 projects)
electricity costs ($/kWh) in the Caribbean.
Figure 3: USD per kWh levelised cost of renewable generation in the Caribbean,
Castalia, 2017
This figure should be seen as illustrative only as examining the raw data indicates that
significant assumptions are required to generate the $/kWh LCOE estimates. It also appears
that many outliers have also been removed from the analysis.
è IRENA Pacific SIDS Project Funding spreadsheet, Dec 2017.
A copy of IRENA’s Pacific projects spreadsheet was obtained for this report. The IRENA
spreadsheet contains limited information on 150 funding allotments totaling around
$1,108 million with an announced project capacity of 359 MW.
2.2 Project Cost Template
A cost template was developed, which was used to attempt to develop consistent cost
breakdowns for the projects being examined. The cost template allows for detailed,
itemisation of the project components and cost breakdowns.
82.3 Target Projects List
The IRENA spreadsheet was used to commence the process of developing a target project
list for this assignment. The information in the IRENA spreadsheet was checked through
web searches and updated by identifying renewable generation projects that had not been
captured. This led to the development of a list of 71 renewable generation projects that
could be targeted for this report. The target projects list is provided in Annex A.
Subsequent consultations reduced the target project list for detailed cost breakdowns
which left a list of 43 target projects which, in practice, would most likely yield detailed cost
breakdown information. However, by September 2018, complete cost breakdowns were
obtained for only 16 projects and partial cost breakdowns for a further four. There are a
range of challenges in obtaining cost breakdown data and these include:
nn contracts requiring the written consent of suppliers before cost breakdowns are shared
with third parties,
nn inadequate physical and electronic filing systems for some stakeholders, and
nn the additional work involved in attempting to find historical data.
Subsequent consultations reduced the target project list for various reasons. This left a list
of 43 target projects, for which attempts were made to obtain detailed cost breakdown
information. The analysis of the cost breakdowns is commercial in-confidence and is not
provided in this report.
2.4 Data Issues
In addition to the challenges in obtaining cost breakdown data, there are also significant
data gaps in information that is published on websites. For some projects, these include
inadequate information on:
nn exact location(s) of new generation infrastructure,
nn clear dates and details on whether the date is funding approval, tender close, contract
sign, full commissioning or launch event,
nn whether PV is monocrystalline, polycrystalline or thin-film,
nn whether PV power capacity figures are DC or AC, ideally both should be reported due to
the trend to higher DC to AC ratios for PV systems,
nn battery type, voltage, power capacity, energy storage size and rate, design depth of
discharge, maximum depth of discharge and prime function,
nn other infrastructure that may be included in the total project costs, such as gensets,
network upgrades, new buildings, and
nn key forecast parameters such as expected annual generation, maximum instantaneous RE
penetration and annual RE contribution.
Some projects also have different key parameters published on various websites. There also
appears to be incorrect information published on some websites.
To improve future research in this area, the following could be considered:
nn tender specifications and contracts be changed so that cost breakdown data or
percentages can be published,
nn development of a standard template to allow for consistent cost data collection and
publication, and
nn any future work includes forecast and actual performance and OPEX, so that lifecycle
costs can also be analysed.
COLLATION OF RENEWABLE ENERGY INFRASTRUCTURE PROJECT COST DATA 9RENEWABLE ENERGY COSTS IN THE PACIFIC
PV DC/AC Ratios
PV modules’ DC rating is under standard test conditions which is 25°C, insolation 1,000 W/
m2 and 1.5 air mass. Installed on site and rooftops, PV modules can reach temperatures
as high as 75°C and their temperature derating coefficient needs to be considered. This
means that a 1 MWDC PV array in the Pacific will average a peak daily output (on clear days)
of around 0.8 to 0.9 MWDC depending on type of PV module, actual solar insolation in the
plane of the array, dust levels and any cooling from the wind.
When PV module costs were high and PV costs were a significant proportion of project
cost, the design approach was to have no to very little PV generation spill. This meant that
the inverter’s AC sizing was chosen to match the PV array’s maximum expected DC output,
after temperature correction. These systems would likely have DC/AC ratios in the range of
1.0 to 1.2.
Now that PV module costs are relatively low, the trend has been to increasing DC/AC
ratios. This results in partial PV generation clipping on some days but decreases the LCOE
of annual generation. Performance modelling is used to maximise the return on investment
by optimising the DC/AC ratio. This means that DC/AC ratios can now be in the range 1.2
to 1.5, depending on location and other factors.
The concept is illustrated in the following figure.
Figure 4: Daily output for PV systems with different DC/AC ratios, from Aurora Solar, 2018
Consider the graph above of energy production as a function of time of day. The blue
Consider the graph of energy production as a function of time of day. The purple line shows a typical
line represents the design approach when PV costs were high wherein a typical bell curve
bell curveofofAC
ACoutput
output power
power peaking
is peaking at at noon,
noon just just below
below the rating
the rating of the of the inverter
inverter indicated
indicated by by the
dashed line.
theAdding
dashed more panels
line. Now to increase
that PV the sizelow,
costs are relatively of the solarmore
adding array increases
panels the the
to increase DC-to-AC ratio
size of the solar array increases the DC/AC ratio of the system allowing higher energy
of the system (as illustrated by the green curve), allowing greater energy harvest throughout the day.
harvest throughout
The area between the green the daypurple
and as shown by theisgreen
curves line. Thethat
the energy areaisbetween
gained the green and the DC-to-
by increasing
blue curves is the energy gained by increasing the DC/AC ratio. The optimal return on
AC ratio. Credit: Aurora Solar
investment can be the design approach shown as the green line. In the middle of good
solar days, the inverter manages the PV array’s voltage and current, so that generation
matches the maximum AC capacity of the inverter.
Considering clipping losses
However, oversizing a solar array isn’t without consequences or costs. When the array
is producing the most solar energy (the DC maximum power point) at a level higher than
the inverter’s power rating, the extra power is “clipped” by the inverter. This inverter
clipping,
10 or power limiting, ensures the inverter is operating within its capabilities butCapacity Factor
Capacity factor is defined as the annual generation (kWh AC) divided by the nameplate
capacity output for the full year (8,760 hours x kWDC rating of the PV array).
Capacity factors achieved in the Pacific will vary depending on numerous factors including
annual insolation, DC/AC ratio, inverter efficiency, orientation, tilt, temperatures, dust,
shading and grid outages. The capacity factor will also decrease over time due to PV
module degradation.
For the Pacific, non-tracking PV capacity factors would typically be in the range 0.15 to 0.2.
For the LCOE analysis, an average first year capacity factor of 0.18 has been used. This has
been linearly degraded to 80% output in year 25, (capacity factor 0.144).
Batteries
Batteries can be designed and sized for a variety of functions, such as frequency control,
ramp rate smoothing and/or grid-forming, overnight load supply. For example, a 1 MWh
battery could be connected to a 0.2 MWAC inverter or a 1 MWAC inverter.
Definitional and data quality issues associated with batteries are discussed further in
Section 3.1.
COLLATION OF RENEWABLE ENERGY INFRASTRUCTURE PROJECT COST DATA 11RENEWABLE ENERGY COSTS IN THE PACIFIC 12
3.        Capital Cost Analysis

This report focuses on capital costs (CAPEX) while the importance of
operation and maintenance costs (OPEX) and the Levelised Cost of
Electricity (LCOE) are acknowledged.
This is particularly so in the PV-battery-diesel mini-grid sector where there are examples of
CAPEX being minimised in a manner that increases OPEX and LCOE. As the deployment
of batteries is expected to increase in the Pacific region, the issue of assessing forecast
lifecycle costs and battery life are likely to increase in importance. Also of importance is
the disposal costs of solar PVs and batteries, which is becoming a growing concern in the
Pacific. It is being investigated in a separate PRIF study on “Pacific Region Solid Waste
Management and Recycling.”
In addition, the cost of delivered diesel also varies by location and changes over time due
to global markets. An indication of historical, real oil prices is shown below.

Figure 5: Real Oil Prices, from World Bank2

PICs are likely to be paying significantly more than the Singapore bulk diesel fuel price
(about USD $0.65/litre in September 2018) due to the costs of delivery and the relatively
small quantities of diesel purchased.
To provide an overview, the cost (USD / W) of 47 projects in the target project list in
Annex A is summarised in Figure 6. The reasons why not all target projects are included, in
order of frequency, are the following:
nn inadequate information on category, capacity, budget or date,
nn the inability to disaggregate significant costs from new transmission and distribution lines,
   e.g. desalination plants other infrastructure upgrades from the project budget,
nn budget includes hydro refurbishments that were not able to be disaggregated, and

nn multiple generation sources, e.g. a combined PV and wind project.

The analysis calculated WDC for PV and WAC for wind and hydro. The PV and PV-battery
CAPEX trend lines are exponential best fit. There is insufficient data points to generate
CAPEX trend lines for wind and hydro.

2    http://blogs.worldbank.org/developmenttalk/governance/what-triggered-oil-price-plunge-2014-2016-and-why-it-failed-
     deliver-economic-impetus-eight-charts

                     COLLATION OF RENEWABLE ENERGY INFRASTRUCTURE PROJECT COST DATA                                       13
RENEWABLE ENERGY COSTS IN THE PACIFIC
20
Figure
Fig 6 6: $/W capital costs of Pacific RE projects
$/W Pacific RE projects
PV PV-battery Wind Hydro
$/W CAPEX
$/W Pacific RE projects
15 $/W CAPEX PV PV-battery Wind Hydro
20
10
15
5
0
y = 1E+07e-4E-04x
10
5
0
To provide a comparison with the diesel fuel cost of generation, an estimate of the Levelised
Cost of Electricity for PV projects is shown in Figure 7. Care is needed in drawing conclusions
from this, as the average fuel efficiency of diesel generation in the Pacific varies widely.
Figure 7: Estimated $/kWh LCOE Fig of 7:Pacific
EstimatedPV projects
$/kWh and PV
LCOE of Pacific PV-battery projects
projects compared to the marginal diesel fuel cos
compared to the marginal diesel fuel cost of generation
Not enough
Fig
data for
7trend lines for wind and hydro
Diesel at $1.60/litre
$1.60 $1.60
Diesel at $1.00/litre
Assumptions/Inputs
$1.40
PV-Battery LCOE
$1.40
Marginal Diesel Fuel Cost ($/kWh)
Discount Rate 7% PV LCOE
Assumed Annual Opex 10.5 $/kWp
$1.20
Capacity Factor (Year 1) 18% $1.20
Module Degradation @ year 25% 80%
Fuel Price 1 $1.00 $ 1.00 $/L
LCOE ($/kWh)
$1.00
Fuel Price 2 $ 1.60 $/L
Diesel kWh/L$0.80 3 $0.80
Battery Replacement
$0.60 Year 7 $0.60
Battery Replacement Cost Prorata'd 14.3%
Annual Battery Maintenance Cost ($/kWh)
$0.40
8.5 $/kWh $0.40
Battery Replacement Cost 300 $/kWh
Assumed XX% of Energy output delivered th
$0.20
65% $0.20
Assumed XX% Round Trip Efficiency 80%
Battery Systems modelled
$0.00
as Standalone systems $0.00
The PV LCOE estimatesCopiedfor this- PV
Data figure have been developed using an average PV capacity
Systems
factor of 0.18 in year 1, degrading to 0.144 over 25 years, and a discount rate of 7%. The
PV trend
PV-battery LCOE estimates have assumed 65% of the PV output is deliveredPVthrough
PV kWp DC Battery kWh Wind kW AC Hydro kW AC Cost USD Funder Month LCOE
the
Diesel at $1.00/litre
$0.58 $0.33
battery at 80% round trip 52efficiency with a battery life$549,048 span of EU sevenSep-2008
years. For$0.62
six out of
42 $410,000 JICA Feb-2008
$0.33
thirteen PV-battery systems, 39 there was insufficient information $439,238 EUon theOct-2008
battery details
$0.67 to $0.33
estimate a LCOE. 98 $1,522,694 EU Dec-2008 $0.91 $0.33
53 $486,787 EU Jul-2009 $0.55 $0.33
The midpoint of the marginal
1,300 diesel fuel cost bands illustrate
$6,468,000 only the
MFAT fuel cost$0.30
Nov-2011 of $0.33
generation for a diesel genset averaging 3 kWh/litre. As the actual fuel efficiency of diesel
gensets can vary from 2 kWh/litre to more than 4 kWh/litre, depending on loading and
other factors, the diesel trend lines are also shown as a band.
14The trend lines in Figures 6 and 7 should be seen as indicative due to a variety of factors
including:
nn the potential for full project costs to not be captured where a project may have more
than one funding source or contract,
nn the potential for the budget to include additional costs that are beyond the renewable
generation project build cost, for example Government and utility overheads, feasibility
studies, owners engineering costs, approvals as well as other new infrastructure such as
diesel powerhouse, gensets and power lines,
nn scale and remoteness significantly affecting project costs as well as the cost differences
for PV between rooftop, ground-mount concrete footings and pile-driven footings, and
nn the costs from any new diesel gensets and range of costs from different battery sizing for
PV-battery projects, (as usable battery sizing can vary from ~1 hour to 100 hours of full
load depending on RE penetration and contribution as well as the function the battery is
designed for).
The trend line for wind and hydro is not shown as there was insufficient data.
The large range of project costs highlight the challenges in developing cost forecast models
for renewable generation projects in the Pacific. The Pacific region’s specific challenges
include:
nn higher transport costs and limited shipping schedules,
nn lack of local contracting capacity,
nn small size of projects and markets resulting in poor economies of scale,
nn high cost of locally sourced goods,
nn low availability of locally sourced materials requiring importation of some construction
materials, and
nn contractors lacking familiarity with countries resulting in high risk premiums being added
to bidding prices.
Due to the wide diversity between and within countries, a renewable generation project
cost forecast model for the Pacific region has not been developed.
Any further work in this area would also need to consider other parameters that affect costs
such as:
nn instantaneous maximum RE penetration and forecast annual RE contribution,
nn PV array DC/AC ratio and footing types,
nn battery type, sizing, function and forecast life,
nn network upgrades,
nn new diesel gensets and control systems, and
nn new transformers and buildings etc.
Care also needs to be taken in that lifecycle cost (c/kWh) is more important than CAPEX, as
the highest CAPEX tender may have the lowest lifecycle cost due to the design optimising
performance, minimising maintenance issues and achieving the longest battery life.
COLLATION OF RENEWABLE ENERGY INFRASTRUCTURE PROJECT COST DATA 15RENEWABLE ENERGY COSTS IN THE PACIFIC
3.1 Other trend lines
Alternative trend lines for Figure 6 based on different timeframes and locations are provided
below. Figure 8 shows the $/W capital costs of recent projects with available disaggregated
data while Figure 9 shows Pacific RE projects implemented in the last 5 years.
Fig B1: USD March 2018 $/W of projects with some cost break down data.
Figure 8: $/W CAPEX trend lines for projects in 2012-18 with disaggregated data
$/W
$25.00
$20.00
$15.00
$10.00
$5.00
$0.00
PV $/W DC PV-B $/W Hydro $/W
Figure 9: $/W CAPEX
RE Costs in the Pacific
trend lines for RE projects in 2013-18
Fig E1: $/W CAPEX trend lines for projects only in the last five years.
$/W Pacific
$/W Pacific RE
RE projects
projects
$/W CAPEX
CAPEX PV
PV PV-battery
PV-battery Wind
Wind Hydro
Hydro
$/W
$/W CAPEX PV PV-battery Wind Hydro
20
20
15
15
10
10
5
5
0
0
Given the geographical dispersion of Pacific island countries, the effect of project location
is reflected in the following graphs considering the equator as the basis of grouping north
and south countries. 4 July 2018
BoQ = Bill of Quantities showing itemised costs NI = No information (yet) CB = Capacity Building
PV trend
Wind kW Hydro kW Key Dates (if known,
PV kWp DC Cost USD Notes Funder Count
AC AC eg tender close, commissioning) Date PV
Cooks 96.0 $340,136 NI, before Aug 2013 3 systems MFAT 1 Aug-13 3.54
1,364.0 $3,900,000 approved June 2014 website says PEC Fund Grant $3,914,229 PEC 2 Jun-14 2.86
switched on 15 Oct 2014, ITP has bidders' non-price tender docs, built by Infratec/Solar City,
960.0 $3,000,000 approved 2014, completed 2015 MFAT 3
Dec 2015 report on MFAT website says NZ funding was $3.5m NZD for 900 kWp Feb-14 3.13
16Figure 10: Capex
RE Costs in the Pacific ofof projects
Fig E2: Capex projects north of thenorth
equator. of the equator
$/W North Pacific RE projects
$/W CAPEX
PV
15
10
5
0
The limited number of projects north of the equator makes the above trend line more
indicative than others. However, the figures on this page do appear to indicate that PV
projects in the North Pacific tend to have4 July
higher
2018 costs than those in the South Pacific.
BoQ = Bill of Quantities showing itemised costs NI = No information (yet) CB = Capacity Building
Figure 11: Capex of projects south of the equator
PV trend
Wind kW Hydro kW Key Dates (if known,
PVPacific
RE Costs in the kWp DC Fig E3: Cost USD Notes Funder Count
AC AC Capex of projects south
eg of the close,
tender equatorcommissioning) Date PV
Cooks 96.0 $340,136 NI, before Aug 2013 3 systems MFAT 1
1,364.0 $3,900,000 approved June 2014 $/W South Pacific RE projects
website says PEC Fund Grant $3,914,229 PEC 2
$/W CAPEX switched on 15 Oct 2014, ITP has bidders' non-price tender docs, built by Infratec/Solar City,
960.0 $3,000,000 PV
approved 2014, completed 2015 PV-battery MFAT 3
25 Dec 2015 report on MFAT website says NZWind
funding was $3.5m NZD for 900 kWpHydro
20
15
10
5
0
4 July 2018
BoQ = Bill of Quantities showing itemised costs NI = No information (yet) CB = Capacity Building
Pv trend
Wind kW Hydro kW Key Dates (if known,
PV kWp DC Cost USD Notes Funder Count
AC AC eg tender close, commissioning) Date PV
Cooks 96.0 $340,136 NI, before Aug 2013 3 systems MFAT 1 Aug-13 3.54
1,364.0 $3,900,000 approved June 2014 website says PEC Fund Grant $3,914,229 PEC 2 Jun-14 2.86
switched on 15 Oct 2014, ITP has bidders' non-price tender docs, built by Infratec/Solar City,
960.0 $3,000,000 approved 2014, completed 2015 MFAT 3
Dec 2015 report on MFAT website says NZ funding was $3.5m NZD for 900 kWp Feb-14 3.13
COLLATION OF RENEWABLE ENERGY INFRASTRUCTURE PROJECT COST DATA 17RENEWABLE ENERGY COSTS IN THE PACIFIC
3.2 Key trends
The key overall findings from the analysis include:
nn The average, total installed cost of PV systems has fallen from around $12/W in 2008 to
$3/W in 2018. Key factors affecting installed costs include scale, location, and footing
type, (rooftop, concrete or piled) as well as the need for fencing, civil works and any
requirements to bring in sand and repair/upgrade existing infrastructure.
nn The average, total installed cost of PV-battery systems has fallen from around $11/W in
2014 to $5 to $8/W in 2018. Key factors affecting costs are similar to PV only systems
with the added factors of battery type plus inverters function and sizing, as well as any
requirements for new control systems and buildings to house battery banks and inverters.
Analysis of the commercial in-confidence, cost breakdowns obtained for this report
provides the following generalised insights for component and other costs:
nn PV modules have fallen from around $3/WDC in 2012 to $1/WDC by the end of 2013 and
now can be as low as approximately $0.5/WDC.
nn PV frames, show less of a downwards cost trend, possibly because this category
sometimes includes footing components, with prices in the range $0.20 to $0.85/WDC.
nn Grid-connected PV inverters have a range from around $0.15 to $0.40/WDC, with inverters
for PV-battery systems being 30% to 75% more expensive. A better parameter for
inverters is $/WAC and this should be examined in any future work.
nn Where listed separately, civil costs show a wide range over time ($0.05 to $0.61/W for
PV systems and $0.28 to $0.90/W for PV-battery systems, with two outliers at $3.52 and
$9.88/W) with no clear trends, indicating the site specific nature of preparing a site for a
PV array and, if required, lifting ground levels, new battery and inverter building(s) plus
the high costs of bringing in sand, aggregate, cement and earth moving equipment.
nn Where listed separately, transport and insurance costs vary from $0.09 to $0.56/W (4%
to 14% of total project costs) for PV systems and $0.31 to $3.19/W (6% to 15% of total
project costs) for PV-battery systems. The wide range indicates the different logistical
challenges of various locations in the Pacific, particularly outer islands.
nn Large batteries and battery inverters varied from 22% of total project costs to 42% of
total project costs. Small batteries varied from 14% of total project costs to 38% of total
project costs.
nn Batteries were costed between about $200 to $750/kWh in the tenders examined, with
no clear time-based trend. This cost range may be misleading as:
• some tenders were unclear in their methodology for specifying the capacity of the
battery bank, its nominal or usable capacity or for what discharge rate3 the kWh
capacity was for,
• some battery costs were given as total costs, while others were given as just the
battery purchase cost and there were also costs that may be somewhere in between,
for example battery cost includes racking and cables but not fuses and other
protection, and
• there are significant cost and battery life differences between the various battery types.
3 While C10 (discharge over 10 hours) is considered standard by some for assessing battery capacity, it is not always the
most relevant depending on the design function and type of the battery. Usable capacity is a system design choice and
effects the life of the battery which can have significant impacts on lifecycle costs ($/kWh).
18Table 2: The variety of battery types and characteristics make cost comparisons complex4
Flooded Lead Acid Gel Lead Acid Lithium-ion Zinc-bromine
Size litres/kWh 12 to 14 12 to 16 4 to 10 28
Approximate weight 35 25 to 35 7 to 10 24
kg/kWh
Maintenance High Low-Medium Low Low
Cost Low Low-Medium Medium-High High
Roundtrip efficiency 80% 80% 90 to 95% 70 to 80%
Cycle life 1,200 at 50% DoD 1,800 at 50% DoD 3,000 at 90% DoD 3,650 at 100% DoD
Maximum Depth of 50% 50% 80% to 90% 100%
Discharge
Relative capacity by 100% at 20 hour 100% at 20 hour 100% at 20 hour 97% at 20 hour rate
discharge rate rate rate rate
80% at 4 hour rate 80% at 4 hour rate 99% at 4 hour rate 100% at 4 hour rate
60% at 1 hour rate 60% at 1 hour rate 92% at 1 hour rate 50% at 1 hour rate
nn While it is widely reported that battery costs are decreasing over time, a significantly
more important parameter for the Pacific is battery life, as a battery that fails after just a
few years’ operation is not optimal.
Due to the limited data obtained, the wide variety of cost breakdown methodologies and
project costs, analysis of average % costs under each main component breakdown (e.g. PV
modules/civil works/inverters/BOS etc) has not been undertaken for this report.
Developing a generic, project cost forecast model is not appropriate due to the wide range
of renewable generation project costs and locations in the Pacific. If stakeholders require
more accurate renewable generation project cost forecasts, they may need to engage
expert advice after developing a detailed scope of work.
4 Illustrative, typical battery characteristics from various sources. Actual battery parameters depend on many factors (e.g.
the category Lithium-ion has a range of types) and are provided in the battery product specifications sheet. The level of
battery maintenance and temperature range also affect performance.
COLLATION OF RENEWABLE ENERGY INFRASTRUCTURE PROJECT COST DATA 19RENEWABLE ENERGY COSTS IN THE PACIFIC 20
4.           International Comparison

The data in Castalia’s Marketplace and the Index Database5 for
Caribbean renewable generation projects was used to produce the
following figure.

Figure 12: Caribbean renewable generation projects costs $/W, from Castalia data
                                                      Caribbean $/W

                                      hydro                       PV                       Wind
 14

 12

 10

     8

     6

     4

     2

     0
      1990               1995                 2000            2005              2010               2015   2020

This figure should be seen as illustrative only as:
nn For the 268 projects in the spreadsheet only 146 have a CAPEX and it is unclear if this is a
   forecast figure, actual budget figure or an as constructed cost,
nn For the 146 with a CAPEX only 41 have a ‘Operation Date’ with some dates being 2018
   to 2021 indicating that the CAPEX is a forecast, and
nn the PV figures haven’t been split between rooftop, ground mount or diesel mini-grid
   potentially with batteries.
While the Caribbean is significantly less remote than the Pacific and has very different scale
as well as economic bases, it is interesting to note that for 2018:
nn grid-connected PV is forecast to cost between $1.51/W (5.9 MW Aruba) and $2.89/W,
   (19 MW Dominican Republic),
nn wind generation is forecast to cost between $2.00/WAC (50 MWAC Dominican Republic)
   and $2.85/WAC (43.8 MWAC Dominican Republic),
nn hydro generation costs show such a wide range that interpolating a cost for 2018 would
   be misleading.

5        Available for download from: www.castalia-advisors.com/news_at_castalia.php&news_id=263

                        COLLATION OF RENEWABLE ENERGY INFRASTRUCTURE PROJECT COST DATA                           21
RENEWABLE ENERGY COSTS IN THE PACIFIC
It is also interesting to note that while wind’s CAPEX appears to have been increasing in
the Caribbean, its lifecycle cost has been decreasing (see Figure 3) due to a trend towards
higher capacity factors.
Costs in the Pacific are higher than in the Caribbean due to a variety of factors including
scale and remoteness. Islands in the Caribbean also tend to have larger populations, local
resources and larger economies.
Another interesting comparison is with remote sites in Australia. The following figure is from
Ekistica’s analysis of projects funded through the Regional Australia Renewables program.
Figure 13: Australian remote, renewable generation projects costs $/W (PV DC, Wind
AC), from Ekistica paper
This figure shows costs in AUD. It illustrates that as the annual Renewable Energy Fraction
(or annual renewable contribution) increases, the costs of integration with diesel gensets
(e.g. batteries etc), significantly increase the $/W costs of the project.
225. Conclusions
This report has analysed the available capital cost data of large solar
photovoltaic, wind and hydro generation projects built in the Pacific
over the past decade.
While a significant data-set was found to be available for PV and PV-battery systems,
there was insufficient data on wind and hydro generation capital costs to provide
meaningful analysis.
The investigation found the average, total installed cost of PV systems has fallen from
around USD $12/W in 2008 to $3/W in 2018. Key factors affecting installed costs
include scale, location, and footing type (rooftop, concrete or piled), as well as the
need for fencing, civil works and any requirements to bring in sand and repair/upgrade
existing infrastructure.
For PV-battery systems, the system cost has fallen from around $11/W in 2014 to a range
of $5 to $8/W in 2018. Key factors affecting costs are similar to PV-only systems with the
added factors of battery type plus inverters function and sizing, as well as any requirements
for new control systems and buildings to house battery banks and inverters.
It can be noted that the LCOE of PV is now significantly below the marginal diesel fuel cost
of generation at both at $1/litre and $1.60/litre. Thus PV fuel-saving systems are economic
in many Pacific locations, either as behind-the-meter rooftop systems or ground mount
solar farms.
Once the capacity of PV fuel-saving systems reach the hosting capacity of the local grid and
generators, further PV can be added with appropriate grid management, which typically
involves energy storage. While Figure 7 in this report indicates that the LCOE of PV battery
systems is now below the marginal diesel fuel cost of generation at $1.60/litre, it still has
further to reduce to be below diesel at $1/litre.
However, it should be noted that this is general analysis and that PV-battery systems can be
designed for anywhere between 30% and 100% solar contribution to annual load which has
major effects on battery sizing and costs. Thus site specific analysis is required to optimise
the economics of PV-battery systems and integration with existing infrastructure. The
optimum solar contribution depends on numerous factors including generators’ sizing, load
forecast, diesel price path and battery price. This illustrates the importance of Government
policies in assisting Pacific Island Countries making progress towards their renewable
energy targets.
To improve future research in this area, the following could be considered:
nn that tender specifications and contracts be changed so that cost breakdown data or
percentages can be published,
nn the development of a standard template to allow for consistent cost data collection and
publication, and
nn that any future work includes forecast and actual performance and OPEX, so that lifecycle
costs can be analysed.
COLLATION OF RENEWABLE ENERGY INFRASTRUCTURE PROJECT COST DATA 23RENEWABLE ENERGY COSTS IN THE PACIFIC
6. References
Fuelling the Pacific: Aid for renewable energy across Pacific Island countries, C Betzold, 2015.
2018 Pocket Statistical Summary, SPC, 2018.
Costs of Renewables in Pacific Island Countries, K Syngellakis, ITP presentation to IRENA
workshop, October 2011.
Grid-connected Photovoltaic Systems in the Pacific Island Region, GIZ-SPC, August 2013.
Second Pacific Energy Investors Forum Final Report, PPA, August 2016.
Price of Solar PV Electricity in Developing Countries, Global Solutions Group,
November 2016.
Pacific Energy Update 2017, ADB, 2017.
Renewable Energy Island Index and Marketplace, Castalia presentation to the Caribbean
Renewable Energy Forum, October 2017.
Identifying risks, costs and lessons from ARENA-funded off-grid renewable energy projects
in regional Australia, Ekistica, 2017.
IRENA_PacificSIDS_Project Funding Dec2217.xls, project tracking spreadsheet provided
by IRENA.
Aurora Solar, 2018
Pacific Energy Country Profiles, MFAT 2016
24Annex A: Renewable Energy Projects List
An overview of the target project list follows.
Note: NI = no information found. Further notes provided at the end of the tables.
Cook Islands
Project Name & PV kWp Wind Hydro Cost Key Dates Notes
details DC kW kW AC USD (if known)
AC $,000
NZ Aid solar 96.0 $340 NI, before 3 systems.
Aug 2013
Solar PV Mini Grid - 1,364.0 $3,900 approved Website says PEC Fund Grant $3,914,229.
Mitiaro, Atiu, Mauke June 2014
and Mangaia
Te Mana O Te Ra 960.0 $3,000 approved Switched on 15 Oct 2014, built by Infratec/
Solar Farm - Airport 2014, Solar City.
solar (Rarotonga completed Dec 2015 report on MFAT website says NZ
Airport West) 2015 funding was for 900 kWp and NZD $3.5m.
Outer Islands 850.5 $17,281 tender 10 $20.5m NZD six atolls (Manihiki, Rakahanga,
Northern Group Dec 2013, Penrhyn, Pukapuka, Nassau, and Palmerston),
Solar USD 8 systems, opening ceremony for Penrhyn and
convert Manihiki 19 May 2015, PowerSmart, Dec 2015
rate 10 Dec report on MFAT website says 6 mini-grids and
2013 NZD $19.5m and completed 2015, IRENA
completed spreadsheet says NZD $25.554m before tax
2015 for 8 systems with 8,021 kWh of batteries.
Solar PV Projects - 3,000.0 $17,020 approved Up to 6 PV projects includes battery plus
CI: RESP Mangaia, Nov 2014 network upgrades.
Mauke, Mitiaro,
Aitutaki, Atiu and
Rarotonga
BESS - CI: RESP potential $12,000 approved Battery may be across 3 sites and PV 5 sites,
Battery (3 MW, 12 6,000 2016 includes networks and capacity building,
MWh) to facilitate 6 weblink says $12m GCF grant is additional
MW PV funding.
CI RESP: Additional $13,710 approved This row and above two may be components
funding 2016 of the one project.
COLLATION OF RENEWABLE ENERGY INFRASTRUCTURE PROJECT COST DATA 25RENEWABLE ENERGY COSTS IN THE PACIFIC
FSM
Project Name & PV kWp Wind Hydro Cost Key Dates Notes
details DC kW kW AC USD (if known)
AC $,000
Kosrae 5 rooftops 52.3 $549 Sep-2008 PV 7.8, 11.7, 16.38, 4.68, 11.7 kWp roof and
ground mount.
Grid Connect Solar 800.0 $4,000 2014, Up to 800 kW across four sites.
Project - Chuuk, approved
Kosrae, Pohnpei June 2012
and Yap
Pohnpei solar farm 600.0 $2,250 approved Vergnet website has the 600 kWp Pohnlangas
April 2015 Solar Project, Madolenihmw municipality in
Pohnpei and has contract signed Oct 2015,
commissioned in March 2016 and launched 14
May 2016.
Kosrae State RE 500.0 $15,000 approved Includes 42.7km of new distribution lines.
Project (not built 2017
yet)
Pohnpei State RE 9,000.0 5,500 $66,300 approved 9 MW PV, 5.5 MW hydro, 5 MWh battery.
Project (not built 2017
yet)
Yap RE 300.0 875 $9,040 approved 0.3 MW PV, 0.875 MW wind, 2 diesel gensets,
Development 2013 battery 1.5 MW for 5 mins.
Fiji
Project Name & PV kWp Wind Hydro Cost Key Dates Notes
details DC kW kW AC USD (if known)
AC $,000
Port Denarau 122.0 NI Feb-2013 Sunnergise install ‘in December'.
LaKaRo Solar PV 525.0 $5,000 2015 3 systems 153 kW Lakeba, 153 kW Rotuma
systems and 225 kW Kadavu.
26Kiribati
Project Name & PV kWp Wind Hydro Cost Key Dates Notes
details DC kW kW AC USD (if known)
AC $,000
Solar PV Grid 400.0 $4,000 2015 Approved 2012, Bikenibeu.
Connect project,
South Tarawa
Solar and Water 500.0 $5,000 2015 Approved Jan 2014, built on aquifer, off-grid
Protection mentioned.
Kiribati Grid 548.0 $3,920 approved WB website also says 516 kW and $2.85m
Connected Solar PV March 2013 (no date). Installed at four sites in Tarawa:
Project cost and Kiribati Institute of Technology, Betio Sports
size from Complex, Tungaru Hospital and King George
WB media V Secondary School.
release
dated 23
Sept 2016
Kiritimati Energy 150.0 $7,550 to be EU EDF10 / NZ, website calls it Solar Energy
Sector Program completed for Outer Islands $4.1m euro, SPC website
in 2018 says groundbreaking ceremony 23 March
2017 and energy project is 7m euro = $7.55
USD on 23 March 2017. Tender dated Nov
2017 is in euro and has the 151.2 kWp project
costing more than $3/W.
COLLATION OF RENEWABLE ENERGY INFRASTRUCTURE PROJECT COST DATA 27You can also read