Clean buses for your city - Smart choices for cities - CIVITAS
←
→
Page content transcription
If your browser does not render page correctly, please read the page content below
Smart choices for cities
Clean buses for your city
Smart choices for cities
                                                                                                                                              Clean buses for your city

             Table of contents

             Preface. .  .  .  .  .  .  .  .  .  .  .  .  .  .  .  .  .  .  .  .  .  .  .  .  .  .  .  .  .  .  .  .  .  .  .  .  .  .  .  .  .  .  .  .  .  .  .  .  .  .  .  .  .  .  .  .  .  .  .  .  .  .  . 4

             Summary. .  .  .  .  .  .  .  .  .  .  .  .  .  .  .  .  .  .  .  .  .  .  .  .  .  .  .  .  .  .  .  .  .  .  .  .  .  .  .  .  .  .  .  .  .  .  .  .  .  .  .  .  .  .  .  .  .  .  .  .  . 5

             Introduction . .  .  .  .  .  .  .  .  .  .  .  .  .  .  .  .  .  .  .  .  .  .  .  .  .  .  .  .  .  .  .  .  .  .  .  .  .  .  .  .  .  .  .  .  .  .  .  .  .  .  .  .  .  .  .  .  .  .  . 6

             Drivers and challenges. .  .  .  .  .  .  .  .  .  .  .  .  .  .  .  .  .  .  .  .  .  .  .  .  .  .  .  .  .  .  .  .  .  .  .  .  .  .  .  .  .  .  .  .  .  .  .  .  .  .  . 7
                        Policy measures.  .  .  .  .  .  .  .  .  .  .  .  .  .  .  .  .  .  .  .  .  .  .  .  .  .  .  .  .  .  .  .  .  .  .  .  .  .  .  .  .  .  .  .  .  .  .  .  .  .  .  .  .  .  .  .  .  .  .  .  .  .  .  .  .  .  .  .  . 7
                        Current market situation. .  .  .  .  .  .  .  .  .  .  .  .  .  .  .  .  .  .  .  .  .  .  .  .  .  .  .  .  .  .  .  .  .  .  .  .  .  .  .  .  .  .  .  .  .  .  .  .  .  .  .  .  .  .  .  .  .  .  .  .  .  . 10
                        Challenges in introducing the clean buses.  .  .  .  .  .  .  .  .  .  .  .  .  .  .  .  .  .  .  .  .  .  .  .  .  .  .  .  .  .  .  .  .  .  .  .  .  .  .  .  .  .  .  .  .  .  .  .  .  . 12

             What are the clean(er) bus options? . .  .  .  .  .  .  .  .  .  .  .  .  .  .  .  .  .  .  .  .  .  .  .  .  .  .  .  .  .  .  .  .  .  .  .  .  .  .  .  . 13
                        Fossil fuels.  .  .  .  .  .  .  .  .  .  .  .  .  .  .  .  .  .  .  .  .  .  .  .  .  .  .  .  .  .  .  .  .  .  .  .  .  .  .  .  .  .  .  .  .  .  .  .  .  .  .  .  .  .  .  .  .  .  .  .  .  .  .  .  .  .  .  .  .  .  .  . 14
                        Biofuels.  .  .  .  .  .  .  .  .  .  .  .  .  .  .  .  .  .  .  .  .  .  .  .  .  .  .  .  .  .  .  .  .  .  .  .  .  .  .  .  .  .  .  .  .  .  .  .  .  .  .  .  .  .  .  .  .  .  .  .  .  .  .  .  .  .  .  .  .  .  .  .  .  . 20
                        Electricity.  .  .  .  .  .  .  .  .  .  .  .  .  .  .  .  .  .  .  .  .  .  .  .  .  .  .  .  .  .  .  .  .  .  .  .  .  .  .  .  .  .  .  .  .  .  .  .  .  .  .  .  .  .  .  .  .  .  .  .  .  .  .  .  .  .  .  .  .  .  .  .  . 26
                        Diesel hybrid: hybrid/electric .  .  .  .  .  .  .  .  .  .  .  .  .  .  .  .  .  .  .  .  .  .  .  .  .  .  .  .  .  .  .  .  .  .  .  .  .  .  .  .  .  .  .  .  .  .  .  .  .  .  .  .  .  .  .  .  .  . 32
                        Hydrogen .  .  .  .  .  .  .  .  .  .  .  .  .  .  .  .  .  .  .  .  .  .  .  .  .  .  .  .  .  .  .  .  .  .  .  .  .  .  .  .  .  .  .  .  .  .  .  .  .  .  .  .  .  .  .  .  .  .  .  .  .  .  .  .  .  .  .  .  .  .  .  . 36

             Which energy carrier to choose for your bus? . .  .  .  .  .  .  .  .  .  .  .  .  .  .  .  .  .  .  .  .  .  .  .  .  .  .  .  .  .  .  .  . 40
                        Comparing different bus options . .  .  .  .  .  .  .  .  .  .  .  .  .  .  .  .  .  .  .  .  .  .  .  .  .  .  .  .  .  .  .  .  .  .  .  .  .  .  .  .  .  .  .  .  .  .  .  .  .  .  .  .  .  .  . 41
                        Comparison emissions. .  .  .  .  .  .  .  .  .  .  .  .  .  .  .  .  .  .  .  .  .  .  .  .  .  .  .  .  .  .  .  .  .  .  .  .  .  .  .  .  .  .  .  .  .  .  .  .  .  .  .  .  .  .  .  .  .  .  .  .  .  .  . 42
                        Comparison economy.  .  .  .  .  .  .  .  .  .  .  .  .  .  .  .  .  .  .  .  .  .  .  .  .  .  .  .  .  .  .  .  .  .  .  .  .  .  .  .  .  .  .  .  .  .  .  .  .  .  .  .  .  .  .  .  .  .  .  .  .  .  .  . 43
                        Comparison other considerations. .  .  .  .  .  .  .  .  .  .  .  .  .  .  .  .  .  .  .  .  .  .  .  .  .  .  .  .  .  .  .  .  .  .  .  .  .  .  .  .  .  .  .  .  .  .  .  .  .  .  .  .  .  .  . 44

             Achieving short term and long term targets . .  .  .  .  .  .  .  .  .  .  .  .  .  .  .  .  .  .  .  .  .  .  .  .  .  .  .  .  .  .  .  .  .  . 45
                        Current decisions . .  .  .  .  .  .  .  .  .  .  .  .  .  .  .  .  .  .  .  .  .  .  .  .  .  .  .  .  .  .  .  .  .  .  .  .  .  .  .  .  .  .  .  .  .  .  .  .  .  .  .  .  .  .  .  .  .  .  .  .  .  .  .  .  .  . 45
                        Future outlook .  .  .  .  .  .  .  .  .  .  .  .  .  .  .  .  .  .  .  .  .  .  .  .  .  .  .  .  .  .  .  .  .  .  .  .  .  .  .  .  .  .  .  .  .  .  .  .  .  .  .  .  .  .  .  .  .  .  .  .  .  .  .  .  .  .  .  .  . 46

             Conclusions. .  .  .  .  .  .  .  .  .  .  .  .  .  .  .  .  .  .  .  .  .  .  .  .  .  .  .  .  .  .  .  .  .  .  .  .  .  .  .  .  .  .  .  .  .  .  .  .  .  .  .  .  .  .  .  .  .  .  . 47

             References . .  .  .  .  .  .  .  .  .  .  .  .  .  .  .  .  .  .  .  .  .  .  .  .  .  .  .  .  .  .  .  .  .  .  .  .  .  .  .  .  .  .  .  .  .  .  .  .  .  .  .  .  .  .  .  .  .  .  . 48

             Glossary. .  .  .  .  .  .  .  .  .  .  .  .  .  .  .  .  .  .  .  .  .  .  .  .  .  .  .  .  .  .  .  .  .  .  .  .  .  .  .  .  .  .  .  .  .  .  .  .  .  .  .  .  .  .  .  .  .  .  .  .  . 47

             Annex 1. Comparison of bus technologies on a set of indicators. .  .  .  .  .  .  .  .  .  .  .  .  .  .  .  .  .  .  . 49
© 2013 TNO

                                                                                                                                  3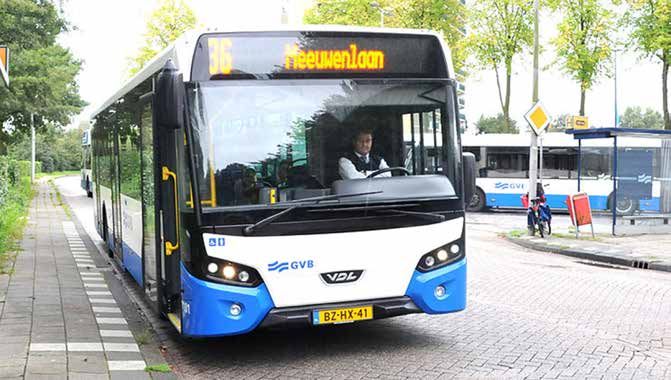
Smart choices for cities Smart choices for cities
Clean buses for your city Clean buses for your city
Preface Summary
Thank you for reading the first policy analysis of the CIVITAS This policy analysis provides clear and in-depth information ■■ Full electric buses are starting to become commercially
WIKI Policy Analyses series. The mission of the CIVITAS WIKI which will guide policy makers in European municipalities, available. Driving range and costs of batteries are still
project is to provide information on clean urban transport public transport operators and other local decision makers an issue. Where a trolleybus network exists, wider utili-
and on the CIVITAS Initiative to EU city planners, decision- in their choice of clean(er) public transport. First, it defines sation of these buses should be considered.
makers and citizens. With its policy documents WIKI wants drivers and challenges that influence municipalities to look at
to inform people in the cities on a number of topics that ‘cleaner’ bus options. Second, for five main energy carriers ■■ Hydrogen fuel cell buses are considered a promising
currently play an important role in urban mobility. available in the market today it identifies the available and option, but are currently still in an experimental stage.
most promising bus technologies. Third, it compares the Purchase costs for prototypes are very high.
The first policy analysis focusses on the topic of clean buses. most promising bus technologies with respect to operational
This is a hot topic because the introduction of clean buses is characteristics, pollutants and GHG emissions, costs and ■■ For both electric and hydrogen fuel cell buses high in-
necessary in order to reach the EU air quality targets. This maturity. Finally, it discusses how to take decisions on cost- vestment costs in infrastructure are necessary.
document gives in-depth background information to make a efficiency of clean(er) public transport today, keeping in
decision on which bus to choose. mind both EU short term 2020 and long term 2050 targets. In the short term, introduction of clean(er) buses can contribute
to the implementation of EU 2020 targets1 in several ways.
Within the CIVITAS WIKI project in total eight policy The main conclusions of the policy note with respect to the For diesel buses, high blends of first or second generation
analyses will be produced. Cities can suggest topics for main bus technologies are as follows: biodiesel can be used to increase the renewable energy
research to the CIVITAS WIKI team. This can be done share above the blending limit. For gas engines, biogas can
via the CIVITAS secretariat or using the CIVITAS thematic ■■ Diesel buses are still the most economical buses with be used to increase the renewable share (up to 100%). The
groups. So if you have a topic you want to know more the lowest total cost of ownership (TCO). With the latest application of hybrid drivelines with diesel or gas engines
about, please let us know! Euro VI engine technology, pollutants and GHG emis- can further reduce GHG emissions by about 20%.
sions are very low and comparable to Euro VI natural
We hope you enjoy reading. gas engines. In the longer term and heading to the achievement of the EU
2050 target2, full electric buses and possibly also H2 fuel
The CIVITAS WIKI team ■■ Natural gas buses are readily available from the major cell buses show the most promise, thanks to their high energy
manufacturers, but costs are higher and emission advan- efficiency and possible combination with renewable solar or
tages over diesel have diminished with the introduction wind energy. In this context it is important to start building
of Euro VI (diesel) technologies. experience in pilot series with 2035 and later technologies,
because full development with competitive prices will take
■■ Buses running on biofuels are more and more wide- several decades.
spread. Their TCO is comparable to the TCO of diesel
buses. Pollutant emission with biofuels (biodiesel, HVO, Therefore, if financial resources allow, municipalities and
bio-methane, bio-ethanol) will depend on the particular public transport operators should aim for the zero emissions or
type and blend of that biofuel, but with Euro VI engine options that come closest to it. Alternatively, especially within
technologies, the differences will most probably be very the current economic and financial crises, conventional diesel
small. GHG emissions will most probably be lower for buses (Euro VI) and their hybrid configurations represent a
all biofuels, but this is quite dependent on the feedstock very good environmentally friendly option as well.
and the production process.
■■ Diesel and gas hybrid buses can reduce GHG and pol-
lutant emissions by around 20%. Hybrid buses will have
somewhat higher TCO as regular buses but this may
diminish over time.
1 EU Renewable Energy Directive (RED) target of 2020 is the use of 10%
This publication was produced by the CIVITAS WIKI consortium. The policy note was compiled by Nina Nesterova (TNO, the Netherlands) biofuels for transportation (on energy basis). The 2020 target of the EU
Fuel Quality Directive (FQD) is 6% CO2 reduction.
and Ruud Verbeek (TNO). Special recognitions are to Janiek de Kruijff (TNO) and Marc Bolech (TNO) for their valuable contributions to the
2 The EU 2050 target for transportation is a reduction of GHG emissions
document and Tariq van Rooijen (TNO) and Cosimo Chiffi (TRT, Italy) for the review of the manuscript.
of around 60% compared to 1990.
4 5
Smart choices for cities                                                                                                                    Smart choices for cities
                                                                                Clean buses for your city                                                                                                                   Clean buses for your city

Introduction                                                                                                                                      Drivers and challenges
Local governments and decision-makers need to make                         Buses are still a part of the municipality fleet in a majority         Several drivers and challenges shape a municipality’s                  Third, addressing a growing concern of energy security
sustainable and cost-efficient decisions that on one hand                  of EU Member States. By choosing a cleaner bus solution,               decision to purchase a ‘cleaner’ bus fleet. On the global level,       and anticipating the potential shortage of fossil fuels, the
contribute to global, European Union (EU) and national                     local decision makers can contribute to the decarbonisation            these include high-level EU commitments to reduce emissions,           EU established specific targets to reduce the dependence
goals and on the other hand fulfil the specific requirements               of urban transport and improve air quality in their cities.            or more concretely the GHG emission reduction targets for              on oil, encouraging the use of renewable energy sources.
of each individual city. This is often a challenging task. This            There are different ways to reduce emissions from buses.               Member States. Drivers and challenges also include public              In this respect, the Renewable energy Directive (2009) sets
policy note intends to facilitate the decision-making process              These include improving vehicle technology or powertrains,             health concerns and related air quality issues, as well as             bidding targets for all EU Member States to achieve a 20%
of European municipalities on how to make their public                     as well as considering alternative fuels to power vehicles.            the upcoming shortage of fossil fuels and the necessity to             share of energy use from renewable sources by 2020, and
transport fleet cleaner by providing information on available                                                                                     switch to alternative sources of energy. On the local level, in        in particular a 10% share of renewable energy use in the
and most promising clean(er) bus fuels and technologies.                   This policy note focuses on the clean(er) energy sources for           the context of ongoing economic crises, municipalities have            transport sector.
                                                                           buses and on associated bus technologies. When selecting               to take cost-efficient decisions in distributing limited budgets
Global concerns about climate change, public health and                    the most ideal energy source, local decision-makers are                which also comply with their own targets on air quality and            Finally, respecting the EU legislation on noise limits in
energy security are translated into concrete sustainability                faced with different type of questions:                                noise reduction and that consider EU and national legislation          metropolitan areas is also of a concern to municipalities.
targets on European level and on national levels. For cities                                                                                      with respect to bus fleets (e.g. Euro standards).
(urban areas), air quality is generally more important than                ■■    What are the options available and which energy                                                                                         Addressing these challenges requires enormous efforts such
global warming. This means their first priority is the reduction                 source/technology to choose for a bus?                                                                                                  as the simultaneous implementation of sustainable policies
of pollutant emissions such as NOx, NO2 and particulates.                                                                                         Policy measures                                                        in localities and regions. In order to achieve this (as well
                                                                           ■■    What are the advantages/disadvantages of the differ-                                                                                    as other EU-specific goals on the city level, e.g. air quality,
The EU is committed to reducing greenhouse gas (GHG)                             ent options?                                                     On the global level several EU policies encourage                      congestion, noise reduction), the EC has developed a set of
emissions, aiming at 20% emission reduction below 1990                                                                                            municipalities to look at the ‘cleaner’ choice for a local bus         strategies, policies and measures which present the general
levels by 2020 and 80-95% emission reduction for all sectors               ■■    What are the costs of these options?                             service.                                                               EU vision for the urban transport and provide a concrete
combined by 2050. The 2050 reduction target for transport                                                                                                                                                                legislative framework for its development (Box 1).
is about 60%. Being the second biggest GHG emitting sector                 ■■    Which fuels require installation of additional infrastruc-       First, the high-level EU commitments to reduce GHG emissions
after energy (24.2% of total EU emission in 2010), transport                     ture and what are the associated costs?                          are translated to concrete targets on individual Member                Air quality is addressed by regulations establishing pollutant
receives special attention within emission reduction policies,                                                                                    State level and for specific European sectors. The 2011 EC             emission limits for different types of vehicles. The established
with particular focus on the road transport. Urban transport               The objective of this Policy Note is to provide municipalities,        White Paper ‘Roadmap to a Single European Transport Area               Euro standards (Table 1) define varying limits on carbon
is responsible for about a quarter of total CO2 emissions                  local decision makers and public transport operators with              – Towards a competitive and resource efficient transport               monoxide (CO), hydrocarbons (HC), nitrogen oxides (NOx)
from transport according to the 2011 European Commission                   information that can guide them in the initial choice of a             system’ aims to reduce transport GHG emissions by 60%                  and particulate matter (PM) tailpipe exhaust emissions from
(EC) White Paper on transport. By 2025 urban mobility is                   clean(er) energy source and associated bus technology. In              in 2050 compared to 1990. As around 70% of transport-                  new road vehicle engines under specific vehicle condition.
forecasted to double3. With the clear EU objectives to increase            this policy note we first describe drivers and challenges that         related GHG emissions are from road transport, the paper               Different standard numbers refer to the limits required from
public transport4 and introduce new CO2 regulations for                    influence decisions related to purchasing a ‘cleaner’ bus. We          specifically aims for emission reduction of around 60%.                vehicles introduced after specific dates. The new Regulation
vehicles, European municipalities will face new challenges in              than present and compare the main available clean energy                                                                                      595/2009 on type approval of motor vehicles and engines
making cost-efficient and environmentally friendly decisions.              sources and the most promising associated bus technologies.            Second, the public health concerns and in particular the               with respect to emissions from heavy duty vehicles (Euro
                                                                           Comparison is usually made with a regular diesel single                issue of air quality are still of major concern in Europe. The         VI) will be implemented from January 2014. This standard
Operating the whole day in a city, buses are the backbone                  deck bus6.                                                             EC has policies in place limiting national totals of four major        foresees a reduction of 80% in NOx and 66% in PM
of many European public transport systems. Even though far                                                                                        air pollutants and each Member State is further developing             emissions compared to the Euro V stage limits which entered
behind private cars, in 2011 buses and coaches covered                                                                                            concrete policies in order to comply with EU legislation.              into force in October 2008.
512 billion passenger-kms providing 7.8% of the passenger
mobility in the EU. Almost 50% of the EU motor coaches,
buses and trolley buses in the EU are more than 10 years
old5. With a relatively low number of modern bus fleets
corresponding to the Euro V standard, buses contribute
significantly to local pollution.

3   Mc Kinney, 2012
4   EC, “A Roadmap for moving to a competitive low carbon economy in
    2050”, COM (2011)112.                                                  6    Ricardo, 2012: 12t, 9.7m length, capacity seats/standees 38/24;
5   Eurostat                                                                    EURO V mission standard, tare weight 8.1 t

                                                                       6                                                                                                                                             7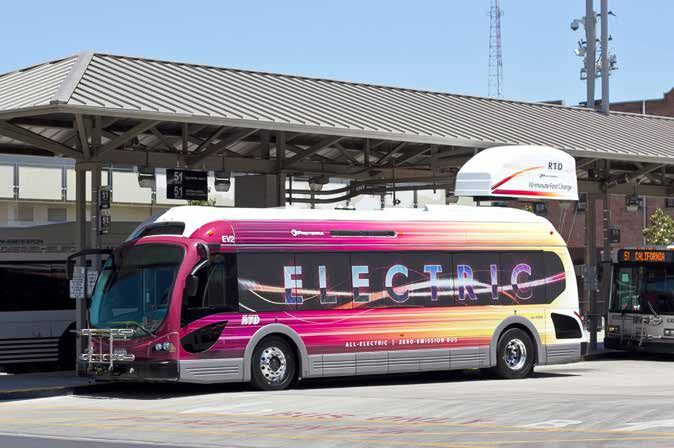
Smart choices for cities Smart choices for cities
Clean buses for your city Clean buses for your city
The standard means that as from January 2014 the Original pure diesel bus options available on the market. When
Equipment Manufacturers (OEMs) have to produce buses buying a new bus fleet, municipalities can purchase Euro VI Box 1
which do not produce emissions more than those established compliant buses or just upgrade their bus fleet with buses of
by Euro VI emission level. For the municipalities the standard a higher Euro standard.
indicates the most environmentally and air-quality friendly
Policies, strategies and measures providing a framework for the
Table 1. European standard for emissions from buses and heavy duty vehicles
development of the clean(er) public transport in Europe
Carbon Hydro- Non-methane Nitrogen Particulate
Test procedure Methane
Emission level and monoxide carbons hydrocarbons oxides matter
(operating Policies, strategies and measures reflecting Policies, strategies and measures aiming to
year of enforcement the vision on European urban mobility reduce CO2 emissions and to address energy security
conditions) HC (g/ NMHC (g/ CH4 (g/ NOx (g/ PM (g/
CO (g/kWh)
kWh) kWh) kWh) kWh) kWh)
■■ Green Paper ‘Towards a new culture for urban ■■ A Strategy for competitive, sustainable and secure
steady states, mobility’ (COM(2007) 551) energy (COM(2010) 639)
1.5 0.13 - - 0.4 0.01
WHSC
Euro VI 2014 ■■ Action Plan on Urban Mobility (COM (2009) 490) ■■ Green Paper - Towards a secure, sustainable and
transient, competitive European energy network (COM(2008)
4 - 0.16 0.5 0.46 0.01 White Paper on Transport ‘Roadmap to a Single 782)
WHTC ■■
European Transport Area – towards a competitive
steady states, and resource efficient transport system’ (COM ■■ Action Plan for Energy Efficiency: Realising the
1.5 0.46 - - 2 0.02 (2011) 0144) Potential (COM(2006) 545)
ESC
Euro V 2008
■■ Expected Urban Mobility Package (2013) ■■ Directive on the promotion of the use of energy
transient, ETC 4 - 0.55 1.1 2 0.03 from renewable sources (Directive 2009/28/EC
Policies, strategies and measures aiming to reduce GHG amending and subsequently repealing Directives
emissions and improve air quality 2001/77/EC and 2003/30/EC) and proposal
steady states,
1.5 0.46 - - 3.5 0.02
ESC
■■ The Ambient Air Quality Directives (Directives ■■ Renewable Energy Road Map. Renewable energies
Euro IV 2005
96/62/EC (‘Framework Directive’) and four in the 21st century: building a more sustainable
transient, ETC 4 - 0.55 1.1 3.5 0.03 ‘daughter directives’ 1999/30/EC, 2000/69/EC future’ (COM(2006) 848 )
2002/3/EC, 2004/107/EC and Council Decision
97/101/EC). Policies and strategies addressing noise levels
steady states,
2.1 0.66 - - 5 0.1 in urban areas
ESC
■■ The National Emission Ceilings directive (Directive
Euro III 2000
2001/81/EC) ■■ Directive 70/157/EEC193 concerning the
transient, ETC 5.45 - 0.78 1.6 5 0.16 permissible sound level and the exhaust system
■■ The 2005 Thematic Strategy on Air pollution of motor vehicles (further amending Directive
(COM(2005) 446) 2007/34/EC)
steady states,
Euro II 1996 4 1.1 - - 7 0.15
13-mode ■■ The EU Air Source Abatement Policy Framework ■■ Council Directive 97/24/EC194
■■ New Air Quality Directive (Directive 2008/50/EC) ■■ Commission green paper on future noise policy
steady states, (COM(96)540)
Euro I 1991 4.5 1.1 - - 8 0.36
13-mode ■■ Regulation 595/2009 on type-approval of motor
vehicles and engines with respect to emissions from ■■ Directive 2001/43/EC
heavy duty vehicles (Euro VI)
steady states, Environmental Noise Directive (2002/49/EC)
Euro 0 1988 11.2 2.4 - - 14.4 - ■■
13 mode
Source: http://www.unece.org/index.php?id=28534
8 9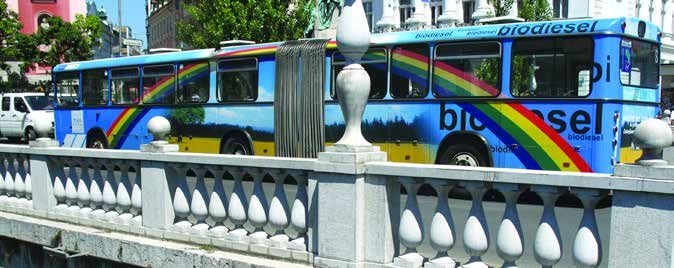
Smart choices for cities Smart choices for cities
Clean buses for your city Clean buses for your city
Current market situation
Responding to the targets established on national levels the be done as almost 50% of the fleet in 2011 was more than Some countries and cities are more advanced than others on cleaner public transport, while many bus operators are
municipalities are taking different actions to improve their 10 years old, with buses belonging to the Euro III standard with respect to introducing cleaner bus fleets. As summarized renewing their fleet or deploying low-emission powertrains’.
local bus fleet. As a result, already 11% of the European bus or lower (Figure 1). by McKinsey (2012), ‘a number of cities are already focused
fleet is less than two years old, which means that they meet
Euro V emission standard. Nonetheless, much more needs to As indicated in Figure 2 situation varies a lot per country. Figure 3. European cities focusing on clean powertrains for public transport
Figure 1. Distribution of age of buses in EU-28, 2011
Restrictions on diesel engine
Non-fossil powertrain requirements
11%
Amsterdam Brussels Stockholm
2
From 2015 onwards, all buses From 2015 onwards, bus By 2025, renewable
17% should at least conform to operators will no longer public transport.
48% 1
EEV norm. Locally, EEV+ procure diesel-powered Currently, already 58%
buses are deployed to meet buses in order to lower of the buses drive on
EU air quality regulations PM and NOxlevels renewable fuels
25%
Cologne London Oslo Hamburg
Since 2007, only By 2015, all buses to By 2020, all buses to From 2020 onwards,
1 1
EEV (and better) meet EUROIV. By use renewable fuels. only emission-free
Figure 2. Distribution of age of buses in EU-28, per country, in percentages, 2011 buses have been the end of 2012, Phase out all EURO buses will be
procured 300 hybrid buses will III before 2013 procured
100
be in service
80
60
2005 10 15 20 2025
40
In addition, many cities focus on other measures to adhere to EU regulation on air quality
20 ▪ Expanding and optimising public transport in general
▪ Banning cars from city centres
0 ▪ Promoting electric cars
Austria
Netherlands
United Kingdom
Germany
Romania
Belgium
Slovenia
Spain
Croatia
Czech Republic
Italy
Portugal
Finland
Cyprus
Latvia
Estonia
Poland
Lithuania
1
EEV: Enhanced Environmentally friendly Vehicle is a EURO norm in-between EUROV and EUROVI
2
Incl. biofuels
Source: McKinsey (2012)
There is still much potential for contributing to the Introducing alternative powertrains or alternative fuels is one
10 years or over From 5 to 10 years From 2 to 5 years Less than 2 years
decarbonisation of European road transport and addressing of the options already implemented by cities (Figure 3) and
Source: Eurostat the issue of local air pollution by acting on urban buses. is addressed in this policy analysis.
10 11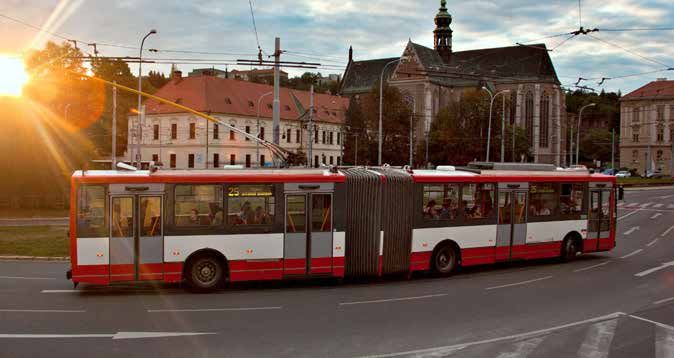
Smart choices for cities                                                                            Smart choices for cities
                                                                       Clean buses for your city                                                                           Clean buses for your city

Challenges in introducing the cleaner buses
                                                                                                   What are the clean(er)
Local decision makers are faced with a range of challenges
when they introduce clean buses in municipality fleets.
                                                                                                   bus options?
First, there is a lack of information on available and most                                        Four main energy carriers are available for buses: fossil            Fossil fuels, biofuels, electricity, hydrogen and hybrid
promising clean(er) bus options that could be implemented.                                         fuels, biofuels, electricity and hydrogen. For all these             configurations are the energy carriers available for buses.
What is a clean(er) bus and why? What type of alternative                                          options different bus technologies exist, using one fuel or a        For each energy carrier several bus technologies were tested
powertrain or energy carrier to choose and why? How to                                             combination of energy carriers (hybrid). Buses running on            by manufacturers, with some of them being more promising
assess the ‘cleanliness’ of your own bus fleet?                                                    compressed natural gas (CNG), 2nd generation of biofuels,            from the sustainability point of view than others (Figure 4).
                                                                                                   electricity and hybrid configurations combining electricity
Second, the purchase price of the most advanced technologies                                       with hydrogen or diesel are considered as most promising             The next sections present detailed factsheets for all highlighted
is very high, which can lead to higher exploitation costs.                                         from technological and environmental point of view. At the           combinations of bus technology and energy carrier. As the
With the budget available, service level remains the same                                          same time, with introduction of Euro VI emission standards           technical maturity of these combinations varies significantly,
or possibly decreases and the price of public transport can                                        for diesel buses, those technologies become as ‘clean’ as            projected data have been used in some instances (main
rise, leading to a decrease in passenger flows. On some                                            their alternatives.                                                  sources are McKinsey (2012), Verbeek R (2013), TNO/CE
occasions, special funding from national and EU authorities                                                                                                             Delft (2012)).
(e.g. through CIVITAS programme) is available, bridging
limited availability of local resources with the necessity                                         Figure 4. Possible and most promising bus technologies for different energy carriers
to achieve EU 2020 targets. However, in all cases, local
decision makers are expected to take the most cost-efficient
solution. Should they buy the newest and cleanest bus,
thus investing directly into the most environmentally and
energy-efficient technology? Should they opt for second-
hand buses which are cheaper but improve air quality and                                                 FOSSIL FUELS                Diesel             EURO VI
CO2 emissions to a limited degree? Or should they invest in                                                                          Natural gas        CNG                          Liquid petroleum gas
moderate energy-efficient bus options?                                                                                                                  LNG

Third, if they switch from one bus technology to another,
what additional infrastructure do they have to introduce?
                                                                                                            BIOFUELS                 Biodiesel      1st generation: FAME             Bioethanol
Finally, they must consider innovations that could help public                                                                                      2nd generation: HVO              Bio methane/Landfill liquefied methane
transport develop very fast and definitely faster than the
life cycle of the buses. In this context it might be difficult
and expensive for public authorities to keep up with the
innovation. Due to the long tradition of diesel engines, diesel                                           ELECTRICITY
buses have a lot of advantages – the efficiency, maintenance                                                                         Electric buses        Trolley buses
and exploitation costs of the diesel bus are predictable. Many
questions, however, still remain. What are the advantages of
other bus technologies, taking into consideration that Euro VI
technology bus is getting close by environmental standards
                                                                                                          HYDROGEN
to the buses running on alternative fuels? How can clean(er)                                                                         Full cell without battery
                                                                                                                                                                                     Hybrid hydrogen/electricity
buses address municipalities’ other road transport concerns                                                                          Hydrogen internal combustion
such as congestion, road transport safety and security?

This policy analysis aims to answer some of these questions.
                                                                                                             HYBRID
                                                                                                                                                                                     Serial hybrid configuration with
                                                                                                                                     Parallel ICE/electricity hybrid
                                                                                                                                                                                     dominating electricity

                                                                                                   Source: TNO (in red circles are the most promising options)

                                                                  12                                                                                               13
Smart choices for cities Smart choices for cities
Clean buses for your city Clean buses for your city
FOSSIL FUELS
Fossil fuels, which are non-renewable resources, are formed Using LPG for buses was popular some years ago, but
FOSSIL FUELS
by natural processes and typically include coal, petroleum proved to require very expensive investments in fuelling
and natural gas. One of the main actual concerns related to infrastructure. It also had a negative impact on engine
them is that world reserves are being depleted much faster durability, posing high safety concerns as well.
than new ones are being made. Another major concern is
that from the burning of fossil fuels within vehicles, the highest Although LNG buses have a very high operational range,
amount of GHG gases is released to the air (in particular, the very high investment in fuelling infrastructure makes them
CO2) in comparison to other energy sources required to a less attractive option for cities over buses running on CNG.
propel the vehicle.
With introduction of Euro VI standard for vehicles, buses
With respect to fossil fuels, bus technologies can run on running on the regular diesel are becoming as clean emission-
diesel, compressed natural gas (CNG), liquid natural gas wise as those running on alternative sources, representing a
(LNG) and liquid petroleum gas (LPG). promising for future option. Currently Euro V bus technology
is on the market and is presented in the Factsheet below.
Euro VI buses are highly comparable to Euro V buses in
operational performance, infrastructure needs and costs yet
differ for projected emissions.
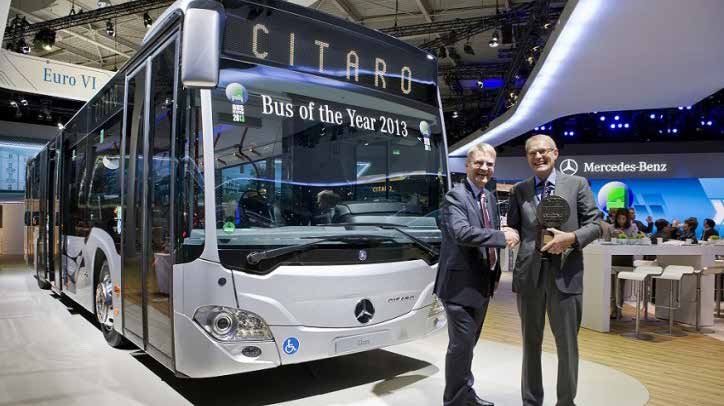
Figure 5. Euro VI bus
Source: http://www.benzinsider.com/2012/09/mercedes-benz-citaro-euro-vi-takes-bus-of-the-year-2013-award
14 15
Smart choices for cities                                                                                                                    Smart choices for cities
                                                                   Clean buses for your city                                                                                                                   Clean buses for your city

Euro V and
Euro VI buses                                                                                                                         Figure 6. Euro V Bus

Bus technology with conventional diesel combustion engine, running on regular diesel fuel
and fulfilling Euro V and Euro VI emission standards for buses

Emissions
                                                              Operational performance

                                                              Range: 600-900km
 GHG          Measure      Euro V        Euro VI
                                                              High route flexibility
 CO2eq        g/km         1000          1000

 NOx          g/km         3,51          1,1                  Good performance on acceleration

 PM10         g/km         0.10          0.03                 Energy consumption 2012: 4.13 kWh/km

Thanks to expected improvements in bus driveline and          Energy consumption 2030: 3.89 kWh/km
body by 2020, CO2 emissions from buses will be further
reduced to 900 g/km.                                          Refuelling needed every 2nd day

Noise emissions: standing 80 dB; pass by 77 dB                Short refilling time: 5-10 min
(McKinsey, 2012)

                                                              Infrastructure

                                                              High European coverage with refilling stations                          Source: http://commons.wikimedia.org/wiki/File:GVB_1101.JPG

                                                              Costs                                                                   Factors to take into consideration                                                  Diesel powertrain

                                                              ■■    Indication of purchase price: +/- 220,000 euro per bus            Diesel buses can produce less emissions by using a blend of
                                                              ■■    Indication of maintenance cost: 0.10 – 0.15 euro                  diesel with biofuel.
                                                                    cent/km
                                                              ■■    Vehicles can be sold with a market price available for            CO2 reduction can be achieved by improving the efficiency
                                                                    the second-market.                                                of the engine and by improvements in the ‘soft side’, like
                                                              ■■    TCO7 Euro V 2012: 2.1 euro/km                                     changing driving behaviour.                                                                       Fuel tank
                                                              ■■    TCO Euro VI 2030: 2.5 euro/km
                                                                                                                                      Main advantages: due to the long tradition of diesel
                                                                                                                                      engines the efficiency, maintenance and exploitation costs of                                     Engine
                                                                                                                                                                                                                                        and periphery
                                                                                                                                      diesel buses are predictable; filling infrastructure is in place;
                                                                                                                                      buses can be adapted for the usage of biofuels relatively                                         Gearbox
                                                                                                                                      easily.

                                                                                                                                      Main disadvantage: within growing concern of                                                      Mechanical
                                                                                                                                      diminishing fossil fuel resources in the long-term these buses                                    drive line
                                                                                                                                      might have to be adapted to use another energy source.

                                                              7    All TCO figures further in the document combine McKinsey 2012
                                                                   findings and TNO estimations. Total cost of ownership includes
                                                                   purchase, financing, running, infrastructure and emission costs.

                                                         16                                                                                                                                               17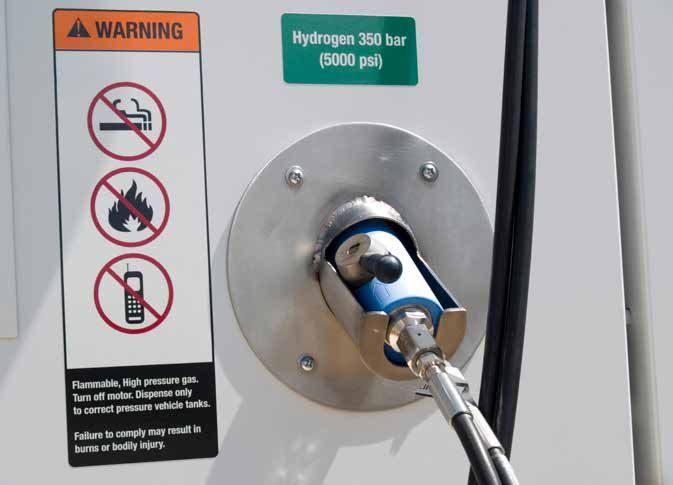
Smart choices for cities                                                                                                              Smart choices for cities
                                                                 Clean buses for your city                                                                                                             Clean buses for your city

Bus running
on CNG
CNG buses run on the conventional CNG combustion engine. Gas is delivered by a standard                                       Factors to take into consideration
gas distribution grid and is compressed to the required pressure to pump it into the vehicle.
                                                                                                                              The main difference between regular diesel bus and CNG                cities as a barrier to implementation and introduction of
Conversion of regular diesel buses into CNG buses existed previously, but is no more advisable                                bus is in terms of local pollutants. The scale of this benefit        the CNG bus fleet. Other barriers include difficulties in
due to more strict emission standards for buses.                                                                              for CNG buses is decreasing, as diesel vehicles emit less             obtaining permission necessary for the construction of the
                                                                                                                              and less local pollutants to satisfy EU emission standards            CNG fuelling stations, technological challenges with some
                                                            Operational performance                                           (especially Euro VI). If biogas (e.g. biomethane) is used to          new and retrofitted CNG buses and no market confidence in

Emissions
                                                                                                                              power CNG buses, emissions will decrease.                             this type of the fuel.
                                                            Range: 350 – 400 km
                                                                                                                              Main advantages: CNG offers energy diversity benefits                                      CNG powertrain
                                                            High route flexibility                                            as it does not rely on oil. Gas refuelling systems can be
 GHG          Measure       CNG 2013      CNG 2020
                                                                                                                              transformed to hydrogen refuelling systems, so potentially
 CO2eq        g/km          1000           800 - 850        Energy consumption 2012: 5.21 kWh/km                              could be a step between diesel and hydrogen.

 NOx          g/km          1.4-4.5       0.88              Energy consumption 2030: 5 kWh/km                                 Main disadvantage: Being a non-renewable source of
                                                                                                                              energy the same concerns as diesel arise: the production of                                             CNG tank
 PM10         g/km          0.005-0.03    0.024
                                                            Refilling every 2nd day                                           gas in Europe continues to decline.

Noise emissions: standing: 78 dB; pass-by 78 dB             Short refilling time: 5-10 min                                    High safety concerns exist because of possible gas leaks,                                               Engine
                                                                                                                              rapid flammability of CNG and risk of fire.                                                             and periphery

                                                                                                                                                                                                                                      Gearbox
                                                            Infrastructure                                                    In total 167 CNG buses were introduced to European cities
                                                                                                                              by measures implemented in CIVITAS II and CIVITAS Plus
                                                            Requires specific filling infrastructure (special pump and        projects. Main drivers to introduce CNG buses were necessity                                            Mechanical
                                                            buffer tank for fast filling) or adaptation of existing filling   to upgrade old bus fleets and improvement of environmental                                              drive line
                                                            infrastructure. Connection to the existing gas network is         image through environmentally friendlier vehicles. Lack of
                                                            necessary, otherwise a specific CNG grid must be built.           political support and national regulations not adapted to
                                                                                                                              the implementation of CNG buses were reported by several

                                                            Cost                                                              Figure 7. CNG Bus

                                                            ■■   Indication of purchase price: +/- 250.000 euro per bus
                                                            ■■   Indication of maintenance cost: 0.15 eurocents/km
                                                            ■■   TCO 2012: 2.1 euro/km
                                                            ■■   TCO 2030: 2.6 euro/km
                                                                 Maintenance necessary for period leak check
                                                                 activities.

                                                            Extra specific safety requirements can lead to extra costs
                                                            ranging from 20k per CNG bus (e.g. fire detection systems,
                                                            fire distinguishing systems).

                                                                                                                              Source: CIVITAS, Bologna

                                                       18                                                                                                                                      19
Smart choices for cities Smart choices for cities
Clean buses for your city Clean buses for your city
BIOFUELS
BIOFUELS
The generic term ‘biofuels’ is used to describe fuels derived
from organic material. Different processes are available for
the production of biofuel which explains the diversity of its
form: biodiesel, bioethanol, biogas.
Box 2
‘1st generation’ biofuels are obtained by directly converted ‘2nd generation’ biofuels exploit non-food crops and crop
harvested biomass (e.g. sugar cane, wheat, palm oil). waste, and their sustainable production is supported by
Being first introduced over 10 years ago, today the use EU policies. The major problem with the 2nd generation
of 1st generation biofuels is no more encouraged at EU biofuels is that they are not yet commercially available.
level as production can have severe environmental and
socioeconomic impacts. Most important is the impact on
food prices and food security (as biomass is not being
used for nutrition but for fuel production). Other impacts
include effects on GHG, on quality, deforestation and
biodiversity loss.
The quality of biofuels is also characterised by two
generations. The 1st generation is cheaper but offers less
quality, while the 2nd generation boasts a more sophisticated
production process and is cleaner yet more expensive.
1st generation biodiesel (Fatty Acid Methyl Ester, or FAME) is infrastructure needs and costs, yet differ in projected emissions
one of the most used 1st generation biofuels to power the buses. (see Factsheet: FAME/HVO buses).
Because of the unsustainable production it is not recommended
for long-term use, but is still available as the production of Biomethane is used to fuel CNG buses, thus validating
2nd generation biofuels is not yet widespread. Research, sustainable production of gas used to power CNG buses
development and implementation today focusses on 2nd and improving overall environmental performance.
generation biofuels and in particular on HVO (Hydrotreating
vegetable oil: advanced biodiesel made by treating vegetable Whether used to power buses, private cars or any
oil or animal fat with hydrogen). Buses running on FAME and other vehicles, biofuels are almost always blended with
HVO are highly comparable in operational performance, conventional fuels.
20 21Smart choices for cities Smart choices for cities
Clean buses for your city Clean buses for your city
Buses running on
FAME/HVO
This bus technology uses biofuels to power the bus. When diesel buses are adjusted to use Things to take into consideration Diesel powertrain
biofuels, each type and blend of biofuel requires specific minor motor modifications. Therefore
EU targets to increase the share of renewable energy sources
buyers must have a clear initial understanding of what kind of biofuel or biofuel blend will be for transport combined with the targets to increase the use
used in the specific bus. of sustainable biofuels requires higher usage of biofuels for
transport. Only 7% blend of FAME with diesel is permitted
Operational performance according to fuel specifications. Higher blends of FAME are
Fuel tank
Emissions
not supported by OEMs due to concerns over fuel quality
Range: 570-850 km and stability.
Euro V Euro V Euro V Engine
GHG Measure High route flexibility Very limited current supply of HVO: current HVO global and periphery
diesel FAME 100 HVO100 production equates to only 1% of European diesel demand
500 and 500 and Good performance on acceleration (produced by Nestle Oil in Finland, the Netherlands and Gearbox
CO2eq g/km 1000
more more Singapore). It is expected to remain a significant ‘niche fuel’
NOx g/km 3,51 4.39 3.16 Energy consumption 2012: 4.13 kWh/ km up to 2020 due to low supply volumes.
Mechanical
PM10 g/km 0.10 0.04 0.08 Energy consumption 2030: 3.89 kWh/ km To make sure buses run on the clean biofuel, transport drive line
operators can ask for clean fuel certificates from fuel
Emissions from biofuel buses depend on the feed stock used Refilling every 2nd day providers.
to produce the biofuel and on the biofuel blend used. For
lower blends, emission benefits will be proportionally less. Short refilling time: 5-10 min Main advantages: only slight motor modifications of
the diesel bus are necessary in order to use biofuels and to
Noise: liquid biofuels have no significant effect on noise. achieve significant reduction in emissions.
Infrastructure
Main disadvantages: for each particular type/blend of
Same filling infrastructure as for diesel can be used: biofuel specific motor modifications are to be done.
widespread presence of filling stations across Europe. In
some cases a special tank for biofuels may be needed. Biofuel production certificates must be requested from
suppliers. Figure 7. Biofuel Bus
Costs
■■ Indication purchase price: +/- 220.000 euro/bus
■■ TCO FAME (B100) 2012: 2.22 euro/km
■■ TCO HVO (B100) 2012: 2.35 euro/km
Currently both HVO and FAME are more expensive than
regular diesel fuel.
Source: CIVITAS, Ljubljana
22 23Smart choices for cities Smart choices for cities
Clean buses for your city Clean buses for your city
Bus running
on bioethanol
Bioethanol is primarily sourced from sugarcane, grain/corn/straw or forestry waste. Diesel Things to take into consideration CNG powertrain
buses cannot be adapted for the bioethanol usage. Buses operate on 100% of bioethanol
Main advantages: provide alternative power source to
which cannot be blended with another type of fuel. diesel
Operational performance Main disadvantages: Very limited current worldwide
Emissions
production of bioethanol.
Range: 400-600 km (depending on a tank) CNG tank
Within CIVITAS II and CIVTIAS Plus projects 304 buses
Euro V Euro V High route flexibility running on biodiesel (mostly first generation) were put into
GHG Measure Engine
diesel bioethanol operation. For some cities the drivers to choose biodiesel and periphery
CO2eq g/km 1000 400-600 Good performance on acceleration bus were political support and commitment to improve the
quality, environmental performance and public transport Gearbox
NOx g/km 3,51 3.51 Energy consumption 2012: 4.13 kWh/km service. At the same time, the main barriers included lack of
political support (introducing relevant legislation on biofuels
PM10 g/km 0.10 0.10 Mechanical
Energy consumption 2030: 3.89 kWh/km and biofuel blends and giving permission to install biofuel
drive line
fuelling stations), lack of experience in dealing with biofuels
Noise: Similar to diesel vehicles Refilling every 1or 2 days and blends of bus manufactures, infrastructure managers
and bus drivers and doubts on the quality of the fuel.
Short refilling time: 5-10 min
Figure 8. Bioethanol bus
Infrastructure
Same filling infrastructure as for diesel can be used but
specific pump for bioethanol has to be installed as well as
larger storage tank.
Costs
■■ Indication purchase price: +/- 250,000 euro/bus
■■ TCO 2012: 2.52 euro/km
Source : www.best-europe.com
24 25Smart choices for cities Smart choices for cities
Clean buses for your city Clean buses for your city
ELECTRICITY
ELECTRICITY
Electricity is the main energy carrier powering electric buses Electric buses represent a new technology entering market,
and trolley buses. In the case of electric buses this is done using batteries as the main power source. Batteries can be
via the rechargeable battery integrated into the bus. Trolley recharged overnight at the main bus location (overnight
buses are supplied with electricity via overhead wires. charging powertrain) or at fixed spots along the bus route
Electric buses represent the cleanest technology currently (opportunity charging powertrain).
available on the market, producing zero local emissions
and therefore having the best impact on the local air quality. Trolley buses are considered a very mature technology. These
They are usually also characterized with a low level of noise. are electricity-powered buses using an external electricity
Regarding the CO2 emissions of electricity-powered vehicles, source. Most common are technologies fully connected to
it is important to consider the source of electricity and its the power supply all along the way. Currently also partly
production process. connected technologies are being tested, but they are not yet
widely implemented options.
Figure 9. Battery electric bus
Source: http://www.ovpro.nl/bus/2012/09/18/den-bosch-test-elektrische-bus-volvo-7700/
26 27Smart choices for cities Smart choices for cities
Clean buses for your city Clean buses for your city
Electric bus
Figure 10. Electric bus
A bus that is driven by a purely electric motor powered by batteries charged with electricity. Factors to take into consideration
The vehicle has no other power source other than the battery. Two types are available:
Opportunity electric buses are considered promising in terms
of projected costs.
n Opportunity e-buses aim to minimize the weight of the battery by recharging en route at
passenger stopping points. They have medium battery capacity (typically 40-60 kWh) Overnight electric buses are not expected to meet average
and need regular charging from the grid at intermediate stops. daily range requirements nor carry a sufficient number of
passengers due to the weight of the batteries within the next
10 years.
n Overnight e-buses carry the weight of battery required to drive the entire route without
recharging. They have a large battery capacity (typically >200kWh) and recharge the Rapid advances in technology, therefore careful market
battery from the grid only at the depot. study need to be done before the purchase in order to select
the best possible option available on the market
Operational performance Source: CIVITAS, La Rochelle Main advantages: one of the cleanest available
Emissions
technology
n Opportunity – charging buses: Infrastructure
Main disadvantages: high purchase price, TCO and
GHG Measure Electric bus • Short free range ofSmart choices for cities Smart choices for cities
Clean buses for your city Clean buses for your city
Trolley buses
Electric powered rubber-tyred bus with current provided either via overhead line or ground Figure 11. Trolley bus
contact. It always has an auxiliary power unit (small motor) or electric battery available to
cover short distances without overhead wiring.
Operational performance
Emissions Range: unlimited within the network providing constant
electricity supply
GHG Measure Trolley bus
Flexibility within the network. Flexibility beyond the network
CO2eq g/km 500
is only possible using an auxiliary power unit or battery.
NOx g/km 0
High performance on acceleration
PM10 g/km 0
Does not incorporate refuelling or recharging time in normal
Noise: Lower noise level than standard diesel buses operation (except when auxiliary power unit needs to be
(electric motors are quieter than combustion engines). recharged).
Similar to battery electric vehicles.
Refilling needed every few days; power supply for most
operations provided continuously through overhead network.
Energy consumption 2012: 1.80 kWh/km
Source: CIVITAS, Brno
Energy consumption 2030: 1.71 kW/km
Factors to take into consideration Trolley bus powertrain
Infrastructure
The availability of a tram network could lower the investment
Require an overhead wiring network (including transformers costs of a trolley bus overhead network .
and high voltage connections).
It is possible to use trolley buses with diesel engines, Fuel tank
combining the advantages from both powertrains; electricity
Engine and
Costs in the city centre and diesel outside the city. This could also periphery
lower the required investment costs for the overhead network. Generator and
■■ Indication purchase price: 400,000-450,000 euro per inverter
trolleybus Main disadvantages: trolley buses currently often cost Electric storage
■■ Indication of infrastructure construction cost: 1-1.5 mil- twice as much as conventional diesel buses due to low
lion euro/km production volumes. However, once economies of scale are E-motor
and inverter
■■ TCO 2012: 3.1 euro/km achieved the price will fall.
Intermediate
■■ TCO 2030: 3.4 euro/km gearbox
Main advantages: offer energy diversity, one of the Mechanical
cleanest available technologies. drive line
30 31Smart choices for cities Smart choices for cities
Clean buses for your city Clean buses for your city
DIESEL HYBRID: HYBRID/ELECTRIC
DIESEL HYBRID:
Two diesel hybrid bus technologies are currently available
on the market: parallel hybrids with electric and conventional
drives (small electric motor assists diesel motor), and serial
hybrid configuration with dominating electric system (full
electric motor powered by diesel generator). Currently the
HYBRID/ELECTRIC
trend is towards serial hybrid buses. Strong arguments for
serial hybrid include the much higher brake energy recovery,
possibility for zero emissions range, and better basis for
transition towards plug-in and fully electric buses.
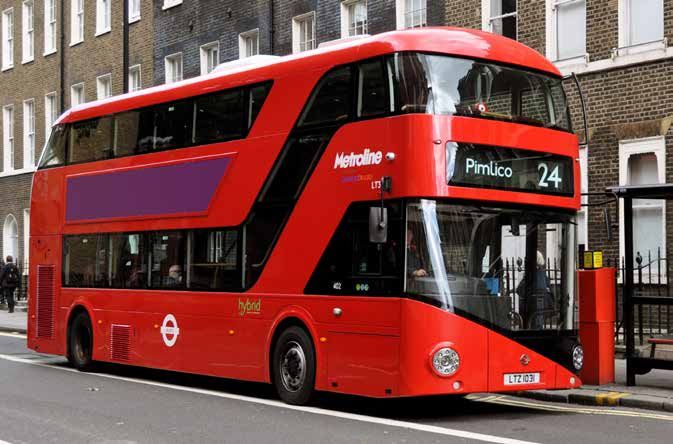
Figure 12. Diesel Hybrid bus
London’s new Routemaster hybrid double deck bus with three doorways and two staircases accommodates 80 passengers; September 16,
2013, at bus stop in Bloomsbury, London, UK. © Ron Ellis / Shutterstock.com
32 33Smart choices for cities Smart choices for cities
Clean buses for your city Clean buses for your city
Serial hybrid diesel/electricity bus
Conventional engine and e-generator unit produces full driving power. Fully electric driving Figure 13. Serial hybrid diesel/electricity bus
for smaller distances (Smart choices for cities Smart choices for cities
Clean buses for your city Clean buses for your city
HYDROGEN
HYDROGEN
Hydrogen is a fuel which uses electrochemical cells. Fuel cells Three types of bus technologies running on hydrogen are
convert the chemical energy of hydrogen into electric energy already available on the market: fuel cell engine without
to power the vehicle. Hydrogen can be formed either by battery, hydrogen internal combustion engine and combined
steam reforming in an industrial process, via conventionally hydrogen with electric battery. The first option for buses has
or renewably powered electrolysis or by conversion of been already used previously, but did not prove efficient
methanol. The overall emissions of hydrogen fuel therefore as it requires large fuel cells, leading to significant energy
depend on its production process. Today hydrogen fuel is consumption. The second option was tested by companies
not yet widespread but it is considered as one of the most such as BMW and MAN and did not prove to be feasible.
promising options for the future. The hybrid bus configuration of a fuel cell system and electric
drive is currently the most promising option with respect to
hydrogen buses. At the same time, this option is still in an
experimental stage and not yet in widespread use.
Figure 14. Hydrogen dispenser for vehicles.
© Mona Makela / Shutterstock.com
36 37Smart choices for cities Smart choices for cities
Clean buses for your city Clean buses for your city
Hybrid hydrogen fuel cell/electricity bus
Bus technology using serial hybrid configuration of fuel cell system and electric drive. Electric Figure 15. Hybrid hydrogen fuel cell/electricity bus Factors to take into consideration
battery is recharged while driving by recuperation (capacity typically ~20kWh); Hydrogen
Great potential due to the availability of the resources.
tank pressure typically 350 or 700 bar Hydrogen fuelling stations are relatively scarce in Europe but
new stations are being built mainly in Germany, Italy and
Operational performance Scandinavian countries. In 2012 there were approximately
Emissions
58 refuelling stations under operation in Europe, mostly
Range: 200-400 km (depends on tank size of hydrogen) in Germany. Approximately 30 additional stations will be
built by 2015 throughout Europe. Some 90% of the existing
GHG Measure Hydrogen High flexibility in routes stations deliver less than 50 kg of hydrogen a day (HyRaMP,
2010).
CO2eq g/km 1500
Electric drive used for acceleration
NOx g/km 0 CO2 emissions from hydrogen buses highly depend on the
Refilling every day at the end of operation hydrogen production method.
PM10 g/km 0
Short refilling time: 10 min Main advantages: a renewable energy source with good
Noise: Hydrogen fuel cell: standing 63 dB; pass-by 69 dB potential for production.
Energy consumption 2012 (based on test fleets):
3.2 kWh/km Source: Presentation: F. van Drunen (GVB) at ZE bussen, Ams- Main disadvantages: safety concerns as hydrogen is
terdam, 25-6-2013 highly flammable.
Energy consumption 2030: 2.72 kWh/km
Hydrogen fuel cell hybrid powertrain
Infrastructure
Requires specific filling infrastructure that includes specific
equipment in fuelling stations and supply infrastructure.
High pressure/
Hydrogen fuelling stations are relatively scarce in Europe but storage system
new stations are being built, mainly in Germany, Italy and BOP and
Scandinavian countries. periphery
Other fuel cell
Fuel cell stack
Costs
Electric storage
■■ Indication purchase price: 800,000 Projections based
E-motor
on the test fleet and inverter
■■ TCO 2012 4.6 euro/km Intermediate
■■ TCO 2030 3.2 euro/km gearbox
Mechanical
Fuelling and supply infrastructure are very expensive. drive line
Very high maintenance cost
38 39Smart choices for cities Smart choices for cities
Clean buses for your city Clean buses for your city
Comparing different bus options
Appropriate bus options for a city will depend on a range One of the main advantages of the diesel bus is its long
of factors: size of the city, existence of a certain type of term history of implementation, well known operational
infrastructure (e.g. trolley network), budget available, overall performance and significant availability in Europe with
WHICH ENERGY
city policy on reduction of CO2 emissions, local pollutants necessary fuelling infrastructure. Diesel/electric hybrid buses
and noise. Comparison of different energy carriers for your have been in production for a number of years already and
bus according to the set of criteria will help you in selecting are starting to find a niche in some European countries.
one of the most appropriate solution for your city. Trolley buses have been in operation for decades and are
considered to be in a very mature technology stage. Tests are
CARRIER TO CHOOSE
being conducted on hydrogen fuel cell and fuel cell hybrid
Comparison technology, infrastructure and buses since the late 1990s with the latest technologies still
operational performance in experimental stage. Electric buses are being deployed
around the world and have been in commercial service
All described technologies are in different maturity stages. for about two years. This is constantly evolving technology
FOR YOUR BUS?
Table 2 gives an indication on bus comparison according to and the newest applications are currently being trialled
various operational parameters. More detailed comparison throughout Europe.
of bus technologies on the variety of indicators is provided
in Annex 1. A variety of bus technology options running on alternative
to diesel fuel is currently available on the market (Figure 4).
Table 2. Comparison of bus technologies on some operational characteristics
Fossil fuel Biofuel Electricity Hydrogen Hybrid
Hybrid hydrogen/
electricity/diesel
Serial hybrid
FAME B100
Opportunitiy
HVO B100
Bus technology/energy source
Bio-methane
Bioethanol
Overnight
Euro VI
Euro V
electric
CNG
Trolley
Fuel caracteristics
Renewable/not
Energy security
Operational performance
Range, km
Zero emission range, km
Route flexibility
Infrastructure
Current market penetration
Source: TNO, where green represent the highest characteristics/performance within an indicator, red the less optimal option and
orange the option in between.
40 41Smart choices for cities Smart choices for cities
Clean buses for your city Clean buses for your city
All fuel types, expect fossil fuels are a-priory renewable fuel infrastructure in Member States. The Commission ■■ WTT (Well to tank) refers to CO2 emissions emitted dur- Comparison economy
fuels and in the case of energy shortage present a viable obligates the Member States to develop an action plan and ing fuel/electricity production and distribution.
alternative to diesel and CNG buses. The current availability sets a target for electric vehicle charging points to be met by Cost estimates presented in this report are only indicative
of these fuels differs significantly from electricity in that they Member States. This step can also impact the municipalities’ ■■ WTW (Well to wheel) refers to CO2 emissions produced and can vary from country to country (especially with respect
represent the most secure renewable energy source options. decision in favour of certain bus technologies. during fuel/electricity production, distribution and vehi- to operational costs which depend on fuel taxes, labor costs,
cle use. etc). Their main purpose is to give a basis of comparison
Almost all of the buses have a comparable operational between the regular Euro VI diesel bus technology and buses
performance. All, expect e-buses, offer a daily range of Comparison emissions In the case of biofuel, electricity and hydrogen it is also operating on alternative sources. Total Cost of Ownership
more than 300km, which is usually what is required for the important to consider that the total produced emissions (TCO) analysis takes into account all capital costs that accrue
medium sized European city. Refuelling/recharging time A clear understanding of the differences between CO2 depend on the production and distribution of their fuel/energy to the bus owner during the expected life cycle of the vehicle.
varies in general from 5 to 10 minutes, with only overnight emissions contributing to the global warming and local carrier. The experts distinguish Tanks to Wheels and Well to TCO includes the retail price, fixed and running costs.
e-bus requiring several hours for recharging (3-5 hours pollutant emissions (NOx, PM10) that impact on air quality Tank emissions that together form Well to Wheel emissions.
depending on battery type). Trolley buses are bound to the is necessary. For example, buses running on FAME perform Therefore for these sources sometimes a wider range of Table 4 gives an indication on the comparison of bus
overhead network and do not need recharging time during better in reducing CO2 but can increase local emission level. possible emissions reductions is indicated. For example, technologies by cost. A more detailed comparison is
normal operation. Operating range in purely electric mode On the other hand, CNG buses have no advantage on CO2 electric and hydrogen buses emit zero TTW emissions, but provided in Annex 1.
(which is very important from an emission reduction point of reduction, but considerably decrease local pollutants. In considering the emissions necessary for production and
view) depends significantly on bus technology, trolley bus, general, Euro VI diesel buses provide significant improvement distribution of electricity (WTT), in general CO2 emissions Buses running on fossil fuels and biofuels are the least
and hydrogen fuel cell, with parallel hybrid buses offering on CO2 and local emissions, decreasing the difference in (WTW) will vary from 0 to 500 g/km. Municipalities looking expensive currently available technologies. CNG and
the highest performance values. emissions with other alternative fuel options. Running on the to maximise reduction of emissions are advised to ask for the bioethanol buses have a relatively low purchase price but
regular diesel is becoming increasingly cleaner. The most Clean fuel certificates from the fuel/electricity suppliers or require high investment in fuelling infrastructure. The price
Diesel buses benefit from higher European availability with environmentally friendly bus fleets are those running on decarbonise their electricity grid. of an electric bus can be twice as much the price of a diesel
the fuelling infrastructure. This is also beneficial for the buses electricity, providing zero local emissions and reducing CO2 bus (from 30 to 100% higher of diesel Euro V bus price) and
running on biofuels and CNG, as only small modifications emissions to 50-100% compared to diesel values. Table 3 gives an indication on the comparison of is highly dependent on the price of electric battery. Hybrid
are necessary in order to adapt fuelling infrastructure to environmental friendliness of different bus technologies. hydrogen buses currently represent the most expensive bus
those needs. The European Commission recently published a ■■ TTW (Tanks to wheels, or tailpipe CO2 emissions) refers More detailed comparison is provided in Annex 1. technology from the options presented.
proposal for a Directive on the development of an alternative to CO2 emissions produced directly by vehicles.
Table 3. Comparison of bus technologies on their environmental performance Table 4. Comparison of bus technologies by economic performance
Fossil fuel Biofuel Electricity Hydrogen Hybrid Fossile fuel Biofuel Electricity Hydrogen Hybrid
Serial Hybrid electricity/diesel
Serial hybrid electricity/diesel
Hybrid hydrogen/electric
Overnight charging
Hybrid hydrogen/
Bus technology/energy source Bus technology/energy source
Euro VI diesel
FAME B100
Euro V diesel
HVO B100
Opportunitiy
FAME B100
Bio-methane
Opportunitiy
HVO B100
Bioethanol
Bio-methane
Trolley bus
Bioethanol
Overnight
electric
CNG
Euro VI
Euro V
CNG
Trolley
CO2eq, g/km Indication purchase price, 1000 euros
NOx, g/km TCO 2012, euro/km
PM10, g/km TCO 2030, euro/km
Noise standing, dB
Additional infrastructure investment,1000 euros
Noise passing by, dB
Source: TNO, where green represents the cheapest option, red the most expensive option and orange an option in between.
Source: TNO, where green represent the most environmentally friendly option, red the less optimal option and orange an option in
between.
42 43You can also read