South Africa | Development Bank of Southern Africa (DBSA) 9 November 2016 - Commercialisation of Passenger Rail Agency of South Africa
←
→
Page content transcription
If your browser does not render page correctly, please read the page content below
Commercialisation of Passenger Rail Agency of South Africa
(PRASA) Energy Assets

South Africa | Development Bank of Southern Africa (DBSA)

9 November 2016
Commercialisation of Passenger Rail Agency of South Africa
     Project/Programme Title: (PRASA) Energy Assets

             Country/Region: South Africa

            Accredited Entity: Development Bank of Southern Africa

National Designated Authority: Department of Environmental Affairs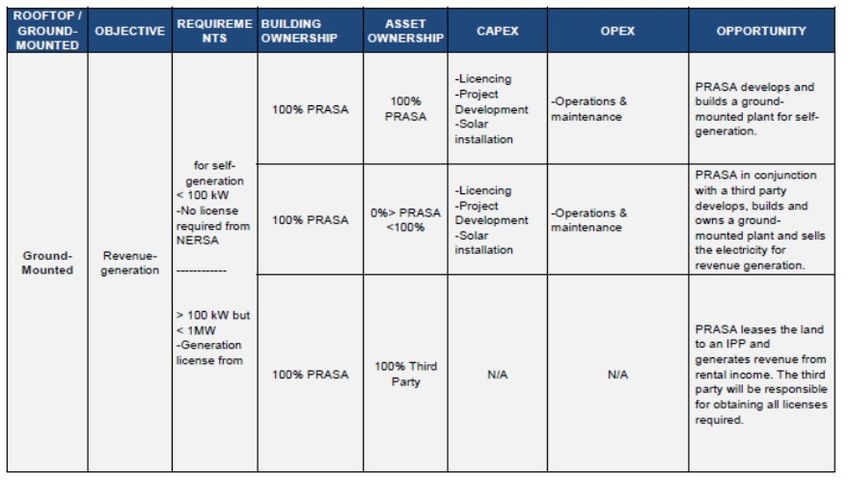
PROJECT / PROGRAMME CONCEPT NOTE
                                                                                              GREEN CLIMATE FUND | PAGE 1 OF 5

                               Please submit the completed form to fundingproposal@gcfund.org1

A. Project / Programme Information
                                   Commercialisation of Passenger Rail Agency of South Africa (PRASA) Energy
A.1. Project / programme title
                                   Assets
A.2. Project or programme          Project
A.3. Country (ies) / region        South Africa
A.4. National designated
                                   Department of Environmental Affairs
authority(ies)
A.5. Accredited entity             Development Bank of Southern Africa
                                   Executing Entity: Passenger Rail Agency of South Africa (PRASA) and its subsidiary
A.6. Executing entity /            Intersite Asset Investments
beneficiary
                                   Beneficiary:
A.7. Access modality               Direct ☒                   International ☐
A.8. Project size category         Micro (≤10) ☐     Small (10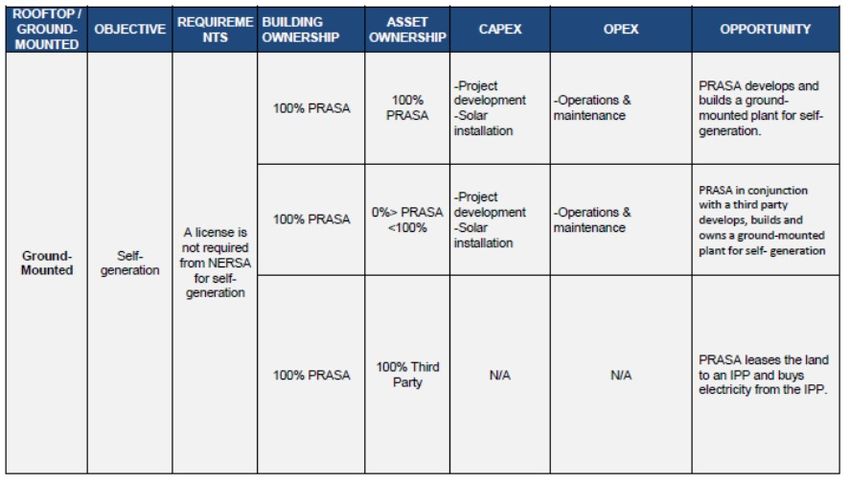
PROJECT / PROGRAMME CONCEPT NOTE
                                                                           GREEN CLIMATE FUND | PAGE 2 OF 5

B. Project/Programme Details
The Fund requires the following preliminary information in order to promptly assess the eligibility of
project/programme investment. These requirements may vary depending on the nature of the project/programme.
                    Introduction

                    In the economic outlook section of South Africa’s 2015 National Budget Review, the
                    Government acknowledged that electricity supply challenges will have major negative impact
                    on economic growth especially in the manufacturing, mining and export sectors, which scenario
                    has come to pass, Budget Review (2015). Growth of the South African Economy is expected to
                    slow, further compounded by the electricity crisis.

                    The South African electricity grid has been experiencing considerable strain since the start of
                    the rolling power black outs in January 2008. The construction delays of the country’s largest
                    power plants in Medupi (4800 MW) and Kusile (4800 MW) has exacerbated the situation.

                    It is in the above context that the state-owned Passenger Rail Agency of South Africa (PRASA)
                    through its subsidiary, Intersite Asset Investments SOC Limited (Intersite) identified an urgent
                    need to consider all energy options including improved energy efficiency and sustainable
                    energy sources such as renewables in order to carry out its primary mandate of providing rail
                    commuter services within the Republic of South Africa. This concept note discusses these
                    options in detail with the specific objective of developing and commercializing PRASA’s energy-
                    related assets such as rooftops and ground-mounted solar PV which have the potential to alleviate
                    PRASA’s huge energy costs while promoting climate mitigation. Gaps in this regard and the need
                    for project preparation funding support to develop a master plan among other key deliverables
                    have also been identified. The proposed initiative is also in line with PRASA’s secondary mandate
                    of generating income through the leverage and commercial exploitation of the assets acquired by
                    the PRASA Group.
B.1. Project /
programme           Background
description
(including          Since the beginning of 2000, South Africa has been progressively formulating policy and
objectives)         developing the environment for the development of renewable energy. Such efforts were being
                    driven by the need to diversify energy sources, address the challenge of increasing demand for
                    electricity, reduction of carbon emissions mostly from coal generation as well as the need to
                    ensure security of supply and access to energy. The electricity sector currently accounts for
                    almost half of the country’s greenhouse gas emissions.

                    South Africa’s electricity generation mix has remained fairly constant over the years, with
                    generation dominated by fossil fuel technologies. In addition to newly focused economic policies
                    at the dawn of democracy, the South African government initiated renewable energy policy and
                    energy policies to drive energy supply and access. The White Paper on Energy Policy was
                    released in 1998 with key policy objectives of:

                        •   Increasing access to affordable energy services;
                        •   Improving energy governance;
                        •   Stimulating economic development;
                        •   Managing energy-related environmental and health effects; and
                        •   Securing supply through diversity.

                    South Africa has huge potential for renewable energy which has for a long time remained
                    unexploited. Claims by the South African Wind Energy Association (SAWEA) indicate that
                    renewable energy through solar and wind could contribute 100 terra watt hours (TWh) of power
                    generation capacity (25 per cent of South Africa’s consumption by 2025). Government has set a
                    short to medium-term target of 10 000 GWh of renewable energy generation by 2013. In the long
                    term the country was expected to generate 17 800 MW by 2030.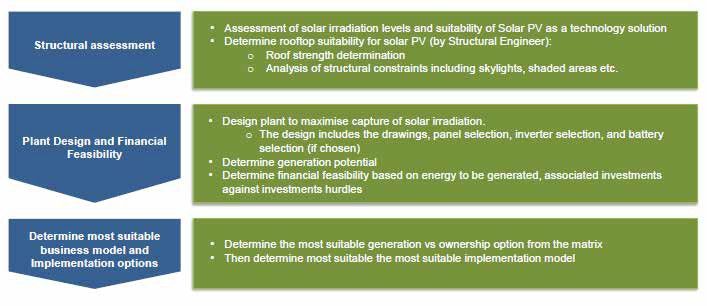
PROJECT / PROGRAMME CONCEPT NOTE
                                                          GREEN CLIMATE FUND | PAGE 3 OF 5

In 2003, the Department of Energy committed to 10,000 GWh from renewable energy by 2013
through the White Paper on Renewable Energy. This was meant to catalyse South Africa’s
agenda of shifting towards alternative/renewable energy sources. In 2010, the Government
issued a 20 year Integrated Resource Plan (IRP 2010) that would lead to the diversification of the
South African grid to include private sector participation.

Climate change mitigation and green economy strategies have also become government’s key
priority. The transition towards a green economy is evident in the roll-out of large scale grid
connected projects as well as small scale rooftop systems, which not only contribute towards a
reduction in greenhouse gas emissions, but also improve water availability and air quality.
Additionally, off-grid solar home systems, using photovoltaic panels, have been identified as the
preferred electrification technology in rural areas.

With this background in mind, an opportunity exists for PRASA to use its own land, buildings and
transport focused asset base alongside its rail networks to install ground mounted and rooftop
solar PV in conjunction with advanced energy storage technologies. Although train services
operate from a direct Eskom feed many of the peripheral services are typically affected by planned
and unplanned outages of electricity running off municipal supply including signalling equipment,
ticket sales offices and level crossing gates. According to the PRASA Group’s Annual Report the
energy cost for 2012 was R802 257 000 (1 USD: ZAR 8.4838) and was projected to be R925 410
000 (1 USD: ZAR 10.4678) in 2013. Energy generation for self-consumption has been
investigated for more extensive feasibility, piloting and upscaling by PRASA’s subsidiary, Intersite
Asset Investments as detailed below.

Project description and overall objectives

Intersite has the objective to raise additional revenue for PRASA by exploiting excess capacity in
its operational and non-operational assets, which range from development rights at key stations,
commercial and non-commercial buildings, landholdings and railway reserve to residential
properties. A high level assessment of the land available from PRASA indicated that at least 350
MW of Solar PV could potentially be developed in the short to medium term and in part through
commercial use and leveraging of assets by Intersite. Advanced energy storage can also be
deployed in order to provide security of supply with flexibility and dispatchibility of intermittent
renewables based generation. In addition to this, PRASA is in the process of implementing Energy
Efficiency measures including efficient lighting and HVAC systems.

In light of the above, the project’s strategic objectives include the following:

    •   Reduce operational costs through the use of more sustainable energy sources;
    •   Reduce greenhouse gas emissions (GHG) and carbon footprints;
    •   Integrate onsite renewable energy where viable
    •   Generate additional revenues from energy supply internally within PRASA (primarily)
        and externally outside of PRASA (secondarily);
    •   Improve PRASA’s operational performance through the use of reliable and
        sustainable energy sources; and
    •   Actively support and encourage local station area planning efforts with a focus on
        livable and sustainable economic development that creates local jobs and supports
        mode shift.
    •   Cultivate partnerships to increase sustainable economic development and job creation
        around stations and to encourage investments in renewable energy.

In order to realise the above strategic objectives, the project is in need of project preparation
funding support in relation to the development and use of renewable energy supported microgrids
with advanced energy storage to support PRASA’s operations ranging from rail to bus to real
estate. More specifically, a market opportunity exists for PRASA to use its rooftops, parking lots
and non-essential landholdings including servitudes where possible, to generate electricity for
own-use based on PRASA’s 585 stations distributed nationwide.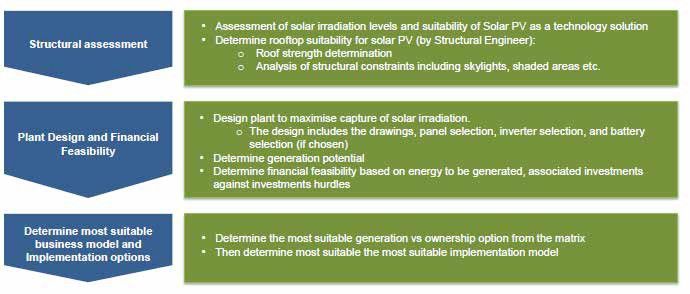
PROJECT / PROGRAMME CONCEPT NOTE
                                                         GREEN CLIMATE FUND | PAGE 4 OF 5

Project preparation requirements and key deliverables

Strategic Energy Master Plan and Evaluation report

Project preparation funding will assist Intersite in developing a Strategic Energy Plan which in
essence will also serve as an “Energy Master Plan” based on baseline studies for PRASA as
noted below. Onsite renewable energy integration is ideal due to the fact that the transmission
and distribution losses associated with renewable energy that is sited farther away from energy
consumption is avoided. Renewable energy should be integrated along servitudes and at stations
and facilities, where most viable. A detailed resource study is therefore paramount in order to
analyse the availability and viability of onsite renewable energy. This study would identify specific
technology and configuration options located onsite and within the designated servitudes and their
estimated costs for delivery to the grid and/or the PRASA Rail Electrification System. Other areas
that demonstrate potential for large-scale renewable energy generation for larger loads would be
identified and analysed further to determine the feasibility of joint investments with local
municipalities or other stakeholders. Integrating renewable energy technologies along the rail line
provides potential to make use of otherwise unusable space while at the same time assisting
PRASA in avoiding fair evasion by passengers. The detailed evaluation of sites along the rail
corridors would determine where renewable energy generation will be most viable. Mounting
structures for solar PV and technologies will vary depending upon the resources available,
therefore the resource studies needs to be discussed with design engineering team(s) to
determine where possibilities lie to ensure that renewable energy is incorporated along the
servitudes where operationally feasible. Integrating renewable energy technologies into station
and depot design requires additional actions to complement current design guidance. As with the
integration of renewable energy in the train system, detailed resource studies will need to be
conducted. Although it is envisaged that most systems will be building applied rooftop PV,
technologies such as building-integrated PV (BIPV) should be considered with designers, as well.
Ancillary technologies can be added to the buildings over time, but architects should plan for these
technologies during the design phase when it is often more cost effective to include needed
equipment for later installation of PV panels. In addition, buildings should be structurally sound to
support later integration of roof-mounted PV when later installation is likely to be desirable.
Findings will need to be consolidated into a strategic energy plan. The plan would be used to
guide detailed feasibility studies as noted below and also assist PRASA in finalising the delivery
model for the project.

The energy plan would likely have low, medium, and high cost estimates to provide a proper range
of analysis for Intersite to make sound decisions regarding onsite renewable energy placement.
In addition, the resource assessment would likely capture the rapidly decreasing cost of solar PV
and the effect of this decrease on the economics of onsite solar PV installations – especially for
facilities that will not be built for another 5-7 years. A cost/benefit analysis of joint investment
opportunities will therefore be required to provide a mechanism for a more accurate assessment
of renewable energy benefits by taking into account a wider range of benefits for PRASA and the
communities it operates within. It is envisaged that the resource studies and strategic master plan
will be funded through GCF project preparation support and PRASA while the feasibility studies
below development of a bankable implementation plan including an integrated financial model
would be co-funded by DBSA’s project preparation division.

Cost benefit analysis with detailed Financial Model

To guide the integration of onsite power production, there is a need for Intersite to develop and
adopt a customized cost/benefit analysis to consider both the upfront capital costs of renewable
energy integration and the long-term operational savings and other benefits. This may involve
setting an upper range of costs which PRASA would be able to absorb and to set a minimum pay-
back ratio regarding onsite renewable energy. In addition, Intersite would need to explore
partnerships with other stakeholders to increase capital that is available to invest in renewable
energy that makes sense on a larger scale and that is available onsite and along the servitudes.
The ability to include a wider range of benefits by involving a range of development opportunities
as well as the ability to spread some costs may allow for a much greater amount of renewable
energy to be sited at stations or along the rail system. Intersite will need to develop a Customized
Cost/Benefit Analysis for onsite renewable energy that identifies the limits of Intersite’s financing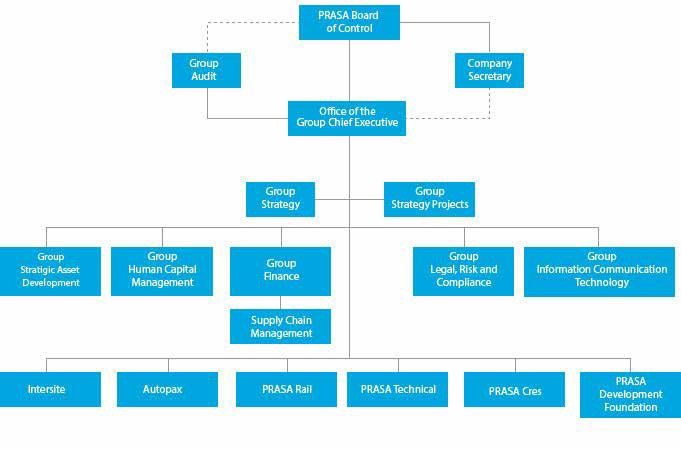
PROJECT / PROGRAMME CONCEPT NOTE
                                                           GREEN CLIMATE FUND | PAGE 5 OF 5

options. A customised cost/benefit analysis study can guide Intersite’s determination of how much
renewable power to use onsite and how much renewable power could be wheeled through the
power grid to other PRASA sites by demonstrating the economics of renewable power generation
and delivery.

Environmental and Social Impact Assessment (ESIA) and Assessment of Regulatory environment

Certain institutional and regulatory obstacles may present Intersite with challenges in achieving
specific energy goals. A comprehensive inventory of these obstacles is required, along with further
analysis to determine the impact on the Intersite project. Intersite needs to compile a
comprehensive inventory of regulations and their impacts on the project. A few examples of these
obstacles include:
• Applicable regulations for the PRASA high- voltage lines that are not covered by current codes
and standards.
• Standards for Embedded and Distributed Generation
• Wheeling agreement arrangements for power fed into the grid to be used at other PRASA
locations.

Once a list of institutional and regulatory obstacles has been compiled, these obstacles should be
ranked according to their likely impact. Those obstacles that have a high impact and a large
likelihood of occurring should be the top priorities for Intersite. This activity is analogous to a risk
assessment exercise and will allow Intersite to effectively address obstacles by creating a focus
around those that present the biggest potential of having a negative impact. Intersite will need to
engage key stakeholders such as utilities (Eskom/Municipalities), the National Energy Regulator
of South Africa (NERSA) and the Department of Energy to address currently identified barriers.
The preceding actions listed in this section may reveal additional obstacles that need to be
addressed. Intersite will need to coordinate with NERSA to address regulations around new
technologies (e.g. advanced energy storage). Environmental Impact Assessments at selected
sites will also be undertaken during the project preparation phase in the medium term.

By carefully designing the feasibility studies, Intersite can achieve several objectives that include:
1. Identifying onsite renewable energy potential,
2. Determining the likely economics of generation and delivery for renewable energy,
3. Identifying onsite options that warrant further studies (reliability analysis for behind the grid
applications), and
4. Identifying onsite options that present joint investment opportunities to lower Intersite’s initial
capital investment costs and increase the benefits to local communities (thereby creating a more
economically attractive option).
4. A national rollout plan and bankable business case

Project
 Scope of activities                   Funding partners           Timeline
 Strategic Energy Master Plan          GCF & PRASA                Feb 2017 to July 2017
 Finalisation of delivery model        GCF & PRASA                Feb 2017 to July 2018
Evaluation and appraisal Reports       GCF & PRASA                Feb 2017 to July 2017
 Feasibility studies                   GCF, DBSA & PRASA          July 2017 to Jan 2018
     -    Cost benefit analysis        GCF, DBSA & PRASA          July 2017 to Jan 2018
     -     Environmental   and         GCF, DBSA & PRASA          July 2017 to Jan 2018
          Social         Impact
          Assessments
     -    Regulatory assessments       DBSA & PRASA               July 2017 to Jan 2018
 National rollout plan                 DBSA & PRASA               June 2017 Jan 2018
PROJECT / PROGRAMME CONCEPT NOTE
                                                                             GREEN CLIMATE FUND | PAGE 6 OF 5

                    Describe project/programme sponsor’s operating experience in the host country or other
                    developing countries.

                    PRASA is established in terms of Section 22 of the Legal Succession to the South African
                    Transport Services Act on 2008 (as amended). It is a public entity wholly-owned by the
                    Government of South Africa and reports directly to the Minister of Transport. The legal mandate
                    directs PRASA to deliver commuter rail services in the Metropolitan areas of South Africa, long-
                    distance (inter-city) rail and bus services within, to and from the borders of the Republic of South
                    Africa. This mandate is implemented in consultation with and under the guidance of the Minister
                    of Transport.

                    Salient Features of PRASA include:
                        • Rail track: 2228 Kilometres of electrified rail tracks countrywide
                        • Train Stations: 585 countrywide
                        • Total Fleet: 1,311 motor coaches and 3424 trailer coaches = 4554
                        • Metrorail: 525 million passenger trips per annum
                        • MLPS: 1,082 million passengers per annum
                        • Autopax: 3,157 million passengers per annum | 553 buses

                    PRASA consists of five Business Units: Three divisions namely PRASA Rail (Metrorail and
                    Shosholoza Meyl), PRASA CRES, and, PRASA Technical; and Two subsidiaries namely Autopax
                    and Intersite Asset Investments.

                    Metrorail operates commuter rail services in urban areas, while Shosholoza Meyl operates
                    regional and intercity rail services. Autopax operates regional and intercity bus services, and
                    Intersite Asset Investments invests in the assets and opportunities within PRASA which includes
                    property, telecoms and energy assets.
B.2. Background
information on
project/programme
sponsor

                    As shown above, Intersite is a wholly owned subsidiary of PRASA and regulated under the Public
                    Finance Management Act (PFMA). The Directors on the Board are appointed in accordance with
                    the Companies Act, 2008 and in accordance with best practice. Intersite’s strength lies in the
                    make–up of its core staff members who possess and have developed the required skills and
                    expertise to execute the mandate. The team has a diverse mix of built environment specialists
                    [qualified engineers, town planners, quantity surveyors, project management skills], deal makers,
                    strategists, chartered accountant, qualified finance graduates, secretariat, and legal professionals
                    and investment specialist. Intersite is established to exploit commercial opportunities for PRASA
                    and to enable those activities to receive a singular focus rather than a dual focus of trying to run
                    operations as well as build up and increase commercial opportunities.
PROJECT / PROGRAMME CONCEPT NOTE
GREEN CLIMATE FUND | PAGE 7 OF 5
Describe financial status and how the project/programme sponsor will support the
project/programme in terms of equity, management, operations, production and marketing.
PRASA has an approved budget of 300,000,000 ZAR for renewable energy projects. It is
envisaged that this will be used to develop rooftop solar PV with advanced energy storage to
demonstrate various use cases throughout the business. Intersite seeks to leverage PRASA
assets, namely rooftops and landholdings, to provide a portion of the equity contribution required.
Intersite will also request allocation of additional budget to the 300M ZAR once the feasibility study
has proven the value of the programme to the business. Intersite has also allocated human
resources with competency in contracting operations and management of projects of a similar
nature to the energy commercialisation programme. Marketing will be handled as a function of
PRASA marketing activities in conjunction with Intersite.
Describe the market for the product(s) or services including the historical data and forecasts.
A recent solar PV baseline study completed in 2013, as part of the South African Solar PV
technology roadmap, concluded that the potential for rooftop solar between commercial, industrial
and residential is between 3.5 and 11.6 GW by 2035 (Source: Department of Energy, 2015). A
market opportunity exists for PRASA to use its rooftops, landholdings and parking lots where
possible, to generate electricity for own-use based on PRASA’s 585 stations distributed
nationwide. At Springs for example, 80 hectares out of 280 hectares have been earmarked for
ground mounted Solar PV used either for own-use or for revenue generation. Buildings and car
parks of the remaining 200 hectares have been earmarked for rooftop solar PV. This translates
to potentially a generation capacity of well over 90 MW costing in total R2bn. The Johannesburg
Park Station area presents energy exploitation opportunities on the station, Umjantshi House and
the yards to pilot the rooftop solar PV for own-use. Rooftop solar PV Projects are primarily installed
for own-use and an example of one of the largest proposed rooftop solar PV in SA will be in
Rustenburg (Waterfall Mall) with an installed capacity of 574kWp with an estimated annual
generation of 935,935 kWh. Rooftop PVs are relatively easier and quicker to install because of
associated NERSA requirements.
According to the PRASA Group Annual Report the energy cost for 2012 was R802 257 000 and
was projected to be R925 410 000in 2013. The table above is based on 2015 data. In view of the
possible cost trajectory, there is a significant opportunity to diversify the energy mix for both
ground mounted and rooftop solar PV in order to save operational costs.
B.3. Market Provide the key competitors with market shares and customer base (if applicable).
overview
Electricity generation dominated by state-owned power company Eskom, which currently
produces approximately 95% of the power used in the country. Eskom has a current nominal
installed capacity of 44,175MW. Through the Renewable Energy Independent Power Producers
Procurement Programme the Government is addressing electricity supply issues with
Independent Power Producers (“IPPs”). Eskom is part of Southern African Power Pool, a group
of utilities in the region aiming to create a common market for electricity in the region. Currently,
the transmission of electricity in South Africa is undertaken by Eskom. The company has over
28,000km of transmission lines spanning the entire country. Electricity distribution is the final
stage in the delivery of electricity to end users, currently undertaken by Eskom, together with 187
municipalities.
Provide pricing structures, price controls, subsidies available and government involvement (if
any).
The sharp decline of Solar PV prices coupled by increasing electricity costs makes it particularly
attractive and cheaper than grid electricity. The renewable energy electricity prices have been
declining since the inception of the REIPPP Programme in 2011. Solar started at an average of
over R3 per kWh and in Bid Window 4 it was less than R1 per kWh Wind started at just below
R1.50 per kWh and in Bid Window 4 it was close to R0.50, which is lower than Solar (Source:
SADC Renewable Energy & Energy Efficiency Report 2015).PROJECT / PROGRAMME CONCEPT NOTE
GREEN CLIMATE FUND | PAGE 8 OF 5
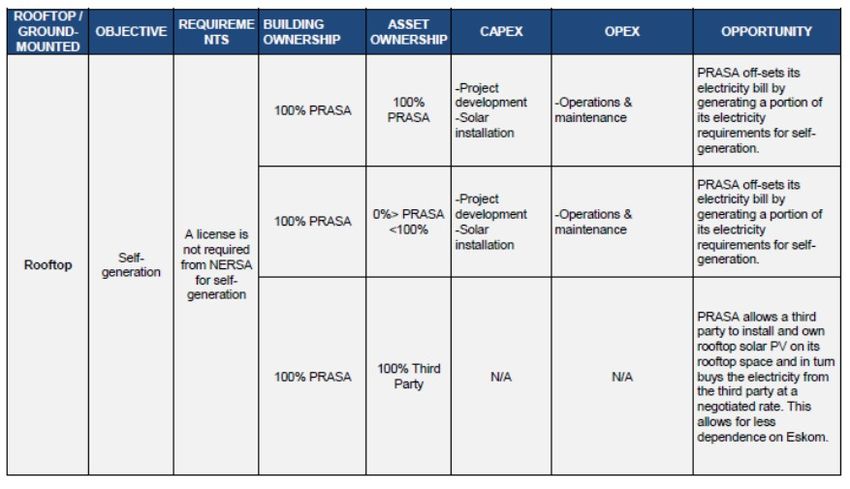
Provide details of government licenses, or permits required for implementing and operating the
project/programme, the issuing authority, and the date of issue or expected date of issue.
The figure below summarizes the South African regulatory requirements of different installed
capacities.
*Decentralised – proximity to user is very short, normally generated for own-use
**SSREIPPP –Small Scale Renewable Energy IPP Programme
B.4. Regulation, ***Centralised –proximity to user could be vast, normally generation for feeding into grid thus
taxation and transmission losses
insurance ****Renewable Energy IPP Programme
Generation Licencing:
• The Energy Regulations Act 2006 state that all electricity generators require a
generation licence, except for self-generation. The NERSA guidelines are silent on
generation which is less than 100kW.
IPP Status:
• The Energy Regulations Act 2006 state that all electricity generation in excess of 1MW
require an IPP Licence, except generation for own use.
• This is in addition to the generation licence requirement.
In February 2015, NERSA started consultation on the Small-Scale Embedded Solar
Generation which is smaller than 1MW installed capacity. Embedded Generation is defined as
“”an entity that operates one or more units that is connected to the Distribution System”. In July
2015, Treasury released a draft tax legislation for public comment. The draft legislation included
a proposal to amend the allowable depreciation for Solar from 50/30/20 over three years to 100%
on the first year. In January 2016, the 100% depreciation allowance was promulgated.
Describe applicable taxes and foreign exchange regulations.
Intersite Asset Investments is a Schedule 3B company as designated by the Public Finance
Management Act. Although Intersite is a public entity it is registered for VAT, and can charge
VAT on any goods or services supplied. As a Schedule 3 institution Intersite cannot open a bank
account abroad or with a foreign bank except with the written approval of the National Treasury.
Standard exchange control provisions will also apply.
Provide details on insurance policies related to project/programme.PROJECT / PROGRAMME CONCEPT NOTE
GREEN CLIMATE FUND | PAGE 9 OF 5
The various insurance coverage structures will be explored during the feasibility study. This will
be dependent on the ownership structure of the project. It is envisaged that each project will be
rolled out as a full wrap EPC. With that in mind the insurance costs during construction will be
the responsibility of the EPC company. During the operations phase there will be certain
insurance requirements for the O&M contractor.
Describe construction and supervision methodology with key contractual agreements.
Describe operational arrangements with key contractual agreements following the completion of
construction.
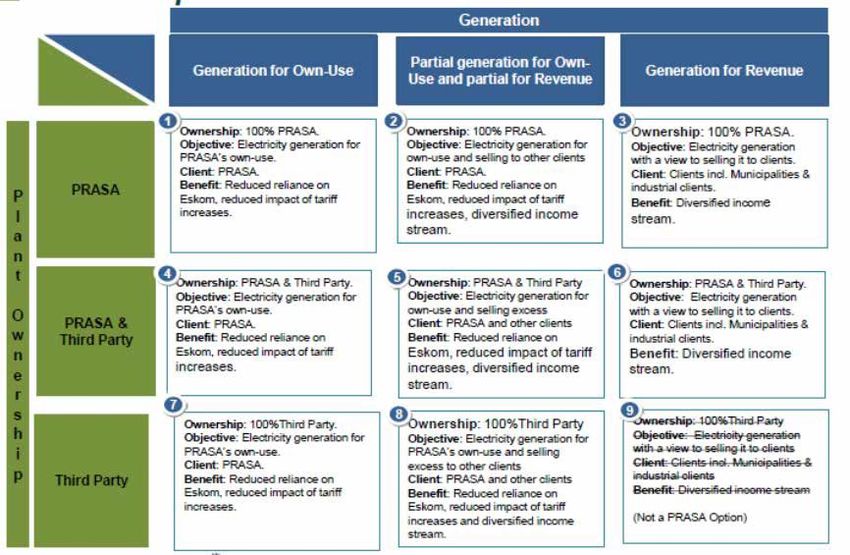
The figure below summarises possible operational arrangements for the national rollout after the
project preparation pilot phase is complete. The outcome of the feasibility study and finalisation
of the business case would dictate the most viable option for PRASA.
B.5.
Implementation
arrangementsPROJECT / PROGRAMME CONCEPT NOTE
GREEN CLIMATE FUND | PAGE 10 OF 5
Provide a timetable showing major scheduled achievements and completion for each of the
major components of the project/programme.
A detailed desktop study to determine solar PV potential as well as other energy sources will have
to be conducted in detail. Over a period of six months, the project will produce a detailed business
case and undertake energy efficiency audits at the selected pilot stations. In the medium term (6
-12 months), implementation of solar rooftop will be extended to additional sites at Springs and
Johannesburg Park Station. Long-term (> 12 months) implementation will focus on ground
mounted solar PV along with the national roll out of energy efficiency, rooftop and ground mounted
Solar PV. The broader scope of work will include land assessments, authorization and permitting,
plant design and financial viability, definition of a suitable business model and possible
implementation options. The figure below illustrates the high level implementation plan.PROJECT / PROGRAMME CONCEPT NOTE
GREEN CLIMATE FUND | PAGE 11 OF 5
C. Financing / Cost Information
Please provide:
• a breakdown of cost estimates analysed according to major cost categories.
• a financial model that includes projection covering the period from financial
closing through final maturity of the proposed GCF financing with detailed
assumptions and rationale;
• a description of how the choice of financial instrument(s) will overcome barriers
and achieve project objectives, and leverage public and/or private finance.
For the project preparation for Phases 1 and II we have estimated the total costs including
the studies listed in section B.1 to be ~45 000 000 ZAR.
Scope of activities Estimated costs Funding partners
Phase I of project preparation
Resource assessment, Strategic R15M (based on 1 GCF (R10M)
C.1. Description of Energy Master Plan, evaluation USD = 13.5 ZAR) PRASA (R5M)
financial elements of the report and finalisation of delivery
project / programme model
Feasibility studies R20M GCF (R10M),
DBSA (R5M)
PRASA (R5M)
- Cost benefit analysis R6M
- Environmental and R7M
Social Impact
Assessments
-Regulatory assessments R7m
and approvals
National rollout plan and R15M DBSA (R7.5M)
bankable business case PRASA (R7.5M)
At a high level we will also begin the process for strategic environmental impact
assessments. The total estimated costs for the national rollout and full implementation
across the country is ~R10.4 billion.
Financial
Amount Currency Tenor Pricing
Instrument
Total project
financing ………………… Options
(a) = (b) + (c)
(i) Senior Loans ………………… Options
C.2. (ii) Subordinated
Project ………………… Options ( 1 ) year
Loans N/A
financing ………………… Options
information (iii) Equity
………………… Options
(b) (iv) Guarantees
Requested ………………… Options
(v) Reimbursable
GCF amount
grants * ………1.5……… million
… USD ($)
(vi) Grants *
* Please provide detailed economic and financial
justification in the case of grants.PROJECT / PROGRAMME CONCEPT NOTE
GREEN CLIMATE FUND | PAGE 12 OF 5
Total Requested million
……1.5…………
(i+ii+iii+iv+v+vi) USD ($)
Financial Name of
Amount Currency Seniority
Instrument Institution
million
Grant …… 1.0…… USD ($) DBSA……… Options
(c) Co-
financing Grant … 1.3……… million PRASA Options
USD ($)
Options ………………… ………………… Options
Options
Options ………………… ………………… Options
Options
…………………
Lead financing institution: ………………………
(d)
Covenants
(e)
Conditions
Grant Funding approval and commitment from the DBSA project preparation unit
precedent to
disbursement
D. Expected Performance against Investment Criteria
Please explain the potential of the Project/Programme to achieve the Fund’s six investment criteria as listed below.
Specify the climate mitigation and/or adaptation impact. Provide specific values for
the below indicators and any other relevant indicators and values, including those
from the Fund’s Performance Measurement Frameworks.
• Total tonnes of CO2 eq to be avoided or reduced per annum
• Expected total number of direct and indirect beneficiaries and number of
beneficiaries relative to total population (e.g. total lives to be saved from
disruption due to climate-related disasters)
D.1. Climate impact potential Solar PV could contribute towards solving a meaningful chunk of the CO2 pollution
[Potential to achieve the problem for a country like South Africa with an electricity grid that has a great reliance
GCF's objectives and on coal for electricity production and is as a result one of the largest emitters of GHG
results] emissions.
The potential tonnes of CO2 that can be reduced per annum for the entire portfolio is
not yet quantified at this stage. However, the emissions reduction per MW can be
assumed to be the following based on the formula below.
CO2 direct = 1 385 X 0.94 = 1 385 X 25 X 0.94
1 385 X 0.94 = 1 385 X 25 X 0.94 = 32 574.5 tonnes CO2PROJECT / PROGRAMME CONCEPT NOTE
GREEN CLIMATE FUND | PAGE 13 OF 5
NB: Above estimates will be refined during the project preparation phase.
Provide the estimates and details of the below and specify other relevant factors.
• Potential for scaling-up and replication (e.g. multiples of initial impact size)
• Potential for knowledge and learning
• Contribution to the creation of an enabling environment
• Contribution to the regulatory framework and policies
The project will commence with selected sites in Gauteng. The portfolio will be scaled
D.2. Paradigm shift potential up to a minimum of 350MW around PRASA rail stations and land across the country
[Potential to catalyze subsequent to the initial “Phase 1” developments at Springs and Johannesburg Park
impact beyond a one-off Station. The project offers potential for learning through the pilot and demonstration
project or programme sites, and these will be used to inform scaling-up of the project
investment]
The project fully supports the development of renewable energy and particularly roof-
top solar PV which will contribute to the continued cost reduction due to economies of
scale.
The projected can also be replicated for the logistics rail transport infrastructure in the
South Africa (e.g. Transnet, Gautrain, etc.) and also other countries in sub-Saharan
Africa with similar infrastructure.
The project will offer multiple benefits that are linked to energy security, reduced import
dependency, reduction of greenhouse gas (GHG) emissions, improved health, job
creation, rural development, and energy access, stimulating economic growth and
development through employment creation and industrial development (new industry
development, SME development and localization), as well as stimulation of
downstream economic activity.
Provide the estimates of economic, social and environmental co-benefits. Examples
include the following:
D.3. Sustainable development
potential • Economic co-benefits
[Potential to provide wider - Total number of jobs created
development co-benefits] - Amount of foreign currency savings
- Amount of government’s budget deficits reduced
• Social co-benefits
- Improved access to education
- Improved regulation or cultural preservation
- Improved health and safety
• Environmental co-benefits
- Improved air quality
- Improved soil qualityPROJECT / PROGRAMME CONCEPT NOTE
GREEN CLIMATE FUND | PAGE 14 OF 5
- Improved biodiversity
• Gender-sensitive development impact
- Proportion of men and women in jobs created
A comprehensive analysis of the potential socio economic benefits will be carried out
as part of the feasibility study. We have noted that there is potential for localization of
various technologies as a result of this project. This will also be impacted by the
procurement strategy that is also currently underway.
Describe the scale and intensity of vulnerability of the country and beneficiary groups
and elaborate how the project/programme addresses the issues. Examples of the
issues include the following:
• Level of exposure to climate risks for beneficiary country and groups
• Does the country have a fiscal or balance of payment gap that prevents from
addressing the needs?
D.4. Needs of recipient • Does the local capital market lack depth or history?
[Vulnerability to climate • Needs for strengthening institutions and implementation capacity
change and financing
needs of the recipients] Due to its’ over reliance on coal for electricity generation, South Africa’s transition to a
low carbon economy requires serious effort. This is compounded by recent electricity
shortages which resulted in price increases as efforts to raise capital for electricity
infrastructure development are intensified. This solar PV project will contribute towards
a cleaner and sustainable source of electricity that is more affordable compared to other
very costly choices that have the potential negative impact with regard to the country’s
(or state owned entities) indebtedness
Provide details of the below and specify other relevant factors.
• Coherence and alignment with the country’s national climate strategy and
priorities in mitigation or adaptation
This initiative aligns with three Energy Strategic Integrated Projects (SIPs) out of the
18 SIPs of the South African Government’s National Infrastructure Plan, namely:
- SIP 8: Green energy in support of the South African economy;
- SIP 9: Electricity generation to support socio-economic development;
- SIP 10: Electricity transmission and distribution for all
D.5. Country ownership
[Beneficiary country It also aligns with Government’s conditional Copenhagen Accord greenhouse
ownership of project or gas (GHG) emission reduction commitments:
programme and capacity - 34% by 2020; and
to implement the proposed - 42% by 2025 below the business as usual emission trajectory
activities]
• Brief description of executing entities (e.g. local developers, partners and
service providers) along with the roles they will play
• Stakeholder engagement process and feedback received from civil society
organizations and other relevant stakeholders
The development and commercialisation of energy and energy-related assets flows
from the executing agency’s (PRASA) mandate and presents an opportunity for the
executing agency to benefit in South Africa’s agenda of shifting towards
alternative/renewable energy sources.
Engagement with key stakeholders still to be completed.PROJECT / PROGRAMME CONCEPT NOTE
GREEN CLIMATE FUND | PAGE 15 OF 5
Provide details of the below and specify other relevant factors (i.e. debt service
coverage ratio), if available.
•Estimated cost per t CO2 eq (total investment cost/expected lifetime emission
D.6. Effectiveness and reductions)
efficiency • Co-financing ratio (total amount of the Fund’s investment as percentage of
[Economic and financial project)
soundness and • Economic and financial rate of return
effectiveness of the - With the Fund’s support
proposed activities] - Without the Fund’s support
-
Co-funding ratio of 1:3 is envisaged with co-funding from the AE (40%) and other
funders (20%).
Economic and financial rate of return with the Fund’s support and without the Fund’s
support is still to be determined.
E. Brief Rationale for GCF Involvement and Exit Strategy
Please specify why the GCF contribution is critical for the project/programme.
The GCF contribution is key in leveraging and complementing the huge capital needs of a low-emissions programme
which contributes to the reduction in the use of fossil fuels in South Africa and greenhouse gas emissions. The programme
is being structured so as to provide a portion of the project preparation grant and debt financing for initial implementation
and subsequent roll-out of the programme to different sites. The latter will be blended with funding from other development
finance institutions to undertake a bankable feasibility study and undertake installation at identified sites for demonstration
and future replication and roll-out.
The programme is projected to reach financial sustainability as an offtake agreement will be concluded with PRASA and
the electricity generated will be used for own consumption by PRASA and excess sold to third parties. Self-generation
will complement or replace grid electricity and introduce some tariff savings. PRASA will also generate capacity to repay
debt advanced to it.
Please explain how the project/programme sustainability will be ensured in the long run, after the project/programme is
implemented with support from the GCF and other sources.
The numbers in the table below represent kilowatt-hours generated by a 1MW AC PV system with 1MWh of advanced
energy storage. The energy dispatch and financial modelling must still be completed in detail. We have also indicated
the potential savings a 1MWAC PV system with 1MWh of advanced energy storage can yield for PRASA. This is
shown in ZAR value over the life of the system.
Savings(Revenue) Less O&M Costs
05:00 06:00 07:00 08:00 09:00 10:00 11:00 12:00 13:00 14:00 15:00 16:00 17:00 18:00 19:00
Year Cummulative
January 60 583 670 850 830 810 700 590 400 190 530 500
R 1 204 869 R 1 204 869
February 30 563 690 880 790 760 700 600 410 200 520 500
R 1 273 546 R 2 478 415
March 0 563 710 880 810 810 740 590 390 150 500 500 R 1 346 138 R 3 824 553
April 0 563 680 890 880 830 740 580 340 40 500 500 R 1 422 868 R 5 247 422
May 0 503 680 910 890 850 740 560 300 0 500 500 R 1 503 972 R 6 751 394
June 200 343 620 700 910 850 740 560 310 500 500 R 1 589 698 R 8 341 092
R 1 680 311 R 10 021 403
July 200 343 620 720 960 910 790 610 320 500 500
R 1 776 089 R 11 797 491
August 200 523 710 770 970 920 810 640 360 510 500 R 1 877 326 R 13 674 817
September 20 643 810 1010 930 870 760 590 370 80 500 500 R 1 984 333 R 15 659 151
October 100 683 790 960 890 850 740 570 340 100 500 500 R 2 097 440 R 17 756 591
November 140 703 800 960 820 790 680 510 310 120 500 500 R 2 216 994 R 19 973 585
R 2 343 363 R 22 316 948
December 110 663 760 930 830 790 700 560 370 160 530 500
R 2 476 935 R 24 793 883
Off-Peak
Tariff R 2 618 120 R 27 412 003
Standard R 2 767 353 R 30 179 356
Peak R 2 925 092 R 33 104 448
R 3 091 822 R 36 196 271
R 3 268 056 R 39 464 327
R 3 454 335 R 42 918 662
R 3 651 233 R 46 569 895
R 3 859 353 R 50 429 248PROJECT / PROGRAMME CONCEPT NOTE
GREEN CLIMATE FUND | PAGE 16 OF 5
F. Risk Analysis
Please describe the financial and operational risks and discuss mitigating measures.
Please briefly specify the substantial environmental and social risks that the project/programme may face and the
proposed risk mitigating measures.
As this portfolio of projects is based on a PV solution we have listed the risk factors and mitigation measures in the table
below.
Risk Potential Effect Mitigation Measure
A. Technical
Performance of technology Lower yield = lower revenues Proven technology
Losses = lost MWh x tariff Quality components
Correctly dimensioned
Manufacturer warranties and
performance guarantees and
terms
Technical Lower yield = lower revenues Proven technology
Availability Losses = lost MWh x tariff Quality components
Correctly dimensioned
Manufacturer warranties and
performance guarantees and
terms O&M guarantees
Technical Reduced return from the Proven technology
Lifetime project Quality components
Correctly dimensioned
Manufacturer warranties and
performance guarantees and
terms O&M guarantees
Equipment defect / decreasing Lower yield = lower revenues Manufacturer warranties and
yield (degradation) Losses = lost MWh x ariff performance guarantees and
terms O&M guarantees
Reduced yield due to dusty Lower yield = lower revenues O&M guarantees
panels Losses = lost MWh x tariff
Connection to the grid fails Power cannot be evacuated Substation constructed with
project
Take-and-pay PPA.
Financial strength manufacturer Inability to fulfil warranties and Track record, financial strength
(low risk of default = capability to guarantees of mother company
fulfil guarantees)
Technological change Panels get much cheaper. Distrust of project cost,
Panels get much more efficient resentment by the utility and
users of electricity
B. Energy Resource
Variability of irradiation data Uncertain yield Use of different data bases, on-
site irradiation measurements
Quality of irradiation data Overestimation of yield Use of proven databases with
well correlated theoretical and
empirical data. Use of on-sitePROJECT / PROGRAMME CONCEPT NOTE
GREEN CLIMATE FUND | PAGE 17 OF 5
measurements.
Simulation Overestimation of yield Use of proven models. Use
Model of conservative P90 values.
C. Severe Weather Event
Lightning Strike Damage of Installation Use of technical protection
measures
Extreme Wind Conditions Damage of Installation Use of technical protection
measures
Extreme Temperatures Low Performance/Damage of Use of technical protection
Installation measures
D. Costs Forecasts
CAPEX Underestimates can lead to lack of The cost estimates to be based on
funds to complete the project recent quotes from the
manufacturer/suppliers. Fixed
price EPC.
Fixed OPEX Underestimates can lead to The cost estimates to be based
reduced cashflow on recent quotes from the O&M
contractor. Fixed price O&M
with escalation built-in into the
financial model.
Variable OPEX Underestimates can lead to The cost estimates to be based
reduced cashflow on the on-site conditions (dust,
wind rain etc.).
Maintenance Reserve Account Underestimates can lead to The cost of replacement to be
(inverter replacement) reduced cashflow build- in in to the financial model,
sufficient MRA to be envisaged
in the budget
E. Construction Risks
Cost overrun / adjustments Can lead to lack of funds to Fixed time and budget turnkey
complete the project contract (Engineering
Procurement and Construction
Contract (EPC)) Completion
Guarantees
Monitoring reports
Performance
reports Penalty
clauses
Project's budgeted costs will
include cost contingency funds
Equipment Delivery Delays Delay in completion, loss of Fixed time and budget turnkey
revenue, penalty for late contract (Engineering
completion under PPA Procurement and Construction
Contract (EPC)) Completion
Guarantees Monitoring reports
Performance reports Penalty
clauses
Transportation Price Cost overrun Fixed time and budget turnkey
contract (Engineering
Procurement and Construction
Contract (EPC)) Completion
Guarantees
Monitoring reports
Performance
reports Penalty
clauses
Completion delay / Non- Delay in completion, loss of Fixed time and budget turnkey
completion revenue, contract (Engineering
penalty for late completion under Procurement and ConstructionPROJECT / PROGRAMME CONCEPT NOTE
GREEN CLIMATE FUND | PAGE 18 OF 5
PPA Contract (EPC)) Completion
Guarantees
Monitoring reports
Performance
reports Penalty
clauses
Sub- contractors Sub-standard work Fixed time and budget turnkey
contract (Engineering
Procurement and Construction
Contract (EPC)) Completion
Guarantees
Monitoring reports
Performance
reports Penalty
clauses
Meeting Project specification Reduced performance Fixed time and budget turnkey
contract (Engineering
Procurement and Construction
Contract (EPC)) Completion
Guarantees Performance
guarantee
Monitoring reports
Performance
reports Penalty
clauses
Land availability Inability to construct the project Exclusive land lease
agreements with PRASA
and/or Local Government.
F. Off Take Risk
Demand / Price and Quantity Can lead to decreased project Long-term Off-Take- Agreement
income (PPA) take-and-pay
Lower yield = lower revenues
Losses = lost MWh x tariff
Tenor Reduced return from the Long term PPA – 20 years
project Signing a long term PPA and
Project Support Agreement with
the relevant State and Federal
authorities to counter the risk of
arbitrary changes of tariff,
accelerated taxes, regulations etc
Financial strength of purchaser Can lead to Credit enhancement,
lack of funds to continually Commercial and political
purchase the product insurance, undertaking from the
Government.
G. Financing Risks
Interest Rate volatility Increased interest payments, Fixed rate
lowering the DSCR Hedging
Financial Covenants
Currency Devaluation of currency in a Hedging
foreign currency loan will result Financial Covenants
in reduction of the ability to repay Market Flex
the loan PPA
Inflation High inflation can result in Fixed O&M
increase to increase of the O&M Hedging
costs
Refinancing Should the project returns Financial Covenants
Risk worsen, the refinancing on better
rates and conditions wouldPROJECT / PROGRAMME CONCEPT NOTE
GREEN CLIMATE FUND | PAGE 19 OF 5
become less attractive
Violation of Would result in default Financial Covenants
Terms Insurance
Syndication Risk of unsuccessful Overall risk mitigation
syndication would lead to not Attractive terms
sufficient funds to finance the Financial Covenants
project Market Flex
H. Permitting Issues
Land License/Leas e agreement Inability to construct the project Exclusive land lease
agreements with the Local
Government.
Environmental Approval The project has high Use of environmental
environmental impact protection measures
Safety The project not able to meet Use of stringent safety
Regulations the environmental/ safety protection measures
regulations
I. Environmental & Social Risks
Unacceptable environmental Protected territory, endangered Full Environmental and Social
impacts species, pollution etc. Impact Assessment ("ESIA") will
be performed as a part of the
FS&D process.
Use of stringent safety protection
measures. Environmental Action
Plan agreed and prepared.
Environmental impact during Pollution to the construction area Full Environmental and Social
construction and surroundings. Destruction of Impact Assessment ("ESIA") will
local habitat. be performed as a part of the
FS&D process.
Use of stringent safety
protection measures.
Environmental Action Plan
agreed and prepared.
Environmental impact of Visual impact. Disruption of local Full Environmental and Social
transmission lines construction habitat. Impact Assessment ("ESIA") will
be performed as a part of the
FS&D process.
Opposition by the local Delay in completion, loss of Social Programme contribution
community revenue. from each project to be
determined and defined in the
feasibility study.
Environmental impact of Visual impact. Disruption of local Full Environmental and Social
transmission lines construction habitat. Impact Assessment ("ESIA") will
be performed as a part of the
FS&D process.
Opposition by the local Delay in completion, loss of Social Programme contribution
community revenue. from each project to be
determined and defined in the
feasibility study..
J. Governance
Corporate governance Results in inefficient The Intersite and the
management, PR and operating company are
compliance issues guided by Intersite’s
corporate governance
principles
Project management Inefficient management, delays The project will be managed byPROJECT / PROGRAMME CONCEPT NOTE
GREEN CLIMATE FUND | PAGE 20 OF 5
and losses professional managers with
proven track record and under
best management practices
G. Multi-Stakeholder Engagement
Please specify the plan for multi-stakeholder engagement, and what has been done so far in this regard.
Key stakeholders include the National Energy Regulator of South Africa (NERSA), the Department of Environmental
Affairs and ESKOM. The team will engage with other role players during the implementation of the pilot phase. We are
also in the process of designing a multi-stakeholder engagement process for the rollout of this programme. Part of the
project preparation will include utilising electronically available information provided by the the United Nations
Development Programme UNDP relating to the design and implementation of multi-stakeholder engagement processes.
H. Status of Project/Programme
1) A pre-feasibility study is expected to be completed at this stage. Please provide the report in section J.
2) Please indicate whether a feasibility study and/or environmental and social impact assessment has been
conducted for the proposed project/programme: Yes ☐ No ☒
(If ‘Yes’, please provide them in section J.)
3) Will the proposed project/programme be developed as an extension of a previous project (e.g. subsequent phase),
or based on a previous project/programme (e.g. scale up or replication)? Yes ☐ No ☒
(If yes, please provide an evaluation report of the previous project in section J, if available.)
I. Remarks
The following will be undertaken as part of project preparation culminating in a strategic master-plan:
• The electricity consumption and cost data for Pilot Sites must be gathered and properly analysed.
• Both traction and non-traction data must be presented for analysis.
• Site specific assessments will be conducted to determine programme suitability and viability.
• Site specific technical measurements such as solar irradiation, wind speeds, gas availability would need to
be done.
• Finalise agreements for the proposed Roll out Plan.PROJECT / PROGRAMME CONCEPT NOTE
GREEN CLIMATE FUND | PAGE 21 OF 5
J. Supporting Documents for Concept Note
□ Map indicating the location of the project/programme
□ Financial Model
□ Pre-feasibility Study
□ Feasibility Study (if applicable)
□ Environmental and Social Impact Assessment (if applicable)
□ Evaluation Report (if applicable)You can also read