Infrastructure Corridor Development Series
←
→
Page content transcription
If your browser does not render page correctly, please read the page content below
INFORMATION AND COMMUNICATIONS TECHNOLOGY
AND DISASTER RISK REDUCTION DIVISION

Infrastructure Corridor Development Series:
Part III: Calculation Results for Determining the Most Promising
Scenario for Infrastructure Corridor Development

Vadim Kaptur

Aida Karazhanova

ASIA-PACIFIC INFORMATION SUPERHIGHWAY
WORKING PAPER SERIES JUNE 2021

Disclaimer: The views expressed through the Information and Communications Technology and
Disaster Risk Reduction Working Paper Series should not be reported as representing the views of
the United Nations, but as views of the author(s). Working Papers describe research in progress
by the author(s) and are published to elicit comments for further debate. They are issued without
formal editing. The shaded areas of the map indicate ESCAP members and associate members.
The designations employed and the presentation of material on this map do not imply the
expression of any opinion whatsoever on the part of the Secretariat of the United Nations
concerning the legal status of any country, territory, city or area or of its authorities, or concerning
the delimitation of its frontiers or boundaries. The United Nations bears no responsibility for the
availability or functioning of URLs. Opinions, figures and estimates set forth in this publication are
the responsibility of the authors and should not necessarily be considered as reflecting the views
or carrying the endorsement of the United Nations. Any errors are the responsibility of the authors.
Mention of firm names and commercial products does not imply the endorsement of the United
Nations.
The Asia-Pacific Information Superhighway (AP-IS) Working Papers provide policy-relevant
analysis on regional trends and challenges in support of the development of the Asia-Pacific
Information Superhighway (AP-IS) and inclusive development. The findings should not be reported
as representing the views of the United Nations. The views expressed herein are those of the
authors. This working paper has been issued without formal editing, and the designations employed
and material presented do not imply the expression of any opinion whatsoever on the part of the
Secretariat of the United Nations concerning the legal status of any country, territory, city or area,
or of its authorities, or concerning the delimitation of its frontiers or boundaries.
Correspondence concerning this working paper should be addressed to the email: escap-
ids@un.org.

Contact:
Information and Communications Technology and Development Section
Information and Communications Technology and Disaster Risk Reduction Division
United Nations Economic and Social Commission for Asia and the Pacific
United Nations Building
Rajadamnern Nok Avenue
Bangkok 10200, Thailand
Email: escap-ids@un.org

                                                                                                                    Page 2 of 64
             Calculation Results for Determining the Most Promising Model for Infrastructure Corridor Development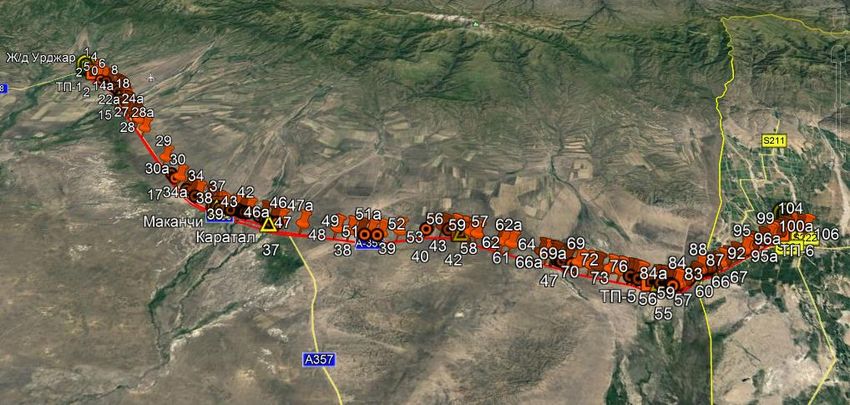
The Economic and Social Commission for Asia and the Pacific (ESCAP) is the most inclusive
intergovernmental platform in the Asia-Pacific region. The Commission promotes cooperation
among its 53 member States and 9 associate members in pursuit of solutions to sustainable
development challenges. ESCAP is one of the five regional commissions of the United Nations.

The ESCAP secretariat supports inclusive, resilient and sustainable development in the region by
generating action-oriented knowledge, and by providing technical assistance and capacity-
building services in support of national development objectives, regional agreements and the
implementation of the 2030 Agenda for Sustainable Development.

            The shaded areas of the map indicate ESCAP members and associate members.1

1 The designations employed and the presentation of material on this map do not imply the expression of any opinion whatsoever on
the part of the Secretariat of the United Nations concerning the legal status of any country, territory, city or area or of its authorities,
or concerning the delimitation of its frontiers or boundaries.
                                                                                                                             Page 3 of 64
                 Calculation Results for Determining the Most Promising Model for Infrastructure Corridor Development
Please cite this paper as:
Vadim Kaptur and Aida Karazhanova, (2021).
Infrastructure Corridor Development Series About the author: Dr. Vadym Kaptur, ESCAP
Part III: Calculation Results for Determining Consultant and Vice Rector of the A.S. Popov
the Most Promising Model for Infrastructure Odessa National Academy of
Corridor Development. United Nations
Telecommunications (ONAT), Ukraine and
ESCAP, IDD, July 2021r. Bangkok.
Ms. Aida Karazhanova, Economic Affairs
Available at: http://www.unescap.org/kp Officer, IDD, ESCAP.
June 2021
Tracking number ESCAP / 5-WP / 15
Acknowledgments
Under the guidance of Tiziana Bonapace, The ESCAP Secretariat expresses gratitude to
Director, Information and Communications the following scientific and technical
Technology and Disaster Risk Reduction consultants from A.S. Popov ONAT, Ukraine:
Division (IDD) of the United Nations Economic Olena Kniazieva, Volodymir Baliar, Iryna
and Social Commission for Asia and the Tymchenko, Elena Mazurkiewicz, Lubov
Pacific (ESCAP), the English and Russian Terletska, Tamara Kancur and Bohdana
versions of this Infrastructure Corridor Yamniuk; and to Bekhzod Rakhmatov of the
Development Series were prepared by Vadym Transport Division of ESCAP and Anna
Kaptur, ESCAP Consultant and Vice Rector of Lobanova of the Energy Division of ESCAP
the A.S. Popov Odessa National Academy of who also provided substantive inputs.
Telecommunications (ONAT), Ukraine and
Aida Karazhanova of IDD, ESCAP. Representatives of ministries, government
agencies, public and private organizations,
Substantive comments were provided by Tae operators, and nominated entities working in
Hyung Kim, Chief, Information and the sectors of information and
Communications Technology and communications technology and
Development Section (IDS) of IDD and Elena telecommunications infrastructure, road and
Dyakonova of IDS, IDD. Christine Apikul rail transport, electricity, and oil and gas
reviewed and edited the English version of the pipelines from Kazakhstan, Kyrgyzstan and
series. Sakollerd Limkriangkrai of IDS, IDD Mongolia reviewed this toolkit during a series
provided administrative support and other of training workshops organized in May 2021
necessary assistance to support the and were the first group to be trained on two
development of the series. web-based toolkits – the Infrastructure
Corridor Simulator and the Partnership Portal
on Co-deployment.
Page 4 of 64
Calculation Results for Determining the Most Promising Model for Infrastructure Corridor DevelopmentTable of Contents
Acknowledgments ...................................................................................................................... 4
List of Figures ............................................................................................................................ 6
List of Tables ............................................................................................................................. 7
Abstract ..................................................................................................................................... 8
Keywords ..................................................................................................................................10
Abbreviations and Acronyms ....................................................................................................12
1. Data Principles ..................................................................................................................13
1.1 Indicators for Simulation Modelling......................................................................................13
1.2 Principles for Determining the Characteristics of Economic and Technological Flows Along
Infrastructure Corridors .............................................................................................................18
1.3 General Principles and Data Sources for Forming Routes of Existing and Potential
Infrastructures ...........................................................................................................................38
1.4 General Principles and Data Sources for Labour and Material Costs for the Construction,
Reconstruction and Maintenance of Infrastructures ..................................................................43
2. Calculation Results for Determining the Most Promising Scenario for
Development of the Almaty–Cholpon-Ata Infrastructure Corridor .................................45
2.1 Determination of the Economic Efficiency of Scenario Implementation ...............................45
2.2 Identification of the Optimal Form of Partnership for Scenario Implementation....................49
3. Calculation Results for Determining the Most Promising Scenario for
Development of the Urzhar–Chuguchak Infrastructure Corridor ....................................51
3.1 Determination of the Economic Efficiency of Scenario Implementation ...............................51
3.2 Identification of the Optimal Form of Partnership for Scenario Implementation....................55
4. Calculation Results for Determining the Most Promising Scenario for
Development of the Semey–Rubtsovsk Infrastructure Corridor .....................................57
4.1 Determination of the Economic Efficiency of Scenario Implementation ...............................57
4.2 Identification of the Optimal Form of Partnership for Scenario Implementation....................61
5. Conclusion .........................................................................................................................62
Page 5 of 64
Calculation Results for Determining the Most Promising Model for Infrastructure Corridor DevelopmentList of Figures
Figure 1: Algorithm for determining the characteristics of the economic and technological flows
along infrastructure corridors.....................................................................................................19
Figure 2: Subalgorithm identifying data in the absence of infrastructure or traffic ......................20
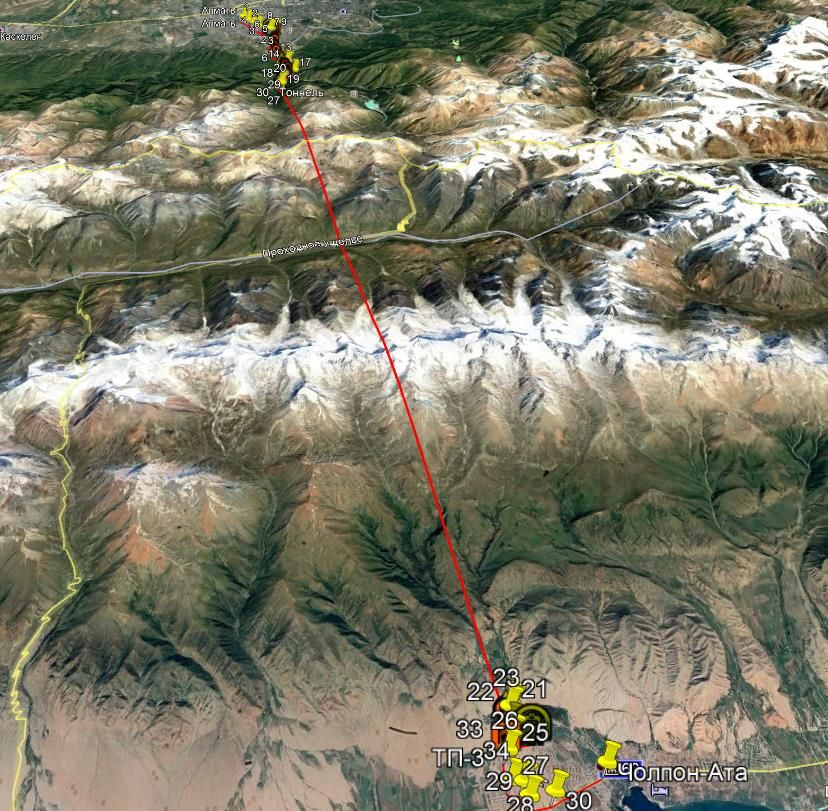
Figure 3: Routes along the Almaty–Cholpon-Ata infrastructure corridor ....................................39
Figure 4: Routes along the Semey–Rubtsovsk infrastructure corridor .......................................39
Figure 5: Routes along the Urzhar–Chuguchak infrastructure corridor ......................................41
Figure 6: Linear trend for payback of the road infrastructure along the Almaty–Cholpon-Ata
infrastructure corridor ................................................................................................................46
Figure 7: Scenarios’ CAPEX and expected income for the Almaty–Cholpon-Ata infrastructure
corridor .....................................................................................................................................47
Figure 8: Scenarios’ ratio of expected profitability to costs for the Almaty–Cholpon-Ata
infrastructure corridor ................................................................................................................48
Figure 9: Profitability of actions by scenario ..............................................................................52
Figure 10: Scenarios’ CAPEX and expected income for the Urzhar–Chuguchak infrastructure
corridor .....................................................................................................................................53
Figure 11: Scenarios’ ratio of expected profitability to costs for the Urzhar–Chuguchak
infrastructure corridor ................................................................................................................53
Figure 12: Profitability of actions by scenario ............................................................................58
Figure 13: Scenarios’ CAPEX and expected income for the Semey–Rubtsovsk infrastructure
corridor .....................................................................................................................................59
Figure 14: Scenarios’ ratio of expected profitability to costs for the Semey–Rubtsovsk
infrastructure corridor ................................................................................................................60
Page 6 of 64
Calculation Results for Determining the Most Promising Model for Infrastructure Corridor DevelopmentList of Tables
Table 1: Indicators and values used in calculations for determining the most promising
model for infrastructure corridor development ...........................................................................14
Table 2: Selection of assessment method based on the availability of data ..............................22
Table 3: Calculation for Example 1 – A straight highway along the Almaty–Cholpon-Ata
infrastructure corridor ................................................................................................................28
Table 4: Calculation for Example 2 – A fibre-optic communications line along the Almaty–
Cholpon-Ata infrastructure corridor ...........................................................................................29
Table 5: Calculation for Example 3 – A road along the Urzhar–Chuguchak infrastructure
corridor .....................................................................................................................................30
Table 6: Macroeconomic data of transport flows in Kazakhstan ................................................31
Table 7: Calculation for Example 4 – A railway along the Almaty–Cholpon-Ata infrastructure
corridor .....................................................................................................................................31
Table 8: Results of flow calculations .........................................................................................32
Table 9: Summary of information on existing and planned routes .............................................42
Table 10: Types of databases organized for calculations ..........................................................43
Table 11: Financial indicators by type of infrastructure along the Almaty–Cholpon-Ata
infrastructure corridor ................................................................................................................45
Table 12: Financial indicators of development scenarios for the Almaty–Cholpon-Ata
infrastructure corridor ................................................................................................................46
Table 13: Matrix of potential forms of partnership for development of the Almaty–Cholpon-Ata
infrastructure corridor ................................................................................................................50
Table 14: Financial indicators by type of infrastructure along the Urzhar–Chuguchak
infrastructure corridor ................................................................................................................51
Table 15: Financial indicators of development scenarios for the Urzhar–Chuguchak
infrastructure corridor ................................................................................................................52
Table 16: Matrix of potential forms of partnership for development of the Urzhar–Chuguchak
infrastructure corridor ................................................................................................................56
Table 17: Financial indicators by type of infrastructure along the Semey–Rubtsovsk
infrastructure corridor ................................................................................................................57
Table 18: Financial indicators of development scenarios for the Semey–Rubtsovsk infrastructure
corridor .....................................................................................................................................59
Table 19: Matrix of potential forms of partnership for development of the Semey–Rubtsovsk
infrastructure corridor ................................................................................................................61
Page 7 of 64
Calculation Results for Determining the Most Promising Model for Infrastructure Corridor DevelopmentAbstract
The Regional Economic Cooperation and three potential interstate infrastructure
Integration (RECI) initiative of the United corridors in the target countries of the RECI
Nations Economic and Social Commission for project (Kazakhstan and Kyrgyzstan); (2)
Asia and the Pacific (ESCAP) aims to promote provide knowledge and capacity building in
integrated markets for goods, services, determining the most promising model for
information and capital; infrastructure infrastructure corridor development; and (3)
connectivity; financial cooperation; and promote an enabling environment for
economic and technical cooperation through a infrastructure corridor development, including
multidimensional and multidisciplinary the co-deployment of ICT, transport and
approach. Promoting seamless connectivity in energy infrastructures.
transport, energy and information and
communications technology (ICT) is a central An infrastructure corridor approach is used as
pillar of the RECI initiative. an attractive smart solution to link the
geographical territories, and improve regional
As part of the RECI initiative, ESCAP is and transboundary connectivity. An
implementing a United Nations Development infrastructure corridor is a high-tech
Account Project on “Addressing the transportation system integrated with a wide
Transboundary Dimensions of the 2030 range of ICTs to facilitate the flow of goods,
Agenda for Sustainable Development through services, knowledge and capital in a cost- and
RECI in Asia and the Pacific” from 2018 to time-effective way towards achieving the 2030
2021. This project aims to develop knowledge Agenda for Sustainable Development.
products such as analysis reports, and build
capacity of member States in promoting This research paper is a part of the
seamless regional connectivity with a focus on Infrastructure Corridor Development Series
the co-deployment of ICT, transport and that supports decision makers and
energy infrastructures. infrastructure owners in their decisions on the
development of new infrastructure corridors.
Following the recommendations to national The Infrastructure Corridor Development
capacity building workshops for policymakers Series is divided into three main parts:
of Kazakhstan, Kyrgyzstan, Mongolia, and
subregional workshop for countries in East Part 1: An in-depth analysis of three
and North-East Asia in October-November promising infrastructure corridors.
2019, this analysis report is aimed to enhance Almaty (Kazakhstan) – Cholpon-Ata
understanding for planning interstate (Kyrgyzstan)
infrastructure corridors. The scope of this Semey (Kazakhstan) – Rubtsovsk
report covers in-depth analysis of the co- (Russian Federation)
deployment of ICT infrastructure along Urzhar (Kazakhstan) – Chuguchak (China)
transport and energy infrastructure corridors
and support identification of key needs and the Part 2: A toolkit for determining the most
selection of the priority projects. promising scenario for infrastructure
In response to the needs of member States corridor development.
and considering the complex challenges of
limited national and regional infrastructures, Part 3: Calculation results for determining
the most promising scenario for
the key objectives of this research are to: (1)
infrastructure corridor development.
provide in-depth cross-sectoral analysis of
Page 8 of 64
Calculation Results for Determining the Most Promising Model for Infrastructure Corridor DevelopmentThe co-deployment of the ICT
This is Part Three of the series that explains infrastructure with road infrastructure,
the principles for identifying the routes along and a separate deployment of the
the infrastructure corridors, and the principles energy infrastructure using the created
for building the databases on standard labour tunnel, however, is the most optimal
and material costs. The various scenarios for given the tourism potential of this
infrastructure corridor construction and infrastructure corridor. Even so, the
upgrade were reviewed and assessed with capital expenditure for the deployment
these principles to estimate the capital of the road infrastructure is significantly
expenditures, operating expenditures, high and the payback period is
potential income and indirect socioeconomic unacceptably long.
effects.
• For the Urzhar (Kazakhstan) –
The recommended scenarios for infrastructure Chuguchak (China) infrastructure
corridor development include the following for corridor, the co-deployment of energy
policymakers’ consideration: and ICT infrastructures with the railway
infrastructure.
• For the Almaty (Kazakhstan) –
Cholpon-Ata (Kyrgyzstan) • For the Semey (Kazakhstan) –
infrastructure corridor, the co- Rubtsovsk (Russian Federation)
deployment of the ICT infrastructure infrastructure corridor, the co-
with road or railway infrastructure, and deployment of the energy and ICT
a separate deployment of the energy infrastructures with the reconstruction
infrastructure using the created tunnel. or upgrade of the railway
These are optimal scenarios because infrastructure, since railway passenger
the road infrastructure carries 99.8 per traffic is a priority in this region.
cent of passenger traffic and the
railway infrastructure carries 94.6 per
cent of freight traffic, and they are
priority infrastructures in this region.
Page 9 of 64
Calculation Results for Determining the Most Promising Model for Infrastructure Corridor DevelopmentKeywords
Cash flow: The net amount of cash and cash equivalents transferred to and from businesses
(source: https://www.investopedia.com).
Co-deployment (infrastructure): The simultaneous deployment of cable ducts and/or fibre-optic
cables during the construction of infrastructure such as new roads, highways, railways, power
transmission lines and oil/gas pipelines (source: https://www.unescap.org).
Design process: A general set of steps that engineers use when creating telecommunications
network designs (source: https://www.wikipedia.org).
Discount factor: A factor used for discounting, that is, bringing the amount of cash flow to the n-
th step of a multi-step calculation of the efficiency of an investment project to a moment called the
moment of decline. The discount factor shows how much money is received, taking into account
the time and risk factors, the reduction of cash flow in the n-th year, based on a given discount
rate (source: http://1-fin.ru).
Electricity infrastructure / electrical grid: An integrated network for delivering electricity from
supplier to consumers (source: https://www.wikipedia.org).
Energy infrastructure: An organizational structure that allows large-scale transmission of energy
from supplier to consumer, as well as directs and controls energy flow. It includes, but is not
limited to, the oil and gas transportation infrastructure and the electricity transportation
infrastructure (source: https://www.designingbuildings.co.uk).
Fibre-optic communications line: A fibre-optic system consisting of passive and active
elements, designed to transmit information in the optical range (source:
https://www.wikipedia.org).
ICT infrastructure: The information and communications technology (ICT) infrastructure and
systems, including software, hardware, networks and websites (source:
https://www.lawinsider.com).
Inflation rate: A steady increase in the general level of prices for goods and services in an
economy over a period of time (sourсe: https://www.wikipedia.org).
Infrastructure corridor: A high-tech transportation system integrated with a wide range of ICTs
to facilitate the flow of goods, services, knowledge and capital in a cost- and time-effective way
towards achieving the 2030 Agenda for Sustainable Development (source:
https://www.unescap.org).
Infrastructure sharing: The sharing of real estate and fixed assets, including land, conduits,
ducts, manholes and handholes, base station sites, AC networks, trunk lines, radio links, and
other resources to avoid infrastructure duplication and reduce costs (source: author).
Net cash flow: The difference between the present value of cash inflow and the present value of
cash outflow over a period of time. This metric is used in capital budgeting and investment
Page 10 of 64
Calculation Results for Determining the Most Promising Model for Infrastructure Corridor Developmentplanning to analyse the profitability of projected investments or projects (source:
https://www.investopedia.com).
Road transport infrastructure: The road network and associated physical infrastructure, such
as road signs, roadway lighting and petrol stations (source: https://iea-etsap.org).
Transport corridor: A linear area that is defined by one or more modes of transport, such as
roads, railways or public transport that share a common route (source: https://www.wikipedia.org).
Page 11 of 64
Calculation Results for Determining the Most Promising Model for Infrastructure Corridor DevelopmentAbbreviations and Acronyms
AP-IS Asia-Pacific Information Superhighway
CAPEX Capital Expenditure
CNY Chinese Yuan
ESCAP Economic and Social Commission for Asia and the Pacific
EUR Euro
GBP British Pound
ICT Information and Communications Technology
IDD Information and Communications Technology and Disaster Risk Reduction
Division
IDS Information and Communications Technology and Development Section
KGS Kyrgyzstani Som
kWh Kilowatt-hour
KZT Kazakhstani Tenge
MB Megabit
ONAT Odessa National Academy of Telecommunications
OPEX Operating Expenditure
RECI Regional Economic Cooperation and Integration
RUB Russian Ruble
USD United States Dollar
Page 12 of 64
Calculation Results for Determining the Most Promising Model for Infrastructure Corridor Development1. Data Principles
1.1 Indicators for Simulation
Modelling
The data and indicators used for simulation
modelling to determine the most promising
model for infrastructure corridor
development can be divided into three
groups:
1. The technologies for construction,
upgrade or reconstruction, and
maintenance of various types of
infrastructure;
2. Primary information on the socioeconomic
aspects of the infrastructure corridors; and
3. Secondary information on the
socioeconomic aspects of the
infrastructure corridors.
The data sources for the first group were
technological standards, labour standards
for performing technological operations, and
the knowledge and experience of experts in
the relevant subject areas. The data sources
for the second and third groups were official
statistical data on the socioeconomic
aspects of the regions along the
infrastructure corridors, and other
information available in the public domain.
Due to limited data available in the public
domain, and the challenge of obtaining data
for a complete set of indicators for each
infrastructure corridor, the principle of
extrapolation and averaging of data was
used to form the values used in the
calculations. In this case, more accurate
calculations could be made by detailing all
the required values.
A complete list of all indicators used for
calculations, their threshold (maximum and
minimum) values, the default value used in
the simulation model, and justification for
these values are given in Table 1.
Page 13 of 64
Calculation Results for Determining the Most Promising Model for Infrastructure Corridor DevelopmentTable 1: Ind ica to r s a n d va lue s u se d in ca lcu la tio n s fo r d e te rm in ing the m o st p r om isin g mo de l fo r in fr a str u ctu re
co r r id o r d e ve lopme n t
Minimum Maximum Default
№ Indicator Unit Justification
value value value
General characteristics of the infrastructure corridor
Statistical data.
For example, Almaty: population of 1,916,8222 / average
Number of households in the
household size of 2.83 people = 684,579 households.
region covered by the Number of
1 0 1,000,000 50,000 Cholpon-Ata: population of 13,9134 / average household
infrastructure corridor households
size of 3.65 people = 3,865 households.
(average for the period)
In total: 684,579 + 3,865 = 688,444 households, including
Almaty and Cholpon-Ata neighbouring districts
Statistical data.
Average income per
2 USD per year 0 10,000 6,000 For example, average income of one household in
household per year
Kazakhstan: KZT1,579,0006 (USD1,375.297)
Statistical data.
Number of business units in
For example, Almaty: number of active corporate bodies is
the region covered by the Number of business
3 0 1,000,000 400 16,597.8 Cholpon-Ata: 5099 (industry), 1,28910 (trade,
infrastructure corridor units
including services).
(average for the period)
In total: 16,597 + 509 + 1,289 = 18,395 business units
4 Payback period Years 0 20 5 Kazakhstan: 8 years11
2 Алма-Ата. Население. Available at https://ru.wikipedia.org/wiki/%D0%90%D0%BB%D0%BC%D0%B0-
%D0%90%D1%82%D0%B0#%D0%9D%D0%B0%D1%81%D0%B5%D0%BB%D0%B5%D0%BD%D0%B8%D0%B5.
3 Алматы в цифрах. Available at https://kapital.kz/gosudarstvo/52581/almaty-v-tsifrakh-v-gorode-zhenshchin-na-146-tysyach-bol-she-chem-muzhchin.html.
4 Национальный статистический комитет Кыргызской Республики. Available at http://www.stat.kg/ru/statistics/naselenie/.
5 Сколько человек в семьях Кыргызстана. Available at https://ru.sputnik.kg/infographics/20181129/1042204610/kyrgyzstan-infografika-statistika-nacionalnyj-statisticheskij-komitet-semya-
naselenie.html.
6 Сколько зарабатывает в среднем казахская семья. Available at https://kursiv.kz/news/finansy/2019-09/skolko-zarabatyvaet-v-srednem-kazakhstanskaya-semya.
7 Курс тенге к доллару по состоянию на февраль 2021 года. Available at
https://www.google.com/search?q=%D0%BA%D1%83%D1%80%D1%81+%D1%82%D0%B5%D0%BD%D0%B3%D0%B5+%D0%BA+%D0%B4%D0%BE%D0%BB%D0%BB%D0%B0%D1%80%
D1%83&oq=%D0%BA%D1%83%D1%80%D1%81+%D1%82%D0%B5%D0%BD%D0%B3%D0%B5+%D0%BA+%D0%B4%D0%BE%D0%BB%D0%BB%D0%B0%D1%80%D1%83+&aqs=chrome
..69i57j0l9.4929j1j9&sourceid=chrome&ie=UTF-8.
8 Статистика предприятий. Available at https://stat.gov.kz/official/industry/13/statistic/7.
9 Малое и среднее предпринимательство. Available at http://www.stat.kg/ru/statistics/maloe-i-srednee-predprinimatelstvo/.
10 Число предприятий торговли. Available at http://www.stat.kg/ru/opendata/category/77/.
11 За какой срок окупаются строящиеся заводы в Казахстане. Available at https://forbes.kz/news/2017/08/23/newsid_153133.
Page 14 of 64
Calculation Results for Determining the Most Promising Model for Infrastructure Corridor DevelopmentKyrgyzstan: 15 years12
Kazakhstan: 12%13
5 Value-added tax rate % 0 30 20
Kyrgyzstan: 12%14
Kazakhstan: 20% (for certain types of business –10% and
15
6 Income tax rate % 0 30 20 15%)
Kyrgyzstan: 10%16
Kazakhstan: 9%17
7 Cash discount ratio % 0 50 10
Kyrgyzstan: 5.5%18
Characteristics of economic and technological flows
Statistical data.
Passenger-kilometres For example, the population of Rubtsovsk is 0.009%19 of
1 Passenger traffic 0 1,000,000 50,000
per hour the Russian Federation population, and total passenger
traffic is 155.4 million20 × 0.009% = 0.014 million
Statistical data.
Ton-kilometres per For example, the population of Rubtsovsk is 0.009%21 of
2 Freight traffic 0 1,000,000 100,000
hour the Russian Federation population, and total freight traffic
is 18,250.1 million tons22 × 0.009% = 1.6 million tons
Statistical data.
For example, the population of Rubtsovsk is 0.009%23 of
3 Energy flow Kilowatt-hour 0 1,000,000 100,000 the Russian Federation population, and total electricity
consumption is RUB24,704.4 million24 =
USD331.04 million × 0.009% = USD0.029 million
12 9 причин, почему инвестиции в Кыргызстане сопровождаются скандалами . Available at
https://kaktus.media/doc/332083_regnum:_9_prichin_pochemy_investicii_v_kyrgyzstane_soprovojdautsia_skandalami.html.
13 Ставка НДС с 1995 по 2020 год. Available at https://uchet.kz/stavki/NDS.
14 Налог на добавленную стоимость. Available at https://sti.gov.kg/docs/default-source/other/nds.pdf?sfvrsn=2.
15 Ставки налогов и социальных платежей на 2020 год. Available at https://online.zakon.kz/Document/?doc_id=32469577#pos=20;-58.
16 Налоговый кодекс Кыргызской Республики. Available at https://online.zakon.kz/document/?doc_id=30355506&doc_id2=30355506#pos=263;-86&pos2=3334;-98.
17 Официальные ставки Национального Банка Республики Казахстан. Available at https://online.zakon.kz/document/?doc_id=1016416#pos=1472;-53.
18 Учетная ставка НБКР. Available at https://www.nbkr.kg/index1.jsp?item=123&lang=RUS.
19 Федеральная служба государственной статистики. Available at https://rosstat.gov.ru/folder/12781.
20 Транспорт. Available at https://gks.ru/region/docl1101/IssWWW.exe/Stg/d1912/ii/1/1.5.htm; and Основные экономические и социальные показатели. Available at
https://gks.ru/region/docl1101/IssWWW.exe/Stg/d1912/i.htm.
21 Федеральная служба государственной статистики. Available at https://rosstat.gov.ru/folder/12781.
22 Основные экономические и социальные показатели. Available at https://gks.ru/region/docl1101/IssWWW.exe/Stg/d1912/i.htm.
23 Федеральная служба государственной статистики. Available at https://rosstat.gov.ru/folder/12781.
24 Федеральная служба государственной статистики. Available at https://rosstat.gov.ru/folder/11189.
Page 15 of 64
Calculation Results for Determining the Most Promising Model for Infrastructure Corridor DevelopmentStatistical data.
For example, the population of Rubtsovsk is 0.009%25 of
4 Information flow Gigabits per second 0 100,000 100 the Russian Federation population, and total consumption
of data services is RUB360.0 million26 = USD4.82 million
× 0.009% = USD434
Share of household Statistical data.
5 expenditure on services of a % 0 50 5 For example, the share of household expenditure on
particular flow transport in the Russian Federation is 16.1%27
Average cost of business
Statistical data.
units, social facilities and
6 USD per year 0 100,000 1,000 For example, large enterprises in Kazakhstan consume on
local government entities for
average 2,000 million kWh per year28
services of a specific flow
Average volume of service
For example, average annual communications cost of
7 use of a specific flow by USD per year 0 1,000 10
residents in Kazakhstan is KZT2,00029 (USD5)
households
Tariff for corresponding USD per unit of
8 Determined by type of flow
services for the population consumption
8.1 Passenger traffic USD per passenger 0 100 20 Transit by bus from Urzhar to Chuguchak: USD2030
USD for the carriage From Urzhar to Chuguchak: KZT200 (USD0.48) for the
8.2 Freight traffic 0 100 5
of one ton of cargo entire route31
Electricity tariff rate in Kazakhstan:32
8.3 Energy flow USD per kWh 0 100 1 Minimum tariff rate (up to 70 kWh) – KZT10.48/kWh
(including value-added tax) (USD0.025)
25 Федеральная служба государственной статистики. Available at https://rosstat.gov.ru/folder/12781.
26 Затраты организаций на информационные и телекоммуникационные технологии. Available at
https://akstat.gks.ru/storage/mediabank/Vb0h5e09/%D0%97%D0%B0%D1%82%D1%80%D0%B0%D1%82%D1%8B%20%D0%BD%D0%B0%20%20%D0%B8%D0%BD%D1%84.%D1%82%D0%B5
%D1%85%D0%BD%D0%BE%D0%BB%D0%BE%D0%B3%D0%B8%D0%B8.htm.
27 Семейные расходы: страны ОЭСР – Россия. Available at https://www.factograph.info/a/30940592.html.
28 Отчет анализ рынка электроэнергии и угля Казахстана январь-октябрь 2020 года Available at https://www.samruk-
energy.kz/images/%D0%9E%D1%82%D1%87%D0%B5%D1%82_%D0%BF%D0%BE_%D0%90%D0%A0%D0%AD_%D0%B7%D0%B0_10_%D0%BC%D0%B5%D1%81.2020%D0%B3.docx.
29 Расходы казахстанцев на сотовую связь выросли во втором квартале текущего года. Available at https://profit.kz/news/39380/Rashodi-kazahstancev-na-sotovuu-svyaz-virosli-vo-vtorom-kvartale-
tekuschego-goda/.
30 Как добраться в Китай из Казахстана. Available at http://nomoremaps.com/2483/.
31 Об использовании автомобильной дороги (участка) общего пользования республиканского значения на платной основе. Available at http://adilet.zan.kz/rus/docs/V1800018073.
32 Астанаэнергосбыт. Available at https://astanaenergosbyt.kz/ru/fiz/tarify1.html.
Page 16 of 64
Calculation Results for Determining the Most Promising Model for Infrastructure Corridor DevelopmentAverage tariff rate (from 70 to 140 kWh) – KZT16.04/kWh
(including value-added tax) (USD0.038)
Maximum tariff rate (140 kWh and higher) –
KZT20.05/kWh (including value-added tax) (USD0.048)
8.4 Information flow USD per MB 0 100 1 Kazakhstan: USD0.11 per MB33
Tariff for corresponding USD per unit of
9 Determined by type of flow
business services consumption
9.1 Passenger traffic USD per passenger 0 100 20 Transit by bus from Urzhar to Chuguchak: USD2034
USD for the carriage Toll road payment in Kazakhstan: USD1.90 for the entire
9.2 Freight traffic 0 100 5
of one ton of cargo section for trucks with a carrying capacity of 10-15 tons35
Electricity rate in Kazakhstan for corporate bodies:36
9.3 Energy flow USD per kWh 0 100 1
KZT16.87/kWh (excluding value-added tax)
9.4 Information flow USD per MB 0 100 1 Kazakhstan: USD0.11 per MB37
33 Дорогой ли в Казахстане интернет: сравнение цен в других странах. Available at https://forbes.kz/process/expertise/dorogoy_li_v_kazahstane_internet_sravnenie_tsen_v_drugih_stranah/.
34 Как добраться в Китай из Казахстана. Available at http://nomoremaps.com/2483/.
35 Тарифы на проезд по платным дорогам вынесли на публичное обсуждение. Available at https://informburo.kz/novosti/tarify-na-proezd-po-platnym-dorogam-vynesli-na-publichnoe-
obsuzhdenie.html.
36 Астанаэнергосбыт. Available at https://astanaenergosbyt.kz/ru/fiz/tarify1.html.
37 Дорогой ли в Казахстане интернет: сравнение цен в других странах. Available at https://forbes.kz/process/expertise/dorogoy_li_v_kazahstane_internet_sravnenie_tsen_v_drugih_stranah/.
Page 17 of 64
Calculation Results for Determining the Most Promising Model for Infrastructure Corridor Developmentintensity of flows in natural and monetary
1.2 Principles for Determining the units (in line with the methodology given
Characteristics of Economic and in Part 2 of this series) using the method
Technological Flows Along of direct calculation.
Infrastructure Corridors 4. If the necessary reliable statistical data
cannot be obtained from official sources
In order to identify the data, indicators and due to the lack of openness in disclosing
method for determining the characteristics of data, lack of comparable reporting or
economic and technological flows and the lack of information in a regional context,
expected profitability of the infrastructure or the methodology given in Part 2 of this
corridor, an algorithm has been developed series cannot be fully applied, check the
(Figure 1), which functions as follows: feasibility of conducting a direct or
indirect economic assessment of the
1. Identify the types of infrastructure (e.g., infrastructure.
road, railway, power transmission line,
fibre-optic communications line) along 5. The method of direct estimation of the
the infrastructure corridor (Path A). This infrastructure implies an assessment of
information can be obtained from the potential demand for the
publicly available official sources of infrastructure services by existing
relevant government bodies or consumers in monetary terms (i.e.,
ministries. If the infrastructure does not profitability of the flow). This demand
exist or if there is no traffic in the can be estimated by extrapolating the
direction of the infrastructure corridor cash or in-kind flows existing along the
along another route, refer to Path B infrastructure in one direction to the
(Figure 2). projected flows, taking into account its
features. This method can also be used
2. If the infrastructure exists, determine to assess a section of the infrastructure.
whether reliable statistics on the use of
the infrastructure are available. The 6. The method of indirect estimation
availability and reliability of the statistical assumes a potential demand for the
data must be confirmed by official infrastructure services based on indirect
sources (e.g., state statistical agencies, indicators from similar projects. In this
official websites of relevant ministries case, comparable characteristics that
and departments, and official websites are not only technical and economic
of service providers). Within the characteristics are used.
framework of this study, journal articles
and assessments, and data from rating 7. At the last stage, the availability of
agencies are not recognized as reliable, monetary estimates makes it possible to
since they may express the subjective determine the intensity of the flow in
opinion of the authors and contain natural units by dividing incomes by the
unverified estimates. average reduced tariffs for services of
this flow.
3. If all the necessary reliable statistical
data can be obtained, determine the
Page 18 of 64
Calculation Results for Determining the Most Promising Model for Infrastructure Corridor DevelopmentFigure 1: Alg o r i th m f o r d e t e r m in in g th e c h a r a c te r is ti c s o f th e e c o n o m ic a n d te c h n o l o g ic a l flo ws a lo n g
in fr a s tr u c tu r e c o r r id o r s
А No
Yes
Does the infrastructure facility exist
within the investigated route?
No
Is statistics on the usage of
facility in natural units
available?
No
В
Yes No
Is a direct economic
assessment of the facility's
potential available?
Determination of intensity in
natural units based on
historical (statistical) data
Using a previously
Method of direct performed economic
calculation assessment (intensity in Assessment of economic
potential by indirect indicators
currency units)
(intensity in currency units)
Method of direct estimation
Method of indirect estimation
С
Page 19 of 64
Calculation Results for Determining the Most Promising Model for Infrastructure Corridor DevelopmentFigure 2: S u b a lg o r ith m id e n ti fy in g d a ta in th e a b s e n c e o f in fr a s tr u c tu r e o r tr a f fic
В
No
Yes
Does the economic flow exist in the
direction of the investigated facility
along alternative routes?
Yes
No
Is direct economic assessment of the The economic flow is assessed by
total flow available? the method of reverse valuation
Reverse method
Yes
Is there sufficient statistical data No Is the assessment aligned
available to directly calculate the flow with the realities of the
under the condition of its construction region?
based on existing data? No
Yes
С Abandon scenario due to
lack of data available
Flow assessment based on existing data in
natural and/or monetary units
Method of direct calculation Further calculations
Page 20 of 64
Calculation Results for Determining the Most Promising Model for Infrastructure Corridor DevelopmentIf the infrastructure does not exist (e.g., there infrastructure using the method of direct
are no power lines along the Urzhar– calculation.
Chuguchak infrastructure corridor), or if there
is no traffic in the direction of the 4. If a direct economic assessment of the
infrastructure corridor along another route, total flow is not possible due to the
subalgorithm B is used. Subalgorithm B absence or lack of reliable data, assess
applies other methods to determine the the economic flow using the reverse
intensity of flows in natural and monetary method. In this case, critical values of
units, as follows: project implementation indicators (e.g.,
minimum profit, maximum payback
1. Find out whether economic flows exist for period and capital costs) are set by
each infrastructure type in the direction of applying the reverse method and using
the infrastructure corridor along current tariffs for similar services in the
alternative routes or alternative types of region or existing discount rates, where
traffic (e.g., air transport in the absence the minimum allowable flow volume at
of land transport, use of renewable which the project will be efficient is
energy in the absence of electricity, and calculated.
satellite communications in the absence
of fibre-optic connectivity). 5. If the calculated values obtained by
reverse method are not aligned with the
2. If economic flows exist, assess the realities of the region (e.g., the calculated
possibility of carrying out a direct flow volume significantly exceeds the
economic assessment of the total flow. regional average consumption indicators
For this, the availability, accessibility and for this type of service, and there are no
reliability of statistical data is determined factors for increasing this consumption
by assessing whether it is possible to by both internal and external
extract the shared value of this flow from consumers), abandon this scenario due
the general array of statistical data on the to the lack of data available.
flow (in natural and/or monetary terms)
based on similar flows or general
statistical data (e.g., gross regional 6. Use the data obtained by any of the
product and purchasing power parity in methods for further calculations (Path C).
the region).
Table 2 helps to select the assessment
3. If statistical data can be obtained, assess method based on the availability of data.
the economic potential of the
Page 21 of 64
Calculation Results for Determining the Most Promising Model for Infrastructure Corridor DevelopmentTable 2: S e le c tio n o f a s s e s s m e n t m e th o d b a s e d o n th e a v a il a b ili t y o f d a ta
Is there a similar
Is there an Is statistical Is statistical
infrastructure
infrastructure (historical) data (historical) data Selected
between countries
Corridor Infrastructure facility along the available for the available for the calculation method
along an
corridor (direct direct route? alternative route?
alternative route?
route)?
Highway No - Yes + Direct calculation
Almaty (Kazakhstan) – Railway No - No - Reverse
Cholpon-Ata (Kyrgyzstan) Power line No - Yes +/- Direct estimation
Fibre-optic line No - Yes +/- Direct estimation
Highway Yes + Yes +/- Direct estimation
Semey (Kazakhstan) – Railway Yes + Yes +/- Direct estimation
Rubtsovsk (Russian Federation) Power line Yes - Yes +/- Direct estimation
Fibre-optic line No - Yes +/- Direct estimation
Highway Yes +/- Yes +/- Indirect estimation
38
Urzhar (Kazakhstan) – Railway No - Yes/No - Reverse
Chuguchak (China) Power line No - No - Reverse
Fibre-optic line No - Yes +/- Indirect estimation
38 The existing railway transit and transport corridor Viet Nam–China–Kazakhstan–Europe cannot be recognized as a direct alternative since it passes through the Dzungarian Gate, against the flow of the
infrastructure corridor, and is not intended for the transportation of goods over short distances as there are no large shipping and receiving terminals. There are, however, public transport stops. Available
at https://liter.kz/ru/news/show/56782-zapushen_transkontinentalnyi_zheleznodorozhnyi_marshrut_vetnam-kitai-kazahstan-evropa.
Page 22 of 64
Calculation Results for Determining the Most Promising Model for Infrastructure Corridor DevelopmentFour examples of applying the above passenger traffic will be between USD64.8
algorithm to calculate potential flows are million (1.44 million × USD45) and USD72
illustrated below. million (1.44 million × USD50).
1.2.1 Example 1: A Straight Highway In summary, the expected annual flow of a
Along the Almaty–Cholpon-Ata straight highway along the Almaty–Cholpon-
Infrastructure Corridor Ata infrastructure corridor is 1.44 million
passengers and, in monetary terms,
In this case, the flow is absent, which means between USD64.8 million and USD72 million
data does not exist. However, there is an per year.
alternative route with a full set of official
statistical data available on existing flows Similarly, freight traffic flows can be
and experts’ assessment of the changes in calculated for a projected route that has a
flow volume if the projected highway is tunnel passing directly through the
implemented along a direct route. Based on mountains, reducing the distance of the route
the data and information, it is possible to from 450km to 70.5km:
apply the method of direct calculation.
• From Kazakhstan – 181.08 million tons of
The existing tourist flows on the Almaty– cargo per year39 at a price of USD1.90 for
Cholpon-Ata section today use a 450km the entire route for trucks with a capacity of
route through Bishkek. According to official 10-15 tons amounts to USD34.4 million per
data, there are about 0.9 million tourists year; and
annually, which brings an estimated average • From Kyrgyzstan – 4.2 million tons of
of USD272.80 from each tourist, in which cargo per year40 at a price of KGS14 per km
about USD70 relates to transportation costs. for the maximum allowed weight (USD0.17)
Thus, annual transport revenue along the for 70.5km amounts to USD5.03 million per
Almaty–Cholpon-Ata section is estimated at year.
USD63 million (0.9 million tourists × USD70).
Thus, total freight traffic is USD34.4 million +
According to experts, the presence of a direct USD5.03 million = USD39.43 million, and the
route with a length of 117km will lead to an total flow on the Almaty–Cholpon-Ata
increase in passenger and freight traffic by infrastructure corridor is USD72 million (for
reducing travel time, and may increase the passenger traffic) + USD39.43 million (for
flow of tourists by 60 per cent. With the freight traffic) = USD111.43 million per year.
reduction in mileage, transportation costs will
be reduced to USD45-USD50 (due to a With information about the proportion of road
reduction in the variable components of the and rail traffic, it is possible to determine the
tariff, specifically the cost of fuel and expected values of these flows along railway
lubricants, while maintaining the volume of routes (if they are constructed), based on the
the constant components of the tariff, assumption that the distribution of road and
specifically insurance, depreciation and rail traffic will remain the same. In this region,
management costs). the distribution of passengers by road and
rail is 99.8 per cent and 0.2 per cent,
However, with a potential increase in respectively. Thus, almost all potential
demand by 60 per cent (according to passengers will likely use road transport on
experts), an increase by up to 1.44 million this infrastructure corridor. On the contrary,
tourists is likely (0.9 million tourists × 60 per the distribution of freight traffic by mode of
cent). Thus, the total annual revenue from transport for international transport indicates
39Конкурентоспособность логистики и транспорта в 40Национальный статистический комитет Кыргызской
Республике Казахстан. Available at Республики. Available at
https://unece.org/DAM/trans/publications/Report_- http://www.stat.kg/ru/statistics/transport-i-svyaz/.
_Kazakhstan_as_a_transport_logistics_centre_Europe-
Asia_RU.pdf.
Page 23 of 64
Calculation Results for Determining the Most Promising Model for Infrastructure Corridor Developmentthat 94.6 per cent of Kazakhstan's freight • From Kazakhstan – KZT1,349,561.9
traffic41 and 98.6 per cent of Kyrgyzstan’s million43 = USD792.3 million;44 and
freight traffic42 are by rail. Thus, 5.4 per cent • From Kyrgyzstan – KGS16,450.1
and 1.4 per cent of freight traffic, million45 = USD193.9 million.46
respectively, are by road. This is due to the
higher carrying capacity and relatively lower The existing profit from the provision of
tariffs for rail transportation. services to residents in the region (based on
the share of the region's population to the
As a result, it can be assumed that most of total population) is as follows:
the expected traffic flows will switch to the
railway route (if constructed). Further, the • From Almaty (11.04 per cent of the
resulting flows are subject to correction, population47) – 11.04 per cent ×
taking into account the unevenness of the USD792.3 million = USD87.46 million;
load and the effects of internal and external and
circuits. The data and calculations are • From Cholpon-Ata (0.3 per cent of the
summarized in Table 3. population48) – 0.3 per cent × USD193.9
million = USD0.5817 million.
1.2.2 Example 2: A Fibre-Optic
Communications Line Along the Almaty– The existing structure for the formation of
Cholpon-Ata Infrastructure Corridor tariffs for flow services shows that the share
of profit from traffic transportation is as
In this case, the flow is absent, which means follows:
data does not exist. However, there is an
alternative route with a partial set of official • For Almaty (15 per cent49) – 15.0 per cent
statistical data available on existing flows × USD87.46 million = USD13.12 million;
from residents of the region and from tourists and
staying in Issyk-Kul, a major tourist • For Cholpon-Ata (2.5 per cent50) – 2.5 per
destination in Kyrgyzstan. Based on the data cent × USD0.5817 million = USD0.0145
and information, it is possible to apply the million.
method of direct estimation and extrapolate
the existing flows, considering the potential Thus, the total flow from residents in the
increase in the flow due to the increase in region (excluding tourists) is USD13.12
tourists if the Almaty–Cholpon-Ata million + USD0.0145 million = USD13.13
infrastructure corridor is developed. million.
The existing profit from the provision of Considering that tourist flow in the direction
services to the following residents is (at the of Almaty → Cholpon-Ata is expected to
exchange rate of early 2021): increase by 60 per cent, it is necessary to
increase the existing flows, taking into
account the increase in users, however, not
41 Перевозка грузов по видам транспорта. Available at https://finance.rambler.ru/calculators/converter/1-KGS-
http://www.stat.kg/ru/statistics/transport-i-svyaz/. USD/.
42 Перевозка грузов всеми видами транспорта. Available 47 Демограическая статистика. Available at
at https://stat.gov.kz/official/industry/18/statistic/7. https://stat.gov.kz/official/industry/61/statistic/7.
43 Статистика транспорта. Available at 48 Население. Available at
https://stat.gov.kz/official/industry/11/statistic/7. http://www.stat.kg/ru/opendata/category/4/.
44 Курс тенге к доллару США по состоянию на февраль 49 Отчет о финансовых результатах. Available at
2021 года. Available at https://telecom.kz/storage/uploads/58/f4/044e580bf4dc8ecf
https://finance.rambler.ru/calculators/converter/1-KZT- 970c9f40eafed7014ad08fe7/GCGg9iz0XYslR7r6iHdXGnp
USD/. x4zzhuD2BReBtZ7vB.pdf.
45 ВВП по видам экономической деятельности в 50 Годовой отчет ОАО «Кыргызтелеком» за 2019 год.
текущих ценах. Available at Available at
http://www.stat.kg/ru/opendata/category/164/. http://kt.kg/about_us/documents_and_tender/annual_report/
46 Курс сома к доллару США по состоянию на февраль AR_2019.pdf.
2021 года. Available at
Page 24 of 64
Calculation Results for Determining the Most Promising Model for Infrastructure Corridor Developmentby direct extrapolation since tourists are not month. Moreover, the 72-hour visa-free
constant users of the flow service. regime attracts up to 10,000 tourists from
Kazakhstan to China51 and increases tourists
To calculate the increase in the flow due to flow from China to Lake Alakol in Kazakhstan
the increase in tourists, data on the average by 2.5 times.52
adult’s expenditure on communications
services in the region is used, which makes However, the low quality of the road surface,
up about 3.2 per cent of total expenditure. lack of roadside infrastructure and the low
Thus, 3.2 per cent of tourists’ total average rates of development of related services
expenditure of USD272.80 is USD8.73 for reduce the potential for infrastructure
communications services. corridor development. According to some
reports, investors perceive transport logistics
If the potential flow of tourists is 1.44 million, as a factor limiting economic growth, and are
then the potential increase in traffic through actively investing in infrastructure along the
the projected fibre-optic communications line coast resulting in significant growth in the
is USD1.88 million (1.44 million × USD8.73 × number of tourist facilities by 116.3 per cent
15 per cent), and the total flow, including in 2019, the number of tourists served by
tourists, will be USD13.13 million + USD1.88 30.2 per cent, and the volume of paid
million = USD15.01 million. services by 35.6 per cent.
The resulting flows are subject to correction, Thus, it is possible to determine the potential
taking into account the unevenness of the volume of traffic using these indirect
load and the effects of internal and external indicators that consider the expected
circuits. The data and calculations are increase in tourists.
summarized in Table 4.
According to reports,53 about 1.5 per cent of
1.2.3 Example 3: A Road Along the tourists to Kazakhstan are from China
Urzhar–Chuguchak Infrastructure travelling on vacation (95,000 per year), and
Corridor 82 per cent are tourists from neighbouring
countries, including Uzbekistan (43.4 per
The flow exists, but due to the lack of cent), the Russian Federation (22.1 per cent)
openness of one the parties in disclosing and Kyrgyzstan (16.5 per cent). An
data, access to statistical data on this flow is agreement between China and Kazakhstan
problematic. However, there is an alternative to attract Chinese tourists to Alakol54 is likely
route with a partial set of data (mostly to promote tourism growth in this region by
estimates and journalistic) about existing 250 per cent, resulting in an increase in the
flows circulating along it. Based on this set of number of accommodations.
data, the method of indirect estimation is
applied using indirect indicators from similar These developments can potentially
projects. increase the flow of tourists from China
passing through this infrastructure corridor to
As presented in Part 1 of this series, the 237,500 people per year (95,000 × 250 per
capacity of the alternative road through the cent). However, a significant increase in
Bakhty checkpoint is 200,000 tons of cargo freight traffic is not expected since there are
and 100,000 passengers per year. The restrictions on duty-free carriage of goods
functioning of the “green corridor” at the and the limited throughput at checkpoints.
Bakhty checkpoint accelerates the flow of
agricultural products by up to 6,400 tons per
51 Казахстан продлил безвизовый режим для https://forbes.kz/finances/markets/pestryie_vpechatleniya_
транзитных туристов из Китая и Индии. Available at 1575972427/.
53 Из каких стран чаще всего едут в Казахстан.
https://tengritravel.kz/my-country/kazahstan-prodlil-
bezvizovyiy-rejim-tranzitnyih-turistov-388047/. Available at https://profi.travel/news/34931/details.
52 Пёстрые впечатления: как развивается туристический 54 YK-news.kz. Available at https://m.yk-news.kz.
бизнес на Алаколе. Available at
Page 25 of 64
Calculation Results for Determining the Most Promising Model for Infrastructure Corridor DevelopmentYou can also read