Artichoke Extract as an Eco-Friendly Corrosion Inhibitor for Zinc in 1 M Hydrochloric Acid Solution
←
→
Page content transcription
If your browser does not render page correctly, please read the page content below
Article
                                                                             Volume 10, Issue 4, 2021, 2655 - 2679
                                                                    https://doi.org/10.33263/LIANBS104.26552679

Artichoke Extract as an Eco-Friendly Corrosion Inhibitor
for Zinc in 1 M Hydrochloric Acid Solution
Hanaa M. Elabbasy 1,*, Omnia A. Mohamed 2, Abd El-Aziz S. Fouda 2
1   Misr Higher Institute for Engineering and Technology, Mansoura, Egypt; helabbasy@hotmail.com (H.M.E.);
2   Department Chemistry, Faculty of Science, Mansoura University, Mansoura-35516, Egypt; asfouda@hotmail.com (A.E-
    A.S.F.);
*   Correspondence: helabbasy@hotmail.com (H.M.E.);
                                                                                        Scopus Author ID 57194688431
                                 Received: 17.01.2021; Revised: 30.03.2021; Accepted: 10.04.2021; Published: 7.05.2021

Abstract: Artichoke extract (AE) was studied as the corrosion inhibitor for zinc in 1 M HCl utilizing
chemical and electrochemical methods. The adsorption isotherm of Artichoke extract on Zn surface
accords with Langmuir adsorption isotherm. The inhibition efficiency increases with increasing the
extract's concentration and decreases with the rise in the medium's temperature. The inhibition
efficiency reached a value of 93.2% at 300 ppm of extract. This extract may be forming a film and acts
as a barrier, which minimizes the contact area between zinc surface and HCl solution. Artichoke extract
acts as a mixed inhibitor in HCl solution. Thermodynamic parameters of activation and adsorption were
determined and explained. The adsorption parameters also obeyed the Langmuir adsorption isotherm,
and the sign of the free energy of adsorption showed a spontaneous process. The surface morphology
of zinc metal was examined by employing various techniques. Also, the biological effect of the
Artichoke extract was studied. Theoretical studies of quantum mechanics and molecular dynamics
simulations studies were carried out on the Artichoke extract compounds, and the results agree with the
experimental one. The efficiencies marked from all employed techniques were in perfect
correspondence, demonstrating the validity of these procedures.

Keywords: zinc; artichoke extract; corrosion inhibition; HCl; AFM; biological effect; SEM.
© 2021 by the authors. This article is an open-access article distributed under the terms and conditions of the Creative
Commons Attribution (CC BY) license (https://creativecommons.org/licenses/by/4.0/).

1. Introduction

        Zn is a non-ferrous metal used in metallic coating, extensively, a natural metal founds
in the earth's crust. Besides rock and soil, present in water, air, and the biosphere, is concluded
in plants, animals, and humans. Zinc is a metal with numerous industrial applications and is
mainly used for the corrosion protection of steel [1]. Zinc is an industrially important metal
and is corroded by many agents, of which aqueous acids are the most dangerous [2]. Zn metal
is highly susceptible to attack by acids, especially sulphuric and hydrochloric acids. In the
current industry, acids are used for the chemical cleaning of metals and alloys. Thence for scale
elimination and cleaning of zinc surfaces by acidic solutions, it is required to use inhibitors [3].
The employment of the plant extracts as inhibitors to lower the dissolution of metals in several
typical industrial solutions was performed by several authors [4-18]. Inhibitors from plant
extracts are characterized by their renewable resources, facilely obtainable, low cost, and no
harmful effects on the environment [19]. The green corrosion extracts mainly contain the
needful elements (such as O, C, N, and S) that help molecules to be adsorbed on the surfaces
of metals or alloys to form a film that protects the surface from corroded [20]. There is no
https://nanobioletters.com/                                                                                    2655
https://doi.org/10.33263/LIANBS104.26552679

indication to apply this extract as a corrosion inhibitor for zinc in HCl solution in the literature
survey. This encourages us to utilize this extract as a corrosion inhibitor for zinc in HCl
medium. Artichoke extract AE (Cynara cardunculus var. scolymus) [21], Family: Asteraceae
[22]. It is an accepted known plant, coming from the Mediterranean Sea, Italy, and Spain.
Artichoke consists of apigenin and luteolin bioactive agents [23]. Its leaves are consumed as
vegetables worldwide and are applied, for a long time, in herbal medication as a choleretic
[24]. Besides polyphenols and flavonoids, some mono- and dicaffeoylquinic acids were found
as the main portion in the chemical constituents of artichoke leaves [25].
        This research article evaluates the AE as an inhibitor for Zn in a corrosive acid medium
by employing several techniques. This included the elucidation of the protection mechanism
involved.

2. Materials and Methods

        2.1. Materials and plant preparations.

        The acid corrosive medium (1 M HCl) was prepared by diluting a reagent of analytical
grade HCl 37% with bi-distilled water. The composition of the applied Zn as weight % is Cd
(0.52), Fe (0.035), Mn (0.005), Pb (0.18), Sn (0.07), and Zn rest. The Zn sheet of thickness 0.1
cm was mechanically press-cut into 2×2 cm coupons for ML measurements and 1×1 cm for
electrochemical measurements. The samples were abraded with varying degrees of emery
papers reaching 2000 grades, cleaned and washed using acetone and bi-distilled water, and dry
with filter paper. The coupons were then ready to use in the corrosion studies. The freshly
Artichoke parts were firstly prepared to dehydrate, milled to a powder. Then, 500 g of the
powder drenched in methanol, boiling at 100 °C, and preserved at room temperature for about
72 hours. After that, the AE is filtrated and put in the air to dry. To attain 1000 ppm stock
solution of the extract, one-gram from the dried AE is dissolved in one litter bi-distilled water.
Various concentrations (from 50 to 300 ppm) are prepared from the AE solution through
dilution with bi-distilled water.

        2.2. Mass loss (ML) method.

        Zn samples with dimensions 2 x 2 x 0.1 cm were utilized in this method. Before all
experiments, the samples were mechanically abraded by 800-2000 grades of emery papers,
washed by bi-distilled water, degreased with acetone, dried by filter paper, and weighed
accurately by employing an analytical balance by 0.1 mg of precision. The samples then
suspended in solutions of 100 ml of the corrosive acid medium without and with (50, 100, 150,
200, 250, and 300 ppm) of AE for different immersion time (60, 120, 180, 240, 300, and 360
min), then the samples were taken away and handled following the process cleared in ASTM
term G1-90 [26].

        2.3. Electrochemical techniques.

        For electrochemical procedures, a conventional glass cell of three electrodes was
employed. A cylindrical rod working electrode (Zn metal) was placed into a glass tube of
appropriate diameter using epoxy resin. It offered an active flat-disc-shaped surface of 1 cm2
geometric area to contact with the electrolyte, saturated calomel electrode (SCE) as a reference
electrode, and auxiliary electrode (Pt(, respectively [27]. Before each electrochemical
https://nanobioletters.com/                                                                 2656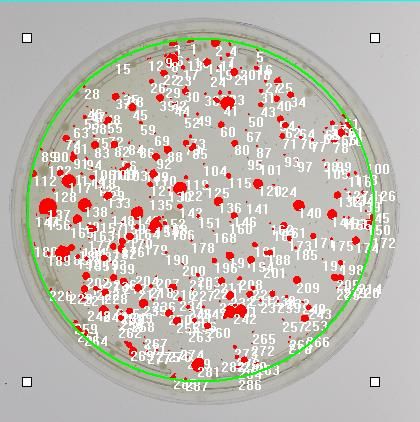
https://doi.org/10.33263/LIANBS104.26552679

measurement, the Zn electrode was polished with emery papers and treated as in ML, left for
30 min in the solution to give a chance to the open circuit potential to attain a steady-state [28].
The potentiodynamic polarization (PP) curves were recorded in the potential range of -500 to
+500 mV relating to the open circuit potential (Eocp) at a scan rate of 0.5 mV s−1.
        Electrochemical impedance spectroscopy (EIS) was recorded at open circuit potential,
OCP. The AC signal was 10 mV peak to peak with a frequency range between 50 kHz and 0.1
Hz.
        The electrochemical frequency modulation (EFM( procedures employed a potential
amplitude of 10 mV, with two sine waves of 2 and 5 Hz. The EFM procedure outcomes are
spectra (termed intermodulation spectra) of current response as a function of frequency. The
spectra consist of current responses selected for harmonically and intermodulation current
peaks. The bigger peaks were employed to attain the corrosion current density (icorr), the
causality factors (CF-2 and CF-3), and the Tafel slopes (βc and βa) [29]. The large strength of
the EFM is the causality factors that show an internal check on the sincerity of the EFM
procedure [30]. For the reproduction of the data, each experiment was repeated at least three
times.
        Electrochemical techniques were carried out using Potentiostat/ Galvanostat (Gamry
PCI 300/4) with software DC105 for polarization, EIS300 for EIS, and EFM140 for EFM,
connected to a computer for data record and store. All the experiments were carried out at 25
o
  C using an ultra circulating thermostat, and solutions were not deaerated. Each experiment
was performed on a newly abraded electrode using a freshly prepared electrolyte.

        2.4. Surface analysis.

        2.4.1. Scanning electron microscopy (SEM) and energy dispersion X-ray (EDX) analysis.

      SEM and EDX analysis of Zn surface before and after immersion for 24 hours in the
corrosive acid medium without and with 300 ppm (the higher concentration) of AE were
studied using apparatus model: JEOL (Japan JSM IT - 100).

        2.4.2. Atomic force microscopy (AFM) analysis.

      AFM is an effective method for examining Zn metal's surface morphology at a nano- to
micro- scale. The essential feature of this test is that the roughness of the surface can be
recorded. AFM tests were carried out using prepared Zn specimens before and after immersion
for 24 hours in the corrosive acid medium without and with 300 ppm of AE.

        2.4.3. Fourier-transform infrared spectroscopy (FT-IR) studies.

        FT-IR spectra were registered in a spectral range 4000 to 500 cm−1 with the technique
of Attenuated Total Reflectance (ATR) using FTIR-Spectrometer iS 10 (Thermo Fisher
Scientific, USA). FT-IR spectrum is an effective way to compare between the inhibitor and
corrosion products after inhibitor adsorption. The FT-IR peak values were recorded for AE and
for Zn after immersion for 24 hours in the corrosive acid medium containing 300 ppm of AE.

        2.4.4. Ultraviolet-visible spectroscopic (UV) test.

       The formation of a metal complex is supported mainly by using the Ultraviolet-visible
spectroscopic test. The UV absorption spectra of the corrosive acid medium with 300 ppm of
https://nanobioletters.com/                                                                      2657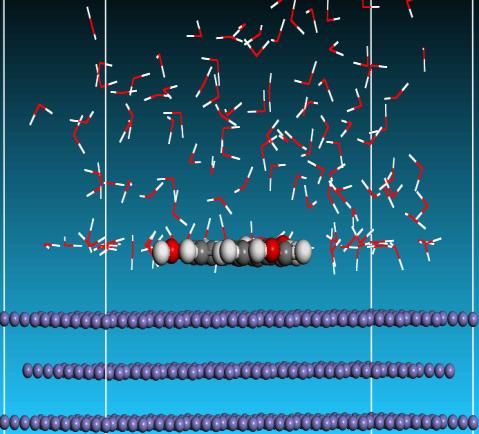
https://doi.org/10.33263/LIANBS104.26552679

AE were investigated without and after Zn immersion for 24 hours. The UV spectra were
carried out using UV spectrometer T80+ (UV TIS model, UK).

        2.5. Biological effect.

       A biological effect test was carried out for AE to detect multiplying bacteria by
determining the number of Bacteria colonies using the Doc-it colony counter instrument.

3. Results and Discussion

        3.1. Mass loss (ML) test.

       The effect of adding different concentrations (from 50 to 300 ppm) of AE to Zn's
corrosive solution was tested using ML. The average ML at a definite time for the Zn samples
was taken as follows:

       ΔW = Wo-W1                                       (1)
where Wo and W1 are the weights of the Zn samples before and after immersion in the acid
corrosive medium, respectively. The inhibition efficiency (%IE) of AE and Zn surface
coverage (Ɵ) can be determined as follows:

       %IE= Ɵx 100= [1-(ΔWinh /ΔWfree)] x100          (2)
where ΔWinh and ΔWfree are the ML (mg) without and with AE, respectively. The corrosion
process rate (C.R) is calculated as follows:

        C.R. = ΔW/At                                       (3)
                                      2
where A is the area of specimens in cm and t is the immersion time in min. Figure 1 illustrated
the relationship between ML of different AE concentrations and time (in min) at 25 °C.

                                              Blank
                                 800
                                              50 ppm
                                              100 ppm
                                 600          150 ppm
                        ML, mg/cm2

                                              200 ppm
                                              250 ppm
                                 400          300 ppm

                                 200

                                     0
                                         50   100 150 200 250 300 350
                                                    Time, min
         Figure 1. Effect of rising amount of AE on ML at 25 oC for Zn in the corrosive acid medium.

       The ML of Zn in the existence of AE was considerably less than that attained in the
blank corrosive medium. Meaning that the adsorption of extract molecules on the Zn surface
makes a block between the metal and the corrosive acid medium. Hence, the corrosion rate
decreases and % IE increases. This indicates that AE behaves as a corrosion inhibitor.

https://nanobioletters.com/                                                                            2658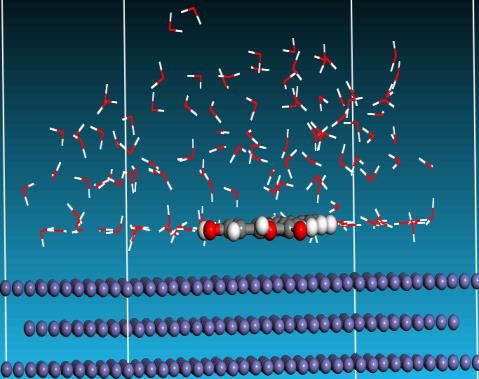
https://doi.org/10.33263/LIANBS104.26552679

        3.1.1. Effect of temperature.

         The influence of temperature on C.R. (Figure 2) and on % IE (Figure 3) for Zn in the
corrosive acid medium without and with different concentrations of AE was analyzed by ML
tests in the temperature range (from 25 to 45 °C). The figures demonstrate that the increase in
AE concentration decreases C.R. and increases % IE at all the applied temperatures. This is
typically due to the increase of adsorption and coverage of metal surfaces with the raising of
AE [31].

                                           4.0                                              25 oC
                                                                                            30 oC
                                           3.5                                              35 oC
                      C.R, mg.cm-2.min-1

                                                                                            40 oC
                                           3.0
                                                                                            45 oC
                                           2.5
                                           2.0
                                           1.5
                                           1.0
                                           0.5
                                           0.0
                                                 Blank 50       100   150     200    250    300
                                                                 Conc (ppm)
     Figure 2. C.R of Zn in the corrosive acid medium vs. concentration of AE at different temperatures.

                         120
                                                  25 oC
                                                  30 oC
                         100                      35 oC
                                                  40 oC
                                                  45 oC
                               80
                    % IE

                               60

                               40

                               20

                                     0
                                                 50       100   150    200        250      300
                                                                Conc (ppm)
 Figure 3. % IE of different AE concentrations for Zn in the corrosive acid medium at different temperatures.

        The estimation of activation energies (Ea*) for corrosion of Zn in uninhibited and
inhibited acid corrosive medium were computed by employing the following Arrhenius
equation:
        log C.R. = - Ea*/2.303RT+ log A              (4)
where A is Arrhenius pre-exponential multiplier, T is Kelvin temperature, R is universal gas
constant in joule/mol/K unit. Straight lines were obtained by plotting log C.R versus 1/T
without and with different AE concentrations (Figure 4) with slope equals (-Ea*/2.303 R). The
entropy (ΔS*) and enthalpy (ΔH*) of the activation process for Zn in the corrosive acid medium
without and with different concentrations of AE were computed by employing the next
transition-state equation:
https://nanobioletters.com/                                                                                    2659
https://doi.org/10.33263/LIANBS104.26552679

        C.R = RT/Nh exp (ΔS*/R) exp (–ΔH*/RT)          (5)
        where N & h represents Avogadro's number and Planck's constant, respectively.
Straight lines were obtained by plotting log C.R/T versus 1/T without and with different
concentrations of AE (Figure 5) with slope equals (–ΔH*/2.303 R), and the intercept equals
[(log (R/Nh) + (ΔS*/2.303 R))]. The computed activation parameters (Ea*, ΔH*, and ΔS*) were
provided in Table 1. The data in Table 1 illustrated that the values of Ea* in the existence of AE
are higher than that in the blank corrosive medium.
                                                   0.6
                         log C.R, mg cm-2 min-1

                                                   0.4                                                               Equation y = a + b*x
                                                                                                                     Adj. R-Squ 0.7394 0.7475       0.87875
                                                   0.2                                                                                  Value     Standard Er
                                                                                                                     log k      Intercep 3.7910     0.93591
                                                   0.0                                                               log k      Slope    -1.012     0.28803
                                                                Blank                                                log k      Intercep 12.659     3.45575

                                                  -0.2          50 ppm                                               log k      Slope    -3.811     1.06353
                                                                                                                     log k      Intercep 14.720     2.65726
                                                                100 ppm                                              log k      Slope    -4.478     0.81779
                                                  -0.4          150 ppm                                              log k      Intercep 16.350     2.34539
                                                                200ppm                                               log k      Slope    -5.009     0.72181
                                                  -0.6          250 ppm
                                                                                                                     log k      Intercep 16.514      2.3847
                                                                                                                     log k      Slope    -5.070     0.73391
                                                                300 ppm
                                                  -0.8                                                               log k
                                                                                                                     log k
                                                                                                                                Intercep 17.743
                                                                                                                                Slope    -5.463
                                                                                                                                                    2.92163
                                                                                                                                                    0.89915
                                                                                                                     log k      Intercep 18.481     2.94911
                                                         3.15      3.20      3.25       3.30      3.35               log k      Slope    -5.705     0.90761

                                                                          1000/T, K-1
  Figure 4. Plotting log C.R. against 1/T for Zn in the acid corrosive medium without and with different AE
                                                concentrations.

                                                  -1.8
                                                  -2.0
                    log C.R/T, mg cm-2 min-1

                                                  -2.2
                                                  -2.4
                                                  -2.6          Blank
                                                                50 ppm
                                                  -2.8          100 ppm
                                                                150 ppm
                                                  -3.0          200ppm
                                                                250 ppm
                                                  -3.2
                                                                300 ppm
                                                  -3.4
                                                         3.15      3.20      3.25        3.30      3.35
                                                                                        -1
                                                                           1000/T, K
  Figure 5. Plotting log C.R/T against 1/T for Zn in the acid corrosive medium without and with different AE
                                                concentrations.

        The increase in the Ea* indicates a high adsorption of the AE particles on the Zn surface.
As indicated from Table 1, ∆H* values have positive signs, which means that the AE molecules
are adsorbed endothermically on the Zn surface. The increase in ∆H* in the AE's existence
indicates that the energy barrier in the corrosion reaction increases. The mean difference
between Ea* and ∆H* is about 2.6 kJ mol−1, which is nearly the RT value (2.63 kJ mol−1) [32,33].
This proves that the dissolution of Zn in the corrosive acid medium is a unimolecular reaction.
The values of ΔS* in Table 1 prove that the activated complex in the rate-determining step
displays an association instead of dissociation, i.e., the disorder is done on the path of
transmitting from reactant to activated complex [34].
https://nanobioletters.com/                                                                                              2660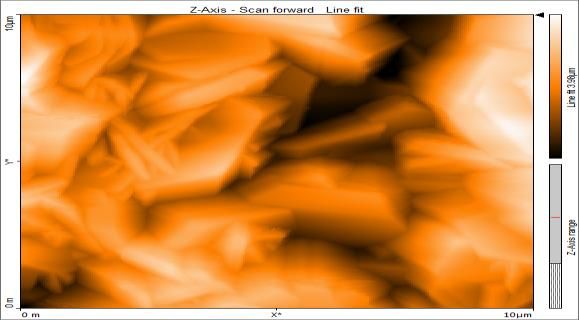
https://doi.org/10.33263/LIANBS104.26552679

 Table 1. Activation parameters (Ea*, ∆H*, and ∆S*) for Zn in the corrosive acid medium without different AE
                                               concentrations.
          Cinh, ppm                     Ea*,                      ∆H*,                        ∆S*,
                                      kJ /mol                    kJ /mol                   J /mol/K
            Blank                       19.4                       16.8                     -180.86
             50                         73.0                       70.4                      -11.14
             100                        85.7                       83.2                       28.30
             150                        95.9                       93.3                       59.51
             200                        97.1                       94.5                       62.63
             250                       104.6                      102.0                       86.16
             300                       109.2                      106.6                      100.28

        3.1.2. Adsorption study.

        To definite the corrosion mechanism, several adsorption isotherms were employed. The
obtained data agreement with Langmuir adsorption isotherm, in which the surface part covered
by the inhibitor (θ) is related to the inhibitor concentration (C) through the following equation:

        C/θ = 1/Kads + C                              (6)
        where Kads is to the adsorption equilibrium constant. The plots of Langmuir isotherm at
different temperatures were shown in Figure 6. The values of free energy of adsorption (ΔGoads)
were gotten as follow:

        log Kads = 1/55.5 exp (ΔGoads /2.303RT)      (7)
        Where 55.5 is to the water concentration in (mol/L) at the solution/metal interface. The
counted values of Kads and ΔGoads were tabulated in Table 2. The negative values of ΔGoads
signalize that the adsorption process of AE on Zn surface is spontaneous [35]. The obtained
lower values for ΔGoads, which lie among 20.4 kJ/mol and 12.1 kJ/mol, appear that an
electrostatic interaction occurs between AE and Zn surface (physisorption) [36].
                            1.0
                                     25 oC
                                                                                0.989
                                     30 oC
                                     35 oC
                            0.8
                                     40 oC                                       0.994
                                     45 oC
                            0.6
                      C/q

                                                                                0.998

                            0.4                                                   0.973

                                                                                 0.999
                            0.2

                            0.0
                                  0.05       0.10   0.15     0.20      0.25     0.30
                                                        C, M
 Figure 6. Plots of C/Ɵ vs. C at different temperatures for Zn in the corrosive acid medium in the presence of
                                                      AE.

        The enthalpy of adsorption (ΔHoads) was computed utilizing the following Vant Hoff
eq. [37]:

        log Kads = −ΔHoads/2.303RT + constant                 (8)

https://nanobioletters.com/                                                                            2661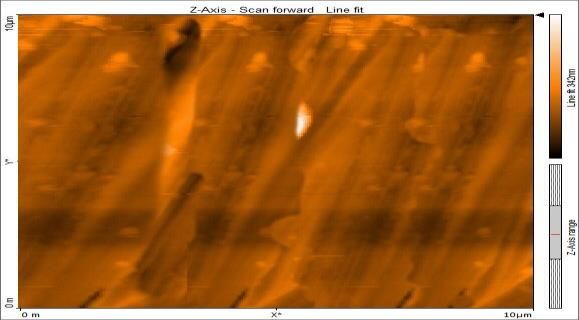
https://doi.org/10.33263/LIANBS104.26552679

       Plotting log Kads versus 1/T gives a straight line, as shown in Figure 7. The entropy of
adsorption (ΔSoads) can be calculated as follows:

        ΔSoads = (ΔHoads −ΔGoads)/T                                   (9)

       The calculated ΔHoads and ΔSoads values are recorded in Table 2. The negative sign of
ΔHoads points out exothermally adsorption of AE on Zn surface. The calculated values of ΔSoads
point out that an entropy decrease accompanied the process of adsorption.

                                     2.0

                                     1.6
                                                                                          0.959
                     log Kads, M-1

                                     1.2

                                     0.8

                                     0.4

                                     0.0
                                           0.00315 0.00320 0.00325 0.00330 0.00335
                                                              1/T, K-1
             Figure 7. log Kads vs. 1/T for Zn in the corrosive acid medium in the presence of AE.

    Table 2. Adsorption parameters for Zn in the corrosive acid medium in the existence of AE at different
                                                temperatures.
    T, oC          Slope                    Kads, M-1   -∆Goads, kJ/mol      -∆Hads, kJ/mol       -∆Sads, J/mol/K
     25            1.031                     68.49           20.4                                      423.8
     30            1.020                     16.33           17.2                                      427.4
     35            1.068                     7.987           15.6                146.7                 425.6
     40            0.989                     2.353           12.7                                      428.1
     45            1.010                     1.739           12.1                                      423.3

        3.2. Electrochemical techniques.

        3.2.1. Open circuit potential (EOC).

        The EOC variation with time for Zn in the corrosive acid medium without and with
different concentrations of AE was represented in Figure 8. The inspection of Figure 8 indicates
that EOC began from − 964.3 mV for the blank solution and moves progressively to the less
negative side (anodically) until attaining the steady-state after 10 min because of the dissolution
of the oxide film from the Zn surface. As shown in Figure 8, after adding AE the EOC began at
the more negative potential than the blank solution and, after that, moves anodically. The
quickly coming off the steady-state, associated with the blank, is because the oxide film's
reductive dissolution on the metal surface formed in the air, followed by a new film's growth
inside the solution [38]. The initial shifts of EOC when adding different AE concentrations mean
that the resistance of Zn dissolution in the corrosive acid medium increases with increasing AE
concentration.

https://nanobioletters.com/                                                                                     2662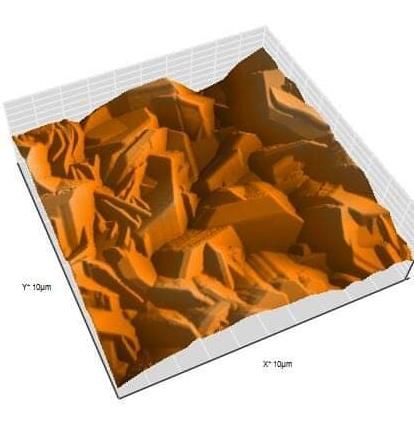
https://doi.org/10.33263/LIANBS104.26552679

                                -0.960

                                -0.965

                                -0.970

                     E, mV
                                -0.975
                                                                                  Blank
                                -0.980                                            100 ppm
                                                                                  150 ppm
                                -0.985                                            200 ppm
                                                                                  250 ppm
                                -0.990                                            300 ppm

                                            0     200     400    600     800 1000 1200
                                                               Time, sec
      Figure 8. EOC vs. time at 25°C for Zn in the corrosive acid medium without and with different AE
                                                concentrations.

        3.2.2. Potentiodynamic polarization (PP) test.

        Anodic and cathodic curves from the PP test at 25 °C for Zn in the corrosive acid
medium without and with different AE concentrations were recorded in Figure 9. The corrosion
current density (icorr) was used for calculating (%IE) and (θ) as seen in the next equation [39]:
        %IE = θ × 100 = [1– (icorr/ iocorr)] × 100     (10)
        where icorr and iocorr are the corrosion current densities with AE and without it,
respectively. Eq. (11) is used to calculate the polarization resistance (Rp) [40,41]:
        Rp = (βc βa)/[2.303 icorr (βc +βa )]           (11)
        The corrosion parameters from PP measurements were tabulated in Table 3.

                                   0.1
                    i, A/ cm2

                                 0.01
                                                 Blank
                                                 50 ppm
                                0.001            100 ppm
                                                 150 ppm
                                                 200 ppm
                                                 250 ppm
                                 1E-4            300 ppm
                                     -1.6       -1.4    -1.2    -1.0    -0.8   -0.6    -0.4
                                                          E, V (vs. SCE)
 Figure 9. PP curves (anodic and cathodic) for Zn in the corrosive acid medium without and with different AE
                                           concentrations at 25 oC.

        It is clear from Table 3 that the cathodic and anodic Tafel slopes (βc & βa) have a little
shift compared to the blank corrosive medium, which means that AE can influence both
cathodic and anodic reactions by forming a protective film on the metal surface. The slight
change in βc and βc values shows no change in the inhibition mechanism in the inhibitor's
absence and existence [42,43]. As seen from Table 3, the corrosion potential (Ecorr) value
change after adding the AE is fewer than 85 mV that again proves mixed-type inhibition
https://nanobioletters.com/                                                                               2663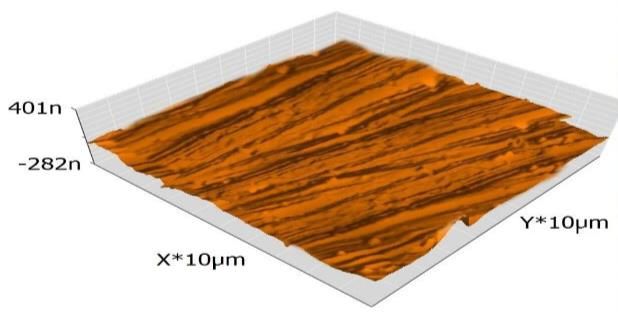
https://doi.org/10.33263/LIANBS104.26552679
[44,45]. Table 3 indicates that corrosion current density (icorr) values are lower for inhibited
solutions than uninhibited one, and the decrease increasing with the increase in the AE
concentration, indicating that AE is a good inhibitor for Zn corrosion in acid media.
Table 3. Electrochemical parameters calculated using PP procedures for Zn in the acid corrosive medium
without and with different AE concentrations at 25 oC.
Cinh, -EOCP, -Ecorr, icorr, -β c, β a, Rp C.R χ2 %IE
ppm mV mV vs mA/cm2 mV/dec mV/dec Ohm cm2 mm/yr
SCE
Blank 962.4 959 10.70 298 126 3.59 6296 ----- -----
50 967.1 964 4.490 209 93 6.22 2647 0.0050 58.0
100 969.6 974 2.570 162 89 9.73 1518 0.0071 76.0
150 968.0 981 2.090 145 88 11.33 1235 0.0081 80.5
200 968.7 984 1.710 134 85 13.20 1010 0.0089 84.0
250 969.5 986 1.540 108 84 13.29 908.7 0.0090 85.6
300 969.9 987 1.210 93 76 15.04 712.2 0.0054 88.7
3.2.3. Electrochemical impedance spectroscopy (EIS) test.
Nyquist diagrams (without and with fit) and Bode diagrams for Zn in the corrosive acid
medium without and with different AE concentrations at 25 oC were shown in Figure 10a
without fitting and Figure 10b with fitting and Figure 11, respectively. % IE and θ from EIS
measurements were calculated as shown below:
%IE = θ × 100 = [1 – (Roct/ Rct)] × 100 (12)
where Rct and Roct represent the charge-transfer resistance with AE and without it, respectively.
EIS parameters are given in Table 4. The equivalent circuit utilized to appropriate the EIS
values was given in Figure 12. This circuit consists of stationary phase elements (CPE) rather
than capacitors to give many heterogeneity types for corrosion electrodes. The Nyquist plots
(Figure 10(a, b)) with and without AE contains a lone capacitive loop signifying the charge
transport technique that is extra confirming by single maxima in the corresponding Bode plots.
Nyquist plots showed that the semicircle diameter increases with the rise in the concentration
of AE. Subsequently, the charge transfer impedance is grown by the corrosion reaction.
Nyquist plots' semi-circular shape proves that the process of charge transfer essentially controls
the corrosion of Zn [46,47]. The formed AE film on the Zn surface minimizes the double-layer
capacitance (Cdl) and increases the charge transfer resistance (Rct). The impedance of a CPE is
clarified by the next equation [48]:
ZCPE = 0-1(j)n-1 (13)
where 0 indicates the CPE quantity and indicates the angular frequency of the maximum
impedance for the imaginary component, and n is the phase shift, which demonstrations
information about the surface inhomogeneity, and j indicates the imaginary number. Higher n
indicates minor surface roughness and vice versa. For n = 0 represents the resistance, n =1
represents the capacitance, n = -1 represents the inductance and n = 0.5 represents the Warburg
impedance. In the current study, the values of n with and without the extracted molecule is
between 0.918 and 0.974. The shift from unity (ideal performance) indicates surface
inhomogeneity and surface roughness [49]. The Cdl for a circuit involving CPE parameters (Y0
and n) were determined using the next eq. [50]:
https://nanobioletters.com/ 2664https://doi.org/10.33263/LIANBS104.26552679
Cdl = Y0 (ωmax) n-1 (14)
The parameter ωmax is express to 2, where is the frequency of AC. As clear from
Table 5, adding different AE concentrations decreases the double layer's capacitance compared
to the blank solution. The decrease in the local dielectric constant is because of the replacement
of water molecules by the inhibitor [51] and/or the rise in the thickness of the electrical double
layer due to the adsorption of extract molecules in the Zn interface/ solution [52]. Bode plots
can also sustain the improved surface smoothness in the existence of extract.
20 Blank
18 50 ppm
16 100 ppm
-Zimage, Ohm cm2
14 150 ppm
200 ppm
12 250 ppm
10 300 ppm
8
6
4
2
0
0 2 4 6 8 10 12 14 16 18 20
Zreal, Ohm cm2
20 Blank
18 50 ppm
16 100 ppm
-Zimage, Ohm cm2
14 150 ppm
200 ppm
12
250 ppm
10 300 ppm
8
6
4
2
0
0 2 4 6 8 10 12 14 16 18 20
Zreal, Ohm cm2
(a) (b)
Figure 10. The Nyquist plots (a) without fitting; (b) with fitting for Zn in the corrosive acid medium without
and with different AE concentrations at 25 oC.
The idealistic capacitor is distinguished by a fixed value of -1 and a phase angle of 90o.
This deviancy from the previous data is due to the surface roughness. The deviancy from ideal
capacitive behavior is more effective in the absence of extract, as seen from Bode plots. The
slope and phase angle values are greatly improved in the presence of extract due to the
formation of the defensive layer. The phase angle values are more effective at higher extract
concentrations [53]. Low values of the goodness of fit (χ2) signalize that the fitted data and the
experimental data are in high agreement.
https://nanobioletters.com/ 2665https://doi.org/10.33263/LIANBS104.26552679
100
Blank
-40
50 ppm
log |Zmod| (Ohm cm2)
100 ppm
150 ppm -30
200 ppm
250 ppm
Zphz (o)
-20
300 ppm
10
-10
0
10
1
1 10 100 1000 10000 100000
log Freq (Hz)
Figure 11. The Bode plots for Zn in the corrosive acid medium without and with different AE concentrations at
25 oC.
Figure 12. The employed equivalent circuit for appropriate the EIS values.
Table 4. The parameters gained from EIS procedures for Zn in the corrosive acid medium without and with
different AE concentrations at 25 oC.
Cinh, Rct , Ru,x 103 Y0, N Cdl, Ɵ %IE
ppm Ohm cm2 Ohm cm2 μSn/Ohm cm2 μF /cm2
Blank 2.223±0.054 2.304±0.020 93.51±18.4 0.974±0.022 74.84 ------ ------
50 5.024±0.069 2.384±0.019 70.98±7.9 0.954±0.013 48.24 0.558 55.8
100 7.172±0.090 2.419±0.019 67.98±6.2 0.948±0.010 44.78 0.690 69.0
150 10.93±0.139 3.030±0.024 65.78±5.8 0.929±0.010 40.97 0.797 79.7
200 13.01±0.157 2.916±0.023 61.50±4.6 0.931±0.009 36.16 0.829 82.9
250 14.71±0.188 4.021±0.031 60.62±5.7 0.916±0.010 38.29 0.849 84.9
300 16.46±0.196 3.459±0.027 58.93±4.5 0.918±0.008 34.65 0.865 86.5
3.2.4. Electrochemical frequency modulation (EFM).
Intermodulation spectra of Zn in the corrosive acid medium without and with different
AE concentrations at 25 °C were displayed in Figure 13. The more prominent peaks were
utilized to compute icorr, βc, βa, and the causality factors (CF-2, CF-3). %IE and θ can be
calculated from EFM measurements as illustrated in eq. (10). Parameters gotten from EFM
procedures were recorded in Table 5. The decrease in icorr with the increase in AE concentration
decreases C.R. and increases in ϴ, %IE. The closest of CF-2 and CF-3 from theoretical values
(2.0 and 3.0) reinforce the validity of Tafel slopes and icorr; this accords with the EFM theory
[54,55].
https://nanobioletters.com/ 2666https://doi.org/10.33263/LIANBS104.26552679
50 ppm
0.001 Blank 0.001
log I (A cm-2)
log I (A cm-2)
1E-4 1E-4
1E-5
1E-5
1E-6
1E-6
1E-7
1E-7
0.0 0.2 0.4 0.6 0.8 1.0 1.2 1.4 1.6 0.0 0.2 0.4 0.6 0.8 1.0 1.2 1.4 1.6
Fr (Hz) Fr (Hz)
150 ppm 200 ppm
0.001 0.001
log I (A cm-2)
1E-4 1E-4
log I (A cm-2)
1E-5 1E-5
1E-6 1E-6
1E-7 1E-7
0.0 0.2 0.4 0.6 0.8 1.0 1.2 1.4 1.6 0.0 0.2 0.4 0.6 0.8 1.0 1.2 1.4 1.6
Fr (Hz) Fr (Hz)
250 ppm 300 ppm
0.001 0.001
1E-4 1E-4
log I (A cm-2)
log I (A cm-2)
1E-5 1E-5
1E-6 1E-6
1E-7 1E-7
0.0 0.2 0.4 0.6 0.8 1.0 1.2 1.4 1.6 0.0 0.2 0.4 0.6 0.8 1.0 1.2 1.4 1.6
Fr (Hz) Fr (Hz)
Figure 13. EFM spectra for Zn in the corrosive acid medium without and with different AE concentrations at 25
o
C.
Table 5. The parameters gained from EFM procedures for Zn in the corrosive acid medium without and with
different AE concentrations at 25 oC.
Cinh, icorr, -βc, βa, C.R, CF-2 CF-3 Ɵ %IE
ppm mA/cm2 mV /dec mV /dec mpy
Blank 20.70 394 224 23030 1.884 2.806 -------- -------
50 6.335 111 126 7051 2.000 3.026 0.694 69.4
100 5.189 188 108 5775 2.009 3.160 0.749 74.9
150 2.842 484 86 3163 2.007 2.988 0.863 86.3
200 2.485 393 83 2765 2.004 3.036 0.880 88.0
250 2.385 433 87 2654 2.002 3.234 0.885 88.5
300 2.339 496 94 2607 2.002 3.056 0.887 88.7
3.3. Surface examination.
3.3.1. Scanning electron microscopy (SEM) examination.
The SEM image of Zn sample before exposure to the corrosive acid medium was shown
in Figure 14(a). Figure 14(b, c) shows the SEM images for Zn surface after exposure to the
corrosive acid medium without and with 300 ppm of AE, respectively. It is shown from Figure
14(b) that the Zn surface was suffering from a severe corrosion attack caused by the corrosive
acid medium. The morphology of Zn surface in the presence of AE (Figure 14(c)) indicates a
https://nanobioletters.com/ 2667https://doi.org/10.33263/LIANBS104.26552679
smoother surface and a change in thickness. This is because of the AE molecules' adsorption
on the surface and the formation of a protective film dispersed randomly on the Zn surface,
leading to lowering the contact between the metal and the corrosive medium, thus protecting
the surface against corrosion [56].
(a) (b)
(c)
Figure 14. SEM micrographs of (a) free Zn; (b) Zn after 24 hrs. of exposure to the acid corrosive medium only,
and (c) Zn after 24 hrs. of exposure to the corrosive acid medium with 300 ppm of AE.
3.3.2. Energy dispersion X-ray (EDX) analysis.
The EDX spectra of free Zn was shown in Figure 15(a). There is O on the Zn surface
that indicates the formation of a passive film of ZnO on the surface. Figure 15(b, c) shows the
EDX spectra for Zn surface after exposure to the corrosive acid medium without and with 300
ppm of AE, respectively. For blank (Figure 15(b)), the spectra demonstrated the existence of
C, O, Cd, Pb, and Cl (gained from HCl medium). The spectra of the inhibited surface (Figure
15(c)) indicate the presence of O, and C (owing to the carbon atoms of AE). The mass percent
of elements present in the spectra were recorded in Table 6.
Table 6. Surface composition (mass %) of Zn before and after 24 hours of exposure to the corrosive acid
medium without and with 300 ppm of AE.
(Mass%) Zn C O Cl Cd Pb
Free Zn 87.57 10.14 2.30 --- --- ---
Zn in blank 57.18 4.89 19.21 3.17 6.94 8.61
Inhibited Zn surface 73.11 8.59 14.56 3.73 --- ---
https://nanobioletters.com/ 2668https://doi.org/10.33263/LIANBS104.26552679
(a) (b)
(c)
Figure 15. EDX analysis for (a) free Zn, (b) Zn after 24 hrs. of exposure to the corrosive acid medium only, and
(c) Zn after 24 hrs. of exposure to the acid corrosive medium with 300 ppm of AE.
3.3.3. Atomic force microscopy (AFM) analysis.
The AFM test is the most important study for analyzing metal surfaces, which is
employed to further examine the formed protective film on the surface [57]. Figure 16(a)
appears the two –dimensional (2d) and three-dimensional (3d) AFM images of the Zn surface
before exposure to acid (free sample). This figure displays the surface of Zn adequately smooth
and reflects light. The two –dimensional (2d) and the three-dimensional (3d) AFM images of
Zn metal after exposure to acid only (blank sample) and after exposure to the acid with 300
ppm of AE (inhibited sample) are shown in Figure 16(b, c), respectively. Roughness
parameters for free, blank and inhibited Zn surface were given in Table 7. The lower roughness
was detected on the free sample.
Table 7. Roughness parameters for free, blank and inhibited Zn surface.
Roughness parameters Free Zn Zn in blank inhibited Zn surface
Sa 79.718 nm 617.3 nm 164.76 nm
Sq 99.615 nm 773.68 nm 225.71 nm
Sy 722.38 pm 4.1713 μm 5.7779 μm
Sp 349.42 pm 2071.4 nm 1344.8 nm
Sv -372.96 pm -2099.9 nm -4.433 μm
Sm -20.019 pm -10.455 fm -9.686 fm
https://nanobioletters.com/ 2669https://doi.org/10.33263/LIANBS104.26552679
The height and roughness of the metal with the extract are less than the blank sample's
height and roughness. As the roughness decreases, the inhibitor inhibits corrosion in a higher
percent [58]. The lower value of roughness for inhibited solution than uninhibited one is
because the adsorption of the inhibitor on the metal surface helps for its protection from getting
corroded [59].
3d 2d
(a) free sample
(b) blank sample
(c) inhibited sample
Figure 16. Thethree–dimensional (3d) and the two -dimensional (2d) AFM images of (a) free sample; (b) blank
sample; (c) inhibited sample.
3.3.4. Fourier-transform infrared spectroscopy (FT-IR).
The FT-IR spectrophotometer is a useful instrument employed to recognize the
functional groups present in the extract and the type of interaction between the function group
and metal surface [60]. Figure 17 displays broad peaks of AE at (3331, 2973, 1670, 1381, 1088,
and 880 cm-1), which correspond to O-H, carboxylic acid O–H stretching vibration, C=O, C-
H, C-O, aromatic C–H bending vibration, respectively. It is clear that there is some peaks
displacement between the spectra of the AE and the adsorbed extract from the Zn surface after
corrosion. Also, a few peaks are either disappearing or becoming less eminent [61]. This
indicates the interaction of AE with Zn through the functional groups present in AE molecules,
resulting in the inhibition process.
https://nanobioletters.com/ 2670https://doi.org/10.33263/LIANBS104.26552679
120
611 572
2941
701
1650
2976
1366
1456
1237
2913
3496
3452
1152
1042
110
890
100
% Transmitance
90
1274
804
80
1453
2881
1328
70
663
3331
1670
2973
60
2927
1381
544 604
50
1088
880
40 Zn with Artichoke extract
1046
Artichoke extract
30
4000 3500 3000 2500 2000 1500 1000 500
Wave numbers (cm-1)
Figure 17. FT-IR spectra for AE and for Zn metal after immersion in the inhibited acid corrosive medium.
3.3.5. UV spectroscopy.
UV–visible spectroscopic checking can be employed to affirm the prospect of complex
formation between metal and inhibitor.
2.5
Absorbance
2.0
1.5
1.0 Artichoke extract
Artichoke extract + Zn
220 230 240 250 260 270 280
Wave length (nm)
Figure 18. UV–visible absorption spectra of inhibited acid corrosive medium without and with Zn immersion.
The spectra of UV–visible absorption for the corrosive acid medium with 300 ppm of
AE without and with Zn immersion are seen in Figure 18. There is a shift in absorbance after
Zn immersion. This reveals the formation of a complex between AE and Zn that is responsible
for the inhibition activity. Generally, the alteration in the maximum absorbance position and
the absorbance value denotes forming a complex between within solution between two species
[62]. The shape of the spectra with Zn and without its immersion has no significant variation.
It indicates the physical adsorption of the AE on the Zn surface.
3.4. Biological effect.
The biological effect of acute toxicity tests was done for artichoke extract using the
Doc-it colony instrument. Original photos of bacteria colonies and the photos using the
instrument, for blank and AE, were demonstrated in Figure 19. The number of bacteria colonies
cultivated obtained using the Doc-it colony instrument was shown in Table 8. The results of
https://nanobioletters.com/ 2671https://doi.org/10.33263/LIANBS104.26552679
Table 8 show that the number of bacteria colonies for AE (88 colonies) was lesser than the
blank (287 colonies), meaning that AE has a kindly impact in preventing multiplying bacteria,
and so the CR decreased.
(a1) original photo for blank (a2) original photo for AE
(b1) photo by Doc-it instrument for blank (b2) photo by Doc-it instrument for AE
Figure 19. Original photos of bacteria colonies for (a1) blank; (a2) AE; photos by Doc-it colony instrument for
(b1) blank; (b2) AE.
Table 8. Number of bacteria colonies for blank and for AE as obtained using Doc-it colony counter instrument.
Sample No of bacteria colonies
Blank 287
AE 88
3.5. Quantum mechanics and molecular dynamics simulations studies.
3.5.1. Quantum mechanics.
The plant extract contains many compounds in low ratios. But, there are two major
compounds, they are Apigenin and Luteolin. Their chemical composition as shown in Table 9.
Figure 20 shows the optimum geometry structure of LUMO & HOMO orbitals for Apigenin
and Luteolin compounds.
Table 9. Chemical structure, Chemical formula, and molar mass of Apigenin and Luteolin.
Apigenin Luteolin
Chemical
structure
IUPAC name 5,7-Dihydroxy-2-(4-hydroxyphenyl)-4H-1- 2-(3,4-Dihydroxyphenyl)- 5,7-dihydroxy-4-
benzopyran-4-one chromenone
Chemical formula C15H10O5 C15H10O6
Molar mass 270.240 g·mol−1 286.239 g·mol−1
https://nanobioletters.com/ 2672https://doi.org/10.33263/LIANBS104.26552679
Apigenin Luteolin
HOMO
LUMO
Figure 20. The optimum geometry structure and LUMO & HOMO orbitals for Apigenin and Luteolin
compounds.
2.5.2. Dynamics simulations studies.
Figure 21 illustrates the suitable arranging to absorb AE constituents on the Fe (1 1 0)
substrate. Table 11 shows the simulation of Monte Carlo resulting; distortion energies, total
energy and solid adsorption. Total energy (substrate energy) is the totality of the energy of solid
adsorption, molecules, and deformation energy. The substrate energy is taken as zero. In
addition, the adsorption energy shows the gained or wanted energy when the comfortable
adsorption of AE compounds takes place on the substrate. The rigid adsorption energy shows
the gained or wanted energy when the uncomfortable adsorption of AE compounds has
happened. It has occurred before the geometry optimization adsorption has occurred onto the
substrate. It takes place before occurring the geometry optimization adsorption onto the
substrate. The deformation energy is liberalized when the adsorption of AE compounds is
restful on the substrate. The energy of substrate - adsorbate conformations (dEads / dNi)
exhibits that one of the adsorbed compounds is taken away [69]. The results in Table 11
confirm that the examined AE shows high adsorption on the Zn surface.
Table 10 illustrates the quantum chemistry parameters (ELUMO, EHOMO, dipole moment
(μ), and energy gap (E)) for AE constituents. EHOMO signifies the susceptibility of molecules
to grant electrons to the d orbital of Zn, so molecules with high EHOMO values have the potency
to grant electrons to the metal surface. Negative EHOMO values signalize physical adsorption
rather than chemical one [63,64]. ELUMO represents the capability of metal orbital to gain an
electron, and its low value shows more capability for electrons accepting [65,66]. An inverse
relationship between molecule reactivity and energy gap (∆E) means that the smaller energy
gap shows good corrosion inhibition because the ionization energy needed to eliminate the
electron from the exterior orbit shell is low. The dipole moment (μ) represents the electrons
distribution in the molecule, and it is a measure of the bond polarity [67]. A high μ indicates a
strong dipole-dipole interaction with the Zn surface and tool up a good corrosion inhibition
[68]. The quantum studies results confirm the experimental outcomes and show good inhibition
of AE towards Zn corrosion.
https://nanobioletters.com/ 2673https://doi.org/10.33263/LIANBS104.26552679
Table 10. The quantum chemistry parameters (ELUMO, EHOMO, dipole moment (μ), and E energy cavity) for AE
constituents.
Comp. EHOMO (ev) ELUMO (ev) ΔE (ev) Dipole moment (Debye)
Apigenin -5.505 -1.361 4.144 2.4448
Luteolin -5.475 -1.348 4.127 7.1421
Side View Top View
Apigenin
Luteolin
Figure 21. The suitable arranging to absorb AE constituents on the Fe (1 1 0) substrate.
Table 11. The simulation of Monte Carlo resulting; distortion energies, total energy, and solid adsorption.
Structures Total Adsorption Rigid Deformation Compound H2O
Energy Energy adsorption Energy dEad/dNi dEad/dNi
energy
Fe (1 1 0)/ -3228.3 -3154.7 -3312.5 157.8 -185.6 -8.3
Apigenin/H2O
Fe (1 1 0)/ Luteolin -3290.0 -3217.4 -3372.8 155.3 -200.1 -8.8
/H2O
3.6. Inhibition mechanism analysis.
From the experiment results, the corrosion inhibition mechanism for Zn in the corrosive
acid medium using AE can be explained from the view of adsorption. The main constituents of
AE are Apigenin and Luteolin, which contain the oxygen atoms, hydroxyl groups, and three
benzene rings in their structures. The adsorption process can be deemed as a mono exchange
process in which the aqueous molecule (I) replaces several adsorbed water molecules (x) on
the metal surface [70]:
I(aq) + x H2O (sur) → I(sur) + x H2O(aq) (15)
The adsorption process can be affected by factors such as; charged surface, inhibitor
structure, and the scuttled charge along the inhibitor molecule. The adsorption may be a
https://nanobioletters.com/ 2674https://doi.org/10.33263/LIANBS104.26552679
physisorption or chemisorption reaction. Generally, the physisorption process needs the
existence of charged metal surfaces and charged molecules. At firstly, the anionic acid species
were adsorbed on the Zn surface, making the surface negative. The protonated extract
components can then be adsorbed on the surface. In the chemisorption process, the coordinate
bond is formed between the extract and the metal surface by sharing or transferring the charge.
The existence of transition metal with unoccupied orbital and extracts with chemical
constituents containing π-electrons and hetero atoms with a free lone pair of electrons (ex. N,
O, S) is necessary and widely aid in the adsorption process [71].
4. Conclusions
AE showed good % IE reached 93.2 % at 300 ppm concentration. Adsorption of extract
on Zn surface obeyed Langmuir isotherm. The inhibition action improved with increasing AE
concentrations and decreased as the temperature increases. The adsorption of AE on Zn surface
accords with Langmuir adsorption isotherm. Potentiodynamic polarization tests detected the
extract worked as a mixed-type inhibitor with cathodic dominance. EIS tests displayed that a
protective layer was formed on the Zn surface. This accords with the decrease in the Cdl value
and the increase of the Rp with increasing AE concentration. The SEM/EDX, FTIR, and AFM
examine presented a protective film of extract molecules above the Zn surface. The shape of
UV spectroscopic indicated physisorption. The biological effect indicated that the number of
Bacteria colonies for AE was lesser than the blank. Quantum mechanics and molecular
dynamics simulation studies confirm the experimental results. Based on all outcomes of the
applied techniques, it is attained that the employed extract works as a good corrosion inhibitor
for zinc in acid solution, and its efficiency in the inhibition process raises with the increase in
its concentration and decreases with the temperature rise.
Funding
This research received no external funding.
Acknowledgments
The authors are grateful to the Chemistry Department (especially corrosion laboratory), Faculty
of Science, Mansoura University, for providing laboratory facilities for completing this work.
Conflicts of Interest
The authors declare no conflict of interest.
References
1. Garcia, G.; Cavallaro, L.; Broussalis, A.; Ferraro, G.; Martino, V.; De Torres, R.; Coussio, J.; Campos, R.
Antiviral activity of Achyrocline flaccida Wein DC aqueous extract. Phytotherapy Research 1995, 9, 251-
254, https://doi.org/10.1002/ptr.2650090404.
2. Manov, S.; Noli, F.; Lamazouere, A.M.; Aries, L. Surface treatment for zinc corrosion protection by a new
organic chelating reagent. Journal of Applied Electrochemistry 1999, 29, 995-1003,
https://doi.org/10.1023/A:1003585816876.
3. Wranglen, G. An introduction to corrosion and protection of metals; 1985.
4. Fouda, A.S.; Shalabi, K.; Nofal, A.M.; Elzekred, M.A. Methanol Extract of Rumex Vesicarius L. as Eco-
Friendly Corrosion Inhibitor for Carbon Steel in Sulfuric Acid Solution. Chemical Science Transactions
2018, 7, 101-111, https://doi.org/10.7598/cst2018.1430.
https://nanobioletters.com/ 2675https://doi.org/10.33263/LIANBS104.26552679
5. Fouda, A.S.; Abdel Haleem, E. Berry Leaves Extract as Green Effective Corrosion Inhibitor for Cu in Nitric
Acid Solutions. Surface Engineering and Applied Electrochemistry 2018, 54, 498-507,
https://doi.org/10.3103/S1068375518050034.
6. Fouda, A.S.; Rashwan, S.M.; Darwish, M.M.K.; Arman, N.M. Corrosion inhibition of Zn in a 0.5 M HCl
solution by Ailanthus altissima extract. Portugaliae Electrochimica Acta 2018, 36, 309-323,
https://doi.org/10.4152/pea.201805309.
7. Elabbasy, H.M.; Fouda, A.S. Olive leaf as green corrosion inhibitor for C-steel in Sulfamic acid solution.
Green Chemistry Letters and Reviews 2019, 12, 332-342, https://doi.org/10.1080/17518253.2019.1646812.
8. Fouda, A.S.; Elabbasy, H.M. Corrosion inhibition effect of methanol extract of nerium oleander on copper in
nitric acid solutions. Int. J. Electrochem. Sci. 2019, 14, 6884-6901, https://doi.org/10.20964/2019.07.31.
9. Elabbasy, H.M. Investigation of Withania Somnifera Extract as Corrosion Inhibitor for Copper in Nitric Acid
Solutions. Int. J. Electrochem. Sci 2019, 14, 5355-5372, https://doi.org/10.20964/2019.06.23.
10. Bahlakeh, G.; Ramezanzadeh, B.; Dehghani, A.; Ramezanzadeh, M. Novel cost-effective and high-
performance green inhibitor based on aqueous Peganum harmala seed extract for mild steel corrosion in HCl
solution: Detailed experimental and electronic/atomic level computational explorations. J. Mol. Liq. 2019,
283, 174-195, https://doi.org/10.1016/j.molliq.2019.03.086.
11. Dehghani, A.; Bahlakeh, G.; Ramezanzadeh, B.; Ramezanzadeh, M. Detailed macro-/micro-scale exploration
of the excellent active corrosion inhibition of a novel environmentally friendly green inhibitor for carbon
steel in acidic environments. Journal of the Taiwan Institute of Chemical Engineers 2019, 100, 239-261,
https://doi.org/10.1016/j.jtice.2019.04.002.
12. Sanaei, Z.; Ramezanzadeh, M.; Bahlakeh, G.; Ramezanzadeh, B. Use of Rosa canina fruit extract as a green
corrosion inhibitor for mild steel in 1M HCl solution: A complementary experimental, molecular dynamics
and quantum mechanics investigation. Journal of Industrial and Engineering Chemistry 2019, 69, 18-31,
https://doi.org/10.1016/j.jiec.2018.09.013.
13. Keramatinia, M.; Ramezanzadeh, B.; Mahdavian, M. Green production of bioactive components from herbal
origins through one-pot oxidation/polymerization reactions and application as a corrosion inhibitor for mild
steel in HCl solution. Journal of the Taiwan Institute of Chemical Engineers 2019, 105, 134-149,
https://doi.org/10.1016/j.jtice.2019.10.005.
14. Asadi, N.; Ramezanzadeh, M.; Bahlakeh, G.; Ramezanzadeh, B. Utilizing Lemon Balm extract as an effective
green corrosion inhibitor for mild steel in 1M HCl solution: A detailed experimental, molecular dynamics,
Monte Carlo and quantum mechanics study. Journal of the Taiwan Institute of Chemical Engineers 2019, 95,
252-272, https://doi.org/10.1016/j.jtice.2018.07.011.
15. majd, M.T.; Ramezanzadeh, M.; Bahlakeh, G.; Ramezanzadeh, B. Probing molecular adsorption/interactions
and anti-corrosion performance of poppy extract in acidic environments. J. Mol. Liq. 2020, 304, 112750,
https://doi.org/10.1016/j.molliq.2020.112750.
16. Dehghani, A.; Bahlakeh, G.; Ramezanzadeh, B.; Ramezanzadeh, M. Aloysia citrodora leaves extract
corrosion retardation effect on mild-steel in acidic solution: Molecular/atomic scales and electrochemical
explorations. J. Mol. Liq. 2020, 310, 113221, https://doi.org/10.1016/j.molliq.2020.113221.
17. Dehghani, A.; Bahlakeh, G.; Ramezanzadeh, B.; Ramezanzadeh, M. Potential role of a novel green eco-
friendly inhibitor in corrosion inhibition of mild steel in HCl solution: Detailed macro/micro-scale
experimental and computational explorations. Construction and Building Materials 2020, 245, 118464,
https://doi.org/10.1016/j.conbuildmat.2020.118464.
18. Ngouné, B.; Pengou, M.; Nouteza, A.M.; Nanseu-Njiki, C.P.; Ngameni, E. Performances of Alkaloid Extract
from Rauvolfia macrophylla Stapf toward Corrosion Inhibition of C38 Steel in Acidic Media. ACS Omega
2019, 4, 9081-9091, https://doi.org/10.1021/acsomega.9b01076.
19. Putilova, I.N.; Balezin, S.A.e.; Barannik, V.P. Metallic corrosion inhibitors; Pergamon Press: 1960.
20. Shehata, O.S.; Korshed, L.A.; Attia, A. Green corrosion inhibitors, past, present, and future, corrosion
inhibitors, principles and recent applications. London: IntechOpen 2017,
http://dx.doi.org/10.5772/intechopen.72753.
21. Rottenberg, A.; Zohary, D. The wild ancestry of the cultivated artichoke. Genet. Resour. Crop Evol. 1996,
43, 53-58, https://doi.org/10.1007/BF00126940.
22. Ladha, D.G.; Naik, D.U.; Shah, N.K. Investigation of Cumin (Cuminum Cyminum) extract as an eco-friendly
green corrosion inhibitor for pure aluminium in acid medium. Journal of Materials and Environmental
Science 2013, 4, 701-708, https://www.researchgate.net/publication/287707875.
23. Cesar, G. Plant Phenolics and Human Health–Biochemistry. Nutrition and Pharmacology. Wiley 2009, 632.
https://nanobioletters.com/ 2676https://doi.org/10.33263/LIANBS104.26552679
24. Bruneton, J. Pharmacognosy, phytochemistry, medicinal plants; Lavoisier publishing: 1995.
25. Adzet, T.; Puigmacia, M. High-performance liquid chromatography of caffeoylquinic acid derivatives of
Cynara scolymus L. leaves. J. Chromatogr. 1985, 348, 447-453, https://doi.org/10.1016/S0021-
9673(01)92486-0.
26. ASTM G 1-90, Standard practice for preparing, cleaning, and evaluating corrosion test specimens. 1999.
27. Talati, J.D.; Desai, M.N.; Shah, N.K. Ortho‐, meta‐, and para‐aminophenol‐N‐salicylidenes as corrosion
inhibitors of zinc in sulfuric acid. Anti-Corrosion Methods and Materials 2005, 52, 108-117,
https://doi.org/10.1108/00035590510584825.
28. Guruprasad, A.M.; Sachin, H.P.; Swetha, G.A.; Prasanna, B.M. Adsorption and inhibitive properties of
seroquel drug for the corrosion of zinc in 0.1 M hydrochloric acid solution. International Journal of Industrial
Chemistry 2019, 10, 17-30, https://doi.org/10.1007/s40090-018-0168-x.
29. Abdel-Rehim, S.S.; Khaled, K.F.; Abd-Elshafi, N.S. Electrochemical frequency modulation as a new
technique for monitoring corrosion inhibition of iron in acid media by new thiourea derivative. Electrochim.
Acta 2006, 51, 3269-3277, https://doi.org/10.1016/j.electacta.2005.09.018.
30. Bosch, R.W.; Hubrecht, J.; Bogaerts, W.F.; Syrett, B.C. Electrochemical Frequency Modulation: A New
Electrochemical Technique for Online Corrosion Monitoring. Corrosion 2001, 57, 60-70,
https://doi.org/10.5006/1.3290331.
31. El-Etre, A.Y.; Abdallah, M. Natural honey as corrosion inhibitor for metals and alloys. II. C-steel in high
saline water. Corros. Sci. 2000, 42, 731-738, https://doi.org/10.1016/S0010-938X(99)00106-7.
32. Kaczerewska, O.; Leiva-Garcia, R.; Akid, R.; Brycki, B.; Kowalczyk, I.; Pospieszny, T. Effectiveness of O-
bridged cationic gemini surfactants as corrosion inhibitors for stainless steel in 3M HCl: Experimental and
theoretical studies. J. Mol. Liq. 2018, 249, 1113-1124, https://doi.org/10.1016/j.molliq.2017.11.142.
33. Lgaz, H.; Salghi, R.; Subrahmanya Bhat, K.; Chaouiki, A.; Shubhalaxmi; Jodeh, S. Correlated experimental
and theoretical study on inhibition behavior of novel quinoline derivatives for the corrosion of mild steel in
hydrochloric acid solution. J. Mol. Liq. 2017, 244, 154-168, https://doi.org/10.1016/j.molliq.2017.08.121.
34. Ramesh Saliyan, V.; Adhikari, A.V. Inhibition of corrosion of mild steel in acid media by N′-benzylidene-3-
(quinolin-4-ylthio)propanohydrazide. Bull. Mater. Sci. 2008, 31, 699-711, https://doi.org/10.1007/s12034-
008-0111-4.
35. El-Aal, A.; Sliem, M.; Abdullah, A. Caprylamidopropyl Betaine as a highly efficient eco-friendly corrosion
inhibitor for API X120 steel in 1 M H2SO4. Egyptian Journal of Chemistry 2020, 63, 759-776,
https://doi.org/10.21608/ejchem.2019.13652.1844.
36. Abdul Rahiman, A.F.S.; Sethumanickam, S. Corrosion inhibition, adsorption and thermodynamic properties
of poly(vinyl alcohol-cysteine) in molar HCl. Arabian Journal of Chemistry 2017, 10, S3358-S3366,
https://doi.org/10.1016/j.arabjc.2014.01.016.
37. Döner, A.; Kardaş, G. N-Aminorhodanine as an effective corrosion inhibitor for mild steel in 0.5M H2SO4.
Corros. Sci. 2011, 53, 4223-4232, https://doi.org/10.1016/j.corsci.2011.08.032.
38. Manaranche, C.; Hornberger, H. A proposal for the classification of dental alloys according to their resistance
to corrosion. Dent. Mater. 2007, 23, 1428-1437, https://doi.org/10.1016/j.dental.2006.11.030.
39. Zeino, A.; Abdulazeez, I.; Khaled, M.; Jawich, M.W.; Obot, I.B. Mechanistic study of polyaspartic acid
(PASP) as eco-friendly corrosion inhibitor on mild steel in 3% NaCl aerated solution. J. Mol. Liq. 2018, 250,
50-62, https://doi.org/10.1016/j.molliq.2017.11.160.
40. Guo, L.; Kaya, S.; Obot, I.B.; Zheng, X.; Qiang, Y. Toward understanding the anticorrosive mechanism of
some thiourea derivatives for carbon steel corrosion: A combined DFT and molecular dynamics investigation.
J. Colloid Interface Sci. 2017, 506, 478-485, https://doi.org/10.1016/j.jcis.2017.07.082.
41. El-Sayed Shehata, O. Effect of acetamide derivative and its Mn-complex as corrosion inhibitor for mild steel
in sulphuric acid. Egyptian Journal of Chemistry 2017, 60, 243-259,
https://doi.org/10.21608/ejchem.2017.674.1014.
42. Hamani, H.; Douadi, T.; Daoud, D.; Al-Noaimi, M.; Rikkouh, R.A.; Chafaa, S. 1-(4-Nitrophenylo-imino)-1-
(phenylhydrazono)-propan-2-one as corrosion inhibitor for mild steel in 1M HCl solution: Weight loss,
electrochemical, thermodynamic and quantum chemical studies. J. Electroanal. Chem. 2017, 801, 425-438,
https://doi.org/10.1016/j.jelechem.2017.08.031.
43. Laamari, M.R.; Benzakour, J.; Berrekhis, F.; Derja, A.; Villemin, D. Adsorption and corrosion inhibition of
carbon steel in hydrochloric acid medium by hexamethylenediamine tetra(methylene phosphonic acid).
Arabian Journal of Chemistry 2016, 9, S245-S251, https://doi.org/10.1016/j.arabjc.2011.03.018.
https://nanobioletters.com/ 2677https://doi.org/10.33263/LIANBS104.26552679
44. Chauhan, D.S.; Ansari, K.R.; Sorour, A.A.; Quraishi, M.A.; Lgaz, H.; Salghi, R. Thiosemicarbazide and
thiocarbohydrazide functionalized chitosan as ecofriendly corrosion inhibitors for carbon steel in
hydrochloric acid solution. Int. J. Biol. Macromol. 2018, 107, 1747-1757,
https://doi.org/10.1016/j.ijbiomac.2017.10.050.
45. Salhi, A.; Tighadouini, S.; El-Massaoudi, M.; Elbelghiti, M.; Bouyanzer, A.; Radi, S.; El Barkany, S.; Bentiss,
F.; Zarrouk, A. Keto-enol heterocycles as new compounds of corrosion inhibitors for carbon steel in 1M HCl:
Weight loss, electrochemical and quantum chemical investigation. J. Mol. Liq. 2017, 248, 340-349,
https://doi.org/10.1016/j.molliq.2017.10.040.
46. Mohan, R.; Joseph, A. Corrosion protection of mild steel in hydrochloric acid up to 313K using propyl
benzimidazole: Electroanalytical, adsorption and quantum chemical studies. Egyptian Journal of Petroleum
2018, 27, 11-20, https://doi.org/10.1016/j.ejpe.2016.12.003.
47. Benabdellah, M.; Tounsi, A.; Khaled, K.F.; Hammouti, B. Thermodynamic, chemical and electrochemical
investigations of 2-mercapto benzimidazole as corrosion inhibitor for mild steel in hydrochloric acid
solutions. Arabian Journal of Chemistry 2011, 4, 17-24, https://doi.org/10.1016/j.arabjc.2010.06.010.
48. Reis, F.M.; de Melo, H.G.; Costa, I. EIS investigation on Al 5052 alloy surface preparation for self-
assembling monolayer. Electrochim. Acta 2006, 51, 1780-1788,
https://doi.org/10.1016/j.electacta.2005.02.118.
49. Solmaz, R.; Kardaş, G.; Çulha, M.; Yazıcı, B.; Erbil, M. Investigation of adsorption and inhibitive effect of
2-mercaptothiazoline on corrosion of mild steel in hydrochloric acid media. Electrochim. Acta 2008, 53,
5941-5952, https://doi.org/10.1016/j.electacta.2008.03.055.
50. Tao, Z. H.; Zhang, S. T.; Li, W. H.; Hou, B. R. Corrosion inhibition of mild steel in acidic solution by some
oxo-triazole derivatives. Corros. Sci. 2009, 51, 2588-2595, https://doi.org/10.1016/j.corsci.2009.06.042.
51. Yousefi, A.; Javadian, S.; Dalir, N.; Kakemam, J.; Akbari, J. Imidazolium-based ionic liquids as modulators
of corrosion inhibition of SDS on mild steel in hydrochloric acid solutions: experimental and theoretical
studies. RSC Advances 2015, 5, 11697-11713, https://doi.org/10.1039/C4RA10995C.
52. Volpi, E.; Foiadelli, C.; Trasatti, S.; Koleva, D.A. Development of Smart Corrosion Inhibitors for Reinforced
Concrete Structures Exposed to a Microbial Environment. Ind. Eng. Chem. Res. 2017, 56, 5778-5794,
https://doi.org/10.1021/acs.iecr.7b00127.
53. Zheng, X.; Gong, M.; Li, Q.; Guo, L. Corrosion inhibition of mild steel in sulfuric acid solution by loquat
(Eriobotrya japonica Lindl.) leaves extract. Sci. Rep. 2018, 8, 9140, https://doi.org/10.1038/s41598-018-
27257-9.
54. Shalabi, K.; Abdallah, Y.; Hassan, H.; Fouda, A. Effects of Arctostaphylos uva-ursi Extract as Green
Corrosion Inhibitor for Cu10Ni Alloy in 1 M HNO3. International journal of electrochemical science 2014,
9, 5073, https://www.researchgate.net/publication/263274403.
55. Fouda, A.; Shalabi, K.; Elewady, G.; Emrayed, H. Chalcone Derivatives as Corrosion Inhibitors for Carbon
Steel in 1 M HCl Solutions. International journal of electrochemical science 2014, 9, 7038-7058,
https://www.researchgate.net/publication/266262341.
56. Rajendran, S.; Thangavelu, C.; Annamalai, G. Inhibition of corrosion of aluminium in alkaline medium by
succinic acid in conjunction with zinc sulphate and diethylene triamine penta (Methylene phosphonic acid).
J. Chem. Pharm. Res. 2012, 4, 4836-4844, https://www.researchgate.net/publication/286571211.
57. Mu, G.; Li, X.; Liu, G. Synergistic inhibition between tween 60 and NaCl on the corrosion of cold rolled steel
in 0.5M sulfuric acid. Corros. Sci. 2005, 47, 1932-1952, https://doi.org/10.1016/j.corsci.2004.09.020.
58. Wang, B.; Du, M.; Zhang, J.; Gao, C.J. Electrochemical and surface analysis studies on corrosion inhibition
of Q235 steel by imidazoline derivative against CO2 corrosion. Corros. Sci. 2011, 53, 353-361,
https://doi.org/10.1016/j.corsci.2010.09.042.
59. Chugh, B.; Singh, A.K.; Thakur, S.; Pani, B.; Lgaz, H.; Chung, I.-M.; Jha, R.; Ebenso, E.E. Comparative
Investigation of Corrosion-Mitigating Behavior of Thiadiazole-Derived Bis-Schiff Bases for Mild Steel in
Acid Medium: Experimental, Theoretical, and Surface Study. ACS Omega 2020, 5, 13503-13520,
https://doi.org/10.1021/acsomega.9b04274.
60. Obi-Egbedi, N.O.; Obot, I.B. Xanthione: A new and effective corrosion inhibitor for mild steel in sulphuric
acid solution. Arabian Journal of Chemistry 2013, 6, 211-223, https://doi.org/10.1016/j.arabjc.2010.10.004.
61. Ituen, E.; Akaranta, O.; James, A. Green anticorrosive oilfield chemicals from 5-hydroxytryptophan and
synergistic additives for X80 steel surface protection in acidic well treatment fluids. J. Mol. Liq. 2016, 224,
408-419, https://doi.org/10.1016/j.molliq.2016.10.024.
https://nanobioletters.com/ 2678You can also read