Genomic analysis of red-tide water bloomed with Heterosigma akashiwo in Geoje - PeerJ
←
→
Page content transcription
If your browser does not render page correctly, please read the page content below
Genomic analysis of red-tide water
                                     bloomed with Heterosigma akashiwo in
                                     Geoje
                                     Hye-Eun Kang1 , Tae-Ho Yoon2 , Sunyoung Yoon2 , Hak Jun Kim3 , Hyun Park4 ,
                                     Chang-Keun Kang5 and Hyun-Woo Kim1
                                 1
                                   Department of Marine Biology, Pukyong National University, Busan, Republic of Korea
                                 2
                                   Interdisciplinary program of Biomedical, Mechanical and Electrical Engineering, Pukyong National
                                   University, Busan, Republic of Korea
                                 3
                                   Department of Chemistry, Pukyong National University, Busan, Republic of Korea
                                 4
                                   Korea Polar Research Institute, Korea Ocean Research and Development Institute, Busan, Republic of Korea
                                 5
                                   School of Environmental Science and Engineering, Gwangju Institute of Science and Technology, Gwangju,
                                   Republic of Korea

                                         ABSTRACT
                                         Microbial community structures of harmful algal bloom (HAB) caused by Het-
                                         erosigma akashiwo in Geoje were analyzed using the MiSeq platform. To analyze
                                         phytoplankton communities without cross-reactivity with predominant bacteria, a
                                         new phytoplankton-specific 23S universal primer set was designed by modifying two
                                         previously used ones. The new universal primer set turned out to be a useful tool
                                         for the analysis of the phytoplankton community; it showed a high specificity for
                                         phytoplankton without cross-reactivity to bacterial sequences as well as the wide
                                         taxon coverage presenting from prokaryotic cyanobacteria to eukaryotic algae. Next
                                         Generation Sequencing (NGS) data generated by two universal primer sets (16S and
                                         23S) provided useful information about the H. akashiwo bloom. According to the
                                         23S universal primer set, proportions of H. akashiwo increased by more than 200-
                                         fold as the bloom occurred and its numbers were high enough to detect in control
                                         sites. Its operational taxonomic units (OTUs) were detected in the bloom sites at
                                         low proportions suggesting that the 16S universal primer set may not be as effective
Submitted 7 February 2018                for monitoring harmful algal blooming (HAB) as the 23S universal primer set. In
Accepted 7 May 2018                      addition, several abundant OTUs in Chlorophyta were not presented by the 16S
Published 29 May 2018                    universal primer set in this study. However, the 16S primer set was useful for detecting
Corresponding author                     decreases in Foraminifera as HAB occurred suggesting that genomic analyses using two
Hyun-Woo Kim, kimhw@pknu.ac.kr           universal primer sets would provide more reliable data for understanding microbial
Academic editor                          community changes by various environmental or ecological events, including HAB.
Joseph Craine                            Genomic analyses using two universal primer sets was also useful for determining a
Additional Information and               correlation between microbial components as HAB occurred. Heterosigma akashiwo
Declarations can be found on             was positively correlated with other bloom species, including Karenia mikimotoi,
page 20
                                         Teleaulax amphioxeia, and bacteria in Verrucomicrobia.
DOI 10.7717/peerj.4854

    Copyright
2018 Kang et al.                     Subjects Ecology, Genomics, Marine Biology, Molecular Biology
                                     Keywords Red-tide, HABs, Algal bloom, PCR, Coastal water, Next generation sequencing,
Distributed under                    Microorganism
Creative Commons CC-BY 4.0

OPEN ACCESS

                                     How to cite this article Kang et al. (2018), Genomic analysis of red-tide water bloomed with Heterosigma akashiwo in Geoje. PeerJ
                                     6:e4854; DOI 10.7717/peerj.4854
INTRODUCTION
                                   Red tide is a common name for the algal bloom of a few species of phytoplankton in coastal
                                   waters, which takes on a red or brown color depending on the type of algae (Glibert et al.,
                                   2005). These are also referred to as harmful algal blooms (HABs), which emphasizes their
                                   harmfulness (Smayda, 1997). The noxiousness of HABs is not limited to the health of people
                                   and marine ecosystems in the affected regions, it also adversely affects local and regional
                                   economies. In Korea, direct losses due to HAB from 2001 to 2012 amounted to about
                                   52 million US dollars (Lee et al., 2014a). To develop a way to reduce the adverse effects
                                   of HABs, understanding their underlying mechanisms and early forecasting are crucial.
                                   Although many factors are known to contribute to HABs, including nutrient loadings
                                   and pollution (Anderson, Glibert & Burkholder, 2002; Moore et al., 2008; Sellner, Doucette
                                   & Kirkpatrick, 2003; Smayda, 1989), food web alterations (Anderson, 2009), introduced
                                   species (Hallegraeff, 1992), water flow modifications (Lee et al., 2014b; Sellner, Doucette
                                   & Kirkpatrick, 2003), and climate change (Peperzak, 2003; Wells et al., 2015), we still do
                                   not fully understand the complex interactions between factors which can create such an
                                   explosive growth in algal colonies.
                                       Regular phytoplankton surveys are now being performed to monitor blooms in many
                                   countries, including Korea. Traditional phytoplankton surveys are conducted by optical
                                   observations in which each species and its numbers are identified based on their distinct
                                   morphological characteristics and counted. However, species-specific morphological
                                   characteristics are often indistinguishable, and it requires a lot of time and effort by
                                   well-trained experts. These have been the major obstacles preventing long-term or
                                   large-scale surveys. Recently, molecular techniques are being utilized as an alternative
                                   method because of their capacity for fast and reliable species identification (see Humbert,
                                   Quiblier & Gugger, 2010). These techniques include conventional PCR (Hirashita et al.,
                                   2000), denaturing gradient gel electrophoresis (DGGE) (Riemann, Steward & Azam, 2000;
                                   Rooney-Varga et al., 2005), Restriction fragment length polymorphism (RFLP) (González
                                   et al., 2000), fluorescence in situ hybridization (FISH) (Morris, Longnecker & Giovannoni,
                                   2006; Teeling et al., 2012), and quantitative PCR (Antonella & Luca, 2013). However, these
                                   techniques are limited because only a few algal species can be analyzed at a time and the
                                   complex interactions within a microbial community cannot be understood by studying a
                                   few dominant species.
                                       The next generation sequencing (NGS) technique is now being regarded because of its
                                   capacity to analyze entire community structures of the collected samples at a relatively
                                   low cost and over a short period of time. In fact, metatranscriptomic analyses (Gong et
                                   al., 2017; Rinta-Kanto et al., 2012) and metagenomic studies (Howard et al., 2011; Li et al.,
                                   2011; Yang et al., 2015) present the entire microbial community and biological processes
                                   of an algal bloom. These results strongly suggest that total microbial community changes
                                   should be analyzed to understand the biological processes driving the algal bloom rather
                                   than solely focusing on changes in dinoflagellates.
                                       Most genomic analyses are based on the massive sequencing of amplicons generated by
                                   the universal primer set. Since its first development (Weisburg et al., 1991), the 16S universal

Kang et al. (2018), PeerJ, DOI 10.7717/peerj.4854                                                                             2/25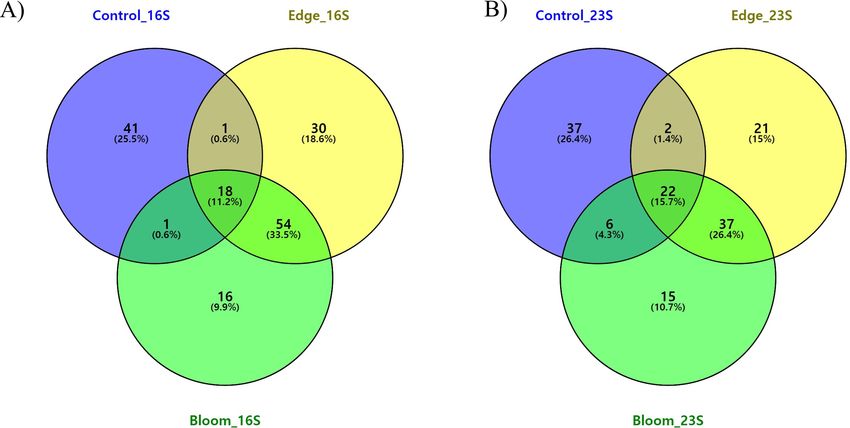
primer set has been the most widely used because of its broad coverage in microbial
                                   community studies (Herlemann et al., 2011; Hunt et al., 2013; Sogin et al., 2006) However,
                                   it has often been difficult to analyze changes in phytoplankton communities using the 16S
                                   universal primer set due to the outnumbered heterotrophic bacterial sequences in water
                                   samples. 16S universal primers do not cover all phytoplankton taxa from cyanobacteria
                                   to eukaryotic algae in the 16S rDNA region, and most studies analyze specific taxonomic
                                   groups, especially for bacterial communities (Cruaud et al., 2014; Logares et al., 2014;
                                   Massana et al., 2015; Valenzuela-González et al., 2016). In order to overcome the difficulty,
                                   18S universal primer set was adopted to increase the coverage and sensitivity for eukaryotic
                                   phytoplankton (Bradley, Pinto & Guest, 2016; Stoeck et al., 2010; Tragin, Zingone & Vaulot,
                                   2018). However, cyanobacteria cannot be amplified by the primer set. In a case to analyze
                                   phytoplankton species, universal primer sets targeting the plastid 23S rDNA region
                                   were designed, but they showed cross-reactivity, amplifying considerable amounts of
                                   heterotrophic bacterial sequences as well as those of phytoplankton (Sherwood & Presting,
                                   2007; Yoon et al., 2016). Here, we modified the previously designed universal primer set
                                   targeting 23S primers to understand changes in phytoplankton communities from the
                                   water samples of algal bloom sites. Modified 23S universal primers presented a much
                                   higher specificity for phytoplankton sequences as well as a broader phytoplankton taxon
                                   coverage than previous universal primer sets. Using two universal primer sets (16S & 23S
                                   universal primers), we compared the community structures in water samples from three
                                   sample sites (Bloom, Edge, and Control sites) in Geoje, where HAB occurred in 2015.
                                   We also analyzed the correlations between heterotrophic bacteria and phytoplankton to
                                   determine the interactions between both groups during the bloom.

                                   MATERIALS & METHODS
                                   Phytoplankton-specific universal primer set optimized for the MiSeq
                                   platform
                                   A universal primer set was designed to increase specificity as well as taxon coverage
                                   of phytoplankton (Table 1). A total of 1,473 23S rDNA sequences (997 from
                                   proteobacteria and 476 from phytoplankton and cyanobacteria) obtained from the
                                   public databases including GenBank (https://www.ncbi.nlm.nih.gov/genbank/) & BOLD
                                   (http://www.barcodinglife.org) were compared using the Clustal omega program
                                   (http://www.ebi.ac.uk/Tools/msa/clustalo/). A new 23S universal forward primer
                                   (P23MISQF1) was designed by several modifications of the previously designed ones
                                   (Table S1). Briefly, we added the degenerate sequence at the seventh position from the
                                   50 end of P23MISQF1 to increase the taxon coverage for the Heterokonts (A/T), which
                                   was previously adenine (A) in the A23SrVF1 (Yoon et al., 2016; hereafter referred to as
                                   Yoon’s 23S universal primer) and p23SrV-f1 primers (Sherwood & Presting, 2007; hereafter
                                   referred to as Sherwood’s 23S universal primer). To increase specificity for phytoplankton,
                                   guanine (G) was added to the 30 end of P23MISQF1 (Table S1). We also introduced two
                                   changes in the reverse primer, P23MISQR1 (Table 1). First, the nitrogenous base in the fifth
                                   nucleotide from its 50 end was replaced by pyrimidine (Y) bases to increase the coverage of

Kang et al. (2018), PeerJ, DOI 10.7717/peerj.4854                                                                          3/25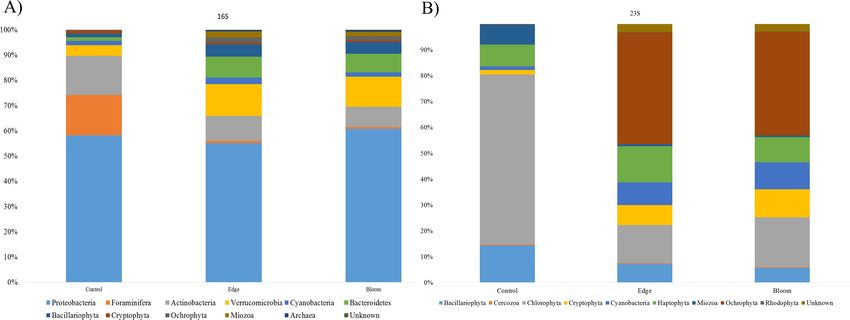
Table 1 Primers used in this study.
Primer 50 –30 Target region Reference
Bakt_341F CCTACGGGNGGCWGCAG 16S Herlemann et al. (2011)
Bakt_805R GACTACHVGGGTATCTAATCC 16S
p23SrV_f1 GGA CAG AAAGAC CCT ATG AA 23S Sherwood & Presting (2007)
p23SrV_r1 TCA GCCTGT TAT CCC TAG AG 23S
A23SrVF1 GGACARAAAGACCCTATG 23S Yoon et al. (2016)
A23SrVF2 CARAAAGACCCTATGMAGCT 23S
A23SrVR1 AGATCAGCCTGT TATCC 23S
A23SrVR2 TCAGCCTGTTATCCCTAG 23S
P23MISQF1 GGACARWAAGACCCTATGMAG 23S (present study)
P23MISQR1 AGATYAGCCTGTTATCCCT 23S
Nex Bakt_341F TCG TCG GCA GCG TCA GAT GTG TAT AAG AGA CAG 16S
CCT ACG GGN GGC WGC AG
Nex Bakt_805R GTC TCG TGG GCT CGG AGA TGT GTA TAA GAG ACA 16S
GGA CTA CHV GGG TAT CTA ATC C
Nex P23MISQF1 TCG TCG GCA GCG TCA GAT GTG TAT AAG AGA CAG 23S
GGA CAR WAA GAC CCT ATG MAG
Nex P23MISQR1 GTC TCG TGG GCT CGG AGA TGT GTA TAA GAG ACA 23S
GAG ATY AGC CTG TTA TCC CT
algal sequences (Table S2). The second modification was the addition of two nucleotides
at the 30 end of P23MISQR1 (Table S2), which increased both its melting temperature
(Tm ) and the sequence specificity for phytoplankton sequences. The expected sizes of
amplified products by the newly modified 23S universal primer set (hereafter referred to
as Kang’s 23S universal primer set) ranged from 407 to 414 bps, which is optimized for the
MiSeq platform. In order to evaluate the designed plastid 23S universal primer set, In-silico
PCR was performed on LSU-132 database (RefNR sequence collection) using the SILVA
TestPrime tool with zero mismatches (https://www.arb-silva.de/search/testprime/).
Sample collection and DNA extraction
We tested the reliability of Kang’s 23S universal primer set using two seawater samples
collected from the East/Japan Sea in 2014 as part of the ‘‘Long-term change of structure
and function in marine ecosystems of Korea’’ project funded by the Ministry of Oceans and
Fisheries, Korea. To analyze the bloom, water samples were collected on Aug 20, 2015 from
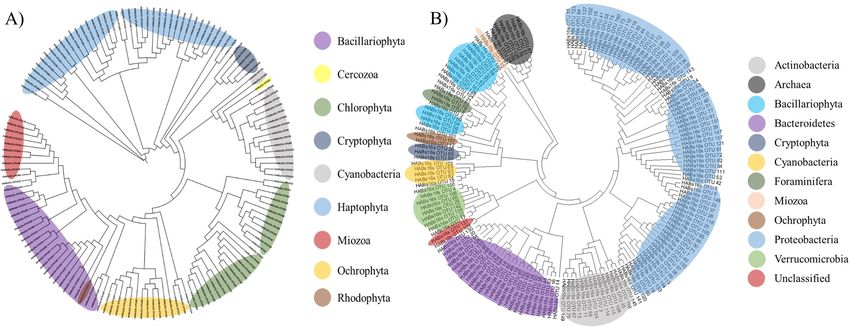
three sample sites in Geoje, Korea (Fig. 1). A water sample collected from a site distantly
located from the bloom (N34◦ 820 82500 , E128◦ 560 53300 ) was used as the control. Two water
samples were collected from the center of the bloom (N34◦ 800 11000 , E128◦ 520 57200 ) and at
its edge site, which was close to the bloom, but did not exhibit a water-color change (E
site; N34◦ 800 24500 , E128◦ 520 17500 ). From each sample site, 1L of surface water was collected
and stored in an ice bucket before filtration through a 0.45 µm GH polypro membrane
filter (Pall Corporation, New York, NY, USA). The membrane filters were then cut into
small pieces using autoclaved dissecting scissors and completely grinded in a mortar and
pestle with liquid nitrogen. Genomic DNA was extracted using a DNeasy R plant mini kit
(Qiagen, Hilden, Germany), following the manufacturer’s instructions. Isolated genomic
Kang et al. (2018), PeerJ, DOI 10.7717/peerj.4854 4/25Figure 1 Sampling sites (C: Control site, E: Edge site, B: Bloom site).
Full-size DOI: 10.7717/peerj.4854/fig-1
DNA was quantified using an ND-1000 nanodrop spectrophotometer (Thermo Scientific,
Waltham, MA, USA) and stored at −70 ◦ C until used for library construction.
Library preparation and sequencing
Isolated genomic DNA was used as a template for the library construction of MiSeq
sequencing. Libraries derived from the 16S (Bakt_341F and Bakt_805R) and Kang’s
23S universal primer sets (P23MISQF1 and P23MISQR1) were used for microbial and
phytoplankton communities, respectively (Table 1). Additionally, two 23S universal
primer sets (Sherwood’s and Yoon’s 23S universal primer sets) were used to test the
reliability of Kang’s 23S universal primer set for phytoplankton community analyses
(Table 1). The library was constructed using the Nextera XT index kit (Illumina, San
Diego, CA, USA) according to the manufacturer’s manual. First, PCR amplification was
done using the universal primer sets (NexBakt_341F and NexBakt_805R, NexP23MISQF1
and NexP23MISQR1), which overhang the adapter sequence on forward and reverse
primers, respectively (Table 1). The PCR reaction (total volume 20 µL) contained 10 ng of
template, 1 µL of each primer (10 pmol), 2 µL of dNTPs (10 mM), 0.2 µL Phusion High
Fidelity DNA polymerase (New England Biolabs, Hitchin, UK), and 4 µL 5X buffer. The
first PCR condition was an initial denaturation at 94 ◦ C for 3 min, followed by 15 cycles
at 94 ◦ C for 30 s, 55 ◦ C for 30 s, and 72 ◦ C for 30 s, with a final extension at 72 ◦ C for 3
R
min. The PCR products from the first amplification were purified using the AccuPrep
PCR purification Kit (Bioneer, Daejeon, Republic of Korea) and eluted with 20 µL of
elution buffer. The same conditions including PCR cycles and volume of components were
employed for the second PCR amplification, except that 4 µL of purified first PCR product
was used as a template and the indexing primers for the MiSeq platform. The second PCR
amplicon was separated by 1.5% agarose gel electrophoresis and stained with loading star
dye (Dynebio, Seoul, Republic of Korea). PCR products with the expected sizes (approx.
Kang et al. (2018), PeerJ, DOI 10.7717/peerj.4854 5/25580 bp for analysis of 16s rRNA sequences and approximately 540 bp for analysis of 23s
R
rRNA sequences) were cut from the gel and purified using an AccuPrep gel purification
Kit (Bioneer, Daejeon, Republic of Korea). The quality and quantity of the libraries were
measured using a 2100 Bioanalyzer (Agilent Technologies, Santa Clara, CA, USA). Finally,
constructed libraries were loaded with a MiSeq 600-cycle Reagent Kit v3 (Illumina, San
Diego, CA, USA) to perform 300-bp paired-end sequencing on a MiSeq instrument.
Bioinformatics analysis of NGS data
The raw reads with a low quality (QV < 20) and shorter than 100 nucleotides were eliminated
from further analysis using the CLC Genomic Workbench v.8.0 (CLC Bio, Cambridge, MA,
USA). The reads were merged with longer than 6 bp overlapping sequences without any
mismatches. The merged read with the expected size ranges (400∼500 for 16S and 350∼450
for 23S) were selected and their primer sequences were trimmed using Mothur software
v.1.35.0 (Schloss et al., 2009). The obtained merged reads were clustered into operational
taxonomic units (OTUs) at 99% similarities and chimeras were removed using UCHIME
software v.8.1 (Edgar et al., 2011). Operational taxonomic units (OTUs) with less than
10 merged reads or below 0.1% of the total merged reads were eliminated from further
analysis. The species name for each OTU was assigned by the similarity search using a blastn
search of BLAST +2.2.30 (Camacho et al., 2009) on the NCBI non-redundant nucleotide
database (ftp://ftp.ncbi.nlm.nih.gov/blast/db/; accession date: 04/04/2017). Top-scored
species name was assigned for each OTU with higher than 98% sequence identity to the
database. The OTUs with 90–98% identities in the database were described as ‘‘Genus name
with highest score’’ followed by ‘‘sp.’’ OTUs with less than 90% identity were classified as
‘‘Unknown’’. A phylogenetic tree was constructed by the Minimum Evolution algorithm
using Molecular Evolutionary Genetics Analysis (MEGA ver 6.0) (Tamura et al., 2013).
Quantitative PCR for microbial communities
To quantify total microorganisms and phytoplankton communities, qPCR with two
different universal primer sets (Bakt_341F and Bakt_805R and P23MISQF1 and
P23MISQR1, respectively) were employed (Table 1). It was performed using a DNA
Engine Chromo 4 Real-Time PCR Detection System (Bio-Rad, Hercules, CA, USA) under
the following conditions: initial template denaturation (94 ◦ C for 3 min); 40 amplification
cycles (94 ◦ C for 30 s; 55 ◦ C for 30 s; 72 ◦ C for 30 s) and a final extension step 72 ◦ C for
3 min. A 20 µL volume of the qPCR mixture contained 10 µl of 2 X SYBR Green premix
Ex Taq II (Takara Bio Inc., Kuratsu, Japan), 4 µl of template, 1 µl of forward and reverse
primers (10 pmol), and 4 µl of purified PCR grade water. Standard curves were constructed
to confirm the efficiency of each primer set and quantify copy numbers.
RESULTS
Comparative analysis of phytoplankton community structures
generated by three 23S universal primer sets
As the result of SILVA TestPrime tool, all matched sequences (7,749) were photosynthetic
groups without any heterotrophic bacterial sequences indicating high specificity of Kang’s
Kang et al. (2018), PeerJ, DOI 10.7717/peerj.4854 6/2523S universal primer set to photosynthetic phytoplankton. To determine the reliability
of the modified Kang’s 23S universal primer set for the analysis of the phytoplankton
community, the NGS results of the same seawater sample with three different 23S universal
primer sets (Sherwood’s, Yoon’s, and Kang’s) were compared (Table 2). After trimming
and clustering the raw reads, 103,359, 175,854, and 54,129 of the merged reads were
obtained by Sherwood’s, Yoon’s, and Kang’s 23S primer sets, respectively (Table 2). The
highest OTU numbers were identified in the results of Kang’s primer set (98 OTUs)
followed by Yoon’s (81 OTUs) and Sherwood’s primer set (28 OTUs). Only 16 eukaryotic
algal OTUs were obtained using Sherwood’s 23S primers, while 60 and 67 phytoplankton
OTUs (one cyanobacteria and 59 eukaryotic algae by Yoon’s and one cyanobacteria and
66 eukaryotic algae by Kang’s) were identified, respectively (Table 2). In contrast, the
highest heterotrophic bacterial OTUs were identified by Sherwood’s primer set (eight),
followed by Yoon’s primer set (six OTUs). Only three heterotrophic bacterial OTUs were
identified by Kang’s primer set (Table 2). Proportions of bacterial reads were also highest
in Sherwood’s primer set (70.2%) followed by Yoon’s primer (59.34%). Only 0.86% of
the bacterial sequences was identified by Kang’s 23S primer set. These results showed that
Kang’s 23S universal primer set is a reliable tool for analyzing a phytoplankton community
because of its high taxon-specificity, excluding bacterial sequences.
The taxon coverage of three 23S universal primer sets were also compared (Table 2).
Five eukaryotic phytoplankton phyla, Bacillariophyta, Chlorophyta, Haptophyta, Miozoa,
and Rhodophyta, were identified by Sherwood’s primer set, while two and three additional
eukaryotic phytoplankton phyla were identified by Kang’s (Ochrophyta and Streptophyta)
and Yoon’s primer sets (Ochrophyta, Streptophyta, and Cryptophyta), respectively
(Table 2). Cyanobacterial sequences were identified only by Yoon’s and Kang’s primer
sets. Among the 20 most abundant OTUs, 70.21% (7 OTUs) and 52.36% (3 OTUs)
were occupied by the bacterial OTUs of Sherwood’s and Yoon’s primer sets, respectively
(Table S3), which was not suitable for phytoplankton community analysis presenting
dominant bacterial OTUs. In contrast, only one bacterial OTU ranked at 20th with a
negligible proportion (0.76%) by Kang’s 23S universal primer set supporting that Kang’s
23S universal primer set is a reliable tool for analyzing the phytoplankton community
structure from the entire microbial community with a high taxon specificity and coverage.
Changes in total microbial communities during the bloom
To determine the microbial community changes caused by algal bloom, an NGS analysis
was conducted using the 16S universal primer set (Table 1). After trimming and clustering
the raw reads, 6,588 reads from the control station, 21,190 from the edge, and 32,461 from
the bloom were generated using the 16S universal primer set (Table 3). Clustered with a
99% sequence identity, 161 microbial OTUs were identified from three water samples in
the coastal waters of Geoje in 2015. The highest OTU numbers were identified at the edge
(103), followed the bloom (89), and control (61) sites (Table 4). All OTUs showed more
than a 98% sequence identity indicating the high quality of the 16S database (Table 3). Of
161 OTUs, 23 OTUs were identified as ‘Uncultured Bacteria’ their phyla were determined
by phylogenetic analysis. (Fig. 2A).
Kang et al. (2018), PeerJ, DOI 10.7717/peerj.4854 7/25Kang et al. (2018), PeerJ, DOI 10.7717/peerj.4854
Table 2 Comparison of sea water OTUs generated by three 23S universal primer sets (Sherwood’s, Yoon’s, Kang’s).
Phylum Description Sherwood’s Yoon’s Kang’s (present study)
OTU subtotal Contigs Proportion Subtotal OTU subtotal Contigs Proportion Subtotal OTU subtotal Contigs Proportion Subtotal
(%) of contigs (%) (%) of contigs (%) (%) of contigs (%)
number number number
Proteobacteria Heterotrophic 8 72,563 70.2 5 104,351 59.34 3 464 0.86
prokaryote
8 70.2 6 59.34 3 0.86
Verrucomicrobia Heterotrophic 1 8
prokaryote
Cyanobacteria Photosynthetic 1 1 26 0.01 0.01 1 1 326 0.6 0.6
prokaryote
Bacillariophyta Photosynthetic 7 136 0.13 25 9,284 5.28 27 18,366 33.93
eukaryote
Chlorophyta Photosynthetic 1 17 0.02 7 172 0.1 10 1,952 3.61
eukaryote
Cryptophyta Photosynthetic 3 21 0.01
eukaryote
Haptophyta Photosynthetic 4 40 0.04 16 1,364 0.78 20 21,485 39.69
eukaryote
16 0.23 59 7.26 66 87.04
Miozoa Photosynthetic 3 26 0.03 4 1,543 0.88 4 3,360 6.21
eukaryote
Ochrophyta Photosynthetic 1 8 0 1 849 1.57
eukaryote
Rhodophyta Photosynthetic 1 8 0.01 1 327 0.19 1 599 1.11
eukaryote
Streptophyta Photosynthetic 2 33 0.02 3 503 0.93
eukaryote
Unknown 4 4 30,569 29.58 29.58 15 15 58,717 33.39 28 28 6,225 11.5 11.5
Total 28 28 103,359 100 100 81 81 175,854 100 67 98 98 54,129 100 100
8/25Table 3 Comparison of taxa levels assigned to OTUs generated by 16S and 23S universal primer set.
Identity Control Edge Bloom
OTUs Contigs Proportion OTUs Contigs Proportion OTUs Contigs Proportion
(%) (%) (%)
Above 98% 61 6,588 100 103 21,190 100 89 32,461 100
98% to 90% – – – – – – – – –
16S
Below 90% – – – – – – – – –
Total 61 6,588 100 103 21,190 100 89 32,461 100
Above 98% 31 11,294 45.02 26 20,204 64.68 22 1,4907 63.87
98% to 90% 36 13,791 54.98 54 10,663 34.14 56 8,139 34.87
23S
Below 90% 0 0 0.00 2 369 1.18 3 295 1.26
Total 67 25,085 100 82 31,236 100 81 23,341 100
Table 4 Summary of OTUs in water samples of red tides produced by 16S universal primer.
Phylum Control Edge Bloom
OTUs Proportion (%) OTUs Proportion (%) OTUs Proportion (%)
Archaea 5 2.46 3 0.62 2 0.52
Actinobacteria 9 16.61 9 8.71 8 7.95
Bacteroidetes 4 1.20 20 8.82 19 10.73
Proteobacteria 26 57.39 43 54.96 37 58.23
Verrucomicrobia 2 2.41 8 14.42 8 13.07
Foraminifera 7 15.57 1 0.27 1 0.13
16S Cyanobacteria 2 0.66 5 3.43 4 3.06
Bacillariophyta 6 3.70 7 2.42 4 1.01
Cryptophyta – – 2 1.43 2 1.54
Miozoa – – 1 2.38 1 1.90
Ochrophyta – – 2 2.20 2 1.72
Unclassified – – 2 0.34 1 0.14
Total 61 100 103 100 89 100
Bacillariophyta 11 14.33 13 7.24 13 5.63
Cercozoa 1 0.32 1 0.28 1 0.30
Chlorophyta 21 65.87 8 14.74 9 19.34
Cryptophyta 4 1.72 3 7.71 4 10.78
Cyanobacteria 3 1.36 11 8.78 13 10.46
23S Haptophyta 17 8.44 29 13.96 24 9.70
Miozoa 9 7.78 6 2.75 4 2.33
Ochrophyta 1 0.18 8 43.18 9 40.05
Rhodophyta – – 1 0.17 1 0.15
Unclassified – – 2 1.18 3 1.26
Total 67 100 82 100 81 100
Kang et al. (2018), PeerJ, DOI 10.7717/peerj.4854 9/25Figure 2 Phylogenetic tree of microbial OTUs generated by 16S universal primer set (A) and by 23S universal primer set (B). Phylogenetic tree
was constructed by the Minimum Evolution algorithm using Molecular Evolutionary Genetics Analysis (MEGA ver 6.0).
Full-size DOI: 10.7717/peerj.4854/fig-2
Thirteen ‘uncultured’ OTUs were bacteria, including eight Bacteroidetes, three
Proteobacteria, one Actinobacteria, and one Verrucomicrobia, while seven belonged
to Archaea and the final one was the eukaryotic algal species, Bacillariophyta. Finally, it
was difficult to determine the taxonomic rank of two OTUs (OTU109 and OTU137) by
phylogenetic analysis and were therefore named ‘unclassified OTUs’ (Table 4). Besides
these two ‘unclassified’ OTUs, the 159 obtained OTUs amplified by the 16S universal
primer set were further classified into 11 phyla, including five prokaryotic heterotrophs
(Actinobacteria, Bacteroidetes, Proteobacteria, Verrucomicrobia, and Archaea), 1
eukaryotic protist (Foraminifera), one photosynthetic prokaryote (Cyanobacteria), and 4
photosynthetic eukaryote (Mioza, Ochrophyta, Bacillariophyta, and Cryptophyta) (Table 4
and Fig. 2A).
Community structures of three sample sites generated by the 16S universal primer set
were compared (Table 4). In all three sites, OTUs in Proteobacteria were predominant in
all three sites and occupied more than 50% of the total OTU numbers and proportions
(Fig. 3A), whereas only 24 photosynthetic phytoplankton OTUs of all the microorganisms
(cyanobacteria and eukaryotic algae) were identified and their proportions were very low
(4.36% and 11.86% at the control and edge sites, respectively) (Table 4). At the control
site, heterotrophic bacterial OTUs occupied 80.07%, followed by the eukaryotic protists,
Foraminifera (15.57%), and photosynthetic phytoplankton (4.36%). Unlike the microbial
community structure at the control site, those at both the bloom and edge sites were highly
similar (Table 4). In both bloom and edge sites, proportions of heterotrophic bacteria were
87.53% and 90.5%, respectively, which was higher than those in the control site (Table 4). In
heterotrophic bacteria, proportions of Bacteroidetes and Verrucomicrobia were among the
most significantly increased phyla during the bloom occurred; their proportions increased
Kang et al. (2018), PeerJ, DOI 10.7717/peerj.4854 10/25Figure 3 (A) Bacterial community structure at phylum level in red tidal plankton sample; (B) photosynthetic phytoplankton community struc-
ture at phylum level in red tidal plankton sample.
Full-size DOI: 10.7717/peerj.4854/fig-3
by 7.35 and 5.98 folds at the edge site and 8.94 and 5.42-folds at the bloom site, respectively
(Table 4). In contrast, Actinobacteria abundance decreased during the bloom. Among the
phytoplankton phyla, Cryptophyta, Miozoa, and Ochrophyta, were only identified at the
bloom sites, while the proportions of Bacillariophyta were low at both edge and bloom
sites (Table 4). Proportions of phytoplankton at bloom and edge sites were 11.86% and
9.23%, respectively, which was also higher than at the control site (4.36%). Collectively,
proportions of both photosynthetic algae and heterotrophic bacteria increased as the
bloom occurred. However, proportions of Foraminifera, the amoeboid protist phylum,
considerably decreased from 15.57% at the control site to 0.27% and 0.13% at the edge
and bloom sites, respectively (Fig. 3 and Table 4).
Operational taxonomic units in Cryptophyta, Ochrophyta and Miozoa, were only
identified at the bloom and edge sites (Table 4). Interestingly, all the OTUs exclusively
identified at bloom sites were those responsible for algal blooming. One Miozoa (OTU10)
at the bloom and edge sites was Karenia mikimotoi (GenBank Number: AB027236).
Dinoflagellate K. mikimotoi is one of the common species responsible for harmful algal
bloom (HAB) causing massive fish mortality and human health risks (Anderson et al.,
2010; Chen et al., 2011; Gentien et al., 2007). Two Ochrophyta (OTU12, OTU107) were
Heterosigma akashiwo, which is also a well-known species responsible for HAB as well as
K. mikimotoi (Nagasaki & Yamaguchi, 1997). Operational taxonomic unit 26 (Teleaulax
amphioxeia) and OTU88, (Plagioselmis sp.) in Cryptophyta were also known as the
Cryptophyta bloom (Seoane et al., 2012; Šupraha et al., 2014).
To determine the changes in the community structure due to algal bloom, we analyzed
the commonly found and bloom-specific OTUs (Table 5, Fig. 4A). Among these 161
OTUs obtained by the 16S universal primer set, 18 OTUs were commonly identified, but
Kang et al. (2018), PeerJ, DOI 10.7717/peerj.4854 11/25Table 5 Comparison of shared OTUs in three sample sites.
Site OTU Control Edge Bloom
OTU (%) Contig (%) OTU (%) Contig (%) OTU (%) Contig (%)
B-C-E 18 29.51 64.59 17.48 64.50 20.22 62.93
C-E 1 1.64 0.41 0.97 0.24 – –
B-C 1 1.64 0.38 – – 1.12 0.16
B-E 54 – – 52.42 28.88 60.68 33.30
16S
C 41 67.21 34.62 – – – –
E 30 – – 29.13 6.38 – –
B 16 – – – – 17.98 3.61
Total 161 100 100 100 100 100 100
B-C-E 23 34.33 71.19 28.05 72.81 28.40 76.43
C-E 1 1.49 0.64 1.22 0.14 – –
B-C 6 8.96 14.25 – – 7.4 1.43
B-E 37 – – 45.12 22.86 45.68 19.46
23S
C 37 55.22 13.92 – – – –
E 21 – – 25.61 4.19 0.00 –
B 15 – – – – 18.52 2.68
Total 140 100 100 100 100 100 100
their proportions in each site were 64.59%, 64.50%, and 62.93%, respectively (Table 5,
Fig. 4A). Except for one cyanobacterial OTU (Synechococcus sp., OTU 15), all other
commonly identified OTUs were heterotrophic bacterial sequences. Candidatus pelagibacter
(GenBank: LN850161) was identified as the most abundant OTU in all three sample sites,
making up more than 30% of the populations in all three sample sites (Supplementary 5).
The control site had the highest site-specific OTU numbers (41), followed by the edge (30),
and bloom sites (16). Only one OTU was shared between the control, edge, and bloom
sites, whereas there were 54 OTUs supporting community structures of the edge and bloom
sites, which were highly similar each other (Table 4 and Supplementary 5). Among the 41
control-specific OTUs, Virgulinella fragilis and Rhodobacteraceae sp. occupied about 50%
of their proportions (Supplementary 4). The other two site-specific OTUs in both bloom
and edge sites occupied only small proportions (3.61% and 6.38%, respectively), which
suggests that the bloom did not originate from an outbreak of new species, but proportions
of preexisting OTUs changed considerably thereby changing the community structure
(Table 5).
Operational taxonomic units with more than two-fold changes were analyzed
(Table 6). Proportions of 10 OTUs (seven heterotrophic bacteria and three photosynthetic
phytoplankton) increased by more than two fold at the edge and bloom sites, respectively,
unlike those from the control sites. Moreover, as shown in the community structure,
changes in OTUs at the edge and bloom sites were highly similar (Table 6). Increased
heterotrophic bacterial OTUs belonged to phyla Bacteroidetes, Verrucomicrobia,
and Proteobacteria (Table 6). Although two phytoplankton OTUs, K. mikimotoi and
H. akashiwo were identified in the bloom sites generated by the 16S universal primer set,
Kang et al. (2018), PeerJ, DOI 10.7717/peerj.4854 12/25Figure 4 (A) Three-way Venn diagram illustrating the number of shared and unique OTUs obtained
by 16S universal primer in red tidal plankton sample; (B) three-way Venn diagram illustrating the
number of shared and unique OTUs obtained by 23S universal primer.
Full-size DOI: 10.7717/peerj.4854/fig-4
their proportions were so low due to the outnumbered bacterial sequences (Table 6). Eight
OTUs were identified as species that were highly decreased by the bloom (Table 7). The
decreased OTUs in both bloom and edge sites were also similar as shown in the increased
OTUs. Foraminifera, V. fragilis OTUs decreased the most, followed by two bacterial OTUs,
Proteobacteria and Actinobacteria (Table 7). Interestingly, one Rhodobacteraceae sp.
(GenBank Number: KU382430) increased while the proportions of the other OTU, which
showed a 99% identity to KU382430, decreased at bloom sites (Tables 6 and 7).
Changes in phytoplankton community during the bloom
After trimming and clustering, 25,085, 31,236, and 23,341 reads were finally generated by
the Kang’s 23S universal primer set at the control, bloom, and edge sites, respectively
(Supplementary 4). At 99% sequence identity, 140 OTUs were obtained and no
heterotrophic bacterial OTUs were identified suggesting that Kang’s 23S universal primer
set is specific for phytoplankton species (Table 4). The quality of the 23S region database
was not as good as that of the 16S region in which species names could not be assigned
for about 50% of the OTUs generated by Kang’s 23S primer set at 98% sequence identity
(Table 3). Therefore, phylum names were assigned for those exhibiting sequence identities
between 90% and 98% as in the previous study (Yoon et al., 2016). Of the total OTUs,
2.15% showed a less than 90% sequence identity to the database and were assigned as
‘‘Unknown’’. The total 140 OTUs were classified into nine phytoplankton phyla including
Haptophyta (27.86%), Chlorophyta (18.57%), Bacillariophyta (14.29%), Cyanobacteria
(12.14%), Miozoa (11.43%), Ochrophyta (8.57%), Cryptophyta (3.57%), Cercozoa
(0.71%), and Rhodophyta (0.71). Operational taxonomic units in four phyla including
Haptophyta, Chlorophyta, Cercozoa, and Rhodophyta were identified exclusively in the
Kang et al. (2018), PeerJ, DOI 10.7717/peerj.4854 13/25Kang et al. (2018), PeerJ, DOI 10.7717/peerj.4854
Table 6 OTUs increased more than two folds compared with control site.
No. Edge/Control Bloom/Control
OTUs GenBank No. Species Phylum Fold OTUs Species Phylum Fold
1 HABs16s_OTU14 KT731620 Uncultured Bacteroidetes 6.95 HABs16s_OTU16 JF488529 Bacteroidetes sp. Bacteroidetes 7.17
Sphingobacteriales
2 HABs16s_OTU4 HQ675288 Verrucomicrobia sp. Verrucomicrobia 4.93 HABs16s_OTU6a KU382430 Rhodobacteraceae sp. Proteobacteria 5.36
3 HABs16s_OTU15 KU867931 Synechococcus sp. Cyanobacteria 4.25 HABs16s_OTU14 KT731620 Uncultured Bacteroidetes 5.04
Sphingobacteriales
4 HABs16s_OTU16 JF488529 Bacteroidetes sp. Bacteroidetes 3.09 HABs16s_OTU15 KU867931 Synechococcus sp. Cyanobacteria 3.86
5 HABs16s_OTU29 KJ411774 Verrucomicrobia sp. Verrucomicrobia 2.77 HABs16s_OTU4 HQ675288 Verrucomicrobia sp. Verrucomicrobia 3.82
16S 6 HABs16s_OTU6a KU382430 Rhodobacteraceae sp. Proteobacteria 2.67 HABs16s_OTU29 KJ411774 Verrucomicrobia sp. Verrucomicrobia 3.75
7 HABs16s_OTU20 JF488593 Bacteroidetes sp. Bacteroidetes 2.51 HABs16s_OTU20 JF488593 Bacteroidetes sp. Bacteroidetes 3.19
8 HABs16s_OTU31 KU382423 Pelagibacterales sp. Proteobacteria 2.41 HABs16s_OTU31 KU382423 Pelagibacterales sp. Proteobacteria 2.81
9 HABs16s_OTU10a AB027236 Karenia mikimotoi Miozoa 2.38 HABs16s_OTU10a AB027236 Karenia mikimotoi Miozoa 1.90
10 HABs16s_OTU12a EU168191 Heterosigma akashiwo Ochrophyta 2.02 HABs16s_OTU17a JF488486 Verrucomicrobia sp. Verrucomicrobia 1.7
1 HABs23s_OTU1 EU168191 Heterosigma akashiwo Ochrophyta 218.44 HABs23s_OTU1 EU168191 Heterosigma akashiwo Ochrophyta 203.37
2 HABs23s_OTU12 FJ858267 Micromonas sp. Chlorophyta 7.49 HABs23s_OTU13 KP142643 Teleaulax gracilis Cryptophyta 10.16
3 HABs23s_OTU19 KP142645 Teleaulax acuta Cryptophyta 7.13 HABs23s_OTU19 KP142645 Teleaulax acuta Cryptophyta 7.55
4 HABs23s_OTU13 KP142643 Teleaulax gracilis Cryptophyta 6.48 HABs23s_OTU12 FJ858267 Micromonas sp. Chlorophyta 6.98
5 HABs23s_OTU5 KP899713 Teleaulax amphioxeia Cryptophyta 4.16 HABs23s_OTU5 KP899713 Teleaulax amphioxeia Cryptophyta 5.86
23S
6 HABs23s_OTU41 KJ201907 Chrysochromulina sp. Haptophyta 3.81 HABs23s_OTU8 CP000110 Synechococcus sp. Cyanobacteria 4.27
7 HABs23s_OTU8 CP000110 Synechococcus sp. Cyanobacteria 3.24 HABs23s_OTU41 KJ201907 Chrysochromulina sp. Haptophyta 3.09
8 HABs23s_OTU11a EU168191 Heterosigma sp. Ochrophyta 2.84 HABs23s_OTU11a EU168191 Heterosigma sp. Ochrophyta 2.55
9 HABs23s_OTU14a KJ958482 Rhizosolenia sp. Bacillariophyta 2.21 HABs23s_OTU15a CP006271 Synechococcus sp. Cyanobacteria 2.01
Notes.
a
OTUs exclusively identified in bloom sites.
14/25Kang et al. (2018), PeerJ, DOI 10.7717/peerj.4854
Table 7 OTUs decreased higher than two folds compared with control site.
No. C/E C/B
OTUs Species Phylum Fold OTUs Species Phylum Fold
1 HABs16s_OTU2a JN207220 Virgulinella fragilis Foraminifera −11.29 HABs16s_OTU2a JN207220 Virgulinella fragilis Foraminifera −11.29
2 HABs16s_OTU5a KU382430 Rhodobacteraceae sp. Proteobacteria −6.59 HABs16s_OTU5a KU382430 Rhodobacteraceae sp. Proteobacteria −6.59
3 HABs16s_OTU24 KT424654 Uncultured marine Archaea −5.15 HABs16s_OTU24 KT424654 Uncultured marine Archaea −4.71
euryarchaeote euryarchaeote
4 HABs16s_OTU35 LC094544 Microbacteriaceae sp. Actinobacteria −4.74 HABs16s_OTU11 JF488172 Actinobacterium sp. Actinobacteria −3.40
16S 5 HABs16s_OTU11 JF488172 Actinobacterium sp. Actinobacteria −4.01 HABs16s_OTU35 LC094544 Microbacteriaceae sp. Actinobacteria −3.19
6 HABs16s_OTU8a JN207229 Virgulinella fragilis Foraminifera −2.50 HABs16s_OTU8a JN207229 Virgulinella fragilis Foraminifera −2.50
7 HABs16s_OTU3 JF488172 Actinobacterium sp. Actinobacteria −2.16 HABs16s_OTU61 KX250312 Erythrobacter sp. Proteobacteria −2.42
8 HABs16s_OTU3 JF488172 Actinobacterium sp. Actinobacteria −2.26
1 HABs23s_OTU2 KF285533 Ostreococcus sp. Chlorophyta −22.41 HABs23s_OTU6 KP826904 Dinophysis acuta Miozoa −29.85
2 HABs23s_OTU4a KJ958479 Chaetoceros sp. Bacillariophyta −7.77 HABs23s_OTU4 KJ958479 Chaetoceros sp. Bacillariophyta −19.71
3 HABs23s_OTU9 KF285533 Ostreococcus tauri Chlorophyta −7.07 HABs23s_OTU2 KF285533 Ostreococcus sp. Chlorophyta −6.56
4 HABs23s_OTU10 FO082259 Bathycoccus prasinos Chlorophyta −6.75 HABs23s_OTU25 FN563097 Micromonas pusilla Chlorophyta −5.56
5 HABs23s_OTU6a KP826904 Dinophysis acuta Miozoa −4.48 HABs23s_OTU9 KF285533 Ostreococcus tauri Chlorophyta −4.61
23S
6 HABs23s_OTU34 KJ958485 Thalassiosira weissflogii Bacillariophyta −4.43 HABs23s_OTU10 FO082259 Bathycoccus prasinos Chlorophyta −4.56
7 HABs23s_OTU18 KR709240 Pseudo-nitzschia Bacillariophyta −4.02 HABs23s_OTU18 KR709240 Pseudo-nitzschia Bacillariophyta −2.57
multiseries multiseries
8 HABs23s_OTU3 FN563097 Micromonas pusilla Chlorophyta −2.17 HABs23s_OTU3 FN563097 Micromonas pusilla Chlorophyta −2.03
Notes.
a
OTUs exclusively identified in bloom sites.
15/25results generated by Kang’s 23S universal primer set, which reinforces its importance
for microbial community study (Table 4). The most abundant phytoplankton OTU was
Ostreococcus sp. (32.78%, GenBank number: KF285533), which belongs to Chlorophyta
in the control site. Heterosigma akashiwo (GenBank number: EU168191) was the most
abundant OTU in both the bloom and edge sites and occupied 38.31% and 35.67% of the
total reads, respectively (Supplementary 5).
Community structures of the three sample sites generated by Kang’s 23S universal
primer set were compared (Table 4, Fig. 3B). In the control site, OTUs in Chlorophyta
occupied 65.87%, followed by those in Bacillariophyta (14.33%) and Haptophyta (8.44%).
Considering the low proportions of phytoplankton (4.36%), which included Bacillariophyta
(3.70%) and Cyanobacteria (0.66%), the 16S universal primer set was not as efficient as the
23S universal primer set in presenting phytoplankton community structures (Table 4). In
both the bloom and edge sites, proportions of Ochrophyta were highest (43.18% for edge
and 40.05% for bloom) followed by Chlorophyta (14.74% for edge and 19.34% for bloom).
The phytoplankton community structures by Kang’s 23S universal primer set were largely
similar between the bloom and edge sites as shown in the microbial community structure
created by 16S (Table 4 and Fig. 3).
Among phytoplankton OTUs, the highest difference in Chlorophyta between the control
and bloom sites was identified. Chlorophyta occupied 65.87% in control site, whereas
14.74% and 19.34% was shown at the bloom and edge sites, respectively. By contrast,
OTUs in Ochrophyta occupied only 0.18% at the control site, whereas its proportion was
43.18% at edge site and 40.05% at bloom site, respectively. The proportions of Cryptophyta
and cyanobacteria at the control site were also 4.48-folds and 6.46-folds and 6.27-folds and
7.69-folds higher than those at the edge and bloom sites, respectively (Table 4). Although
Miozoa decreased at the edge and bloom sites by 2.83 and 3.34 folds, the proportion
of K. mikimotoi (OTU17) increased. Besides these changes, another algal bloom species,
Alexandrium affine (OTU65) was identified only in the bloom site. Three ‘unclassified’
OTUs (OTU27, OTU124, OTU132) were also detected at both the bloom and edge sites,
but not the control site (Table 4). Collectively, analysis by Kang’s 23S universal primer set
was more sensitive to recent changes in phytoplankton communities during the bloom
than those by 16S universal primer set (Table 4).
Commonly identified and site-specific OTUs in all three sites were analyzed (Table 5 &
Fig. 4B). Among the 140 OTUs obtained by the 23S universal primer set, 23 OTUs were
commonly identified in all three sites at 71.19%, 72.81%, and 76.43%, respectively, which
was similar to the results obtained by the 16S universal primer set (Table 5). The commonly
identified OTUs were eight in Haptophyta, five in Chlorophyta, four in Bacillariophyta,
three in Cryptophyta, and one in Cyanobacteria, Cercozoa, and Ochrophyta. Among the
23 commonly identified OTUs, a small chlorophyte, Ostreococcus sp. (GenBank numbers:
KF285533) was the most abundant species, but was not identified by the 16S universal
primer set (Supplementary 6). From the 16S universal primers, the control site exhibited
the highest site-specific phytoplankton OTU numbers (37), followed by the edge (21) and
bloom sites (15). As shown in the results of the 16S universal primer set, more than 95% of
the reads shared between the edge and bloom sites by the 23S universal primer set (Table 5
Kang et al. (2018), PeerJ, DOI 10.7717/peerj.4854 16/25and Fig. 4B). Control-specific OTUs occupied about 14% of their proportions and the
other two site-specific OTUs occupied only marginal proportions (Table 5).
To determine the changes in the phytoplankton community structure caused by the
algal bloom, OTUs with more than two-fold changes were analyzed (Table 6). At the edge
and bloom sites, nine OTUs were significantly higher than in the control site (Table 6).
With the exception of four OTUs, all highly increased phytoplankton OTUs generated
by Kang’s 23S primer set were responsible for the algal bloom in the ocean (Table 6).
Heterosigma akashiwo was identified as the most highly increased phytoplankton species
in both the bloom and edge sites, whose proportions were more than 200-fold higher than
those in the control site. This result indicated that the major bloom species in the Geoje
in 2015 was H. akashiwo. Additionally, we identified changes in other species responsible
for the bloom including three Teleaulax spp. and K. mikimotoi. Interestingly, two OTUs in
the genus Micromonas exhibited a different pattern in which one OTU increased while the
other one decreased (Tables 6 and 7). Among the eight OTUs that decreased, chlorophytes
including Ostreococcus sp. were the most highly decreased OTUs in edge site, followed by
Chaetoceros sp. (Table 7). Interestingly, Dinophysis acuta was the most highly decreased
OTU at the bloom site unlike at the control site, and is also known as the species partly
responsible for HAB (Table 7).
DISCUSSION
In this study, we compared the community structures of three sample sites (control, bloom,
and edge sites) using MiSeq sequencing platform generated by two different universal
primer sets, the 16S (Herlemann et al., 2011) and Kang’s 23S universal primer sets, a newly
modified 23S universal primer set was used in this study. Kang’s 23S universal primer set
exhibited a specificity for phytoplankton taxa as well as wide coverage from prokaryotic
cyanobacteria to eukaryotic algae within phytoplankton taxa (Table 2 and Fig. 2B). Both
16S and Kang’s 23S universal primers successfully presented the community structures of
each target taxa during the bloom with little conflicting results. However, there were a few
differences between the results of the two universal primer sets. First, we identified that
several OTUs in phylum Chlorophyta were not presented by the 16S universal primer set
in this study (Table 4 and Fig. 3). In contrast, OTUs in phylum Chlorophyta occupied
65.87% of the total phytoplankton reads in the control site by Kang’s 23S universal
primer set (Table 4). As one of the smallest photosynthetic picoprasinophytes, Ostreococcus
sp. and Micromonas pusilla are important components of the microbial community in
coastal waters (Chrétiennot-Dinet et al., 1995; Countway & Caron, 2006; Worden, 2006).
The proportions of Ostreococcus sp. decreased by 22.41 folds as the bloom occurred
(Table 7). Decreased proportions of those picoparsinophytes may be one of the potential
markers for early detection of the bloom by H. akasiwo, but additional studies should
be made. Second, Kang’s 23S universal primer set not only presented higher numbers of
phytoplankton phyla, but also exhibited clear proportional changes (Table 4 and Fig. 3).
Although we were able to detect algal OTUs responsible for the bloom by the 16S universal
primer set, their proportions were too low to compare between the control and bloom sites.
Kang et al. (2018), PeerJ, DOI 10.7717/peerj.4854 17/25However, Kang’s 23S universal primer set could detect 200-fold changes during the bloom,
which means that this primer set was much more sensitive than the 16S primer set in terms
of detecting changes in phytoplankton species during various aquatic events, including
the bloom, eutrophication, or other ecological transitions. Alternatively, 18S universal
primer set can be used to detect changes in eukaryotic algal species (Bradley, Pinto & Guest,
2016; Pearman et al., 2016; Stoeck et al., 2010; Tragin, Zingone & Vaulot, 2018). Recently
18S universal primer successfully amplified the eukaryotic algae with high specificity
without bacterial sequences. However, 18S universal primer cannot amplify cyanobacterial
sequences and 23S universal primer appear to be more suitable to analyze phytoplankton
community. Although 16S universal primer set failed to present picoparsinophytes, it
was also useful in detecting decreases in Foraminifera as the bloom occurred (Fig. 3A).
Although species in Foraminifera are amoeboid protists, which are not a target species of
Kang’s 23S universal primer set, we were able to determine that these species decreased
during the bloom (Table 4). In addition, data generated by the 16S universal primer set
were also useful for identifying changes in the bacterial community as the algal bloom
proceeded (Table 4 and Fig. 3A). One disadvantage of using Kang’s 23S universal primer
set may be the limited plastid 23S sequences in the database. Compared with 5,616,941
small subunit (SSU) data, only 735,238 large subunits (LSU) are currently stored in
SILVA (https://www.arb-silva.de/). For this reason, the potential inaccuracy in taxonomic
annotation may be possible with the current database. Recent advancements in the NGS
platform enabled researchers to supplement the database at a relatively low cost and its
quality would be improved in a short time. As the two universal primer sets had both
strong and weak points, genomic analyses using both primer sets provided a higher-quality
of information than using a single primer set would have. Moreover, we were able to
obtain quantitative information from Kang’s 23S universal primer set, which exclusively
amplified phytoplankton species. Since higher variety of copy numbers in plastid DNA
than those of ribosomal DNA, obtained copy numbers by 23S universal primers may not be
far from the real cell numbers (Shi et al., 2011). However, Kang’s 23S universal primer can
amplify exclusively photosynthetic phytoplankton sequences, this may at least represent
relative quantity of phytoplankton compared with heterotrophic bacterial population in
the same sample. In fact, we measured the copy numbers of all the microorganisms (16S
universal primer set) and phytoplankton (Kang’s 23S universal primer set) using qPCR.
From the data, we estimated the ratio between heterotrophic bacteria (copy numbers by
16S - copy numbers by 23S) and photosynthetic phytoplankton (copy numbers by 23S).
This result showed that the ratios of phytoplankton to heterotrophic bacteria in the bloom
(0.0410422) and edge sites (0.0483856), which was approximately twofold higher than in
the control site (0.0910008). This result supports the previous result HAB redirects carbon
and energy flow within the pelagic food-web toward heterotrophic bacteria-dominated
processes, primarily through the inhibition of algal growth and enhancement of bacterial
proliferation (Šulčius et al., 2017). Since microbial ecosystems in aquatic environments are
the result of complicated interactions between photosynthetic phytoplankton species and
heterotrophic microorganisms (Carrillo, Medina-Sánchez & Villar-Argaiz, 2002; Cole,
1982; Rooney-Varga et al., 2005), it is often necessary to analyze the phytoplankton
Kang et al. (2018), PeerJ, DOI 10.7717/peerj.4854 18/25Table 8 Species with high degree of correlation with Heterosigma akashiwo.
Positively correlated species
Species GenBank No. Correlation Regression equation R2 P
Alpha proteobacterium sp._16S HQ675244 0.960254 y = 0.1014x + 1.1124 0.9221Species with a high degree of correlation were considered candidate marker species in
the bloom caused by H. akashiwo. However, different microbial community structures
are expected in blooms by either different bloom species or environmental conditions. As
more data is accumulated, we will acquire more reliable marker species, which could be
used as a warning system against HAB.
CONCLUSION
In conclusion, microbial community structures of harmful algal bloom (HAB) caused
by Heterosigma akashiwo were analyzed by NGS platform. Comparative analysis of data
generated by two universal primer sets (16S and 23S) provided useful information about
the changes in the community during the H. akashiwo bloom, including the ratio between
phytoplankton and total microbiome and the correlations between various microbial
species. These results suggested that algal blooms occur because of complicated interactions
between microbial components, directly or indirectly, and more genomic information
produced by the two different universal primer sets is necessary to diagnose or forecast
HABs.
ADDITIONAL INFORMATION AND DECLARATIONS
Funding
This research was a part of the project titled ‘‘Long-term change of structure and function
in marine ecosystems of Korea’’, funded by the Ministry of Oceans and Fisheries, Korea.
The funders had no role in study design, data collection and analysis, decision to publish,
or preparation of the manuscript.
Grant Disclosures
The following grant information was disclosed by the authors:
Ministry of Oceans and Fisheries, Korea.
Competing Interests
The authors declare there are no competing interests.
Author Contributions
• Hye-Eun Kang, Tae-Ho Yoon and Hyun-Woo Kim conceived and designed
the experiments, performed the experiments, analyzed the data, contributed
reagents/materials/analysis tools, prepared figures and/or tables, authored or reviewed
drafts of the paper, approved the final draft.
• Sunyoung Yoon, Hak Jun Kim, Hyun Park and Chang-Keun Kang, analyzed the data,
contributed reagents/materials/analysis tools, prepared figures and/or tables, authored
or reviewed drafts of the paper, approved the final draft.
Data Availability
The following information was supplied regarding data availability:
The raw data are provided as a Supplemental File.
Kang et al. (2018), PeerJ, DOI 10.7717/peerj.4854 20/25Supplemental Information
Supplemental information for this article can be found online at http://dx.doi.org/10.7717/
peerj.4854#supplemental-information.
REFERENCES
Anderson DM. 2009. Approaches to monitoring, control and management of
harmful algal blooms (HABs). Ocean & Coastal Management 52:342–347
DOI 10.1016/j.ocecoaman.2009.04.006.
Anderson DM, Glibert PM, Burkholder JM. 2002. Harmful algal blooms and eutroph-
ication: nutrient sources, composition, and consequences. Estuaries 25:704–726
DOI 10.1007/BF02804901.
Anderson DM, Reguera B, Pitcher GC, Enevoldsen HO. 2010. The IOC international
harmful algal bloom program: history and science impacts. Oceanography 23:72–85
DOI 10.5670/oceanog.2010.25.
Antonella P, Luca G. 2013. The quantitative real-time PCR applications in the mon-
itoring of marine harmful algal bloom (HAB) species. Environmental Science and
Pollution Research 20:6851–6862 DOI 10.1007/s11356-012-1377-z.
Bradley IM, Pinto AJ, Guest JS. 2016. Design and evaluation of illumina MiSeq-
Compatible, 18S rRNA gene-specific primers for improved characterization of mixed
phototrophic communities. Applied and Environmental Microbiology 82:5878–5891
DOI 10.1128/AEM.01630-16.
Camacho C, Coulouris G, Avagyan V, Ma N, Papadopoulos J, Bealer K, Madden
TL. 2009. BLAST+: architecture and applications. BMC Bioinformatics 10:421
DOI 10.1186/1471-2105-10-421.
Carrillo P, Medina-Sánchez JM, Villar-Argaiz M. 2002. The interaction of phy-
toplankton and bacteria in a high mountain lake: importance of the spectral
composition of solar radiation. Limnology and Oceanography 47:1294–1306
DOI 10.4319/lo.2002.47.5.1294.
Chen Y, Yan T, Yu R, Zhou M. 2011. Toxic effects of Karenia mikimotoi extracts
on mammalian cells. Chinese Journal of Oceanology and Limnology 29:860–868
DOI 10.1007/s00343-011-0514-8.
Chrétiennot-Dinet M, Courties C, Vaquer A, Neveux J, Claustre H, Lautier J,
Machado M. 1995. A new marine picoeucaryote: ostreococcus tauri gen. et sp.
nov.(Chlorophyta, Prasinophyceae). Phycologia 34:285–292
DOI 10.2216/i0031-8884-34-4-285.1.
Cole JJ. 1982. Interactions between bacteria and algae in aquatic ecosystems. Annual
Review of Ecology and Systematics 13:291–314
DOI 10.1146/annurev.es.13.110182.001451.
Countway PD, Caron DA. 2006. Abundance and distribution of Ostreococcus sp. in
the San Pedro Channel, California, as revealed by quantitative PCR. Applied and
Environmental Microbiology 72:2496–2506 DOI 10.1128/AEM.72.4.2496-2506.2006.
Kang et al. (2018), PeerJ, DOI 10.7717/peerj.4854 21/25You can also read