The roles of latent heating and dust in the structure and variability of the northern Martian polar vortex
←
→
Page content transcription
If your browser does not render page correctly, please read the page content below
Draft version April 2, 2021
                                                Typeset using LATEX default style in AASTeX63

                                                 The roles of latent heating and dust in the structure
                                                 and variability of the northern Martian polar vortex
                                               E. R. Ball,1 D. M. Mitchell,1 W. J. M. Seviour,2, 3 S. I. Thomson2 And G. K. Vallis2
arXiv:2104.00503v1 [astro-ph.EP] 1 Apr 2021

                                                                                                  —

                                                            1 Cabot   Institute for the Environment, and School of Geographical Sciences
                                                                                           University of Bristol
                                                                      2 Collegeof Engineering, Mathematics and Physical Sciences
                                                                                           University of Exeter
                                                                             3 Global Systems Institute, University of Exeter

                                                                                       (Received April 2, 2021)

                                                                                         Submitted to ApJ

                                                                                                           ABSTRACT
                                                         The winter polar vortices on Mars are annular in terms of their potential vorticity (PV) structure,
                                                      a phenomenon identified in observations, reanalysis and some numerical simulations. Some recent
                                                      modeling studies have proposed that condensation of atmospheric carbon dioxide at the winter pole
                                                      is a contributing factor to maintaining the annulus through the release of latent heat. Dust and
                                                      topographic forcing are also known to be causes of internal and interannual variability in the polar
                                                      vortices. However, coupling between these factors remains uncertain, and previous studies of their
                                                      impact on vortex structure and variability have been largely limited to a single Martian global climate
                                                      model (MGCM). Here, by further developing a novel MGCM, we decompose the relative roles of latent
                                                      heat and dust as drivers for the variability and structure of the northern Martian polar vortex. We
                                                      also consider how Martian topography modifies the driving response. By also analyzing a reanalysis
                                                      dataset we show that there is significant dependence in the polar vortex structure and variability on the
                                                      observations assimilated. In both model and reanalysis, high atmospheric dust loading (such as that
                                                      seen during a global dust storm) can disrupt the vortex, cause the destruction of PV in the low-mid
                                                      altitudes (> 0.1 hPa), and significantly reduce spatial and temporal vortex variability. Through our
                                                      simulations, we find that the combination of dust and topography primarily drives the eddy activity
                                                      throughout the Martian year, and that although latent heat release can produce an annular vortex, it
                                                      has a relatively minor effect on vortex variability.

                                              Corresponding author: E. R. Ball
                                              emily.ball@bristol.ac.uk
2 Ball et al.
Keywords: Mars, planetary atmospheres
1. INTRODUCTION
Of all the planets in the Solar System and beyond, Mars’s atmosphere is the best-observed
besides Earth and so is one of the best suited for study and comparison with Earth’s own. On
both planets, there are regions of strong mid-high latitude zonal winds in the winter hemi-
sphere, known as the polar vortices. Whilst Mars’s tropospheric and Earth’s stratospheric
polar vortices are comparable in their latitudinal extent (the Martian polar vortices extend
to around 70◦ N/S and Earth’s to around 60◦ N/S), the Martian winter tropospheric polar
vortices have been shown to be annular in nature, with a local minimum in Ertel’s potential
vorticity (PV) near the pole (Mitchell et al. 2015). This contrasts with the polar vortices on
Earth, where PV increases monotonically towards each pole (although an annular structure
has been found in the mesosphere (Harvey et al. 2009)). The annular nature of the Martian
polar vortices is likely to affect meridional gas and aerosol mixing, along with vertical wave
propagation (Toigo et al. 2017). In general, air in the polar low altitudes is some of the
‘oldest’ (i.e. most isolated) in Mars’s atmosphere, but it has been proposed recently that
the annulus of PV at the solstice reduces the age of air in the polar low altitudes through
increased mixing with mid-latitude air (Waugh et al. 2019). Mars’s polar vortices have been
found to extend through the troposphere, decrease in area with height, and retain the same
orientation in the vertical (Mitchell et al. 2015). Unlike on Earth, zonal winds are maximal
equatorward of the maximum PV gradient (e.g. Seviour et al. 2017).
Given that a ring of high PV is barotropically unstable (Dritschel & Polvani 1992), the
persistence of the annular polar vortices on Mars in observations, reanalyses and simulations
(e.g. Barnes & Haberle 1996; Banfield et al. 2004; Waugh et al. 2016) suggests that there
must exist some restoring force that maintains the annulus (which may be thought of as a
ring of high PV enclosed between opposing PV gradients) (Mitchell et al. 2015). Multiple
processes have been identified and shown to maintain and stabilize the annular vortex,
including diabatic heating by the descending branch of the Hadley circulation (Scott et al.
2020) and recent modeling using a single-layer shallow water model with a representation
of carbon dioxide (CO2 ) condensation showed that Mars’s short radiative timescale may be
responsible for stabilizing the annulus (Seviour et al. 2017).
The main constituent of the Martian atmosphere is CO2 , which makes up approximately
∼95% of the atmosphere by volume. CO2 is present in gaseous form and as CO2 ice
clouds. In polar regions during the winter seasons, temperatures can fall below the pressure-
dependent sublimation point of CO2 (around 149K), leading atmospheric CO2 to condense
and form a layer of CO2 ice on top of the polar ice caps. Latent heat is released into the
atmosphere during the phase change from gaseous to solid CO2 and this can increase tem-
peratures in the polar lower altitudes by up to 10K (Toigo et al. 2017). This means that
Mars’s atmosphere has a non-dilute condensible component, unlike Earth, whose primaryRoles of latent heating and dust in Mars’s polar vortex 3
condensible component is water vapor, which reaches a molar concentration of up to a few
percent. Toigo et al. (2017) showed that in a comprehensive Mars Global Climate Model
(MGCM), an annular polar vortex is maintained if the release of latent heat from CO2
condensation is well-represented in the model and that without this forcing, a monopolar
vortex (i.e. PV increasing monotonically to the pole) forms. Rostami et al. (2018) found
that while the annulus is smooth on a time scale of multiple sols (Martian days), the patches
of high PV observed when viewing the vortex at a single moment time are likely caused by
the inhomogeneous deposition of CO2 .
Global dust storms (GDSs) remain a major influence on Martian atmospheric dynamics,
including the polar vortices. They provide a major source of interannual variability, and one
that is not yet fully understood, given the relatively few years of observations. Historically,
GDSs appear to dominate the Martian atmosphere approximately once every three southern
summers (northern winters) (Shirley 2015); there have been only 3 GDSs since Martian Year
1
(MY) 24, occurring in MY 25, MY 28 and most recently in MY 34. Understanding of
the drivers of GDSs remains incomplete, although recent work suggests the influence of
solar system dynamics (Shirley 2015) and orbit-spin coupling (Shirley et al. 2020). Regional
and global dust storms may partially or fully disrupt the winter polar vortex in what is
termed a ‘rapid polar warming’ event, when temperatures rise rapidly within the vortex,
apparently a response to increased dust aerosol heating enhancing the meridional circulation
(Mitchell et al. 2015; Guzewich et al. 2016). The most recent GDS, occurring in MY 34, is
thought to have expanded from an initial equatorial regional storm which created a zonal
temperature gradient and hence increased winds, creating a positive feedback (Bertrand
et al. 2020). In MY 28, a GDS developed at around Ls ∼265◦ , shortly before the northern
winter solstice. Dust concentrations were elevated (with dust opacity larger than 1) primarily
in the midlatitudes, but reached up to 40◦ N (Wolkenberg et al. 2020). The impact of these
recent dust storms on the polar vortices has not yet been fully explored.
Along with atmospheric dust loading, Martian topography may also play a role in the
morphology of the polar vortices. The southern hemisphere is dominated strongly by
wavenumber 1 waves but in the northern hemisphere, eddies show a wavenumber 2 pattern
(Hollingsworth & Barnes 1996), likely influenced by the hemispheric topographical asym-
metries. It is also thought that the northern polar vortex has an elliptical shape on average
in part due to topographically-forced zonal wavenumber 2 waves (Mitchell et al. 2015; Ros-
tami et al. 2018). In both winter hemispheres, there is a ‘solsticial pause’ in the amplitude
of low-altitude transient waves. Studies have attributed this in part to topographic zonal
asymmetry (Lewis et al. 2016; Mulholland et al. 2016).
1 Martian years are numbered according to Clancy et al. (2000), where MY 1 begins at the northern spring
equinox (Ls =0◦ ) on April 11th, 1955. Each Martian year is roughly the length of two Earth years, and
midwinter in the northern hemisphere is at Ls =270◦ . Thanks to a recent increase in the number of satel-
lites orbiting Mars, there has been almost continuous observation of the Martian atmosphere since 1999,
corresponding to Ls ∼ 104◦ , MY 24.4 Ball et al.
It is not yet fully understood how the Martian polar vortices are influenced by the interplay
of topography, latent heating and dust loading. Work by Guzewich et al. (2016) and Toigo
et al. (2017) investigates how dust and latent heat release each separately influence the polar
vortices in modeling studies but there has not yet been any study investigating the combined
effects. In this paper, we investigate the transience and variability of the northern Martian
polar vortex through the use of a reanalysis dataset and idealized simulations from a newly-
developed Martian configuration of the flexible modeling framework Isca (Vallis et al. 2018;
Thomson & Vallis 2019a). We focus here on the northern polar vortex due to previous work
suggesting that the northern vortex exhibits a stronger solsticial pause (Lewis et al. 2016),
and due to the findings of Guzewich et al. (2016), who note that the northern vortex is
more heavily influenced by dust loading than the southern vortex. In their simulations, the
southern vortex is found to be reasonably invariant to southern winter dust loading.
Thanks to prolonged observations of the Martian atmosphere, there is sufficient data
available to create a Martian reanalysis dataset spanning several MY, of which there are
currently 3 available (Montabone et al. 2014; Greybush et al. 2019; Holmes et al. 2020).
A reanalysis dataset assimilates observations into a general circulation model to provide a
three-dimensional, gridded estimate of the atmospheric state, including variables that cannot
be directly measured. We use the newly-developed Open access to Mars Assimilated Remote
Soundings (OpenMARS) reanalysis product (Holmes et al. 2020) to investigate features of
the northern Martian polar vortex. Previous studies of Martian polar vortices in reanalyses
have focused particularly on MY 24-27 (Mitchell et al. 2015; Waugh et al. 2016). We are
particularly interested here in the impacts of the MY 28 GDS, as this is the only solsticial
GDS in the reanalysis period and provides an exciting opportunity to study the effect of
dust on the northern polar vortex during this time. There is no equivalent southern winter
solsticial GDS during the reanalysis period. We aim to understand the mechanisms that
drive the northern Martian polar vortex. We identify significant features of the vortex in
OpenMARS and explore these using the flexible modeling framework Isca. Using Isca, we
perform an attribution-type study on the polar vortex - with topography, latent heating and
dust the parameters to be changed systematically.
The rest of the paper is outlined as follows: Section 2 introduces the quantities that we
will use to investigate the vortex, the reanalysis products currently available and describes
the model used in this study. From there, we discuss the northern polar vortex as seen
in the reanalysis and in our simulations in Section 3. We present results describing the
climatological state of the polar vortex and interannual variability in Section 3.1, and the
sub-seasonal variability in Section 3.2. Finally, we summarize the study in Section 4.
2. METHODS
2.1. Potential vorticity
Potential vorticity (PV) is a dynamically important quantity, the product of absolute
vorticity and the gradient of potential temperature, that is particularly useful in the studyRoles of latent heating and dust in Mars’s polar vortex 5
of polar vortices. In general, PV is materially conserved provided frictional and diabatic
processes vanish. In this paper, we use an approximation to the true PV, valid to a good
approximation in a hydrostatic atmosphere, namely
∂θ
q(θ, t) = −g(f + ζp ) , (1)
∂p
where g is Martian gravitational acceleration (3.72 m s−2 ), f is the Coriolis parameter, θ
is potential temperature, ζp is the vertical component of relative vorticity evaluated on a
pressure surface, and p is pressure (Hoskins et al. 1985; Read et al. 2007). PV is calculated
from winds and temperature as a function of pressure in the reanalysis and model, then
linearly interpolated to isentropic surfaces for our analysis. To remove the large vertical
variation of PV in the atmosphere, we then use a common scaling of PV devised by Lait
(1994). To be consistent with Waugh et al. (2016), the exact scaling chosen is
−(1+cp /R)
θ
qs (θ, t) = q × , (2)
θ0
with θ0 = 200K an arbitrary reference potential temperature and cp /R = 4.0 the ratio of
specific heat at constant pressure to the specific gas constant of Martian air.2
2.2. Reanalyses
Currently, three reanalysis datasets are available for the Martian atmosphere. These are
the Mars Analysis Correction Data Assimilation (MACDA) (Montabone et al. 2014), the
Ensemble Mars Atmosphere Reanalysis System (EMARS) (Greybush et al. 2019), and the
OpenMARS (Holmes et al. 2020) datasets. We primarily use OpenMARS within this work.
OpenMARS assimilates observations of thermal profiles, water ice and dust opacities, ozone
and water vapor column abundance into the UK-LMD MGCM to produce a gridded estimate
of Martian weather spanning MY 24-32. Full details of the profiles assimilated into Open-
MARS and the underlying MGCM may be found in Holmes et al. (2020), although we briefly
discuss relevant details here. The OpenMARS dataset can be broadly separated into two
distinct periods based on the retrieval instruments used. In the era MY 24-27, temperature
retrievals assimilated in to the model are from the Thermal Emission Spectrometer (TES)
aboard Mars Global Surveyor (MGS). TES nadir retrievals provide coverage of temperature
up to around 40 km in altitude but have largest uncertainties at the lowest altitudes due to
possible errors in estimating surface pressure. Systematic errors in temperature retrievals
peak over the winter polar regions due to cold surface temperatures and there is a lack of
coverage of column dust optical depth (CDOD) retrievals at winter high latitudes. Due to
cold surface temperatures on the night-side of the planet, only day-side dust retrievals are
assimilated. In MY 28-32, retrievals are from Mars Climate Sounder (MCS) aboard Mars
2 The code used for calculation of PV, and all other analysis in this paper, is available here:
https://doi.org/10.5281/zenodo.46166706 Ball et al.
Reconnaissance Orbiter. MCS temperature profiles have greater vertical resolution than
TES (5 km rather than 10 km) and cover up to approximately 85 km in altitude (Holmes
et al. 2020). Conversely to TES, temperature retrieval errors are lowest in the lower atmo-
sphere for MCS. There are an increased number of MCS profiles at the end of MY 28, in
an effort to observe the atmosphere during the MY 28 GDS. Finally, although estimates of
CDOD from MCS observations have the possibility of errors due to the extrapolation down
to the surface, retrievals are possible during both daytime and nighttime polar winter. It is
worth noting that there is no overlap in the TES and MCS temperature retrievals, so there
is no reanalysis data available for the northern hemisphere winter of MY 27.
OpenMARS may be seen as the ‘updated version’ of the MACDA dataset (the details
of which are described in Montabone et al. (2014)), which spans MY 24-27 (assimilating
TES thermal profiles as in OpenMARS) and is based on an older version of the same
MGCM. OpenMARS in the TES period differs from MACDA in that the underlying model
has been updated - for example, MACDA uses an analytical dust distribution whereas in
OpenMARS dust is freely transported, and OpenMARS now includes a thermal plume
model. A detailed description of MACDA and a discussion of how the products differ may
be found in Montabone et al. (2014); Holmes et al. (2020), respectively.
The final reanalysis dataset available is EMARS, which spans MY 24-34. Full details of
the reanalysis may be found in Greybush et al. (2019) and its precursor Greybush et al.
(2012). EMARS is a 16-member ensemble reanalysis which uses the Geophysical Fluid
Dynamics Laboratory MGCM along with assimilation of retrievals from TES and MCS
for the periods described above. Dust is controlled by three radiatively active tracers.
Temperature retrievals that fall significantly below the pressure dependent CO2 condensation
point, Tc , are modified to match the condensation temperature, and when temperatures
within the model are projected to be below Tc , gaseous CO2 is removed from the atmosphere
and placed on the surface as CO2 snow. In contrast, for OpenMARS, when temperature
retrievals fall significantly below Tc , these are simply filtered out before assimilation into the
model.
We here present results using the OpenMARS dataset, although we do verify any results
that we find in OpenMARS against EMARS and find broadly similar results. Where there
are any notable differences, we include supplementary figures showing the results in EMARS
and discuss these differences.
2.3. Model
In addition to the OpenMARS reanalysis dataset, we use an idealized climate model to
investigate the role of different physical processes in shaping polar vortex structure and
variability. We make use of Isca, an idealized modeling framework developed with flexibility
in mind, first described in Vallis et al. (2018). One significant advantage of Isca, which we
exploit here, is the relative ease of including or excluding different physical processes within
model configurations. Here we include a brief description of the Isca representation of theRoles of latent heating and dust in Mars’s polar vortex 7
Martian atmosphere we build upon in this work: additional details can be found in Section
4 of Thomson & Vallis (2019a) (our simplest representation is identical to the configura-
tion described in their Section 4.3). Isca uses a spectral, primitive equation dynamical core
in spherical co-ordinates along with the multi-band, comprehensive SOCRATES radiation
scheme (Manners et al. 2017; Thomson & Vallis 2019b). The spectral files used were origi-
nally created for the ROCKE-3D model (Way et al. 2017), and have been adapted to include
dust aerosol as described below. We use a T42 spectral resolution (roughly corresponding
to a 64 x 128 spatial grid), and 25 vertical levels. We use topography from the Mars Orbiter
Laser Altimeter (MOLA) measurements aboard MGS (Smith et al. 1999).
To investigate the potential dynamical and thermal impacts on the northern Martian
polar vortex, we have additionally developed and implemented3 an idealized dust scheme and
representation of latent heating due to the condensation of CO2 , described below. These were
identified to be the primary missing processes in the representation of Mars’s atmosphere
within the Thomson-Vallis configuration of Isca-Mars, and, as shown below, are fundamental
in attaining a reasonable representation of the polar vortices in the model. We do not include
any representation of radiatively active ice clouds, which have been shown to significantly
influence temperatures and atmospheric circulation in MGCMs (Madeleine et al. 2012).
2.3.1. Representation of latent heating from carbon dioxide condensation
For this work, we have developed a simple representation of the latent heat released from
CO2 condensation as this has been proposed to play a crucial role in driving the annular
polar vortex in MGCMs (Toigo et al. 2017). Following Lewis (2003) and Way et al. (2017),
the condensation point of CO2 , Tc , is derived from an approximate solution to the Clausius-
Clapeyron relation, namely
Tc = 149.2 + 6.48 log (0.00135p) , (3)
where p is model pressure in Pascals and Tc is in Kelvin. When temperature projected by
the model, T ∗ , falls below Tc , model temperature T is set to Tc , as in Forget et al. (1998).
The difference Tc − T ∗ is then used to calculate the amount of latent heat that would be
released, by estimating the mass of CO2 that would condense according to this temperature
difference. We have not yet implemented within Isca any representation of the mass loss
itself that occurs when CO2 condenses. Although this can be a significant amount — up to
30% of the mass of the atmosphere can be lost over the course of a Martian winter (Tillman
1988) — it has been shown previously that the dynamical effect of the pressure changes
caused by the mass loss has less impact on the structure of the northern Martian polar
vortex than the latent heat release associated with the CO2 condensation (Waugh et al.
2019). As we represent dust using an analytical profile rather than as a tracer, there is
no opportunity for dust particles to act as condensation nuclei for CO2 ice, a process that
3 This configuration of Isca is currently available here: https://doi.org/10.5281/zenodo.46272648 Ball et al.
allows more atmospheric CO2 to condense in a dusty atmosphere (Gooding 1986). There
is also no representation of CO2 sublimation from surface ice into the atmosphere. In this
regard, our choice not to update the pressure where CO2 condensation occurs makes sense
in that otherwise eventually the atmospheric mass would disappear if we did consider the
mass lost.
2.3.2. Dust scheme
Dust is known to be an important feature in many Martian atmospheric processes. We
choose a simple representation of dust - prescribing an analytical longitudinal and verti-
cal profile that has been used in several MGCMs without explicitly modeling dust lifting
processes.
The effective radius and variance of dust particles are given by reff = 1.5µm and
νeff = 0.3µm respectively, consistent with simulation 2 of Madeleine et al. (2011). The
size distribution of the dust particles follows a modified-gamma profile and the spatial dis-
tribution of dust radiative properties is uniform. The parameters of the modified-gamma
distribution are determined by the values of reff and νeff , according to Hansen & Travis
(1974). The refractive indices of dust have been chosen according to Wolff et al. (2006).
Scattering properties are then calculated using a Mie scattering algorithm. Although dust
particles have been noted to be cylindrical with diameter-to-length ratio 1.0 (see, for exam-
ple, Wolff et al. 2009), here our choice of the SOCRATES radiation scheme means that they
must be modeled as spherical. However, the approximation does not introduce systematic
effects above the 5% level in radiance (Wolff et al. 2006), and is computationally much more
efficient.
Zonally-averaged infrared absorption CDOD normalized to the reference pressure of 610 Pa
product is input and converted to a surface mass mixing ratio by the SOCRATES interface
within the model. The vertical and longitudinal distribution of dust in the model then
follows the modified Conrath-ν profile described in Montmessin et al. (2004). The top of
the dust layer is given by zmax (km), dependent on solar longitude Ls (degrees) and latitude
φ (degrees), calculated as
zmax (Ls , φ) = 60 + 18 sin(Ls − 158)
(4)
−(32 + 18 sin(Ls −158)) sin4 φ − 8 sin(Ls − 158) sin5 φ.
From this, the dust mass mixing ratio a is calculated using the following expression:
( " ( 70 km/zmax )#)
pref
a = a0 exp ν 1 − max ,1 , (5)
p
where a0 is a constant mass mixing ratio at pressure p0 , determined by dust opacity at the
surface (see Conrath 1975; Pollack et al. 1979, for details), which is scaled to produce realistic
model temperatures and winds. pref is the reference pressure 700 Pa. The Conrath-ν profileRoles of latent heating and dust in Mars’s polar vortex 9
allows well-mixed dust in the lower atmosphere, with exponentially decreasing concentra-
tions of dust at higher altitudes and has been used in many MGCMs, such as Montmessin
et al. (2004); Madeleine et al. (2011); Guzewich et al. (2016). However, recent work showing
the evidence of detached dust layers suggests this profile might not be as appropriate as
once thought, particularly in the tropics (Heavens et al. 2014). We choose however to use
it here both for its simplicity, ease of adaptation, and for comparability with other models.
Since dust is determined by an analytical expression within the model and is not lifted from
the surface into the atmosphere, there is no capacity for spontaneous generation of dust
storms. However the flexibility to choose an analytical distribution within the model allows
the user to investigate the impact of a high dust loading in an area of their choosing. All
dust distributions underlying the simulations in this study are zonally symmetric, although
Isca presents the user with the option of a full latitudinally- and longitudinally-varying dust
distribution.
2.3.3. Dust Scenarios
We present results from simulations from Isca with various dust scenarios. The model
uses the Mars Climate Database (MCD) (Forget et al. 1999; Millour et al. 2018) dust year
climatologies (Montabone et al. 2015, 2020), to form simulations that isolate the role of in-
terannual dust variability, the years of which may be compared directly to the years available
in OpenMARS. Details of the dust cycle used in the MCD are described in Madeleine et al.
(2011). These dust products inform the surface dust mass mixing ratio, a0 , and all years of
simulations then follow the Conrath-ν vertical profile (Equation 5). These simulations all
include representations of dust, latent heat release, and topography as we are interested in
the influence of dust in each MY in our most realistic simulations.
We also use the MCD standard dust scenario, which is built by averaging the kriged yearly
climatologies MY 24-31 (excluding the GDS events of MY 25 and MY 28) (Montabone et al.
2015), to investigate how latent heat release, dust, and topography influence the polar vortex.
Using this climatology product allows us to simulate our best guess of a Martian year with
‘typical’ dust loading. These climatological simulations will form the basis of our process
attribution study. The evolution of surface and vertical dust mass mixing ratio is shown in
Figure 1 for the climatological dust simulations.
Explicitly, the simulations that we use are:
• Nine ‘yearly simulations’ using the yearly dust products (MY 24-32), MOLA to-
pography and latent heat release,
• Eight process attribution ‘climatological simulations’, using combinations of
MOLA topography, latent heat release and the standard dust scenario product.
Each simulation was run with three ensemble members with perturbed initial conditions,
each allowed to spin up for 1 MY, which is found sufficient to reach an equilibrated state.10 Ball et al.
Northern Northern Northern Northern
a summer solstice winter solstice b summer solstice winter solstice
1.7e-06 1.0e-05
75
1.0e-06
50 1.4e-06
dust mmr (kg/kg)
dust mmr (kg/kg)
1.0e-07
pressure (hPa)
25 0.1
latitude ( N)
1.1e-06 1.0e-08
0
8.0e-07 1.0e-09
25
1 1.0e-10
50 5.0e-07
1.0e-11
75 2.0e-07 1.0e-12
6
c d
0.25 0.18
80 0.1 0.16
70 0.20 0.14
pressure (hPa)
0.12
latitude ( N)
60
Tc T * (K)
Tc T * (K)
0.15 0.10
0.10 0.08
60 1 0.06
70 0.05 0.04
80 0.02
0.00 0.00
6
0 50 100 150 200 250 300 350 0 50 100 150 200 250 300 350
solar longitude (degrees) solar longitude (degrees)
Figure 1. Evolution of surface (a) and equatorial vertical (b) dust mass mixing ratios (mmr) for
the ‘standard’ dust product over the course of a Martian year. Temperature below condensation
point (details in text) in the full ‘climatological’ simulations (including representation of dust, latent
heat release and topographical forcing) on the 2 hPa surface (c) and at 85◦ N (d).
Results shown are then the average of these three ensemble members. The exception is
MY 28, which was run with 10 ensemble members to further investigate the impact of the
GDS in this year. Figure 1 shows the evolution of surface and equatorial vertical dust
mass mixing ratio throughout the ‘climatological year’, illustrating the peak in dust loading
around the northern winter solstice. The vertical profile is informed by the Conrath-ν profile.
Absorption CDOD normalized to 610 Pa for individual years can be seen in Figure 21 of
Montabone et al. (2015), illustrating dust loading across individual Martian years.
Figure 1 also illustrates a proxy for the amount of latent heat released over the course of
a Martian year during the ‘climatological simulation’ including dust, topography and latent
heat release. The proxy for latent heat release shows where temperature T ∗ falls below the
pressure-dependent condensation point of CO2 as defined in Equation 3. We see that latent
heat release occurs throughout northern winter, up to ∼ 0.1 hPa.
3. RESULTS
3.1. Polar vortex mean state and interannual variability
Figure 2 shows the vertical cross-section of zonal-mean PV over each winter of OpenMARS
data. PV has been scaled according to Lait (1994) to remove vertical variation due to
exponentially decreasing pressure with altitude (see Section 2.1 for details). It can be seen
that the maximum in PV (blue contour) lies away from the pole, meaning an annular vortex,
below ∼ 0.1 hPa, in each Martian year, for each year save MY 28. In MY 28, the zonal-mean
zonal winds are weaker and the maximum in PV lies at the pole.Roles of latent heating and dust in Mars’s polar vortex 11
We also note that there appears to be a systematic difference in the vertical structure of
the PV cross-section in the different periods of OpenMARS. The TES period (MY 24-27,
Figure 2a-c) shows a very strong vortex core, confined roughly below 0.1 hPa, whereas the
MCS period (MY 28-32, Figure 2d-h) displays a stronger vortex at higher altitudes. EMARS
also displays this high PV at high altitudes in the MCS period (not shown). Since MCS
temperature retrievals reach approximately 80 km (∼ 0.05 hPa) in altitude, compared with
TES retrievals at ∼40km (∼ 3 hPa), this would reinforce the finding of Waugh et al. (2016)
that differences between MACDA (noting that MACDA is only available for the TES period,
and shows a very similar structure to OpenMARS TES) and EMARS vortex structure above
0.1 hPa are largely due to differences in the underlying models, and the reanalyses below
0.1 hPa are controlled by the assimilated data.
a MY 24 b MY 25 c MY 26 d MY 28
0.01 60
100
pressure (hPa)
55
50
50
Lait-scaled PV (10 5 K m2 kg 1 s 1)
50
0
50
100
0.10
0
0
100
0
100
50
150
45
1.00
0
40
0 0 35
0
0
10.00 30
e MY 29 f MY 30 g MY 31 150 h MY 32
150
0.01 25
150
150
20
pressure (hPa)
15
50
100
0.10
100
100
100
0
0
50
0 0 10
50
50
1.00 5
0 0 0 0 0
10.00 5
0 20 40 60 80 0 20 40 60 80 0 20 40 60 80 0 20 40 60 80
latitude ( N) latitude ( N) latitude ( N) latitude ( N)
Figure 2. Monthly-mean zonal-mean Lait-scaled potential vorticity (shading) and zonal wind (solid
black contours) for each Martian winter in the OpenMARS reanalysis dataset. Note that the winter
of MY 27, when there were no TES or MCS temperature retrievals, is not shown. Dashed contours
correspond to the 200, 300, . . . K potential temperature surfaces and the blue contour marks the
latitude at which PV takes it maximum value at each pressure level. The Martian winter solstice
falls at Ls =270◦ , and a winter solstice-mean is here taken to be Ls =255◦ -285◦ . Blue contours show
the latitude at which PV takes its maximum value at each pressure level.
Figure 3 shows Lait-scaled PV and zonal winds over mid-winter in OpenMARS on the
350 K isentropic surface. The annular, elliptical vortex is visible in all years, save MY 28
(Figure 3d). In MY 28, we also observe reduced zonal wind speeds (by up to 40 ms−1 ) and
the destruction of the polar vortex in the mid-winter period. The GDS of MY 25 (Figure 3b),
which ended at around Ls ∼ 245◦ , appears not to have had this effect. Given the relatively
short radiative relaxation time scales on Mars (∼0.5-2 sols) (Eckermann et al. 2011), this is
perhaps not surprising. Indeed, an average over the period Ls = 235 − 245◦ equivalent to
Figure 3 shows that, during this period, the polar vortex in MY 25 was greatly weakened,
but clearly recovers by the winter solstice (not shown).12 Ball et al.
a MY 24 b MY 25 c MY 26 d MY 28
80
40 80
120
0 0
80
80
120 40
4
120
80
120
40
0
120
120
80
e MY 29 f MY 30 g MY 31 h MY 32
40 0
40 0
40 20
80
120
12
12
80
12080
40
1
120
120
120
80
10 20 30 40 50 60 70 80 90 100
Lait-scaled PV (10 5 K m2 kg 1 s 1)
Figure 3. Winter-averaged north polar stereographic maps of Lait-scaled PV (shading) and zonal
wind (contours) on the 350K (∼ 0.1 hPa) surface from each winter of OpenMARS data. Dashed
latitude lines correspond to 60◦ N and 80◦ N, with each panel bounded at 50◦ N.
In order to understand these structures we sequentially ‘turn on’ certain processes within
Isca, so forming a hierarchy of simulations. Figure 4 shows that a representation of dust
is necessary within the model to achieve the high zonal winds and temperatures seen in
OpenMARS. This is due to the atmospheric heating caused by the addition of dust aerosol
into the atmosphere. Dust within the model enhances both the jet strength and the polar
high altitude warming, a characteristic feature of the Martian winter atmosphere caused
by enhanced poleward meridional transport of warm air (Guzewich et al. 2016). Polar
temperatures at low altitudes (> 1 hPa) in simulations that include latent heat release
(Figure 4c,e) are up to 10 K warmer than those without (Figure 4b,d). This is in much
better agreement with the temperatures seen in reanalysis (Figure 4a). However, we note
that the small area over which CO2 condenses appears insufficient to strongly affect zonal-
mean zonal winds, aside from a small weakening in winds.
Figure 5 shows monthly zonal-mean PV for various Isca configurations, all with topogra-
phy. By observing the solid blue contour in Figure 5c,e, it is clear to see that latent heating
in the model does indeed push the maximum in PV away from the pole, particularly at
altitudes between 1-0.1 hPa, compared to simulations that do not include representation of
latent heat release. This suggests that latent heat release at the pole is acting to reduce PV
there, thereby driving the annulus. We also see that dust in the model pushes the jet core
further poleward, reducing the latitudinal extent, as may be expected from an enhancement
of the mean meridional circulation. Dust also increases the vertical potential temperature
gradient at lower altitudes (consider the tightening of the isentropes seen in Figure 2b,d, forRoles of latent heating and dust in Mars’s polar vortex 13
a b c d e Latent heat
0.01 OpenMARS Standard Latent heat Dust and dust
100
pressure (hPa)
-50
150
150
50
0.10
150 -50 -50
0
0
1.00 50 50 100 100
0
0 0 0 50 0 0
0 0
50
0
0
0
0
00 0 0
0
0
0
10.00
0 25 50 75 0 25 50 75 0 25 50 75 0 25 50 75 0 25 50 75
latitude ( N) latitude ( N) latitude ( N) latitude ( N) latitude ( N)
110 130 150 170 190 210 230 250
Temperature (K)
Figure 4. Winter cross-sectional profiles (Ls =255◦ -285◦ ) of zonal-mean temperature (shading)
and zonal wind (contours) in the Northern Hemisphere for all years of OpenMARS (a) and for the
‘climatological simulations’ with topography (b-e). For each simulation, winds and temperatures
have been averaged over 3 ensemble members.
example) and it is this that contributes to the strengthening of PV concentration at around
1 hPa.
a b c d e Latent heat
0.01 OpenMARS Standard Latent heat Dust and dust
pressure (hPa)
0.10
1.00
10.00
0 25 50 75 0 25 50 75 0 25 50 75 0 25 50 75 0 25 50 75
latitude ( N) latitude ( N) latitude ( N) latitude ( N) latitude ( N)
5 0 5 10 15 20 25 30 35 40 45 50 55 60 65
Lait-scaled PV (10 5 K m2 kg 1 s 1)
Figure 5. Winter (Ls =255◦ -285◦ ) zonal-mean Lait-scaled potential vorticity (shading) and po-
tential temperature surfaces (dashed contours, corresponding to 200, 300, . . . K) in the Northern
Hemisphere averaged over all years of OpenMARS (a) and for the ‘climatological simulations’ with
topography (b-e). For each simulation, winds and temperatures have been averaged over 3 ensemble
members. The solid blue contour shows the latitude of maximal Lait-scaled PV at each pressure
level, as in Figure 2.
To investigate the influence of interannual dust variability, we also ran the ‘yearly simu-
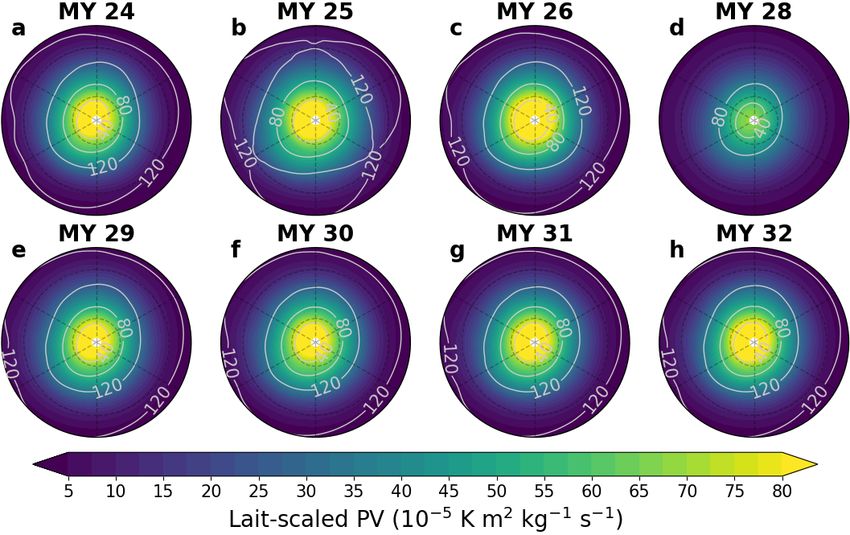
lations’ described in Section 2.3.3. Figure 6 shows PV for each year on the 350 K surface,
which is approximately at the core of the vortex in OpenMARS. Although the dust signal is
relatively weak compared to the reanalysis, MY 28 (Figure 6d) does see a weakening of PV
over the pole, particularly noticeable when only compared to other MCS years (MY 29-32,
Figure 6e-h). Although the zonal winds do not appear much weaker in MY 28 simulations,
as they are in the reanalysis (Figure 3d), when dust mass mixing ratio is increased fur-
ther within the model, thereby increasing the total atmospheric dust loading, zonal winds
weaken and PV is completed destroyed in MY 28 (Supplementary Figure 11d). Hence, one14 Ball et al.
a MY 24 b MY 2512 c MY 26 d MY 28
12
0 0
120
80
0
12
120
80
80
0
0
12 40
80
40
80
40 40
120
120
80
0
e MY 29 f MY 30 g MY 31 h MY 32
120
120
120
120
80
80
80
40
40
40
40
80
120 120 120 120
120
120
10 20 30 40 50 60 70 80 90 100
Lait-scaled PV (10 5 K m2 kg 1 s 1)
Figure 6. Winter-averaged north polar stereographic maps of Lait-scaled PV (shading) and zonal
wind (contours) on the 350K surface from ‘yearly’ model simulations. All simulations are run with
topography, latent heat, and the corresponding dust opacity for each MY. Each year consists of
three ensemble members. Dashed latitude lines correspond to 60◦ N and 80◦ N, with each panel
bounded at 50◦ N.
might conclude that although the dust signal is somewhat weaker in our model than in the
reanalysis, dust was indeed a major contributor to the vortex weakening in MY 28.
To illustrate the difference in circulation between MY 28 and other years in both the
reanalysis and model, we now investigate the Eulerian meridional mass streamfunction,
given by Z p
2πr
ψ (φ, p) = cos φ v̄ (φ, p) dp, (6)
g 0
where r is Mars’s radius (3.39 × 10⁶ m), g is gravitational acceleration, and v̄ is zonal-mean
meridional wind. In both reanalysis and model, we see the typical Martian cross-equatorial
Hadley cell (Figure 7b,e). In MY 28, this is strengthened and the descending branch of
the overturning cell is pushed further poleward (Figure 7c,f). The model has a persistent
anti-clockwise cell north of 40◦ N (Figure 7d,e). Although this does not appear in the multi-
annual average for OpenMARS, it is seen in MY 29-32 (Supplementary Figure 13).
3.2. Sub-seasonal polar vortex variability
We now turn to investigate the factors driving shorter-term, sub-seasonal variability of
the northern polar vortex, again drawing on our model simulations and reanalysis data.
Scott et al. (2020) investigated the transient nature of the Martian polar vortex by using an
eddy-resolving shallow water model. They used a quantity called integrated eddy enstrophy,
given by Z
1
Z= q 02 dA, (7)
4πr2Roles of latent heating and dust in Mars’s polar vortex 15
a MY 28 b Climatology c Difference
0.01
8
2
6
pressure (hPa)
14 6 4
OpenMARS
0
0.10
2
2
1.00
10
14 18
10
18 2 10
-2 -2
6
-4
18
14
2610 18
14
610
0
10.00
d e f
0.01 2
pressure (hPa)
0.10
Model
1.00
86 4
26
10 2
0
2
10 14
18
6
-22
10
14
-2
2610 18 1418 -8-6 -4 -2 -2
10.00
0 20 40 60 80 0 20 40 60 80 0 20 40 60 80
latitude ( N) latitude ( N) latitude ( N)
2 0 2 4 6 8 10 12 14 16 18 10 8 6 4 2 0 2 4 6 8 10
(108 kg/s) difference (108 kg/s)
Figure 7. Northern hemisphere Eulerian meridional mass streamfunction ψ averaged over Ls =
270 − 300 for OpenMARS (top row) and Isca (bottom row). OpenMARS data is MY 28 (a) and
a climatological average over over MY 24-26, 29-32 (b). For Isca, the data shown are the MY 28
‘yearly simulation’ (d) and the ‘climatological simulation’ with dust, latent heating, and topography
(e). The difference between MY 28 and the climatology is shown for OpenMARS (c) and Isca (f).
where q 0 = qs − q¯s is the departure from the zonal-mean (scaled) potential vorticity and dA is
an area integral. Integrated eddy enstrophy is a measure of the flow’s zonal asymmetry, and
is useful in understanding the transience of the flow. They found that a representation of
stronger latent heating led to increased mean and variance of the eddy enstrophy, indicating
that both mean eddy activity and the transience of the vortex increase as the vortex becomes
more annular, and so more unstable. Here we also investigate eddy enstrophy in the northern
polar vortex, in order to understand how vortex variability develops over the course of a
Martian winter, and how it is influenced by topography, dust, and latent heat release.
We see in Figure 8 that eddy enstrophy is heavily influenced by dust loading in the
Martian atmosphere. In panels 8d-e, note that MY 28 experiences a significant drop in eddy
enstrophy around mid-winter, at the height of the GDS. Indeed, in the reanalysis (Figure
8d), eddy enstrophy is almost zero, suggesting that eddy activity within the core of the
vortex was minimal. This corroborates the finding that the polar vortex in MY 28 was
almost entirely destroyed from a PV point of view.
We also identify here for the first time the interesting double-peaked structure of eddy
enstrophy in the later reanalysis years (Figure 8d), which is not displayed in the earlier
ones (Figure 8a). This pause in eddy enstrophy is reminiscent of the ‘solsticial pause’ in
temperature eddies (Lewis et al. 2016; Mulholland et al. 2016), which is confined to low16 Ball et al.
Northern Northern Northern Northern Northern Northern
a summer solstice winter solstice b summer solstice winter solstice c summer solstice winter solstice
OpenMARS MY 24 Model MY 24 Model without
MY 25 MY 25 topography
125 MY 26 MY 26
MY 27 MY 27
eddy enstrophy (106PVU2)
100
Reanalysis
Standard
75 Latent Heat
Dust
Latent Heat and Dust
50
25
0d e f
OpenMARS MY 28 Model MY 28 Model with
MY 29 MY 29 topography
125 MY 30 MY 30
MY 31 MY 31
eddy enstrophy (106PVU2)
MY 32 MY 32
100
Reanalysis
Standard
75 Latent Heat
Dust
Latent Heat and Dust
50
25
0
0 50 100 150 200 250 300 350 0 50 100 150 200 250 300 350 0 50 100 150 200 250 300 350
solar longitude (degrees) solar longitude (degrees) solar longitude (degrees)
Figure 8. Smoothed evolution of eddy enstrophy on the 350K isentropic surface. This is shown for
OpenMARS (panels split into MY 24-27 (a) and MY 28-32 (d) for clarity), Isca simulations using
the yearly dust product (similarly split into MY 24-27 (b) and MY 28-32 (e)), and for climatological
model simulations displaying the effect of the different driving mechanisms without topography (c)
and with topography (f). The dust product in panels (c) and (f) is the dust scenario product and
each simulation is averaged over 3 MY. Eddy enstrophy is expressed in PVU2 : potential vorticity
units (PVU) are a quantity often used to express PV, where 1 PVU = 10−6 K m2 kg−1 s−1 .
altitudes during the TES period, and so is not present in Figure 8a. Intriguingly, this
feature is only observed in the OpenMARS reanalysis - there is only a drop in EMARS
eddy enstrophy during MY 28 (see Supplementary Figure 12b). This suggests that the
pause in eddy enstrophy is likely a combination of the underlying UK-LMD MGCM used in
OpenMARS and a systematic feature of the MCS retrievals, and that the high dust loading
in MY 28 does indeed cause a significant drop in eddy enstrophy.
Figures 8c,f show the effect of topography, latent heating, and dust on eddy enstrophy in
the northern polar vortex. The addition of topography to the model increases eddy enstrophy
significantly in the autumn and early winter. This might correspond to the large-amplitude
zonal wavenumber 1 waves identified in this season by Wilson et al. (2002), which were noted
to have the characteristics of a Rossby wave. The increased variance in the eddy enstrophy
on small time scales also indicates that the vortex is more transient when topography is
included. Overall, we see that it is the combination of dust and topography that allows the
model to best capture the shape of eddy enstrophy evolution seen in the reanalysis, although
the peak in eddy enstrophy falls slightly later in the year in the model compared with theRoles of latent heating and dust in Mars’s polar vortex 17 reanalysis. Hence these processes can be seen to be important in capturing realistic vortex variability. In simulations with topography, the inclusion of dust appears to suppress eddy activity around Ls ∼ 0 − 75◦ and Ls ∼ 150 − 225◦ (Figure 8f). Without topography, this effect is less substantial and occurs over a shorter period of time, but is still present. Further analysis is necessary here to investigate the causes of these changes in eddy enstrophy between model configurations, along with the processes that are affected, but this is beyond the scope of this paper. Perhaps surprisingly, adding latent heat release to the model does not seem to have a particularly large or consistent effect on the eddy enstrophy. Where latent heat release does appear to cause a drop or increase in eddy enstrophy (e.g. Figure 8c, Ls ∼200◦ ), we find that this is where there is largest ensemble spread in our model simulations (not shown). In general, our simulations show little ensemble spread. In the response to the MY 28 dust storm, polar cap temperature rises, and there is a small increase in zonal wind and decrease in PV on the 350 K surface in all 10 ensemble members. The ensemble spread is greatest in our ‘climatological simulations’ without dust, particularly at times of high eddy activity, such as early autumn (not shown). Given the larger ensemble spread at these times, it is difficult then to draw conclusions about the influence of latent heat release on mean eddy activity, which is perhaps surprising given the results of Scott et al. (2020). When dust is included in the model, it appears to significantly impact the eddy enstrophy evolution, along with topography, far more so than latent heating, noting that ‘latent heating’ and ‘latent heating and dust’ simulations have broadly the same shape in both panels (c) and (f). This suggests that dust and topography are primarily the driving mechanisms behind eddy enstrophy evolution, and hence polar vortex zonal asymmetry and sub-seasonal variability. To investigate further the drop in eddy enstrophy noted in MY 28, we also show a tem- perature proxy for the latent heat released, as in Figure 1. Figure 9a shows that in MY 28, following the onset of the GDS, the amount of latent heat released is considerably lower than in all later years during the same time period. This suppression of latent heat release is likely due to vigorous downwelling at the pole causing higher temperatures within the polar vortex (see Figure 7). This is similarly reflected in the yearly model simulations, where MY 28 once again shows less latent heat release than later years. We remark also on the apparent difference between the TES and MCS eras in Figure 9a. It is unclear to us what is causing the particularly small drop below Tc in MY 25-26. As there is no evidence of a similar pattern in our simulations (in fact, we see that MY 24 has the least amount of latent heat released in the model TES period), we suggest that this could be caused by temperature and dust retrievals strongly dominating the free-running MGCM in the reanalysis. Differences in the quality control procedures for the TES- and MCS-period dust opacity retrievals mean that only dust opacity retrievals where surface temperature was greater than 220 K were assimilated into OpenMARS during MY 24-27. On the other hand, both daytime and nighttime dust opacity retrievals from MCS were assimilated (Holmes
18                                                                                       Ball et al.
                                                              OpenMARS                                                                       Model
                                              Northern                           Northern                                Northern                         Northern
                                  a        summer solstice                     winter solstice               b        summer solstice                   winter solstice
                                0.5         MY 24                                          0     0.050
                                                                                                                       MY 24                                                     0
                                            MY 25                                      0.05                            MY 25                                              0.10

                                0.4         MY 26                                                                      MY 26
                   Tc T * (K)               MY 27                                                                      MY 27
                                            MY 28                                                                      MY 28
                                0.3         MY 29                                                                      MY 29
                                            MY 30                                                                      MY 30
                                0.2         MY 31                                                                      MY 31
                                            MY 32                                                                      MY 32
                                0.1
                                0.0c                                                                         d
                                                                                           0     0.050                                                                           0
                                                                                       0.05                                                                               0.10
                                80
                                70
       latitude (degrees)

                                60

                                60
                                70
                                80                  0.05
                                                        0   0.10
                                                                                                                                 0.100
                                                                                                                                    0.100
                                                                0
                                       0    50      100            150   200     250           300        350 0        50      100          150   200     250     300     350
                                                    solar longitude (degrees)                                                  solar longitude (degrees)
                                   0.0                      0.1                   0.2                         0.3                    0.4                    0.5
                                                                                                         Tc T * (K)

Figure 9. Difference Tc − T ∗ (K) for each OpenMARS (a) and Isca (b) year on the 2 hPa pressure
                                                ∗                      0.100
level. Tc is given in Equation
                         0.05
                              0 0 3. For (a), T
                                 .100             is taken to be the temperature
                                                                          0.100  in OpenMARS and for
(b) T ∗ is the temperature predicted by the model before the temperature floor at Tc is applied. In
(a) and (b) we calculate an area-weighted average over 60◦ -90◦ N to show a proxy for the amount
of latent heat released. Panels (c) and (d) show the zonally-averaged climatology of the evolution
of Tc − T ∗ (K) on the 2 hPa pressure level (shading). The climatology is obtained by averaging
over MY 24-32 for both OpenMARS (a) and Isca (b), and standard deviation (K) is also shown
(contours).

et al. 2020), perhaps allowing the reanalysis to reach these colder temperatures in later
years, although this does not explain the difference between MY 24 and MY 25-26.
  Finally, we look at the sub-seasonal changes in jet strength and overturning circulation
during a GDS. Figure 10a shows the latitude of maximum zonal-mean zonal wind at 50 Pa
and the latitude at which ψ at 50 Pa first crosses zero north of the equator during each year
of the OpenMARS reanalysis. There are significant differences to note between the two eras
of OpenMARS. We see that during the MCS era, the jet latitude can be up to 5◦ poleward
of the jet latitude in the TES era. We also see that the maximum latitude reached by the
Hadley cell edge during the TES period is roughly 75◦ N, and that this maximum occurs just
following mid-winter (Ls ∼ 280◦ ). This is not the case for the MCS period. Instead, there
is a local minimum in latitude over the mid-winter period, and a maximum of around 70◦ N
is reached at Ls ∼ 240◦ .
  We also see a difference in the strength of the overturning circulation, defined as the
maximum value of ψ at 50 Pa in the northern hemisphere, for the two periods in Figure
10b. It appears the mean meridional circulation is somewhat weaker in the TES period than
in the MCS period. In the MCS era, the strength of the mean meridional circulation shows
Roles of latent heating and dust in Mars’s polar vortex 19
a Jet latitude and Hadley cell edge
MY 24-26
75 MY 28
MY 29-32
latitude ( N) 70
65
60
55
50
b Jet and Hadley cell strength
150
50
125
strength (108 kg/s)
jet strength (ms 1)
100 40
75 30
50 20
25 MY 24-26
MY 28 10
0 MY 29-32
220 240 260 280 300 320 340 360
solar longitude (degrees)
Figure 10. Smoothed evolution of jet latitude (solid lines) and edge of the Hadley cell (dashed
lines) on the 50 Pa surface (a). Smoothed evolution of jet strength (solid lines) and strength of the
overturning streamfunction (dashed lines) on the 50 Pa surface (b). We define the jet latitude and
strength, and the edge and strength of the Hadley cell in the main text. Data are calculated from
OpenMARS and blue lines correspond to the TES era (MY 24-26), red lines to MY 28, and gray
lines to the later MCS era (MY 29-32). Black lines indicate the MY 28 global dust storm period.
little interannual variability, save for in MY 28 during the GDS. Jet strength is remarkably
consistent across all years of OpenMARS. The largest deviation during the reanalysis occurs
during the MY 28 GDS, when jet strength is weakened by around 50 m s−1 . During this
period, the meridional circulation strengthens considerably, and both the jet latitude and
Hadley cell edge shift polewards.
4. SUMMARY
Building on previous work by Guzewich et al. (2016) and Toigo et al. (2017), in this study
we have explored the structure, interannual variability and sub-seasonal transience of the
northern Martian polar vortex, and how these are influenced by an interplay of topography,
latent heat release and dust loading. In agreement with Toigo et al. (2017) we have shown
that latent heat release plays a vital role in the annular PV structure of the polar vortex. We
showed that the northern polar vortex is heavily affected by the atmospheric dust loading20 Ball et al. in the reanalysis. In particular, the during the global dust storm of MY 28, there was a total destruction of polar potential vorticity and zonal winds were dramatically reduced. During this time, eddy activity within the vortex was also significantly reduced, the edge of the Hadley circulation was pushed further polewards and the Hadley circulation was strengthened. We have confirmed the idea that the vertical potential vorticity structure of the northern polar vortex in the current reanalyses is well constrained by the observations assimilated into the model, first proposed by Waugh et al. (2016). Our analysis has also shown significant differences in the sub-seasonal transience of the northern polar vortex according to which era of the reanalysis is investigated. From our process attribution simulations, we found that the combination of dust and topography is responsible for the evolution of the zonal asymmetry of the vortex (as measured by eddy enstrophy) throughout the Martian year, which peaks in the northern high latitudes in late winter. Indeed, it is only with the inclusion of dust that we can properly capture the mean-state (in particular the temperatures and winds) and variability of the northern polar vortex in the model. When there is no dust represented in our model, eddy activity varies significantly from the reanalysis, particularly during northern autumn. Further investigation is needed to understand the processes behind these differences. It is our hope that the Martian configuration of Isca developed for this work, which significantly extends that of Thomson & Vallis (2019a) by including representations of dust and latent heating, will be useful in future research regarding Martian atmospheric dynamics. While more idealized than some other Martian global climate models, it has the advantage of being highly flexible and allows users to easily isolate the effects of different parameters and physical processes on the atmospheric circulation. The model allows easy-to-configure representations of latent heat release, dust and topography, all of which may be adapted to best suit the user’s research interests. Within this study, we have used a zonally symmetric dust distribution in our simulations. Given that many regional dust storms on Mars can have significant dust loading but do not encircle all longitudes, further research might address the effects of longitudinally asymmetric dust storms on the Martian polar vortices. We have also focused here on the northern hemisphere polar vortex, but there is plenty of scope to investigate processes affecting the southern hemisphere vortex. Guzewich et al. (2016) showed that the southern vortex was less strongly affected by winter-time dust loading than the northern, but given the topographical and dust loading hemispheric asymmetries on Mars, such processes may play different roles in the southern polar vortex. Our simulations of Martian year 28 global dust storm consistently find an increase in the strength of the jet, but our additional ‘high dust’ Martian year 28 simulation shows the opposite response (in agreement with the reanalysis). This suggests that there may exist be a nonlinearity in the polar vortex response to dust loading. Future research may investigate this nonlinear behavior and exactly which processes in the Martian atmosphere change at this point. It would also be valuable to further investigate how different degrees of latent
Roles of latent heating and dust in Mars’s polar vortex                             21

heating affect the annulus within our flexible global climate model by changing the threshold
temperature at which carbon dioxide condenses, in a manner similar to Scott et al. (2020).

                                  ACKNOWLEDGMENTS
  We would like to thank the authors of the OpenMARS and EMARS reanalyses for mak-
ing their data publicly available. OpenMARS data can be found in Holmes et al. (2019).
EMARS data is available at https://doi.org/10.18113/D3W375. We would also like to thank
the creators of the MCD for freely distributing the database. MCD dust products used within
this study are available at http://www-mars.lmd.jussieu.fr/mars/info web/index.html; see
Madeleine et al. (2011) for details. E.B is funded by a NERC GW4+ Doctoral Training Part-
nership studentship from the Natural Environmental Research Council (NE/S007504/1).
D.M is funded under a NERC research fellowship (NE/N014057/1).

  Software: Isca (Vallis et al. 2018), xarray (Hoyer & Hamman 2017), cartopy (Met Office
2010 - 2015), MetPy (May et al. 2008 - 2020), Windspharm (Dawson 2016)

                                         APPENDIX

                             A. SUPPLEMENTARY FIGURES

  We present here additional figures intended to supplement the main body of work. Figure
11 shows yearly simulations run with a higher dust loading (surface mass mixing ratio double
that of our other simulations). This led to higher temperatures and stronger winds than
those seen in reanalysis. Significantly, however, we see that PV during the MY 28 dust
storm is reduced in these model simulations (Figure 11d). Winds are also weakened.
  Figure 12 shows the evolution of eddy enstrophy as calculated from EMARS data. The
drop in eddy activity during the MY 28 GDS is seen in this reanalysis as well as in Open-
MARS, although the pause during mid-winter in other years is not present. Finally, Figure
13 shows the meridional streamfunction for the two eras of OpenMARS data. The MCS era
(Figure 13b) displays a weak anti-clockwise cell poleward of 50◦ N.

                                       REFERENCES

Banfield, D., Conrath, B., Gierasch, P.,         Bertrand, T., Wilson, R. J., Kahre, M. A.,
  Wilson, R., & Smith, M. 2004, Icarus, 170,       Urata, R., & Kling, A. 2020,
  365 , doi: https:                                J. Geophys. Res.(Planets), 125,
  //doi.org/10.1016/j.icarus.2004.03.015           e2019JE006122,
Barnes, J. R., & Haberle, R. M. 1996,              doi: https://doi.org/10.1029/2019JE006122
  Journal of Atmospheric Sciences, 53, 3143,     Clancy, R. T., Sandor, B. J., Wolff, M. J.,
  doi: 10.1175/1520-0469(1996)053h3143:            et al. 2000, J. Geophys. Res., 105, 9553,
  TMZMCAi2.0.CO;2                                  doi: 10.1029/1999JE001089
You can also read