Accuracy of short tandem repeats genotyping tools in whole exome sequencing data - bioRxiv
←
→
Page content transcription
If your browser does not render page correctly, please read the page content below
bioRxiv preprint doi: https://doi.org/10.1101/2020.02.03.933002. The copyright holder for this preprint (which was not peer-reviewed) is the
                              author/funder. It is made available under a CC-BY-NC-ND 4.0 International license.

      Accuracy of short tandem repeats genotyping tools in
      whole exome sequencing data
      Andreas Halman1,2,3,4 and Alicia Oshlack1,2,5

      1. Murdoch Children’s Research Institute, Royal Children’s Hospital, Parkville, VIC 3052, Australia
      2. Peter MacCallum Cancer Centre, 305 Grattan St, Melbourne, VIC 3000, Australia
      3. Florey Institute of Neuroscience and Mental Health, University of Melbourne, Parkville, VIC 3052, Australia
      4. School of Natural Sciences and Health, Tallinn University, 10120 Tallinn, Estonia
      5. School of BioScience, University of Melbourne, Parkville, VIC 3052, Australia

      Abstract
      Background: Short tandem repeats are important source of genetic variation, they are highly mutable
      and repeat expansions are associated dozens of human disorders, such as Huntington's disease and
      spinocerebellar ataxias. Technical advantages in sequencing technology have made it possible to analyse
      these repeats at large scale, however, accurate genotyping is still a challenging task. We compared four
      different short tandem repeats genotyping tools on whole exome sequencing data to determine their
      genotyping performance and limits which will aid other researchers to choose a suitable tool and parameters
      for analysis.

      Methods: The analysis was performed on the Simons Simplex Collection dataset where we used a novel
      method of evaluation with accuracy determined by the rate of homozygous calls on the X chromosome of
      male samples. In total we analysed 433 samples and around a million genotypes for evaluating tools on
      whole exome sequencing data.

      Results: We determined a relatively good performance of all tools when genotyping repeats of 3-6 bp
      in length which could be improved with coverage and quality score filtering. However, genotyping
      homopolymers was challenging for all tools and a high error rate was present across different thresholds
      of coverage and quality scores. Interestingly, dinucleotide repeats displayed a high error rate as well,
      which was found to be mainly caused by the AC/TG repeats. Overall, LobSTR was able to make the
      most calls and was also the fastest tool while RepeatSeq and HipSTR exhibited the lowest heterozygous
      error rate at low coverage.

      Conclusions: All tools have different strengths and weaknesses and the choice may depend on the type
      of analysis. In this analysis we demonstrated the effect of using different filtering parameters and
      offered recommendations based on the trade-off between the best accuracy of genotyping and the
      highest number of calls.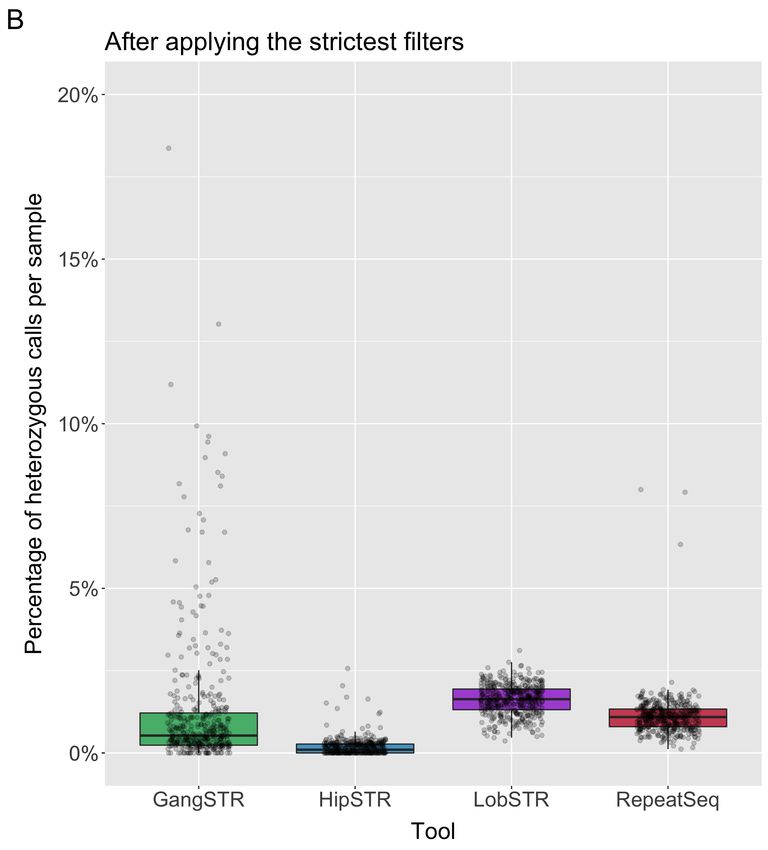
bioRxiv preprint doi: https://doi.org/10.1101/2020.02.03.933002. The copyright holder for this preprint (which was not peer-reviewed) is the
                              author/funder. It is made available under a CC-BY-NC-ND 4.0 International license.

      Introduction

      Overview of short tandem repeats and methods of analysis
      Short tandem repeats (STRs), also known as microsatellites, consist of repeated units of 1 to 6
      base pairs (bp) in length and cover about 3% of the human genome (Gymrek, 2017). STRs are
      highly mutable and often vary in their number of repeat units across the population. They can
      be found in various regions of the genome, including in or near protein coding regions and
      introns (Hannan, 2018). Expanded variants contribute to several dozen human disorders,
      including Huntington's disease, fragile X syndrome, spinocerebellar ataxias and other diseases.
      In addition, variation in STR length has been shown to associate with quantitative traits such
      as gene expression (Gymrek, 2017). The standard method to genotype the length of STRs is to
      perform polymerase chain reaction (PCR) amplification on the region of interest and gel
      electrophoresis (Tang, Haixu et al., 2017). Sanger sequencing has high accuracy, but low
      throughput, limiting analysis to a few genes at a time (Caspar et al., 2018).

      Recent technology advances in high-throughput sequencing (HTS) has revolutionised
      genomics field and brought us the opportunity to detect sequence variants at a scale that was
      impossible before (Caspar et al., 2018). HTS of the whole genome provides the potential to
      profile over a million STRs in the human genome. Recent advances in bioinformatics have
      brought us tools to analyse STRs from sequencing data (HTS), but genotyping still remains
      challenging for many reasons, including issues with extreme GC content, short read lengths
      that do not span over the entire repeat, and issues with alignment due to variation in STRs
      appearing as large insertions or deletions relative to the reference. In addition, using PCR
      amplification during library preparation will often cause stutter noise and produce artificial
      variability in the sequence (Gymrek, 2017; Caspar et al., 2018). Stutter noise is a result of in
      vitro slippage of DNA polymerase during PCR cycles that leads to erroneous reads of incorrect
      repeat length (Willems et al., 2014) which contributes to challenges in genotyping.

      Illumina has developed a method for amplification-free (PCR−) library preparation (Kozarewa
      et al., 2009) which theoretically eliminates the STR stutter error during PCR amplification in
      sample preparation (PCR+) and therefore improves the accuracy of STR genotyping. The
      developers of STR-FM evaluated the new protocol by running their tool in both PCR− and
      PCR+ samples and found that PCR− protocol compared to PCR+ has up to 9-fold fewer errors
      (Fungtammasan et al., 2015). However, huge amounts of sequencing data have already been

      2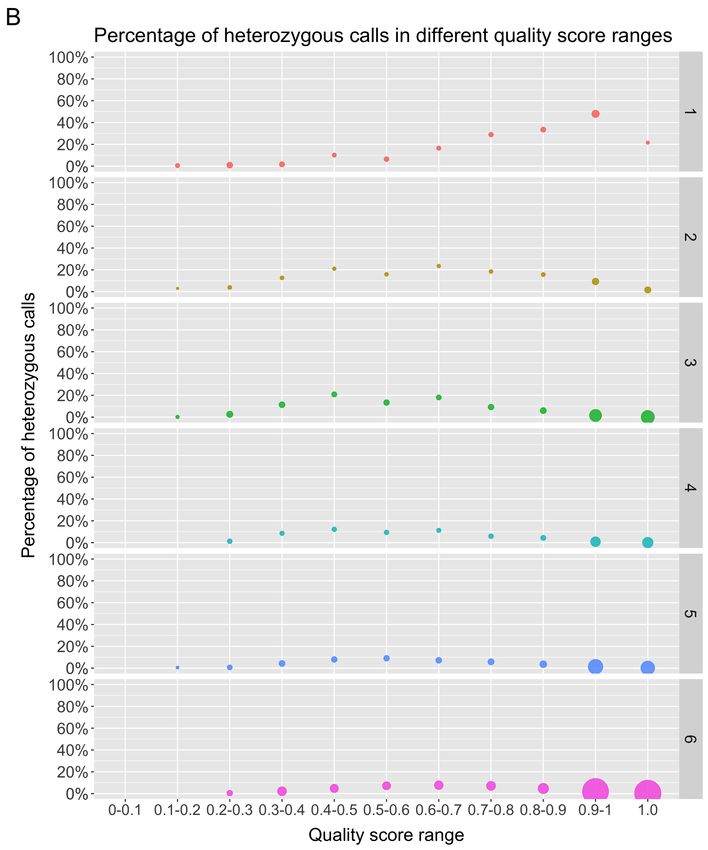
bioRxiv preprint doi: https://doi.org/10.1101/2020.02.03.933002. The copyright holder for this preprint (which was not peer-reviewed) is the
                              author/funder. It is made available under a CC-BY-NC-ND 4.0 International license.

      generated by using the PCR+ protocol where some data will not be resequenced due to time
      and/or cost (Fungtammasan et al., 2015). In addition, despite the advantages of whole genome
      sequencing (WGS), whole exome sequencing (WES) is still widely used in human genetics
      due to its lower cost and higher coverage and WES is a PCR+ process (Björn et al., 2018).
      Therefore, tools that can accurately genotype STRs not only from PCR− but also from PCR+
      data are essential.

      While there are a number of computational tools that have been developed to genotype STR
      alleles in HTS data there have been few independent comparisons of their performance.
      Evaluation of methods for genotyping STRs is difficult. The gold standard measurement of
      STRs is by capillary electrophoresis (Gymrek, 2016) but these methods have low throughput.
      Further evaluations have used Mendelian inheritance as a measure of accuracy (Gymrek et al.,
      2012; Highnam et al., 2013; Mousavi et al., 2019). Other studies have used simulated data for
      the evaluation of genotyping accuracy (Highnam et al., 2013; Fungtammasan et al., 2015).
      While simulation can generate many loci with known alleles it is difficult to simulate the true
      complexity of real data.

      Here we propose to compare and evaluate STR genotyping methods on exome data using a
      different but complementary approach. We used the natural hemizygous state of the X
      chromosomes in males to look for incorrect calls revealed by a heterozygous call. With repeats
      on the X chromosome in males there is only one allele so we expect all calls to be homozygous.
      While this approach does not evaluate the accuracy of the allele length it has advantages in that
      (a) the data sets are large so we can test thousands of calls (b) the data comes from real patients
      with all the noise and biases found in real data.

      In our study, we compared LobSTR (Gymrek et al., 2012), RepeatSeq (Highnam et al., 2013),
      HipSTR (Willems et al., 2017) and a recently published tool GangSTR (Mousavi et al., 2019).
      In addition, we included a common variant calling tool GATK HaplotypeCaller (McKenna et
      al., 2010) as a comparison of genotyping accuracy.

      There are a number of tools which have been developed for STR analysis and which were
      excluded from this analysis. For example, popSTR (Kristmundsdóttir et al., 2017) is a
      population based STR genotyper and optimised for whole genome sequencing (WGS) data.
      STRviper is another method for genotyping STRs that is able to pick up repeats longer than
      the read length, however, it has no built-in stutter model and it is not suitable for diploid dataset
      as it assumes only one allele (Cao et al., 2014). Galaxy environment has a STR analysis tool
                                                                                                 3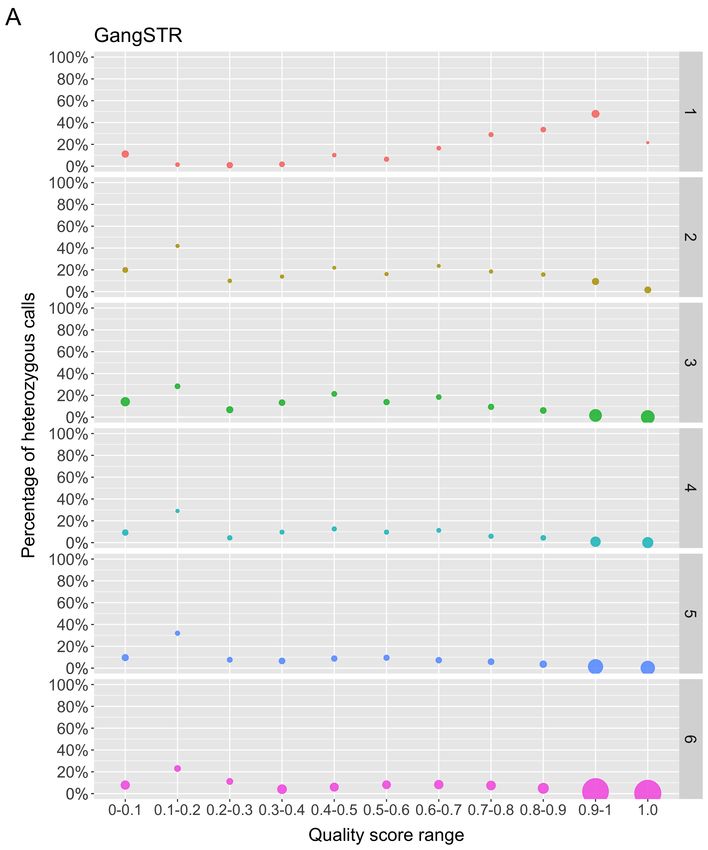
bioRxiv preprint doi: https://doi.org/10.1101/2020.02.03.933002. The copyright holder for this preprint (which was not peer-reviewed) is the
                              author/funder. It is made available under a CC-BY-NC-ND 4.0 International license.

      called STR-FM which we were unable to run (Fungtammasan et al., 2015). Dante (Budiš et al.,
      2019) and STRScan (Tang, Haixu et al., 2017) are designed for targeted searches and requires
      a user-defined list of STR loci.

      Tools such as Expansion Hunter (Dolzhenko et al., 2017; Dolzhenko et al., 2019),
      TREDPARSE (Tang, Haibao et al., 2017), STRetch (Dashnow et al., 2018) and exSTRa
      (Tankard et al., 2018) were excluded from our analysis as well because they are classified as
      tools which specifically look for expansions that might be disease causing and are often longer
      than the physical read length or expansion relative to a control set.

      Our analysis focuses on comparing the performance of STR genotyping tools on the X
      chromosome of more than 400 males. Using this data set we investigate the overall ability of
      tools to call genotypes, the accuracy as a function of coverage and repeat unit and also
      investigate quality scores of the tools. We find most tools are able to call a majority of
      homozygous alleles and different tools have different advantages in terms of repeat unit and
      coverage.

      Computational tools to genotype STRs from HTS data
      First, we will give a short overview of STR genotyping tools included in our analysis and their
      reported accuracy. The tools evaluated in our analysis are summarised in Table 1. All of the
      tools require a set of defined STR loci. Tandem Repeats Finder (TRF) is a tool that can be used
      to detect STRs that have two or more copies of the same repeat unit in a row in the reference
      genome (Benson, 1999). Also, it can detect repeats for which the repeat unit size is up to several
      hundreds of bp long. Running TRF generates a report which includes all the loci detected in
      the genome with genomic start and end location of the STR, repeat unit and its size, number of
      copies aligned with the consensus pattern and other relevant information. For this study we
      limited the loci defined by TRF to repeat units up to 6 bp (see Methods).

      4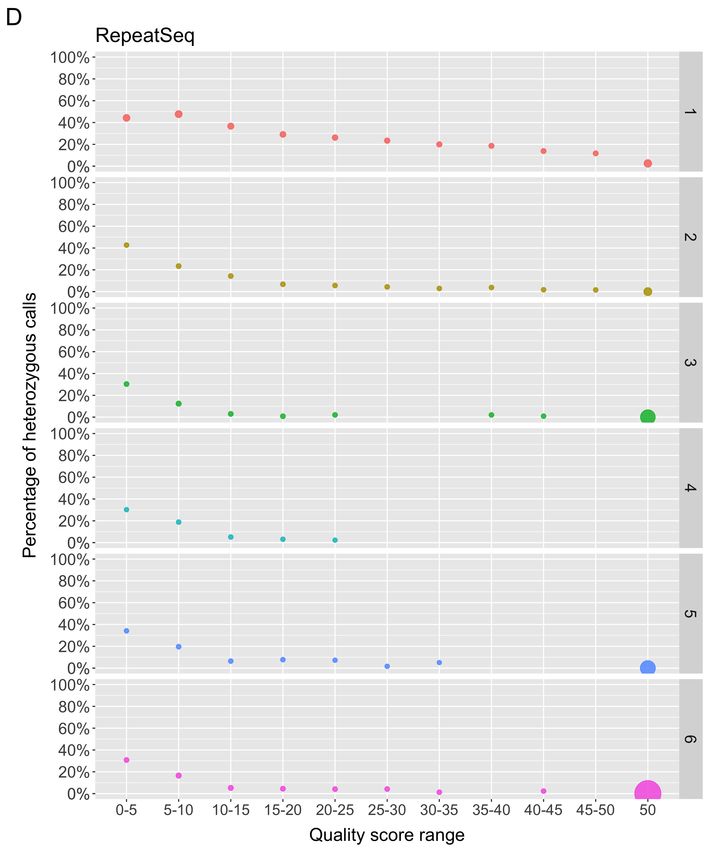
bioRxiv preprint doi: https://doi.org/10.1101/2020.02.03.933002. The copyright holder for this preprint (which was not peer-reviewed) is the
                              author/funder. It is made available under a CC-BY-NC-ND 4.0 International license.

      Table 1. Feature comparison of STR specific genotyping tools used in our analysis.

                                                       RepeatSeq             LobSTR               HipSTR              GangSTR

       Latest version of the tool used in              0.8.2 (2014)        4.0.6 (2016)         0.6.2 (2018)           2.4 (2019)
       this study

       Built-in stutter noise model                           ✓                   ✓                    ✓                     ✓

       Ability to detect STRs that are                        ✗                   ✗                    ✗                     ✓
       longer than the read length

       Input file types                                     BAM                BAM                  BAM                  BAM
                                                                              FASTA                CRAM                  CRAM
                                                                              FASTQ

       Sequencing read types                            Single- and         Single- and          Single- and           Paired-end
                                                        paired-end          paired-end           paired-end              reads
                                                           reads               reads                reads

      LobSTR
      LobSTR was one of the first successful STR genotyping tools for HTS data. It initially used its
      own inbuilt aligner but can also use data aligned with BWA-MEM (Li, 2013). LobSTR
      identifies reads that completely contain the STR and which also have flanking sequence with
      no repetitive sequence when aligned to a reference genome. As mentioned, PCR amplification
      during library preparation can create stutter noise at an STR locus, and LobSTR tackles this
      issue with an included stutter model that aims to detect and account for noise to improve
      genotyping accuracy. The stutter noise model can be custom generated from the data or use the
      standardised one supplied by the tool developers. As a result, LobSTR determines and reports
      the maximum likelihood estimates of the genotype in each locus. (Gymrek et al., 2012)

      LobSTR was validated using concordance of biological replicates (blood and saliva samples)
      from the same subject to measure the precision of the tool. At 21x coverage the discordance
      rate for genotype was 3% and for allelotype 2%. While for lower, 5x coverage the discordance
      rate for genotype was 11% and for allelotype 5%. STR length differences were analysed in
      discordant calls that were heterozygous in both blood and saliva samples and found that at
      coverage 5x or higher, 90% of the errors were one repeat unit difference and 99% of errors
      were in 2 bp repeat unit size. (Gymrek et al., 2012) However, it is important to note that
      LobSTR validated 2-6 bp repeat unit size STRs and did not validate homopolymers (Gymrek
      et al., 2012), which are common in the genome and a known source of genetic variation
      (Highnam et al., 2013).

                                                                                                                                     5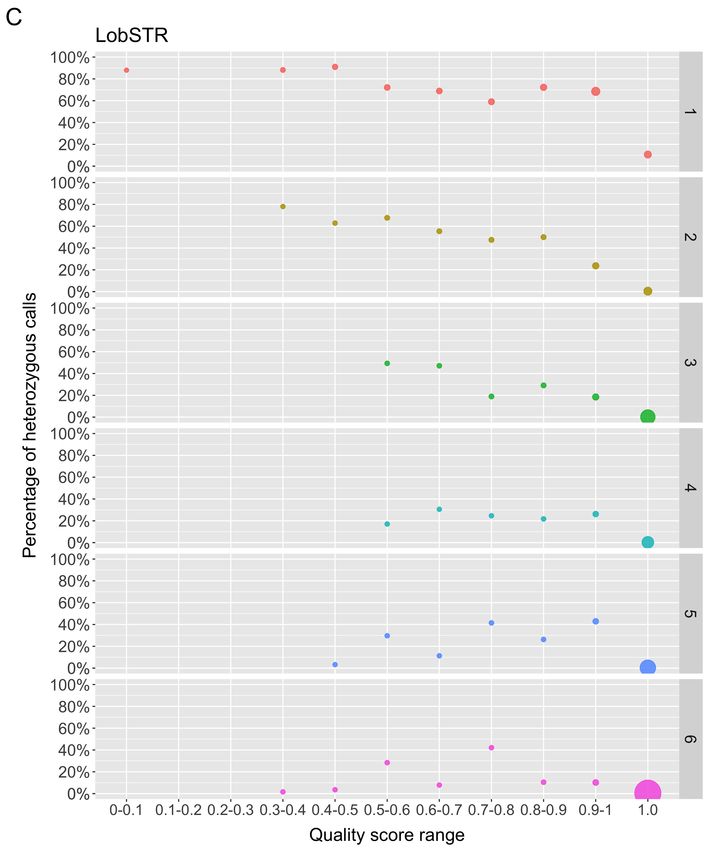
bioRxiv preprint doi: https://doi.org/10.1101/2020.02.03.933002. The copyright holder for this preprint (which was not peer-reviewed) is the
                              author/funder. It is made available under a CC-BY-NC-ND 4.0 International license.

      RepeatSeq
      RepeatSeq (Highnam et al., 2013) uses data aligned by external tool, such as BWA or Bowtie.
      It uses Bayesian model selection to determine the most probable genotype and requires all
      reads to fully contain STRs and at least two reads at a locus to make a call. The RepeatSeq
      noise model is based on genomes derived from over 100 inbred isolates of fly.

      RepeatSeq's accuracy was evaluated by analysing a trio WGS data to test consistency with
      Mendelian inheritance. The authors reported that on minimum coverage of two, 92.1% of
      repeat calls were consistent with the Mendelian inheritance, while with a minimum coverage
      of 9 it was 95.3% and on minimum coverage of 17 it was 98.0%. (Highnam et al., 2013)

      GangSTR
      One of the major drawbacks of the first series of STR profiling methods was that they were
      limited to genotyping repeats within the read length in HTS data. GangSTR (Mousavi et al.,
      2019) is a more recent method that incorporates additional information besides repeat-
      enclosing reads to estimate the length of repeats. This includes available information such as
      fragment length, coverage and information about partially enclosing reads where only one end
      contains flanking sequence. More specifically, reads are divided into four classes: 1) enclosing
      read pairs that have at least one read which includes the whole STR and a flanking region in
      both ends; 2) spanning read pairs that have a mate pair where one read is aligned to one side
      of the STR and the second read of the pair on the other side; 3) flanking read pairs includes a
      read which partially extends into the STR region; 4) fully repetitive read pairs have one or two
      reads which are entirely made of STR (Mousavi et al., 2019). These four classes of reads are
      used to not only genotype repeats less than the read length but can also be used to genotype
      longer alleles such as repeat expansions.

      The GangSTR method was evaluated by first simulating paired-end 150 bp reads (40x
      coverage) for 14 repeat expansions involved in STR disorders. Tool accuracy was measured
      by comparing true and observed alleles and also compared to TREDPARSE and
      ExpansionHunter. In this evaluation GangSTR showed lower root mean square error (RMSE)
      rate between true and observed allele lengths for all tested repeats. The authors demonstrated
      that GangSTR had an advantage over ExpansionHunter and TREADPARSE, especially in
      alleles which were close to the read length or longer. Also, GangSTR and ExpansionHunter
      improved significantly with higher coverage and longer read length.

      6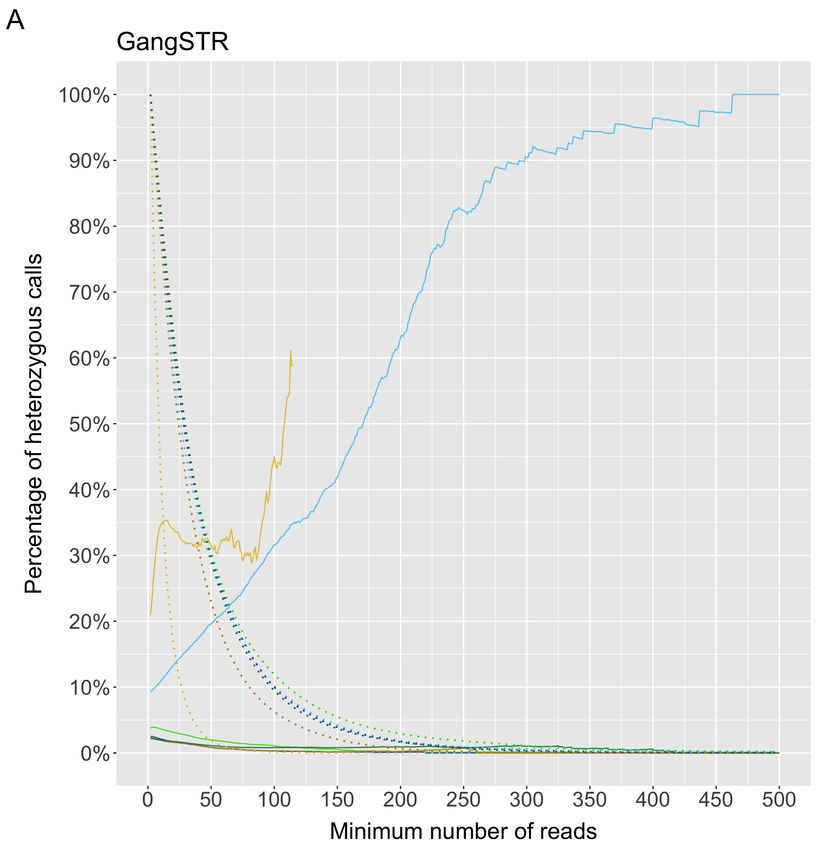
bioRxiv preprint doi: https://doi.org/10.1101/2020.02.03.933002. The copyright holder for this preprint (which was not peer-reviewed) is the
                              author/funder. It is made available under a CC-BY-NC-ND 4.0 International license.

      GangSTR genotyping for disease causing alleles was also tested on validated 14 Huntington's
      Disease and 25 Fragile X Syndrome real PCR-free WGS data and they reported of RMSE (7.9
      and 29.3, respectively) that was lower than for TREDPARSE (8.3 and 34.8, respectively) and
      ExpansionHunter (10.1 and 27.3, respectively). In evaluations of genotyping a WGS trio,
      GangSTR was found to have similar performance to HipSTR for shorter alleles. (Mousavi et
      al., 2019)

      HipSTR
      HipSTR (Willems et al., 2017) is a haplotype-based method for genotyping, haplotyping and
      phasing STRs. While other STR tools are made for finding true length of repeats independently
      along the genome, HipSTR takes into account the whole repeat structure on the allele which
      may also have missing data. HipSTR accuracy was tested by comparing calls from 118 PCR−
      WGS samples to capillary electrophoresis data, reporting about 98.8% consistency between
      the two datasets. (Willems et al., 2017)

      GATK HaplotypeCaller
      GATK HaplotypeCaller (GATK-HC) (McKenna et al., 2010) can also be used for finding
      SNPs and indels in repeat regions, but it is not specifically made for STR analysis. It has been
      widely documented that indel calling is not as accurate as SNP calling and indel callers are not
      ideal for identifying STR mutation due to the lack of reporting repeat genotypes. Instead, indel
      callers report insertions or deletions of bases relative to the reference which may or may not be
      a multiple of the repeat unit as well as including SNP differences. Dedicated STR callers
      however use information about the repeat unit, composition and repeat length in order to make
      more accurate genotype calls. (Highnam et al., 2013)

                                                                                                                                     7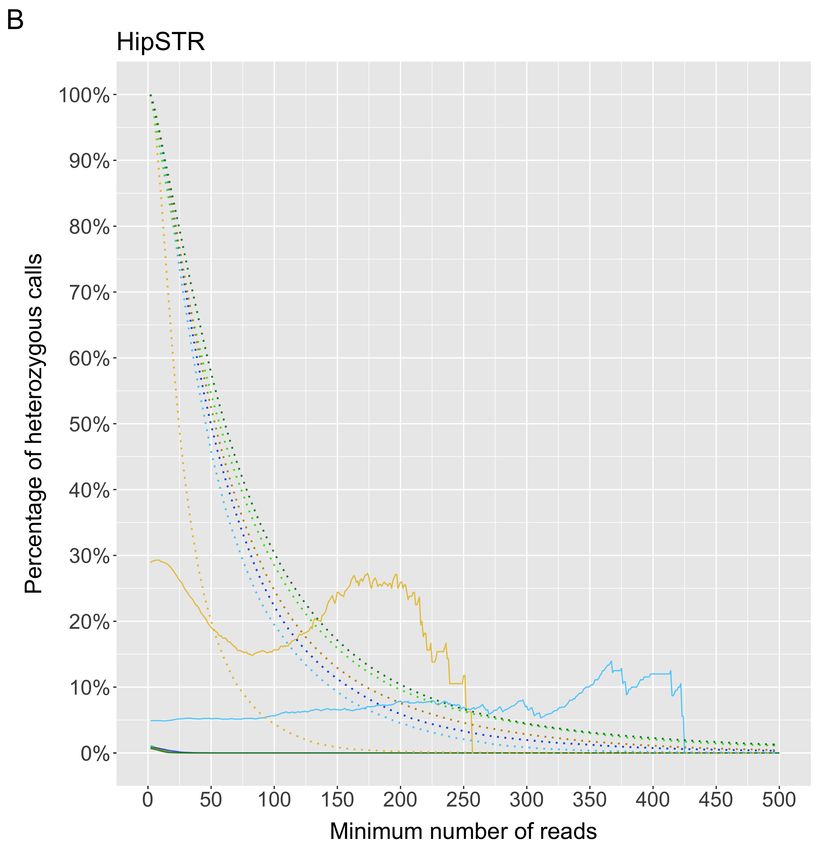
bioRxiv preprint doi: https://doi.org/10.1101/2020.02.03.933002. The copyright holder for this preprint (which was not peer-reviewed) is the
                              author/funder. It is made available under a CC-BY-NC-ND 4.0 International license.

      Results

      In order to evaluate the accuracy and performance of STR genotyping methods we used a novel
      evaluation approach applied to exome sequencing data of more than 430 individuals. Several
      previous comparisons determined accuracy by comparing the estimated lengths of repeats to a
      known truth determined from either simulations or alternative assays such as PCR. Here we
      took only male individuals and looked at the heterozygosity of the calls only on the X
      chromosome. As there is only one X chromosome in males a method that reported only
      homozygous calls was defined to be more accurate than those that reported heterozygous calls.

      Dataset
      We began with a dataset of 472 males from the Simons Simplex Collection. We had to remove
      39 samples for a variety of reasons: 6 samples were not sequenced with a paired end approach,
      3 samples had no coverage on the chromosome Y so were assumed to be females mislabelled
      as males, 28 samples produced an error in GangSTR and 2 samples could not be aligned to the
      reference genome by BWA due to a software error. The remaining 433 samples
      (Supplementary Table 1) were analysed with LobSTR (Gymrek et al., 2012), RepeatSeq
      (Highnam et al., 2013), HipSTR (Willems et al., 2017) and GangSTR (Mousavi et al., 2019)
      (see methods). In addition, variant calling was performed using the GATK best practices
      pipeline.

      In brief, the FASTQ files were mapped using BWA-MEM (Li, 2013) and the same BAM files
      were used as the starting point for running each STR calling method. Each method requires a
      set of intervals that define repeats to be genotyped. To generate this, we used Tandem Repeats
      Finder (Benson, 1999) to locate tandem repeats in the hg19 reference genome and detected
      224774 STR loci in the X chromosome. Because we are using exome data, we only analysed
      calls in the 6860 capture regions on the X chromosome. In total, we found 2322 STR loci
      overlapping the capture regions (Figure 1A) where almost 60% of loci consist of 6 bp repeat
      units (Figure 1B). In our full data set across the 433 individuals we have over a million STR
      loci for analysis.

      8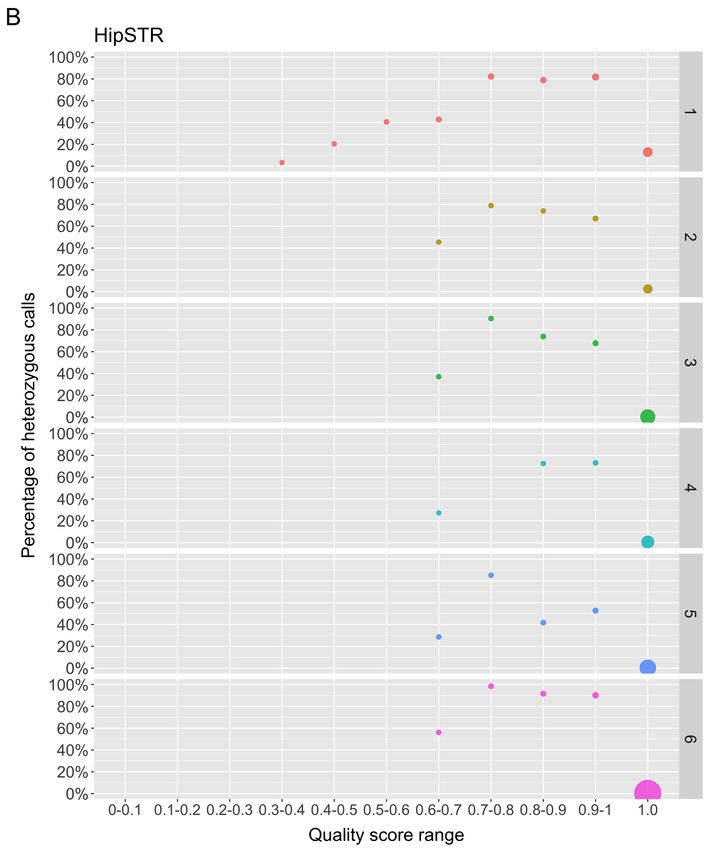
bioRxiv preprint doi: https://doi.org/10.1101/2020.02.03.933002. The copyright holder for this preprint (which was not peer-reviewed) is the
                              author/funder. It is made available under a CC-BY-NC-ND 4.0 International license.

      Figure 1. (A) Number of STR loci defined by TRF and number of regions in the capture regions of the X
      chromosome. Overlapping regions include all STR loci that are completely or partially overlapping the target
      region. Total number of STRs found in target regions is 2322. (B) Distribution of all repeat unit sizes in
      overlapping regions (2322).

      First, we looked the ability of a method to make a call at any given locus in the capture regions.
      By looking at the total number for calls on the X chromosome for each method we found that
      LobSTR reported the highest number of loci (Figure 2A). However, the number reported for
      each individual was variable. Figure 2B shows the distribution of the number of reported loci
      per individual with the highest median number of calls by LobSTR (2015), outperforming
      GangSTR (1967), RepeatSeq (1847) and HipSTR (1834). GATK-HC reported a median of 11
      loci per individual but rather than genotyping all loci GATK only makes a report when it deems
      there is a difference from the reference genome. Out of the 2322 loci we investigated there
      were 23 loci for which reference STR length was longer than the read length (this does not
      necessarily mean that the allele length is longer). Out of these 23 loci, genotypes for 6 loci
      were not reported by any tool in any individual. For the remaining 17 loci, all of them were
      reported by GangSTR in some individuals and 4 of them were genotyped by other tools as well.
      We also found another 13 loci were not detected by any of the tools in any of the individuals.

                                                                                                                                     9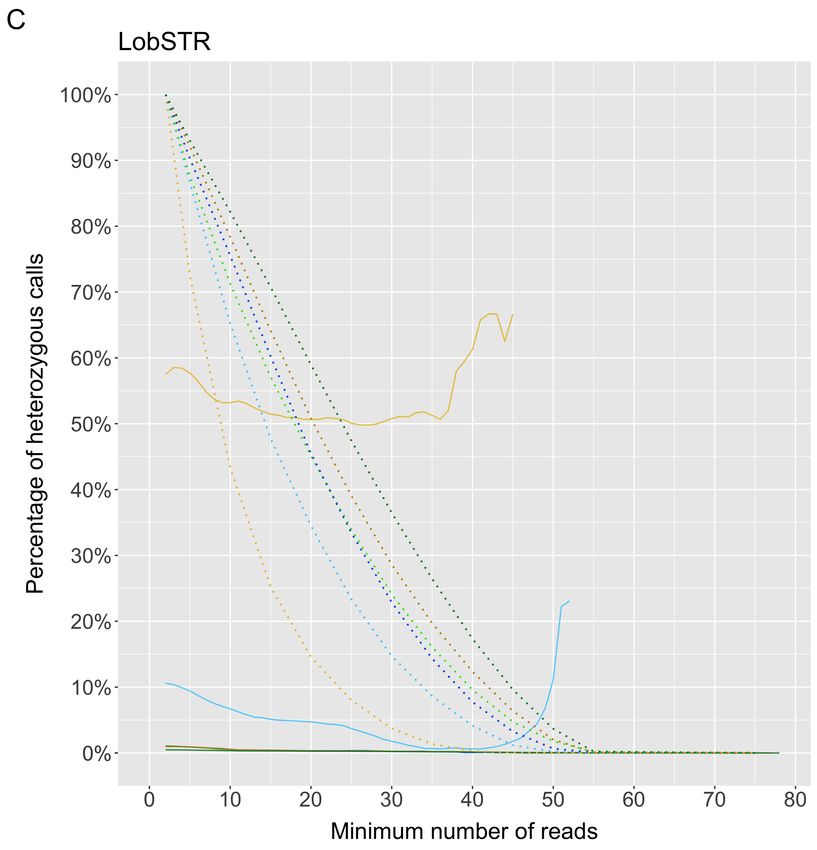
bioRxiv preprint doi: https://doi.org/10.1101/2020.02.03.933002. The copyright holder for this preprint (which was not peer-reviewed) is the
author/funder. It is made available under a CC-BY-NC-ND 4.0 International license.
Figure 2. (A) Total number of calls on the X chromosome over all 433 samples made by each tool. (B) Number of
calls made per sample by each tool out of a possible 2322.
GATK-HC only makes calls at positions where there is evidence that the allele is different from
reference. In this dataset GATK-HC made calls in total of 346 (14.9%) different loci and 21.4%
of these were heterozygous giving a minimum overall heterozygous rate of 3.1% assuming all
uncalled positions are homozygous. No call either means the allele is homozygous reference
or there is not enough data to make a call. This is one reason why specialised STR callers are
better suited for genotyping STR loci.
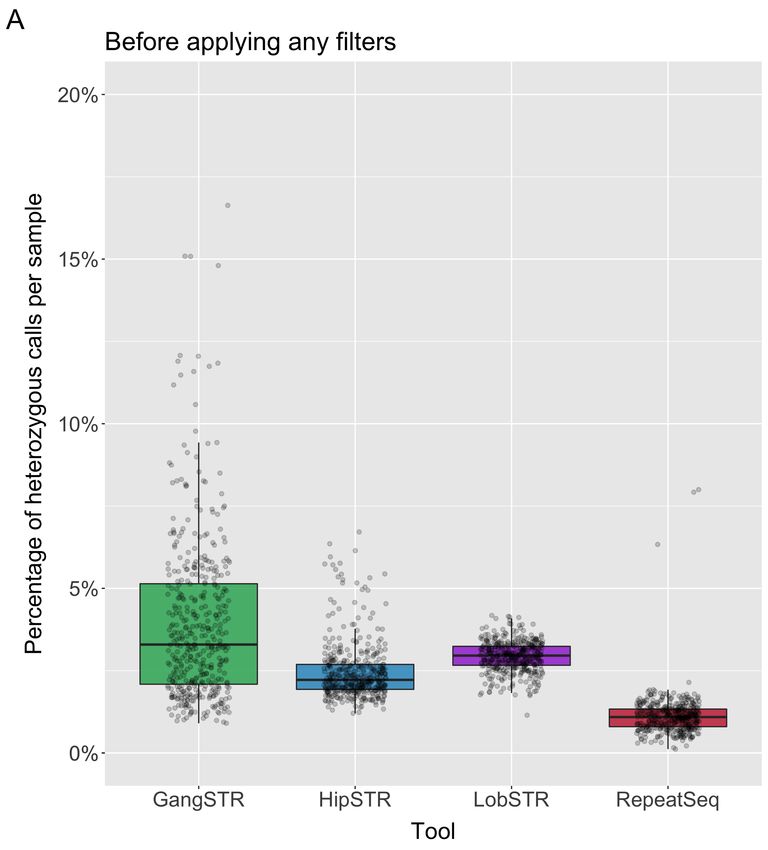
To determine the genotyping accuracy of the four specialised STR callers, we first looked at
the overall percentage heterozygous calls to estimate the error rate for each method. Overall,
RepeatSeq had the lowest median error rate with 8675 (1.09%) of its calls being heterozygous.
Next was HipSTR with 19459 (2.23%), LobSTR 27410 (2.96%) and GangSTR 33204 (3.29%).
Again, error rates were variable across individual samples ranging between 0% and 47.3%.
RepeatSeq, HipSTR and LobSTR are generally consistent with 3 samples outliers with respect
to error rate while GangSTR has higher variability in error rates across samples
(Supplementary Figure 2). Interestingly, for these three samples the heterozygous percentage
increased for LobSTR after the strict filtering. All tools except RepeatSeq recommend filtering
the outputs based on quality metrics of the calls (see Methods for details on filtering parameters
that were used). Once the recommended filters are applied, we found that the performance of
GangSTR improved by 2.76% to 0.53%, HipSTR by 2.14% to 0.09% and LobSTR by 1.32%
10bioRxiv preprint doi: https://doi.org/10.1101/2020.02.03.933002. The copyright holder for this preprint (which was not peer-reviewed) is the
author/funder. It is made available under a CC-BY-NC-ND 4.0 International license.
to 1.64% (Figure 3). However, the median number of calls per sample dropped for LobSTR by
201, HipSTR by 1462 loci and GangSTR by 1512.
Figure 3. (A) Percentage of heterozygous calls over all samples (each dot is a sample) - no filters applied. (B)
Percentage of heterozygous calls over all samples after applied the strictest recommended filters for the tools.
Since no filters were recommended for RepeatSeq then it has the same values on both plots.
The recommended filters for each tool were different (for instance, minimum coverage of 100
for HipSTR and 50 for GangSTR) and therefore we next decided to analyse the effect of these
filtering parameters separately.
Effects of repeat unit and coverage on accuracy
We investigated the number of heterozygous calls as a function of the repeat unit length ranging
from 1 to 6 bp. We found that all tools exhibit high error rates for 1 bp repeats, which is not
surprising as it is difficult to genotype homopolymers due to higher rates of polymerase
slippage events. More surprisingly, 2 bp repeats were poorly genotyped by HipSTR, LobSTR
and GangSTR and the best results were obtained with RepeatSeq. All other repeat unit lengths
produced much more accurate genotypes.
To investigate the effect of coverage and quality scores on results we applied call-level filters
on our data according to developers' recommendations to get two different datasets: low
filtering where we included all suggested filters except coverage and quality scores and strict
filters where we also included filters for coverage and quality scores. Then, we looked at the
11bioRxiv preprint doi: https://doi.org/10.1101/2020.02.03.933002. The copyright holder for this preprint (which was not peer-reviewed) is the
author/funder. It is made available under a CC-BY-NC-ND 4.0 International license.
effects of coverage and plotted the error rate as well as percentage of remaining number of
calls as a function of the minimum number of reads supporting the call. We expected the error
rate to drop as coverage increased and this was the case for 3, 4, 5 and 6 bp repeat units.
However, mono- and dinucleotide repeats did not follow a consistent pattern and the pattern
was different between tools. While dinucleotide repeats showed a trend towards lower error
rate with increasing coverage for RepeatSeq and LobSTR the trend increased for GangSTR
(Figure 4).
Two call-level filters are recommended for GangSTR: level 1 that requires filtering out calls
that have less than 20 reads and level 2 filters that requires at least 50 reads to support a call.
Filtering out all calls with coverage of less than 20 reads brings the heterozygous error rate for
the 3-6 bp repeats to between 1.6 and 3.1% at this minimum coverage. Filtering out calls with
less than 50 reads improves the error rate even further to 0.83-1.97%. However, by filtering
out calls with coverage less than 20 we lose on average 39.4% of 2-6 bp repeats data with a
median of 1120 loci reported per sample. By filtering out calls with coverage less than 50 we
lose on average 71.7% of 2-6 bp repeats data and have a median of 464 loci reported.
Interestingly we see an increase of error rate as the function of coverage genotyping 2 bp STRs
(Figure 4A). Unlike the other tools where heterozygous percentage decreases when coverage
increases and remains relatively steady, GangSTR is not so consistent and fluctuates around
1%.
HipSTR excludes calls that have coverage less than 100 by default unless specified otherwise.
This coverage gives high accuracy but also filters out 75.9% of data. We investigated reducing
the minimum coverage and found HipSTR has excellent accuracy even with minimum
coverage of 25: 0.02-0.04% heterozygous rate for 3, 5 and 6 bp and 0.16% for 4 bp repeats
(Figure 4B). In addition, a minimum coverage of 50 improves results even more and the
maximum error rate for these repeats is 0.01% at this minimum coverage (median of 899 calls
per sample). HipSTR also struggles to genotype 2 bp repeats, having a heterozygous error rate
around 5.2% for coverage of both 25 and 50. Therefore, by decreasing the filtering parameters
for coverage to only exclude the calls less than 25x coverage we retain on average 76.6% of
data for 2-6 bp repeat units with a moderate call rate (median of 1369 calls per sample).
LobSTR recommends to filter out calls with coverage less than 5 which gives us heterozygous
percentage for 3-6 bp repeat units at this minimum coverage 0.44-0.90% per repeat unit length.
This filters out on average 10.0% of calls for 2-6 bp repeats, giving a median of 1840 reported
12bioRxiv preprint doi: https://doi.org/10.1101/2020.02.03.933002. The copyright holder for this preprint (which was not peer-reviewed) is the
author/funder. It is made available under a CC-BY-NC-ND 4.0 International license.
alleles per sample. The accuracy for these repeats increases as a function of coverage and
considering the amount of calls which are filtered out, a minimum coverage of 5-10 might be
the best compromise. By filtering out calls less than coverage of 10 the heterozygous error rate
at this minimum coverage is 0.55% 4 bp and 5 bp repeats, 0.48% for 3 bp repeats and 0.36%
for 6 bp repeats, while still retaining 74.5% of calls on average for 2-6 bp repeats (median of
1555 calls per sample). Increasing the minimum coverage to 20 reads would improve our
results by a further 0.2% but also filter out significantly more calls. For dinucleotide repeats
accuracy seems to get better with higher coverage and reaches 1% error rate when the minimum
coverage is 33, however, the error rate increases again when coverage increases over 42 (Figure
4C).
Authors of RepeatSeq do not recommend any additional filtering and we found high accuracy
even at low coverage. Filtering out all calls less than coverage of 5 will result in error rate for
3-6 bp repeat units 0.04-0.08% and only an average 7.1% of 2-6 bp repeat calls filtered out
leaving an average of 1728 reported calls per sample. Among all tools, RepeatSeq shows the
best accuracy for dinucleotides, having an error rate no more than 1.81% (Figure 4D).
13bioRxiv preprint doi: https://doi.org/10.1101/2020.02.03.933002. The copyright holder for this preprint (which was not peer-reviewed) is the
author/funder. It is made available under a CC-BY-NC-ND 4.0 International license.
1bp
2bp
3bp
4bp
5bp
6bp
Figure 4. Percentage of heterozygous calls as a function of minimum number of reads. (A) GangSTR, (B) HipSTR,
(C) LobSTR, (D) RepeatSeq. Solid line shows the percentage of heterozygous calls as a function of minimum
number of reads. Dotted line represents the percentage of remaining calls as a function of minimum number of
reads. Y-axis limited to 500 reads. Heterozygous calls are represented in percentages, but the total number of calls
is different for each tool, where 100% is 796775 calls for GangSTR, 757432 calls for HipSTR, 848252 calls for
LobSTR and 775030 calls for RepeatSeq.
As mentioned, we saw unusually high error rate for dinucleotide repeats in nearly all tools so
we examined these repeats in more detail. Curiously, we found that in GangSTR and LobSTR
the unusually high error rate of 2 bp repeats due to AC/TG repeats while other repeat units do
not exhibit these characteristics (Figure 5). The same pattern was observed for RepeatSeq but
at lower error rates. This information is not easily available for HipSTR as it does not report
the repeat unit.
14bioRxiv preprint doi: https://doi.org/10.1101/2020.02.03.933002. The copyright holder for this preprint (which was not peer-reviewed) is the
author/funder. It is made available under a CC-BY-NC-ND 4.0 International license.
Figure 5. Percentage of heterozygous calls as a function of minimum number of reads for dinucleotide repeats,
divided by the three possible repeat unit sequences. (A) GangSTR, (B) LobSTR, (C) RepeatSeq.
Effects of repeat unit and quality scores on accuracy
Besides coverage, the second parameter which is commonly used for filtering in all tools is the
call quality or quality score produced by each algorithm. We next investigated the effects of
quality scores on the accuracy by relaxing the coverage filtering and looking at the quality
scores in different bins across the score range (Figure 6). GangSTR's level 2 filters recommends
to filter out calls which have quality less than 0.9. We see on Figure 6A that the heterozygous
error rate fluctuates at lower scores and starts to decrease from quality scores above 0.6 for all
repeats except for homopolymers. We reach a 1% heterozygous error rate when excluding calls
that have quality scores below 0.81 for 3 bp repeat units, 0.66 for 4 bp units, 0.77 for 5 bp units
and 0.93 for 6 bp repeat units. We see the lowest heterozygous error rate at the quality score of
1.0 but we also determined a sharp drop in the number of reported genotypes after excluding
15bioRxiv preprint doi: https://doi.org/10.1101/2020.02.03.933002. The copyright holder for this preprint (which was not peer-reviewed) is the
author/funder. It is made available under a CC-BY-NC-ND 4.0 International license.
calls with quality scores below 1.0 and we also lose 61.7% of 3-6 bp repeats data on average.
The recommended 0.9 seems a reasonable suggestion for balancing the accuracy with how
much data we will have left after the filtering. We can also see that accuracy of 1 bp repeat
calls are improving with the highest quality score (1.0) and a stronger filter for these repeat
unit may be appropriate.
HipSTR, similarly to GangSTR, recommends to filter out calls with quality score less than 0.9.
On Figure 6B we can see that on average the calls below the 1.0 have high heterozygous error
rate and keeping only the ones with the highest quality score will improve overall accuracy.
Indeed, 98.5% of calls have quality score of 1.0 and therefore we only lose a fraction of data
while filtering out calls less than quality score of 1.0, which may be a good trade-off.
LobSTR recommends to filter out calls with call quality score less than 0.8. As seen on Figure
6C heterozygous error rate fluctuates but generally shows more accuracy with higher quality
scores for 1-3 bp repeats, while for 4-6 bp there is no clear trend below quality score of 0.9.
There is no significant improvement in overall accuracy when we remove calls with quality
scores less than 0.8, or even 0.9, which might be due to the fact that, similar to HipSTR, the
majority of calls (94.3%) have quality score of 1.0. We do see improvement while only leaving
calls with quality of 1.0 particularly in 1-2 bp repeat units which shows utility in filtering out
the least accurate calls and since the majority of data has quality score of 1.0 this filtering could
be a good choice, as also suggested for HipSTR (see Supplementary Figure 3).
RepeatSeq does not recommend any filtering and reports quality scores on a Phred scale
(Figure 6D). We determined that filtering out calls with Phred quality score of 10 or less
improves the accuracy of all repeat units. Accuracy of genotyping mono- and dinucleotide
repeats continues to improve as a function of Phred scores while the best accuracy is observed
at the highest quality score. On the flip side, the number of calls also decreases, and at the
highest Phred scores, we are left with 31.6% of homopolymers and 87.8% of dinucleotide
repeats. However, it only filters out 1.2% of 3-6 bp repeats data. Overall, filtering data based
on the quality scores may be reasonable if looking at mono- or dinucleotide repeats and
accuracy is an important factor.
16bioRxiv preprint doi: https://doi.org/10.1101/2020.02.03.933002. The copyright holder for this preprint (which was not peer-reviewed) is the
author/funder. It is made available under a CC-BY-NC-ND 4.0 International license.
Figure 6. Percentage of heterozygous calls in different bins of quality score separated by each repeat unit length.
(A) GangSTR, (B) HipSTR, (C) LobSTR, (D) RepeatSeq. Each bin is from marked range (inclusive) to the end
value (exclusive), except the last one. Dot size represents the number of calls in that range of the repeat unit length
(rows).
17bioRxiv preprint doi: https://doi.org/10.1101/2020.02.03.933002. The copyright holder for this preprint (which was not peer-reviewed) is the
author/funder. It is made available under a CC-BY-NC-ND 4.0 International license.
Accuracy of GangSTR by looking at only the enclosing class of reads
LobSTR, HipSTR and RepeatSeq are using types of reads where the STR region has to be
completely in the read. However, GangSTR uses more classes of reads that may give rise false
positives. Therefore to make a more direct comparison we decided to look at GangSTR results
where we filtered out all other classes of reads besides the enclosing ones, marked here as
GangSTR (enc.). Compared to the previous GangSTR results we now see a lower error rates
for all repeat units as well as no substantial fluctuation on higher coverage that was apparent
previously on Figure 4A. At the coverage of 20, GangSTR (enc.) has heterozygous error rate
0.53-0.99% for 3-6 bp repeats while 58.6% of 2-6 bp repeats data is filtered out, and with a
median of 699 calls per sample (Figure 7A). When we increase the minimum number of reads
to 50 we can see even further improvement, 0.01-0.27% error rate for 3-6 bp repeats, however,
also filtering out 86.3% of 2-6 bp repeats data (median of 152 calls per sample).
We also looked at the dinucleotides separately (see Supplementary Figure 4) and found that it
is considerably lower compared to results of GangSTR. However, we determined that AC/TG
repeats still have a higher error rate compared to other repeat units (Figure 4A and Figure 7A).
Results of quality scores are quite similar to the GangSTR's where we see improvements at
high quality scores (Figure 7B).
18bioRxiv preprint doi: https://doi.org/10.1101/2020.02.03.933002. The copyright holder for this preprint (which was not peer-reviewed) is the
author/funder. It is made available under a CC-BY-NC-ND 4.0 International license.
1bp
2bp
3bp
4bp
5bp
6bp
Figure 7. (A) Percentage of heterozygous calls as a function of minimum number of reads. Solid line represents
the percentage of heterozygous calls as a function of minimum number of reads or quality score and dotted line
the percentage of remaining calls as a function of minimum number of reads or quality score. (B) Percentage of
heterozygous calls in different ranges of quality scores. Each bin is from marked range (inclusive) to the end value
(exclusive), except the last one. Dot size represents the number of calls in that range of the repeat unit length
(rows).
Run time of tools
Finally, we benchmarked all tools to determine their average running time. We ran each tool
genome wide by using 1, 2, 4 and 8 cores and determined that only RepeatSeq is supporting
multithreading, which allows the tool to run faster when utilising more processor cores. In
particular, we saw that for samples that have coverage on target regions around 90x, the average
running time on 1 core for LobSTR was 9 min 31 sec giving it a clear advantage compared
with, HipSTR at 1 h 22 min, GangSTR at 3 h 4 min and RepeatSeq 2 h 58 min. By utilizing
more cores, LobSTR's and GangSTR's and HipSTR's running time remained the same, while
RepeatSeq's time improved.
19bioRxiv preprint doi: https://doi.org/10.1101/2020.02.03.933002. The copyright holder for this preprint (which was not peer-reviewed) is the
author/funder. It is made available under a CC-BY-NC-ND 4.0 International license.
Discussion
We used a novel way of evaluating the error in short tandem repeats genotyping methods where
we analysed STR calls on the X chromosome of male samples. Because this is a hemizygous
chromosome we determined a relative error rate as the rate of heterozygous genotypes. We
performed this evaluation on a human exome dataset of 433 samples resulting in the evaluation
of more than a million STR loci. Exome sequencing is widely used, but the PCR step in library
preparation causes a challenge to STR genotyping tools due to the interference of stutter noise.
This is the first independent evaluation of these STR genotyping tools that we are aware of.
Many of the tools do not claim to be able to accurately genotype homopolymers and we found
that indeed all tools had difficulty with these repeats resulting in a high error rate. There was
also no clear correlation between minimum coverage and accuracy of genotyping
homopolymers, but using the highest quality scores did improve the accuracy. Interestingly,
most tools produced high error rates for genotyping dinucleotides as well, which we later found
to be mainly caused by AC/TG repeat units. One who analyses dinucleotide repeats with these
tools should be aware of the differences in accuracy of genotyping different repeat units and
carefully interpret the results of AC/TG repeat units. Repeat units with length of 3-6 bp were
all relatively accurate and similar across tools with only minor differences. However,
genotyping was slightly less accurate for 3 bp length repeats in low coverage and low quality
scores, but differences were reduced with proper filtering. We found that LobSTR was able to
report the highest number of genotypes at a heterozygous error rate of less than 1%.
There are certain filtering parameters suggested for each tool and we examined the effects of
coverage and quality scores across all tools. However, some tools have further parameters that
could be explored that were not part of our investigation. In general, we found that higher
quality scores increased the accuracy of results at the cost of losing some potentially accurate
calls. The relationship with coverage was more complex but some coverage filtering improved
results for all tools. Which parameters to use depends on the aim of the analysis. For example,
more calls may be desirable to begin a screen, or more accuracy may be desirable if selecting
potential disease associated loci. When one does an exploratory analysis to find potential loci
of interest that can be followed up with alternative methods then lowering filtering parameters
for coverage and quality scores for certain tools could be a good approach as it leaves us with
larger portion of data. We found that even in exome data we can use these tools to genotype
tens of thousands of loci.
20bioRxiv preprint doi: https://doi.org/10.1101/2020.02.03.933002. The copyright holder for this preprint (which was not peer-reviewed) is the
author/funder. It is made available under a CC-BY-NC-ND 4.0 International license.
Unlike the other tools we used in this analysis, GangSTR is utilising four different types of
reads which can help to pick up the locus other tools cannot (such as those longer than the read
length). However, these can also produce genotyping errors. In our analysis, we first looked at
GangSTR results that included all four classes of reads and then we excluded all calls where
only spanning or bounding class of reads were present, as suggested by the tool authors. This
filtering increased the genotyping accuracy of the tool (we also looked at the results where we
skipped this filtering parameter but this did not improve results). Still, compared to other tools,
GangSTR showed higher error rate. Finally, we decided to look at only enclosing class of reads
such as the other tools are doing and determined around three times lower error rate at 20x and
bigger gains on higher coverage. On the other hand, that change will result in losing the ability
to genotype alleles longer than the read length that is GangSTR's important addition. We also
found that HipSTR has a very high accuracy for 3-6 bp repeats when coverage is at least 50x.
Excellent accuracy was also found in RepeatSeq in very low coverage and genotyping
dinucleotides were the most accurate among the tools. In addition, RepeatSeq is the only tool
that supports multithreading and therefore can run faster by allocating more cores.
Here we have presented one way of performing an evaluation and this approach does not look
at accuracy of the estimated allele length which is a limitation of the study. In addition, it is
difficult to rule out a bias towards tools that default to genotyping an allele as a homozygous
reference by the software. Our comparisons were specifically analysing the exome dataset that
was PCR amplified where a tools' noise model may play an important role. Therefore, tools
may perform differently when we will analyse PCR-free WGS dataset.
In conclusion, all these tools are built to genotype STRs but have different strengths and
weaknesses. Based on our analysis there is no clear overall winner. RepeatSeq and HipSTR
are the best when considering genotyping error rate even with low coverage. On the other hand,
GangSTR has an advantage because it is the only tool among them that can call alleles longer
than the read length but shows higher error rate unless looking at only the enclosed class of
reads, which in turn would lose the GangSTR's advantage of picking up long genotypes. In
addition, GangSTR is the newest tool and so comes with reference files for different reference
builds that are periodically updated according to the tool's webpage. The correct choice of a
tool and the subsequent filtering depends on the aim of the analysis, and might be influenced
by available hardware resources and time limit for running tools.
21bioRxiv preprint doi: https://doi.org/10.1101/2020.02.03.933002. The copyright holder for this preprint (which was not peer-reviewed) is the
author/funder. It is made available under a CC-BY-NC-ND 4.0 International license.
Methods
In order to compare all STR tools, we ran each one of them on the same dataset. We used the
data from the publicly available Simons Simplex Collection (SSC) for our analysis.
Samples' genomic DNA was extracted from whole blood. Exomes were captured with
NimbleGen EZ Exome v2.0 (Roche Nimblegen, Inc., Madison, WI) reagents and sequenced
using Illumina (San Diego, CA) GAIIx (N = 271) or HiSeq 2000 (N = 162) at the Yale
University School of Medicine.
All SRA files were downloaded from NCBI and converted to FASTQ files. In total there were
238 families where only males were selected for our analysis to avoid heterozygous sites in the
X chromosome, assuming that any multiallelic STR calls should be a result of PCR and/or
sequencing error. Male samples were determined by using metadata of samples (472 samples)
and quality controlled by looking at the coverage on X and Y chromosome. Results of the
analysis lead to exclusion of 3 samples as they had no coverage on Y chromosome. Out of the
remaining 469 samples, we excluded 6 single-end read sequenced files as well as 28 paired-
end read sequenced samples that did not work on GangSTR, and 2 additional samples that had
issues with mapping, which left us with 433 samples in total (Supplementary Table 1).
All computational steps (tools and parameters used) are described in this section.
SRA to FASTQ conversion
All whole-exome sequencing SRA files in Simons Simplex families (study's identifier:
SRP010920) were downloaded from NCBI and converted to FASTQ files by using fastq-dump
(https://ncbi.github.io/sra-tools/fastq-dump.html):
fastq-dump \
--gzip \
--skip-technical \
--readids \
--read-filter pass \
--split-3 \
--dumpbase \
--clip \
FILE.SRA
Defining STR regions
The human reference sequence hg19 (February 2009 assembly) was downloaded from UCSC
(http://hgdownload.soe.ucsc.edu/goldenPath/hg19/bigZips/hg19.fa.gz) and "hg19.fa" file was
22bioRxiv preprint doi: https://doi.org/10.1101/2020.02.03.933002. The copyright holder for this preprint (which was not peer-reviewed) is the
author/funder. It is made available under a CC-BY-NC-ND 4.0 International license.
created by and indexed with Samtools v1.10 (Li et al., 2009) which was downloaded from
http://www.htslib.org website:
cat *.fa > hg19.fa
samtools faidx hg19.fa
Creating FASTA sequence dictionary file for GATK analysis:
gatk CreateSequenceDictionary
-R hg19.fa
-O hg19.dict
Tandem Repeats Finder v4.09 (Benson, 1999) was downloaded from
https://tandem.bu.edu/trf/trf.html and used to find STRs (1-6 bp repeat unit length) in hg19
reference genome by using the following command and parameters:
./trf409.linux64 hg19.fa 2 7 7 80 10 24 6 -h
A custom-made Python script named trf2bed (https://gitlab.com/andreassh/trf2bed) was used
to extract data from TRF output file to generate BED regions file for LobSTR, GangSTR,
HipSTR, RepeatSeq and GATK.
python3 trf2bed.py \
--dat hg19.fa.2.7.7.80.10.24.6.dat \
--bed hg19.fa.2.7.7.80.10.24.6_$TOOL.bed \
--tool $TOOL
FASTQ alignment and calculating BAM coverage
Reads from FASTQ files were aligned to hg19 reference genome using BWA-MEM v0.7.17
that was downloaded from https://sourceforge.net/projects/bio-bwa/files/ and aligned BAM
files were merged and indexed by using Samtools v1.10 (Li et al., 2009)
bwa mem -M -t 8 -R "@RG\\tID:$id\\tPL:$PLATFORM\\tPU:$BARCODE\\tSM:$SAMPLE\\tLB:$LIBRARY"
hg19.fa $INPUT_FILE1.fastq $INPUT_FILE2.fastq | samtools sort -@hg19.fa -o $OUTPUT_FILE.bam -
samtools merge $OUTPUT_FILE.merge.bam $INPUT_FILE1.bam $INPUT_FILE2.bam
samtools index $INPUT_FILE.merge.bam
To follow the best practices of GATK duplicate reads were removed:
gatk MarkDuplicatesSpark \
INPUT=$INPUT_FILE.merge.bam \
OUTPUT=$OUTPUT_FILE.bam \
--remove-sequencing-duplicates \
--create-output-bam-index
Coverage of BAM files on target regions was found with MosDepth v0.2.4 tool that was
downloaded from https://github.com/brentp/mosdepth/ followed by calculating the median and
average coverage:
mosdepth \
-n \
--fast-mode \
--by $TARGET_REGIONS.bed \
$OUPUT_FILE.coverage \
$INPUT_FILE.merge.bam
23bioRxiv preprint doi: https://doi.org/10.1101/2020.02.03.933002. The copyright holder for this preprint (which was not peer-reviewed) is the
author/funder. It is made available under a CC-BY-NC-ND 4.0 International license.
gunzip -c $INPUT_FILE.regions.bed.gz | sort -n -k 5 | awk
'{a[NR]=\$5}END{print(NR%2==1)?a[int(NR/2)+1]:(a[NR/2]+a[NR/2+1])/2}' > $OUTPUT_FILE.avgcov
gunzip -c $INPUT_FILE.regions.bed.gz | sort -n -k 5 | awk '{ sum += \$5; n++ } END { if (n >
0) print sum / n; }' > $OUTPUT_FILE.medcov
Calling STRs and genotyping
GangSTR v2.4 (Mousavi et al., 2019) was downloaded from
https://github.com/gymreklab/GangSTR and executed with the following parameters:
GangSTR \
--bam $INPUT_FILE.merge.bam \
--ref hg19.fa \
--regions hg19.fa.2.7.7.80.10.24.6_gangstr.bed \
--out $OUTPUT.vcf \
--nonuniform \
--coverage X*
* where X = mean coverage for the particular sample that was calculated by MosDepth tool as
described previously.
Strict filtering was done as recommended by the developer by using dumpSTR that is part of
STRTools package (https://github.com/gymreklab/STRTools):
dumpSTR \
--vcf $INPUT_FILE.vcf \
--out $OUTPUT_FILE \
--filter-spanbound-only \
--filter-badCI \
--max-call-DP 1000 \
--min-call-DP 50 \
--min-call-Q 0.9
Since we were looking the relationship between coverage and quality scores, and genotyping
accuracy separately, we did additional filtering (partial filtering) where we discarded the
filtering on calls with low coverage or low-quality scores:
dumpSTR \
--vcf $INPUT_FILE.vcf \
--out $OUTPUT_FILE \
--filter-spanbound-only \
--filter-badCI \
--max-call-DP 1000
RepeatSeq v0.8.2 (Highnam et al., 2013) was downloaded from
https://github.com/adaptivegenome/repeatseq and executed with following parameters:
repeatseq \
$INPUT_FILE.bam \
hg19.fa \
hg19.fa.2.7.7.80.10.24.6_repeatseq.bed
LobSTR v4.0.6 (Gymrek et al., 2012) was downloaded from http://lobstr.teamerlich.org and
custom lobSTR reference was made using lobstr_index.py and GetSTRInfo.py scripts as
follows:
python ./lobstr/scripts/lobstr_index.py
--str hg19.fa.2.7.7.80.10.24.6_lobstr.bed \
--ref hg19.fa \
--out ./lobstr/hg19_custom/
24bioRxiv preprint doi: https://doi.org/10.1101/2020.02.03.933002. The copyright holder for this preprint (which was not peer-reviewed) is the
author/funder. It is made available under a CC-BY-NC-ND 4.0 International license.
python ./lobstr/scripts/GetSTRInfo.py \
hg19.fa.2.7.7.80.10.24.6_lobstr.bed hg19.fa >
./lobstr/hg19_custom/lobstr_hg19_custom_strinfo.tab
LobSTR's allelotype was used to call STRs and it was running with default parameters, with
and without the the --no-rmdup flag:
./lobstr/bin/allelotype \
--command classify \
--bam $INPUT_FILE.merge.bam \
--index-prefix ./lobstr/hg19_custom/lobstr_hg19_custom_ref/lobSTR_ \
--strinfo ./lobstr/hg19_custom/lobstr_hg19_custom_strinfo.tab \
--noise_model ./lobstr/share/lobSTR/models/illumina_v3.pcrfree \
--out $OUTPUT_FILE.vcf \
--no-rmdup
Willems and colleagues explored the effects of recommended allelotype options for lobSTR
(--filter-mapq0, --filter-clipped, --max-repeats-in-ends and --min-read-end-match), but found
the optimal settings for lobSTR does not include these parameters and best results are obtained
with default ones, which was reported about RepeatSeq (Willems et al., 2017) and therefore
we decided to run both tools with the default parameters.
We did the strict filtering with the lobSTR's filtering tool, based on the author's
recommendations for a whole genome data:
python ./lobstr/share/lobSTR/scripts/lobSTR_filter_vcf.py \
--vcf $INPUT_FILE.vcf > $OUTPUT_FILE.vcf \
-loc-cov 5 \
--loc-log-score 0.8 \
--loc-call-rate 0.8 \
--loc-max-ref-length 80 \
--call-cov 5 \
--call-log-score 0.8 \
--call-dist-end 20
And the partial filtering:
python ./lobstr/share/lobSTR/scripts/lobSTR_filter_vcf.py \
--vcf $INPUT_FILE.vcf > $OUTPUT_FILE.vcf \
--loc-call-rate 0.8 \
--loc-max-ref-length 80 \
--call-dist-end 20
HipSTR v0.6.2 (Willems et al., 2017) was downloaded from
https://github.com/tfwillems/HipSTR and executed with following parameters:
HipSTR \
--min-reads 2 \
--def-stutter-model \
--fasta hg19.fa \
--regions hg19_2.7.7.80.10.24.6_hipstr.bed \
--str-vcf $OUTPUT_FILE.vcf.gz \
--bams $INPUT_FILE.merge.bam
Strict filtering was done according to the developer's recommendations:
python ./HipSTR/scripts/filter_vcf.py \
--vcf $INPUT_FILE.vcf \
--min-call-qual 0.9 \
--max-call-flank-indel 0.15 \
--max-call-stutter 0.15 \
--min-call-allele-bias -2 \
--min-call-strand-bias -2 > $OUTPUT_FILE.vcf
25bioRxiv preprint doi: https://doi.org/10.1101/2020.02.03.933002. The copyright holder for this preprint (which was not peer-reviewed) is the
author/funder. It is made available under a CC-BY-NC-ND 4.0 International license.
Since we ran HipSTR with --min-reads 2 parameter, we additionally filtered out all calls that
had less than 100 reads, as this is the default parameter that HipSTR uses.
Partial filtering was done:
python ./HipSTR/scripts/filter_vcf.py \
--vcf $INPUT_FILE.vcf \
--max-call-flank-indel 0.15 \
--max-call-stutter 0.15 \
--min-call-allele-bias -2 \
--min-call-strand-bias -2 > $OUTPUT_FILE.vcf
GATK v4.1.2 was downloaded from https://software.broadinstitute.org/gatk/download/ and
executed with following standard parameters:
gatk HaplotypeCaller \
--reference hg19.fa \
--intervals hg19_2.7.7.80.10.24.6_gatk.bed \
--genotyping-mode DISCOVERY \
--input $INPUT_FILE.merge.bam \
--output $OUTPUT_FILE.vcf
Data were analysed using GATK best practice guidelines (DePristo et al., 2011) up to variant
calling. Variant calling was performed with the HaplotypeCaller in GATK (DePristo et al.,
2011).
Data extraction from variant calling files and analysis
A custom-made Python script was created to extract data from outputted variant calling files
(VCF) of all tools ran. In particularly, only calls in the X chromosome were extracted out. In
case of filtering, only calls that passed the filter were extracted out. The output file contained
information about all STR loci found in the VCF file, having the following fields: sample name,
locus, chromosome, start and end coordinates of the STR region, motif (repeat unit), length of
motif, length of the reference, length of alleles, genotype, number of total reads, number of
reads supporting the call in each class and the quality score.
The data was then analysed in R. Bioconductor's GenomicRanges package for R (Lawrence et
al., 2013) was used to find and then filter out all calls that fell outside of the target regions. All
STR regions that were entirely or partially inside of the target region were included in the
analysis, however, all duplicate loci were removed. When calculating heterozygous percentage
per minimum number of reads or quality score bins, we only included the results when there
were minimum of ten results (samples) to use and calculated the percentage again for each
repeat unit length after each read or after 1/10 quality score bin.
26bioRxiv preprint doi: https://doi.org/10.1101/2020.02.03.933002. The copyright holder for this preprint (which was not peer-reviewed) is the
author/funder. It is made available under a CC-BY-NC-ND 4.0 International license.
Running time and multithreading
To see the performance of the STR specific tools we selected 5 WES samples that had a median
coverage on target regions closest to 90x (between 88.6x and 91.6x) and calculated the time
each tool ran on each sample individually by using either 1, 2, 4 or 8 processor cores on the
same server that has Intel(R) Xeon(R) 2.60 GHz processors and maximum of 16 GB RAM.
Each test was repeated for 3 times and calculated the average time. Timing was performed with
the UNIX time command.
Declarations
Acknowledgments
The authors are thankful to Katrina Bell for their comments and suggestions for the article.
Author Contributions
The project was conceived and the manuscript written by A.H. and A.O. Data analysis was
performed by A.H. with critical input from A.O. All authors read and approved the final
manuscript.
Competing Interests
No competing interests were disclosed.
Grant information
A.O. is supported by an NHMRC fellowship GNT1126157.
Data Availability
The Simons Simplex Collection dataset can be downloaded from NCBI
(http://www.ncbi.nlm.nih.gov/sra). List of IDs of samples used in the analysis can be found in
the Supplementary Table 1.
27You can also read