Taranaki Land and Climate Assessment - PROVIDING LAND OWNERS WITH A DOWN TO EARTH VIEW OF OUR REGION'S GROWING CAPABILITY - Venture Taranaki
←
→
Page content transcription
If your browser does not render page correctly, please read the page content below
Taranaki Land and
Climate Assessment
PROVIDING LAND OWNERS WITH A DOWN TO EARTH VIEW OF OUR REGION'S
GROWING CAPABILITY
By Plant & Food Research
Foreword
                                                                products to deliver these growing opportunities to market.
   Poipoia te kakano kia puawai.                                Taranaki has proven over decades that it has all these
   Nurture the seed and it will blossom.                        components in spades and can adapt to continue to meet
                                                                market demands over time.
                                                                In commissioning this report, Venture Taranaki underscores
As Taranaki’s economy looks to more diverse and
                                                                its role as an independent and apolitical advisor to the
complementary forms of land use to compliment its
                                                                Taranaki region. In this document we look at the land, the
strengths in beef, sheep and dairy, it is worth reflecting on
                                                                climate and the region’s potential to increase the share of
one of Plant & Food Research’s key findings from this work,
                                                                horticulture that makes up the region’s future prosperity.
that ‘there are around 207,000 hectares of land potentially
suitable for generic horticulture within the boundaries of      Venture Taranaki acknowledges the work done by Plant
the Taranaki Regional Council’.                                 & Food Research to produce, and the technical analysis
                                                                behind, this report and welcomes the pathways proposed
This statistic is built upon comprehensive surveying of
                                                                in the report to make best use of the opportunities ahead
Taranaki’s land, environment and climate databases to
                                                                for our region.
quantify the region’s untapped potential to support a
range of commercial horticultural endeavours.                   This report should be read by all those considering
                                                                opportunities to foster more diverse, complementary land
This report seeks to compare the region’s differing
                                                                uses within Taranaki.
climates, and the viability of eight mainstream crops
that could offer commercially successful horticultural
opportunities for the region’s land owners.
Successfully leveraging the opportunities that horticulture
presents is about much more than soil, seeds and climate,       JUSTINE GILLILAND
or simply growing things. Success will be achieved as           Tumu Whakarae/Chief Executive
much by these factors as by people, knowledge transfer,         Te Puna Umanga/Venture Taranaki Trust
and the emergence of new chains, processing, and
About Branching Out
Branching Out is a collaborative exercise looking at our     Branching Out is managed by Venture Taranaki and a
region’s food and fibre value chain opportunities, to        steering group of food and fibre sector participants.
accelerate ideas and thinking that could have practical      The two-year initiative is funded by Taranaki’s three
outcomes across the entire value chain.                      district councils and the Ministry for Primary Industries’
                                                             Sustainable Food and Fibre Futures fund, with significant
It aims to broaden the region’s food and fibre products
                                                             in-kind support from Venture Taranaki, Massey University,
through growing diverse and complementary forms of land
                                                             Crown Research Institutes, and primary sector/food and
use, enterprises, and products, adding greater prosperity
                                                             fibre industry enterprises.
and sustainability to the Taranaki region and economy.
                                                             The Branching Out initiative was developed as an action
New, high-potential ideas will be developed into ‘Venture
                                                             from the Tapuae Roa Strategy and aligns to the region’s
Blueprints’ and be shared with local land owners, food
                                                             long-term vision for a low-emissions future: the Taranaki
and fibre processors and investors to broaden our existing
                                                             2050 Roadmap.
farm-based production activities with potential commercial
opportunities piloted.

SUPPORTED BY:

                                                                                       Taranaki Land and Climate Assessment   1
About Plant & Food Research
    Venture Taranaki commissioned Plant & Food Research to       New fruits, better grains, smarter use of chemicals,
    independently undertake an investigation into the land       stronger biosecurity, higher yields, exciting foods, great
    characteristics and climate of Taranaki, and how these       nutrition, reduced waste.
    datasets may be used to inform the selection of specific
                                                                 Plant & Food Research answer complex biological
    horticulture opportunities.
                                                                 questions; design innovative products and technologies;
    Plant & Food Research believe science can create a better    and look over the horizon for new ways to grow a smart
    future. By finding smarter, greener options today, Plant &   green future.
    Food Research are helping secure the world we want to
    live in tomorrow.
    With our partners, Plant & Food Reserach use world-
    leading science to improve the way they grow, fish,
    harvest and share food. Every day, there are 1000 people
    working across Aotearoa New Zealand and the world
    to help deliver healthy foods from the world’s most
    sustainable systems.

2
Contents
Foreword                                                             3.2.3 Blueberries                             15
                                                                     3.2.4 Hops, hemp and CBD cannabis             16
About Branching Out                                      1
                                                                     3.2.5 Hazelnuts and walnuts                   17
About Plant & Food Research                             2            3.2.6		 Kiwifruit                             18
Executive summary                                       4            3.2.7		 Potatoes                              19
                                                                     3.2.8 Wine grapes                             20
1   Introduction                                        5
                                                                 3.3		Broad GIS sweep                              21
2   Survey of land, environment and                                  3.3.1 Land use capability class               21
    climate databases                                   6
                                                                     3.3.2 Slope                                   22
    2.1		Currently available databases                  7            3.3.3 Growing degree days base 10             23
        2.1.1		 Weather and climate data                8            3.3.4 Frost-free period                       24
        2.1.2		 Land and soil data                      8            3.3.5 Ok for horticulture                     25
        2.1.3		 Water data                              8
                                                             4 Future climate change and future options            26
        2.1.4 Topographic and property data             8
        2.1.5 Generic GIS data                          8    5 Decision-based framework for using datasets         27

    2.2		Limitations of currently available databases   9        5.1		Scenario 1: I have some productive land –
                                                                      what should I grow on it?                    28
3   Suitability of Taranaki for new ventures in
                                                                 5.2		Scenario 2: I have a particular product of
    horticulture                                 10
                                                                      interest – where is best to grow it?         29
    3.1		Generic horticulture                           11
                                                                 5.3		Is the crop economically feasible?           30
    3.2		Specific crops                                 13
                                                             6   Ground-truthing                                   31
        3.2.1		 Apples                                  13
        3.2.2		 Avocados                                14   About Venture Taranaki                                32

CONTRIBUTORS
Ward R, van den Dijssel C, Jenkins H, Jesson L, Clothier B
Plant & Food Research: Palmerston North, Christchurch, Auckland
August 2020
Executive summary
    We have assessed the value of known databases for their          Key missing databases include the availability of high-
    feasibility and ability to meet Venture Taranaki’s long-         quality soil data (e.g. S-Map) for Taranaki.
    term goals for building value, sustainability, and market
                                                                     As an initial demonstration of our capabilities, we
    and supply-chain resilience. Foundational to this is to
                                                                     summarised the climate data from seven Virtual Climate
    understand the accessibility and quality of climatic land
                                                                     Station Network (VCSN) stations spanning the Taranaki
    and soil data. Here we describe these data, and show how
                                                                     region and have produced general climate statistics for
    they can applied.
                                                                     the region, along with assessments for eight crops: apples;
    We undertook a comprehensive survey of land,                     kiwifruit; avocados; blueberries; hops, hemp and CBD
    environment and climate databases relevant to the sector         (cannabidiol) cannabis; hazelnuts and walnuts; potatoes;
    and region including access of information, completeness,        and wine grapes.
    ability to integrate with other databases, strengths and
                                                                     We have provided guidelines on information sources
    weaknesses, relevance and trustworthiness, as well as
                                                                     and questions that need answering when evaluating the
    noting information that is publically available, along with
                                                                     potential for growing crops in the localised areas.
    fee-paying sites.
                                                                     For further information please contact:
    We particularly focused on data pertaining to topography,
    soil attributes (texture, nutrients, water holding capacity,     Brent Clothier, Plant & Food Research Palmerston North
    fertility, erosion potential), water (table-depth, streamflow,   Private Bag 11 600
    quality, drainage and leachate assessment), climate              Palmerston North 4442, NEW ZEALAND
    (rainfall, sunshine hours, number of growing degree days,        Tel: +64 6 953 7700
    daily temperature, frost-free days, altitude), and potential     DDI: +64 6 953 7687
    land use (pastoral, horticultural, arable).                      Email: Brent.Clothier@plantandfood.co.nz

4
1 Introduction
                                                              fertility, erosion potential), water (table-depth, streamflow,
  The long-term aim of Branching Out is to                    quality, drainage and leachate assessment), climate
  identify high-potential ventures in the food                (rainfall, sunshine hours, number of growing degree days,
  and fibre sector for Taranaki.                              daily temperature, frost-free days, altitude), potential land
                                                              use (pastoral, horticultural, arable).
                                                              We focused on data pertaining to the key crops that in
To help with this identification process we have assessed     discussion with Venture Taranaki we consider to have
the value of known databases for their feasibility and        potential, namely:
ability to meet Venture Taranaki’s long-term goals for
building value, sustainability, and market and supply-chain   • apples
resilience. Foundational to these long-term aims is to        • kiwifruit
understand the accessibility and quality of climatic land
and soil data.                                                • avocados

We undertook a comprehensive survey of land,                  • blueberries
environment and climate databases relevant to the sector      • hops
and region including access of information, completeness,
ability to integrate with other databases, strengths          • hemp and CBD (cannabidiol) cannabis
and weaknesses, relevance and trustworthiness, noting         • hazelnuts and walnuts
information that is publically available, along with fee
                                                              • potatoes
paying sites.
                                                              • wine grapes.
We particularly focused on data pertaining to topography,
soil attributes (texture, nutrients, moisture content,

                                                                                         Taranaki Land and Climate Assessment   5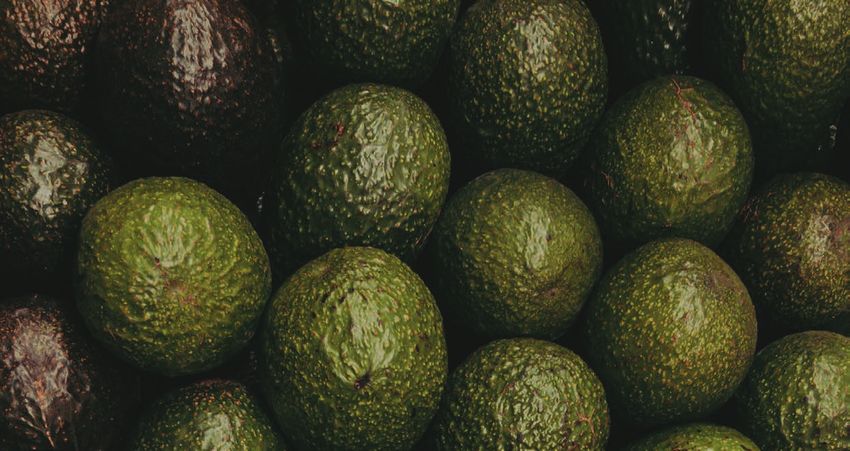
2 Survey of land, environment
      and climate databases
       A range of databases covering various
       aspects of land, soil, environment and
       climate can be used to inform land-
       management decisions.

    The GIS data detailing the soil and land can be visualised
    using online portals, while much of the climate data will
    need to be downloaded and viewed using Microsoft®
    Excel® or similar software. Table 1 summarises the key
    information about each of these databases.
    We particularly focused on data pertaining to topography,
    soil attributes (texture, nutrients, moisture content,
    fertility, erosion potential), water (table-depth, streamflow,
    quality, drainage and leachate assessment), climate
    (rainfall, sunshine hours, number of growing degree days,
    daily temperature, frost-free days, altitude), potential land
    use (pastoral, horticultural, arable).

6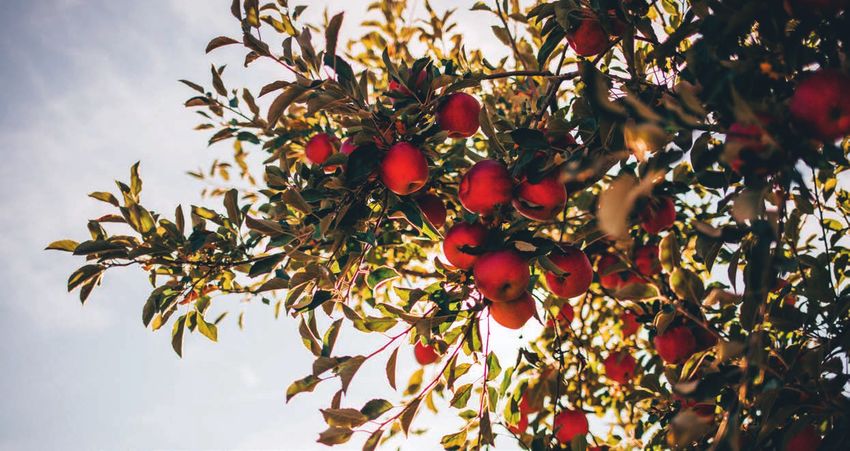
2.1 Currently available databases
Table 1. Summary of databases used for land use assessments

Name                Availability     Format         Details

CliFlo              Free – NIWA      Numerical      Actual weather station data from 1950s to present – coverage is spotty.
                    website                         R package CliFlo can be used to find and import data.
                                                    https://cliflo.niwa.co.nz/
Virtual Climate     Paid - $20 per   Numerical      Interpolated gridded climate data for the entire country from 1972 to present.
Station Network     station per                     https://data.niwa.co.nz/
(VCSN)              month
NIWA Our Future     Free – NIWA      Maps,          Climate predictions from six different climate change models and
Climate New         website          charts and     representative CO2 concentration pathways. Data for selected sites such as
Zealand online                       numerical      New Plymouth can be downloaded as a csv file.
tool                                                https://ofcnz.niwa.co.nz/#/nationalMaps
                                                    https://ofcnz.niwa.co.nz/#/localCharts
NZ Land             Free – LRIS      GIS            Soil, rock, slope, erosion and vegetation data for the entire country, derived
Resource            portal                          from soil surveys. Also includes LUC and FSL.
Inventory                                           https://lris.scinfo.org.nz/layer/48076-nzlri-land-use-capability/
Fundamental Soil    Free – LRIS      GIS            16 soil properties – considered inaccurate and obsolete, but has coverage for
Layers              portal                          the entire country.
                                                    https://lris.scinfo.org.nz/layer/48079-fsl-new-zealand-soil-classification/
Land Cover          Free – LRIS      GIS            Land cover and land use classes.
Database            portal                          https://lris.scinfo.org.nz/layer/104400-lcdb-v50-land-cover-database-
                                                    version-50-mainland-new-zealand/
S-Map               Free – Smap      GIS            Soil properties – essentially updated FSL but only 1/3 of the country covered,
                    portal                          and none of Taranaki.
                                                    https://smap.landcareresearch.co.nz/
DEM                 Free – LRIS      GIS            New Zealand National Digital Elevation Model (North Island) – a 25-metre
                    portal                          resolution, floating point precision, elevation grid.
                                                    https://lris.scinfo.org.nz/layer/48131-nzdem-north-island-25-metre/
NIWA Hydro          Free – NIWA      Charts and     Water quality of 35 rivers, including the Manganui and Waingongoro rivers.
Web Portal          website          numerical      https://hydrowebportal.niwa.co.nz
Taranaki Regional                    Maps, charts   River levels, flow, and temperatures, soil moisture, soil temperature for various
Council                                             monitoring sites across the Taranaki region. Data from specific sites can be
                                                    downloaded as a .csv file.
                                                    https://www.trc.govt.nz/environment/maps-and-data/regional-overview/
Topo50              Free – LINZ      GIS            Topographic mapping for the New Zealand mainland at 1:50,000 scale,
                    portal                          available in raster and vector formats.
                                                    https://data.linz.govt.nz/search/?q=topo50
NZ Property         Free – LINZ      GIS            Title and survey information to primary parcels.
Titles              portal                          https://data.linz.govt.nz/layer/50804-nz-property-titles/
500m climate        Paid – NIWA by   GIS            Interpolated from CliFlo and based on the 30-year period 1981–2010.
date                negotiation                     https://niwa.co.nz/climate/research-projects/national-and-regional-climate-
                                                    maps
Generic             Free -           GIS+           Wide-ranging GIS and additional data and the platform that hosts both the
                    Koordinates                     LRIS and LINZ portal.
                                                    https://koordinates.com/

FSL: Fundamental Soil Layers
LINZ: Land Information New Zealand
LRIS: Land Resource Information Systems
LUC: Land Use Capability
NIWA: National Institute of Water and Atmospheric Research

                                                                                                  Taranaki Land and Climate Assessment   7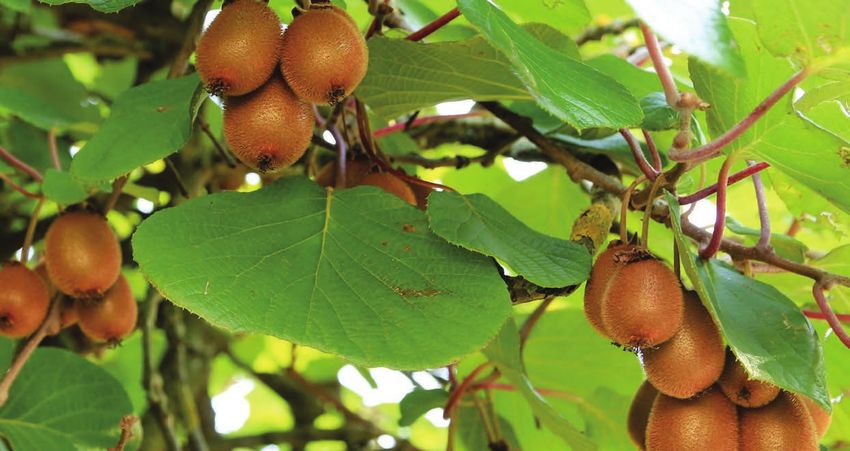
2.1.1 WEATHER AND CLIMATE DATA                                 (https://smap.landcarereserach.co.nz), which provides up-
                                                                   to-date data on soil properties. However, it currently only
    Historical weather and climate data can be obtained from       covers around one-third of New Zealand, and there is no
    NIWA; for example, records of temperature, rainfall and        coverage of Taranaki.
    wind (Table 1).
                                                                   Digital Elevation Models (DEM) tend to underpin both
    The freely available CliFlo database (https://cliflo.niwa.     modeled climate and soil datasets and can be useful in
    co.nz) consists of records from actual weather stations        refining localised assessments, as can the derived slope
    across New Zealand, dating back to the 1950s in some           and aspect layers.
    cases. However, since it is compiled from actual weather
    records, it can be lacking in spatial and temporal coverage.
                                                                   2.1.3 WATER DATA
    NIWA has produced national and regional climate maps,
                                                                   As part of the National River Water Quality Network
    summary maps at 500m resolution based on CliFlo data,
                                                                   (NRWQN, https://niwa.co.nz/freshwater/water-quality-
    for the 30-year period 1981–2010. These can be obtained
                                                                   monitoring-and-advice/national-river-water-quality-
    from NIWA for a fee by negotiation.
                                                                   network-nrwqn), NIWA provides long-term records of the
    The Virtual Climate Station Network (VCSN, https://data.       water quality of the Manganui and Waingongoro rivers
    niwa.co.nz) is a database of daily weather variables that      in Taranaki, including water temperature, alkalinity and
    cover the entire country in a 5km × 5km grid, from 1972        dissolved nitrogen. Water quality data may be viewed
    to the present day. It is derived from interpolating actual    or downloaded from NIWA’s Hydro Web Portal (https://
    weather-station data. Around 300 VCSN ‘stations’ cover         hydrowebportal.niwa.co.nz/). While we do not consider
    the extent of the Taranaki Regional Council, and one           river-water or ground-water quality as part of our land-
    month’s access to the data can be obtained for $20 per         use assessments, it may be useful for other environmental
    station. Both the CliFlo and VCSN data are only available      assessments.
    as tables of numeric data, and it is up to the user to
    download, analyse and interpret them. A custom extract of      2.1.4 TOPOGRAPHIC AND PROPERTY DATA
    multiple sites might be negotiable with NIWA.
                                                                   Land Information New Zealand (LINZ) responsibilities
    NIWA also provides visualisations of potential future          include managing land titles, geodetic and cadastral
    climates with their 'Our Climate Future New Zealand'           survey systems, topographic information, hydrographic
    online tool (OCFNZ, https://ocfnz.niwa.co.nz). This tool       information, managing Crown property and supporting
    provides projections of how various climate variables          government decision making around foreign ownership.
    could change in the future based on several different
                                                                   Data available on the LINZ Data Service (LDS) includes:
    climate change scenarios and models. These projections
    are available as national maps, and as charts for selected     • topographic data and maps
    locations, including New Plymouth.
                                                                   • hydrographic data and charts

    2.1.2 LAND AND SOIL DATA                                       • property data, like boundaries and land ownership

    Manaaki Whenua – Landcare Research (MWLCR) provides            • place names, street address and roads data
    GIS maps of many land properties, available to be              • Crown land and property data
    visualised in online portals (https://lris.scinfo.org.nz) or
    downloaded for use in GIS software.                            • aerial imagery.

    The New Zealand Land Resource Inventory (NZLRI) is             LINZ data is free, customisable, reliable, and updated
    an overarching dataset detailing information about             regularly.
    many different properties of the soil and land across
    New Zealand; for example, slope, soil-type and erosion.        2.1.5 GENERIC GIS DATA
    The Fundamental Soil Layers (FSL) is a set of 16 detailed
                                                                   Koordinates is a website and portal for GIS-related data,
    soil properties derived from the NZLRI; for example, soil
                                                                   and a platform on which both the previously mentioned
    drainage. In addition, the Land Cover Database (LCDB)
                                                                   LRIS and LINZ portals run. This is a great site to start a
    details the coverage and usage of land in New Zealand,
                                                                   search for various details that a specific assessment might
    whether agricultural, urban, forestry or some other use.
                                                                   require.
    While the FSL is a useful database, there are concerns
    about its accuracy since it has been compiled from many
    different sources, some of which are outdated. To address
    this, MWLCR have been developing the S-Map database

8
2.2 Limitations of currently available databases
The main limitations of the currently available data from The various GIS datasets compiled by MWLCR are
NIWA and MWLCR are a lack of spatial coverage and typically at 1:50,000 scale and miss a lot of the small-
resolution. scale variations in the land characteristics and soil type.
For example, the NZLRI GIS datasets consist of polygons
While the VCSN data from NIWA covers the entire
with the average value of a given land aspect, which can
country, through interpolation, each ‘station’ is 5km apart
be anywhere from several hectares to several thousands of
so that much of the small-scale variations in climate
hectares in size. Any given parcel of land may have many
between stations is not apparent, as for example with
different areas with different land properties. For example,
niche microclimates in valleys.
the LUC class, and hence these broad polygons need not
The CliFlo database has limited spatial and temporal reflect the variations in the land they cover.
coverage, since it is compiled from actual weather station
In addition, since S-Map does not cover any of the
data. Main cities, airports and research stations tend to
Taranaki region, there is a lack of up-to-date, good quality
have comprehensive, high quality, consistent weather
soil information for the region.
records spanning several decades. However, many smaller
and more remote locations will have no records at all, Environmental data from Taranaki Regional Council are
or if they do have coverage may only span a few years from various monitoring sites. For example, river levels
and may consist of limited measurements such as air and flows are presented for 31 sites, while data for soil
temperature only. moisture and temperature are monitored at 11 sites.
Taranaki Land and Climate Assessment 93 Suitability of Taranaki for
new ventures in horticulture
Based on the known plant phenology
of plant growth and crop development,
such as summer heat and winter chilling
requirements for germination, flowering
and fruiting, we considered high-value
opportunities for land use in terms of
appropriate climate conditions potentially
suited for generic horticulture, as well as for
seven specific crops.
We summarised the climate data from seven out of the
approximately 300 VCSN stations spanning the Taranaki
region (Figure 1). We have reproduced general climate
statistics for the region (Table 2) along with assessments
for eight crops: apples; avocado; blueberries; hops, hemp
and CBD cannabis; hazelnuts and walnuts; kiwifruit;
potatoes; and wine grapes. We performed a broad GIS
sweep to give an indication of what areas might be
suitable for horticulture.
103.1 Generic horticulture
In general, we consider three main criteria for the • Frost-free period (FFP). This is the time between the last
suitability of an area for horticulture: frost of one year and the first frost of the next year. This
is important as frosts after flowering, or before harvest,
• Winter chill hours between May and September. Winter
can damage a crop. We consider an FFP of at least 200
chilling is important for flowering crops as they need to
days to be suitable for horticulture.
be dormant for a sufficient period over winter to induce
flowering in spring. We consider 500 chill hours of 7 °C For these criteria, we consider both the mean, and the 20th
or below, between May and September, to be sufficient percentile values. The 20th percentile value means that
for general horticulture. 80% of the time, or eight years out of 10, the condition
is fulfilled. The mean values indicate what a typical year
• Growing Degree Days base 10 °C (GDD10). This is
might be like, while the 20th percentile values indicate
a measure of how much heat a crop receives and
what is likely to happen four years out of five, a typical risk
hence how much energy is available for it to reach
baseline used in horticulture.
maturity. The GDD10 is calculated as the daily average
temperature minus the base temperature, in this case While these criteria are enough to give an idea of an area’s
10 °C. Every degree above this base is counted as one suitability for horticulture in a general sense, specific crops
GDD10. For example, if 18 February were to have an may have different requirements.
average temperature of 24 °C, then it would contribute
In general, Taranaki meets all these generic requirements,
14 GDD10 to the season’s total. We consider 800 GDD10
although Stratford is somewhat cooler than the rest of the
between October and April to be sufficient for general
region, so may be more limited in what generic horticulture
horticulture.
is possible there.
Table 2. Generic climate statistics for Taranaki
VCSN station Urenui New Plymouth Inglewood Stratford Ōaonui Hāwera Waverley
21741 21442 21546 21605 30692 21610 26825
Mean chill hours
( 1 year 320 days 315 days
Percentage of years
without frost 27% 52% 6% 0% 54% 13% 9%
FFP: Frost-Free Period
GDD10: Growing Degree Days base 10 °C
VCSN: Virtual Climate Station Network
Taranaki Land and Climate Assessment 11Figure 1. Seven VCSN stations selected to give a general overview of the suitability for horticulture of the region, marked
in black. The grid of available stations is shown in grey. The Taranaki Regional Council borders are shown in green and the
three district council boundaries (New Plymouth, Stratford, South Taranaki) are shown in red.
123.2 Specific crops
3.2.1 APPLES
We assess the potential for a mid-season variety such late March, with Stratford’s growing season generally
as Malus x domestica ‘Royal Gala’ in Table 3. Apples occurring 1–2 weeks later. There is little frost risk after
require at least 500 winter chill hours and 800 GDD10 flowering; however, there is a slight risk of frost before
between October and April. These are both consistently harvest, with Stratford experiencing the highest frost risk
met throughout the region. Apples also require at least of 30%. This can be mitigated, for example, through wind
120 GDD10 over the first 50 days after flowering, which turbines. Apples are at risk of sunburn if the temperature
is also consistently met. Based on temperature patterns exceeds 34 °C; however, there is little risk of this in
throughout the year, we estimate that apples would flower Taranaki.
around mid-October and be ready for harvest in mid- to
Table 3. Growing statistics for apples
VCSN station Urenui New Plymouth Inglewood Stratford Ōaonui Hāwera Waverley
21741 21442 21546 21605 30692 21610 26825
Mean flowering date 11 Oct 13 Oct 18 Oct 23 Oct 14 Oct 15 Oct 14 Oct
Frost risk after
flowering 0% 0% 0% 0% 0% 0% 0%
Mean harvest date 14 Mar 17 Mar 27 Mar 4 Apr 21 Mar 23 Mar 20 Mar
Frost risk before
harvest 2% 2% 12% 30% 2% 12% 12%
GDD10 for first 50
days after flowering 210 200 175 152 187 182 192
Risk of sunburn 0% 0% 0% 0% 0% 0% 0%
GDD10: Growing Degree Days base 10 °C
VCSN: Virtual Climate Station Network
Taranaki Land and Climate Assessment 133.2.2 AVOCADOS
Avocados are relatively sensitive to temperatures in sufficient, yet less than ideal. These requirements are met
the spring (Table 4). Ideally, they require the mean in New Plymouth and almost met at Urenui and Ōaonui.
maximum temperatures to be above 15 °C, 16 °C and The other sites are marginal in terms of exceeding these
17 °C in September, October and November, respectively. minimum temperatures. Finally, extreme annual minimum
This is achieved at all sites. Avocados also require mean temperatures should not drop below 0 °C, although down
minimum temperatures to be above 8 °C, 9 °C and to –2 °C is marginal, and all sites meet this requirement
10 °C in September, October and November, respectively, as well.
although mean temperatures up to 1 °C cooler are
Table 4. Growing statistics for avocado
VCSN station Urenui New Plymouth Inglewood Stratford Ōaonui Hāwera Waverley
21741 21442 21546 21605 30692 21610 26825
Mean maximum temperatures (°C)
September 18.5 17.9 17.2 16.6 17.6 17.8 18.2
October 20.0 19.4 18.8 18.4 18.9 19.4 20.0
November 21.9 21.3 20.7 20.3 20.9 21.3 22.0
Mean minimum temperatures (°C)
September 7.9 8.0 7.0 6.1 7.7 7.0 7.0
October 9.2 9.2 8.1 7.3 8.8 8.2 8.4
November 10.6 10.5 9.5 8.6 10.1 9.6 9.8
Extreme annual
minimum -0.3 0.0 -0.8 -1.5 0.1 -0.8 -1.1
VCSN: Virtual Climate Station Network
143.2.3 BLUEBERRIES
Blueberries have winter chill requirements of anywhere 19 °C between December and February. In most years this
between 200 and 800 winter chill hours depending on is not met for 18 °C, and is almost never met for 19 °C. This
cultivar (Table 5). While varieties with low and medium could be due to afternoon sea breezes that place a cap on
chill requirements would be suitable throughout Taranaki, the daily maximum temperatures. Apart from Inglewood
varieties with high chill requirements would likely only and Stratford, most of the region will experience 1 or 2
be suitable in the inland areas around Inglewood and weeks of maximum temperatures cooler than 18 °C, and
Stratford. Blueberries also require at least 600 GDD10 2–4 weeks of maximum temperatures cooler than 19 °C.
between October and April, which is consistently met
If suitable mitigations are put in place, such as tunnel
throughout Taranaki.
houses, then blueberries could be suitable for much of
However, blueberries also prefer consistently high Taranaki. This would eliminate the cooling effect of the
temperatures during the summer, in particular daily sea breezes, and the greenhouse effect would warm the
maximum temperatures that exceed 18 °C and preferably ambient air in the tunnel house.
Table 5. Growing statistics for blueberries
VCSN station Urenui New Plymouth Inglewood Stratford Ōaonui Hāwera Waverley
21741 21442 21546 21605 30692 21610 26825
Chance of summers
with3.2.4 HOPS, HEMP AND CBD CANNABIS
We assess these three crops together as they are closely for horticulture in general. All of New Zealand except for
related taxonomically. Because of the differing legal status the very top of the North Island lies within this range, and
between hops plus hemp, and CBD cannabis, much more Taranaki in particular experiences 90–94 days per year
research has been done on hops. However, we expect that with day lengths of 15 hours or greater.
the conditions required for hops apply to hemp and CBD
For hops specifically, wind needs to be considered, since
cannabis too (Table 6).
hops are typically grown on 5-m tall trellises. For this
The main driver of growth in these crops is the day we calculate the windrun, which is a measure of how
length, or photoperiod. Hops grow vegetatively with much wind passes over a given point during the day. The
increasing day length, and then flower when the days majority of hops in New Zealand are grown in Motueka,
become shorter. However, a critical day length must be which has an average daily windrun of 120 ± 27 km. We
met before flowering is triggered. This varies between know from in-house experience that Marlborough, with
cultivar but is generally considered to be a day length of an average daily windrun of 291 ± 66 km, is too windy for
15 hours, including an allowance for twilight. We consider hops. Taranaki would appear to be too windy for hops, as
days with 14 hours between sunrise and sunset plus 1 there is considerably more wind than Marlborough. Wind
hour of twilight to be above this threshold. Since the only mitigation such as shelterbelts, or growing hops on shorter
factor that influences maximum day length is latitude, it is trellises may potentially help, although the windier coastal
generally considered that anywhere between 35° and 55° regions of Taranaki may still be too windy despite this.
in latitude is ideal for hops, provided the land is suitable
Table 6. Growing statistics for hops, hemp and CBD cannabis
VCSN station Urenui New Plymouth Inglewood Stratford Ōaonui Hāwera Waverley
21741 21442 21546 21605 30692 21610 26825
First day of >15
hours light 7 Nov 7 Nov 6 Nov 6 Nov 6 Nov 6 Nov 5 Nov
Last day of >15
hours light 4 Feb 4 Feb 5 Feb 5 Feb 5 Feb 5 Feb 6 Feb
Mean windrun 370 km 489 km 382 km 347 km 509 km 415 km 422 km
Windrun standard
deviation ± 160 km ± 193 km ± 158 km ± 143 km ± 195 km ±161 km ± 161 km
VCSN: Virtual Climate Station Network
163.2.5 HAZELNUTS AND WALNUTS
Hazelnuts require at least 500 GDD10 and walnuts require
800 GDD10 of warmth between October and April. These
are easily met across Taranaki (Table 2). Both nuts can
require significant winter chilling, with hazelnuts requiring
at least 1200 chill hours, and walnuts requiring anywhere
between 400 and 1600 chill hours depending on cultivar
(Table 7).
Walnuts with low chill requirements would be suitable
across the region. However, hazelnuts and walnuts with
high winter chill requirements would likely be unsuitable,
and even Stratford would be marginal. Choice of cultivar
will be important.
Table 7. Growing statistics for hazelnuts and walnuts
VCSN station Urenui New Plymouth Inglewood Stratford Ōaonui Hāwera Waverley
21741 21442 21546 21605 30692 21610 26825
Chance of sufficient winter chilling
400 hours 98% 96% 98% 100% 96% 98% 98%
800 hours 37% 14% 82% 98% 33% 69% 76%
1200 hours 0% 0% 8% 55% 0% 8% 12%
1600 hours 0% 0% 0% 6% 0% 0% 0%
VCSN: Virtual Climate Station Network
Taranaki Land and Climate Assessment 173.2.6 KIWIFRUIT
For winter chilling, kiwifruit require mean temperatures needs to be lower than 12.7 °C, and with Hicane® the
to be cool from May to July depending on variety, and average May–July temperature needs to less than 15 °C.
whether or not Hi-Cane® is applied to induce flowering.
We consider the entire region to have sufficient winter
Two cultivars are considered here: Green (Actinidia
chilling (Table 8). We would expect green-fleshed kiwifruit
chinensis var. deliciosa ‘Hayward’) and Gold (Gold3, A.
to flower mid- to late September on average, and gold-
chinensis var. chinensis ‘Zesy002’). For Green without
fleshed kiwifruit to flower around a week earlier. However,
Hicane® the average May–July temperature needs to be
we also consider kiwifruit to require at least 1100 GDD10
below 11.7 °C, while with Hicane® it needs to be less than
from October to April, which is only consistently met in
14 °C. Gold has a lower winter chilling requirement. For
northern Taranaki (Table 2).
Gold without Hicane® the average May–July temperature
Table 8. Growing statistics for kiwifruit
VCSN station Urenui New Plymouth Inglewood Stratford Ōaonui Hāwera Waverley
21741 21442 21546 21605 30692 21610 26825
Mean temperature
for May–July (°C) 10.8 10.9 9.9 9.0 10.7 10.0 10.0
Mean date of
budbreak (Green) Sep 22 Sep 23 Sep 17 Sep 14 Sep 21 Sep 18 Sep 18
Mean date of
budbreak (Gold) Sep 17 Sep 17 Sep 15 Sep 11 Sep 11 Sep 11 Sep 11
Frost risk 0% 0% 0% 0% 0% 0% 0%
Gold: gold-fleshed kiwifruit
Green: green-fleshed kiwifruit
VCSN: Virtual Climate Station Network
183.2.7 POTATOES
Potatoes, and other root vegetables, generally require Stratford where the potatoes will take around a month
sufficient soil temperature to germinate and grow, in this more to mature. If sowing were delayed by a month, the
case 15 °C. On average, the soil temperature in Taranaki potatoes would mature in mid- to late March on average,
will reach that temperature for the first time on 31 August although the growing season would be around 20 days
(Table 9). The GDD7 values for two chipping-potato shorter on average. This indicates the spread in potato
cultivars were used here. Emergence occurs after a GDD7 growing rotations is possible. It is first bounded by the
of 213 degree days, flowering after 804, and maturity at temperature required for sowing, and latest bound is
1500 degree days. If sown then, potatoes will emerge in through the requirement to realise the growing season
mid-October, flower in late December or early January, GDD10 required for tuber maturation.
and mature around early March on average, except for
Table 9. Growing statistics for potatoes
VCSN station Urenui New Plymouth Inglewood Stratford Ōaonui Hāwera Waverley
21741 21442 21546 21605 30692 21610 26825
Mean date of
sowing 31 Aug 31 Aug 31 Aug 31 Aug 31 Aug 31 Aug 31 Aug
Mean date of
emergence 13 Oct 14 Oct 23 Oct 1 Nov 17 Oct 17 Oct 18 Oct
Mean date of
flowering 26 Dec 30 Dec 11 Jan 22 Jan 4 Jan 4 Jan 4 Jan
Mean date of
maturity 28 Feb 4 Mar 23 Mar 15 Apr 12 Mar 12 Mar 11 Mar
Mean season length 180 days 185 days 204 days 227 days 193 days 193 days 192 days
VCSN: Virtual Climate Station Network
Taranaki Land and Climate Assessment 193.2.8 WINE GRAPES
We assess the suitability for Sauvignon Blanc and Pinot is around late April to early May on average; however,
Gris grapes. For sufficient winter chilling, grapes require Stratford cools down somewhat earlier.
the temperatures in July to be below 12 °C on average,
In terms of GDD10, we would consider northern Taranaki
which is met throughout Taranaki. In addition, there is little
to be ideal for wine grapes, and eastern and southern
frost risk for grapes (Table 10).
Taranaki would be acceptable, though not ideal. Inglewood
Grapes require a certain amount of GDD10 between bud would appear to be marginal for Sauvignon Blanc, but
break and autumn senescence for sufficient growth. slightly better suited to Pinot Gris. We consider Stratford
For Sauvignon Blanc, at least 1200 GDD10 is ideal, but to be marginal for Pinot Gris, and not suitable for
1050 GDD10 is considered acceptable, and 850 GDD10 Sauvignon Blanc.
marginal. Pinot Gris requires slightly less, with at least
However, we consider that Taranaki is likely to be too wet
1150 GDD10 being ideal, 1000 GDD10 acceptable and
in late summer for wine grapes. Excess rainfall approaching
800 GDD10 marginal. We model the date of budbreak
harvest affects ripening and increases the chance of
based on the temperatures in September, and we estimate
the fungal disease of botrytis. We consider an average
this to be around the end of September, or beginning of
monthly rainfall in March and April of under 70 mm/month
October, throughout Taranaki. Pinot Gris is slightly earlier
to be suitable. However, this is exceeded throughout
than Sauvignon Blanc. We estimate senescence to occur
Taranaki, with Inglewood and Stratford in particular
when the autumn temperatures drop below 13 °C, which
experiencing over twice as much rain as this.
Table 10. Growing statistics for wine grapes
VCSN station Urenui New Plymouth Inglewood Stratford Ōaonui Hāwera Waverley
21741 21442 21546 21605 30692 21610 26825
Mean July
temperature (°C) 9.6 9.7 8.7 7.8 9.5 8.8 8.8
Mean autumn date3.3 Broad GIS sweep
3.3.1 LAND USE CAPABILITY CLASS
0 50 100km
LUC class: 1 2 3 4 5s 6s
Figure 2. Land Use Capability (LUC) classes in Taranaki. Data reproduced with the permission of Landcare Research
New Zealand Limited.
Sources: Esn, Airbus DS, USGS, NGA, NASA, CGIAR, N Robinson, NCEAS, NLS, OS, NMA, Geodatastyrelsen,
Rijkswaterstaat, GSA, Geoland, FEMA, Intermap and the GIS user community
For this broad sweep, we simply consider four criteria:
• Land Use Capability (LUC) class – this is a general
measure of the productive capacity of land, divided
into eight classes ranging from prime agricultural land
(LUC 1) to marginal land such as cliffs and beaches
(LUC 8). We consider LUC class 1-3 suitable for
horticulture and LUC class 4s-7s suitable for viticulture
in particular, with s referring to soil limitations such as
stoniness (Figure 2).
Taranaki Land and Climate Assessment 213.3.2 SLOPE
0 50 100km
Slope (degrees): 0-3 4-7 8 - 15
Figure 3. Slope classes in Taranaki. Data reproduced with the permission of Landcare Research New Zealand Limited.
Sources: Esn, Airbus DS, USGS, NGA, NASA, CGIAR, N Robinson, NCEAS, NLS, OS, NMA, Geodatastyrelsen,
Rijkswaterstaat, GSA, Geoland, FEMA, Intermap and the GIS user community
• Slope – we consider land with a slope up to 15° suitable
for horticulture, as farm machinery generally requires
relatively flat land for use. Horticulture may be possible
on steeper land in some situations, although it would be
more difficult (Figure 3).
223.3.3 GROWING DEGREE DAYS BASE 10
0 50 100km
Growing Degree Days: 800 - 1000 1000 - 1150 1150 - 1300 1300 - 1450 > 1450
Figure 4. Growing Degree Days (GDD10) in Taranaki. Data reproduced with the permission of the National Institute of
Water and Atmospheric Research (NIWA).
Sources: Esn, Airbus DS, USGS, NGA, NASA, CGIAR, N Robinson, NCEAS, NLS, OS, NMA, Geodatastyrelsen,
Rijkswaterstaat, GSA, Geoland, FEMA, Intermap and the GIS user community
• Growing Degree Days base 10°C (GDD10) – as detailed
previously, we consider GDD10 of at least 800 to be
suitable (Figure 4).
Taranaki Land and Climate Assessment 233.3.4 FROST-FREE PERIOD
0 50 100km
Frost-Free Period (days): 180 - 200 200 - 250 250 - 300 300 - 350 > 350
Figure 5. Frost-Free Period (FFP) in Taranaki. Data reproduced with the permission of the National Institute of Water and
Atmospheric Research (NIWA).
Sources: Esn, Airbus DS, USGS, NGA, NASA, CGIAR, N Robinson, NCEAS, NLS, OS, NMA, Geodatastyrelsen,
Rijkswaterstaat, GSA, Geoland, FEMA, Intermap and the GIS user community
• Frost-Free Period (FFP) – as detailed previously, we
consider FFP of at least 200 days to be suitable
(Figure 5).
243.3.5 OK FOR HORTICULTURE
0 50 100km
Figure 6. Areas suitable for generic horticulture in Taranaki based on the suitable areas in Figures 2-5.
Sources: Esn, Airbus DS, USGS, NGA, NASA, CGIAR, N Robinson, NCEAS, NLS, OS, NMA, Geodatastyrelsen, Rijkswaterstaat,
GSA, Geoland, FEMA, Intermap and the GIS user community
We can work out the areas suitable for horticulture by
finding the overlap of all four criteria, as shown in Figure 6.
We estimate that there are around 207,000 hectares of
land potentially suitable for generic horticulture within the
boundaries of the Taranaki Regional Council.
We do not assess the area of the Stratford District Council
that lies within the Horizons Regional Council boundaries.
However, due to its hilly nature, it is unlikely that there are
significant areas of land suitable for horticulture in that
region.
Taranaki Land and Climate Assessment 254 Future climate change
and future options
Averaging across the different models
suggests increases in temperatures and
number of hot days, but similar amounts of
annual precipitation as the present.
While we have not performed any specific studies of
future crop suitability for Taranaki, we would surmise
that crops with high winter chilling requirements would
potentially become less suitable for Taranaki, and
conversely crops with high GDD10 requirements would
potentially become more suitable.
NIWA provide an online tool to examine different climate change projections for
New Plymouth (https://ofcnz.niwa.co.nz/#/localCharts).
265 Decision-based framework
for using datasets
Alternatively, where is it physically possible to grow
Two key scenarios are considered important the product of interest (§ 5.2)? This requires gathering
for new ventures in Taranaki: information about what conditions are required for the
crop to grow, then determining what areas meet those
Scenario 1: I have some productive land – requirements, again taking into account any mitigation
what should I grow on it? strategies that may be needed for marginal conditions.
Scenario 2: I have a particular product of b) What is economically feasible to grow (§ 5.3)? Once
interest – where is best to grow it? a crop or location has been selected, the outlay
needed for cultivation needs to be compared with
the expected return, taking factors such as labour,
The key steps for making decisions based on these transport and packhouse and cool-storage into
scenarios vary, and they depend greatly on known account.
information about each crop. However, we can roughly
We present decision trees for both scenarios in the
divide the decision making into two parts:
following sections. They detail aspects to consider and
a) What crops are biophysically possible to grow in questions to ask when deciding what or where to grow.
the area of interest (§ 5.1)? This requires gathering These trees are not exhaustive, and there may be other
information on the growing requirements of a range of aspects to consider based on the particular area or crop of
crops along with the climate, soil and land conditions interest.
in the area of interest. Suitability for given crops
to grow in given locations will vary and mitigation
strategies may be necessary if conditions are marginal.
Taranaki Land and Climate Assessment 275.1 Scenario 1: I have some productive land –
what should I grow on it?
What are the climate conditions:
• Temperature -> GDD10
• Winter chilling
• Frost conditions
Climate • Rainfall
• Wind
What are the soil and land conditions:
• Land Use Capability class
• Slope
• Soil types and variability
Soil and land • Water availability
• Susceptibility to floods or other extreme conditions
What crops could potentially be grown based on climate, soil and land conditions?
• How much suitable area is available
• If a crop is marginal, what kind of mitigation strategies might be needed? Are they
feasible?
Crop choice • Even if a crop is suitable, could anything be done to improve the growing conditions?
• Is there an emotional attachment to any of the potentially suitable crops?
285.2 Scenario 2: I have a particular product of
interest – where is best to grow it?
What conditions does the crop need to grow?
• Climate: GDD10, winter chilling, frost, wind, rain, etc.
• Soil/land: LUC, slope, water needs, soil acidity, etc.
Crop • Have others grown it in the region? Or in other regions with similar conditions?
suitability • If conditions are marginal, what kind of mitigation strategies could be used?
criteria
How much land is available?
• How easily accessible is it?
• How easy is it to cultivate? Is significant infrastructure needed, e.g. trellises for grapes?
• How close is it to industry infrastructure, e.g. packhouses?
Available land • Is it possible to collaborate with other growers or land owners?
What are the conditions across the available land? How much do the conditions
vary?
• Do the conditions meet the criteria for the crop?
• If there is land that does not meet these criteria, what mitigation options are available?
Climate, soil and What options are feasible?
land conditions
• How much land meets the criteria? How much land is marginal but can be mitigated?
Taranaki Land and Climate Assessment 295.3 Is the crop economically feasible?
• Is there any industry body for the crop? What are the costs and benefits of affiliating?
• Are there any regulatory or biosecurity requirements?
• Is there any local infrastructure, e.g. packhouses?
• What logistics are necessary for distribution or processing?
Industry • Do others in the region grow the crop? Are they competitors or is there potential for
co-operation?
• What is the market space like?
• What is the potential return? Does it depend on domestic or export, raw or processed,
conventional or organic?
• What costs are involved? Initial outlay, infrastructure, maintenance, labour,
management, harvest, distribution, etc.
Financial • What kind of time commitment is needed?
• Is it possible to pool resources with other growers?
• What is the potential profitability? Does it depend on how much area is cultivated?
How long would it take to turn a profit?
• Yes
• Maybe, depending on ...
• No
Decision
306 Ground-truthing
used to inform assessments on a farm scale. This is not an
It must be emphasised that these endorsement, rather an indication of the type of agency
assessments are purely derived from a that is available.
desktop exercise. Weather and climate data are more difficult as the
assessments generally need long-term records in order
to calculate seasonal and annual weather patterns.
Even though the assessments are performed with the Weather records from other sources, whether anecdotal
best available data, because of the limitations explained or actual measurements, may be used to supplement, or
in Section 2.2 there is always the possibility to indicate even replace, weather and climate data from the NIWA
land is locally unsuitable for horticulture, when in reality it databases. Alternatively a weather station could be
is suitable, or vice versa. There can be niche locations that set up on a given property. However, this would require
are ‘hidden’ from our assessments. a long period of measurements to obtain any useful
In terms of land and soil properties, small-scale, detailed information for these crop assessments. But such weather
survey services are offered by consultancy companies such stations can also be used in real-time to guide land
as Landvision (www.landvision.co.nz) and they can be management decisions.
Taranaki Land and Climate Assessment 31About Venture Taranaki
Te Puna Umanga/Venture Taranaki is Taranaki’s regional Venture Taranaki does this by:
development and promotion agency, encompassing a
• promoting Taranaki as a great place to learn, live, work,
wide range of activities spanning local and regional
play, visit and create
economic development and strategy, enterprise innovation
and growth, regional promotion and marketing, sector • providing enterprise support and enablement
development, and major event attraction. Venture Taranaki
• undertaking research and thought leadership
is a Council Controlled Organisation of the New Plymouth
District Council, is governed by an independent Board of • promoting investment in Taranaki.
Trustees, and guided by Te Tiriti o Waitangi. Venture Taranaki’s work is also guided by Make Way for
The long-term impact that Venture Taranaki is working Taranaki Tapuae Roa, Taranaki’s 2017 regional economic
towards is a Taranaki economy that helps enable the well- development strategy, and by the 2019 intergenerational
being of our people and our environment, underpinned by Taranaki 2050 Roadmap for transitioning to a low-
resilient enterprises, economies and communities. emissions future.
32CONFIDENTIAL REPORT FOR: Venture Taranaki DISCLAIMER The New Zealand Institute for Plant and Food Research Limited does not give any prediction, warranty or assurance in relation to the accuracy of or fitness for any particular use or application of, any information or scientific or other result contained in this report. Neither The New Zealand Institute for Plant and Food Research Limited nor any of its employees, students, contractors, subcontractors or agents shall be liable for any cost (including legal costs), claim, liability, loss, damage, injury or the like, which may be suffered or incurred as a direct or indirect result of the reliance by any person on any information contained in this report. CONFIDENTIALITY This report contains valuable information in relation to the Taranaki Land & Climate Assessment programme that is confidential to the business of The New Zealand Institute for Plant and Food Research Limited and Venture Taranaki. This report is provided solely for the purpose of advising on the progress of the Taranaki Land & Climate Assessment programme, and the information it contains should be treated as “Confidential Information” in accordance with The New Zealand Institute for Plant and Food Research Limited’s Agreement with Venture Taranaki. COPYRIGHT © COPYRIGHT (2020) The New Zealand Institute for Plant and Food Research Limited. All Rights Reserved. No part of this report may be reproduced, stored in a retrieval system, transmitted, reported, or copied in any form or by any means electronic, mechanical or otherwise, without the prior written permission of the of The New Zealand Institute for Plant and Food Research Limited. Information contained in this report is confidential and is not to be disclosed in any form to any party without the prior approval in writing of The New Zealand Institute for Plant and Food Research Limited. To request permission, write to: The Science Publication Office, The New Zealand Institute for Plant and Food Research Limited – Postal Address: Private Bag 92169, Victoria Street West, Auckland 1142, New Zealand; Email: SPO-Team@plantandfood.co.nz. PUBLICATION DATA Ward R, van den Dijssel C, Jenkins H, Jesson L, Clothier B. August 2020. Taranaki land and climate assessment. A Plant & Food Research report prepared for: Venture Taranaki. Milestone No. 86336. Contract No. 38250. Job code: P/442089/01. PFR SPTS No. 19830. Report prepared by: Brent Clothier Principal Scientist, Cropping Systems & Environment August 2020 Report approved by: Paul Johnstone Science Group Leader, Cropping Systems & Environment August 2020
An initiative of
Taranaki’s Regional Development Agency
25 Dawson Street, PO Box 670
New Plymouth 4340, New Zealand
T+64 6 759 5150
E info@venture.org.nz
www.taranaki.info
You can also read