No Clicks, No Problem: Using Cursor Movements to Understand and Improve Search
←
→
Page content transcription
If your browser does not render page correctly, please read the page content below

No Clicks, No Problem: Using Cursor Movements
                   to Understand and Improve Search
           Jeff Huang                                           Ryen W. White                               Susan Dumais
       Information School                                      Microsoft Research                          Microsoft Research
     University of Washington                                 Redmond, WA 98052                           Redmond, WA 98052
       chi@jeffhuang.com                                     ryenw@microsoft.com                        sdumais@microsoft.com
ABSTRACT                                                                       tained easily at scale. However, they fail to capture behav-
Understanding how people interact with search engines is                       iors that do not lead to clicks (e.g., which items are attend-
important in improving search quality. Web search engines                      ed to, in what order, etc.) or subjective impressions. Gaze-
typically analyze queries and clicked results, but these ac-                   tracking studies with participants present in the laboratory
tions provide limited signals regarding search interaction.                    can provide more detailed insights but on a smaller scale.
Laboratory studies often use richer methods such as gaze                       In this paper we consider how mouse movements, which
tracking, but this is impractical at Web scale. In this paper,                 can be collected remotely on a large scale, can be used to
we examine mouse cursor behavior on search engine results                      understand richer patterns of behavior.
pages (SERPs), including not only clicks but also cursor                       We focus on understanding cursor activities in Web search
movements and hovers over different page regions. We: (i)                      behavior. People conduct Web searches to satisfy infor-
report an eye-tracking study showing that cursor position is                   mation needs. Their interaction with search engines begins
closely related to eye gaze, especially on SERPs; (ii) pre-                    by issuing a search query, then reviewing the search engine
sent a scalable approach to capture cursor movements, and                      results page (SERP) to determine which, if any, results may
an analysis of search result examination behavior evident in                   satisfy their need. In doing so, they may move their mouse
these large-scale cursor data; and (iii) describe two applica-                 cursor around the page, hovering over and possibly clicking
tions (estimating search result relevance and distinguishing                   on hyperlinks. Small-scale laboratory studies have ob-
good from bad abandonment) that demonstrate the value of                       served participants making many uses of the cursor on
capturing cursor data. Our findings help us better under-                      SERPs beyond hyperlink clicking [1,21,25]. These uses
stand how searchers use cursors on SERPs and can help                          include moving the cursor as a reading aid, using it to mark
design more effective search systems. Our scalable cursor                      interesting results, using it to interact with controls on the
tracking method may also be useful in non-search settings.                     screen (e.g., buttons, scroll bars), or simply positioning the
Author Keywords                                                                cursor so that it does not occlude Web page content. How-
Cursor movements, clicks, implicit feedback, Web search.                       ever, studying such behaviors in small-scale laboratory
                                                                               settings is limited in terms of what inferences can be made.
ACM Classification Keywords
H.3.3 [Information Storage and Retrieval]: Information                         Tracking mouse cursor movements at scale can provide a
Search and Retrieval–selection process, relevance feedback                     rich new source of behavioral information to understand,
                                                                               model, and satisfy information needs. Recent research has
General Terms                                                                  shown that cursor movements correlate with eye gaze
Experimentation, Human Factors, Measurement.                                   [6,13,25,26], and may therefore be an effective indicator of
                                                                               user attention. We believe that cursor data, like click data
INTRODUCTION                                                                   [18], can provide signals that reveal searcher intent and
Understanding how people interact with Web sites is im-                        may be useful in improving the search experience. Cursor
portant in improving site design and the quality of services                   data can be used to complement click data in several ways.
offered. The Web provides unprecedented opportunities to                       First, cursor data can be captured for uncommon queries
evaluate alternative design, interaction, and algorithmic                      where strong indicators of relevance such as result clicks
methods at scale and in situ with actual customers doing                       may occur less frequently or not at all. For example, ana-
their own tasks in their own environments [19]. Such stud-                     lyzing click logs for a query that has been issued several
ies typically involve measuring clicks which can be ob-                        times but never clicked may provide limited relevance in-
                                                                               formation, but cursor behavior on the SERP associated with
                                                                               the query may provide insight about relevance. Second, in
Permission to make digital or hard copies of all or part of this work for
personal or classroom use is granted without fee provided that copies are      cases of so-called good abandonment [20], where the con-
not made or distributed for profit or commercial advantage and that copies     tent on the SERP satisfies the user’s information need di-
bear this notice and the full citation on the first page. To copy otherwise,   rectly, a search result click may be unnecessary. Thus the
or republish, to post on servers or to redistribute to lists, requires prior   lack of a click should not always be interpreted as a search
specific permission and/or a fee.
CHI 2011, May 7–12, 2011, Vancouver, BC, Canada.                               failure. Cursor behavior may help in distinguishing be-
Copyright 2011 ACM 978-1-4503-0267-8/11/05....$10.00.                          tween good and bad search abandonment.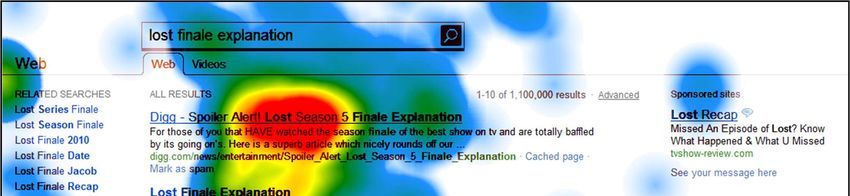
The research questions that we ask are: (i) to what extent      browsing the Web. They showed that the distance between
does gaze correlate with cursor behavior on SERPs and           gaze and cursor was markedly shorter in regions of encoun-
non-SERPs? (ii) what does cursor behavior reveal about          tered pages to which users attended. Liu and Chung [21]
search engine users’ result examination strategies, and how     recorded cursor activity from 28 students browsing the
does this relate to search result clicks and prior eye-         Web. They noticed patterns of cursor behaviors, including
tracking research? and (iii) can we demonstrate useful ap-      reading by tracing text. Their algorithms were capable of
plications of large-scale cursor data? Answers to these         predicting users’ cursor behaviors with 79% accuracy.
questions help us determine the utility of cursor tracking at   More recent work has focused on the relationship between
scale, and ultimately inform search system design and im-       cursor and gaze on search tasks. In a study involving 32
prove the experience for users of search engines.               subjects performing 16 search tasks each [25,26], Rodden
RELATED WORK                                                    et al. identified a strong alignment between cursor and gaze
One line of related research has explored the use of cursor     positions. They found that the distance between cursor and
movements, clicks, and gaze as implicit indicators of inter-    gaze positions was longer along the -axis than the -axis,
est on Web pages. In early work, Goecks and Shavlik modi-       and was generally shorter when the cursor was placed over
fied a Web browser to record themselves browsing hun-           the search results. Rodden et al. also observed four general
dreds of Web pages [11]. They found that a neural network       types of mouse behaviors: neglecting the cursor while read-
could predict variables such as the amount of cursor activi-    ing, using the cursor as a reading aid to follow text (either
ty on the SERP, which they considered surrogate measure-        horizontally or vertically), and using the cursor to mark
ments of user interest. Claypool et al. [7] developed the       interesting results. Guo and Agichtein [14] reported similar
“curious browser,” a custom Web browser that recorded           findings in a smaller study of ten subjects performing 20
activity from 75 students browsing over 2,500 Web pages.        search tasks each. Like Rodden et al., Guo and Agichtein
They found that cursor travel time was a positive indicator     noticed that distances along the -axis tended to be longer
of a Web page’s relevance, but could only differentiate         than the distances along the -axis. They could predict with
highly irrelevant Web pages. Surprisingly, they also found      77% accuracy when gaze and cursor were strongly aligned
that the number of mouse clicks on a page did not correlate     using cursor features.
with its relevance. Hijikata [15] used client-side logging to   The research presented in this paper extends previous work
monitor five subjects browsing a total of 120 Web pages.        in a number of ways. Our analysis of the cursor-gaze rela-
They recorded actions such as text tracing and link pointing    tionship (Study 1) involves more search tasks than prior
using the cursor. The findings showed that these behaviors      studies, compares SERP and post-SERP Web pages, and
were good indicators for interesting regions of the Web         confirms earlier results with a large study using the same
page, around one-and-a-half times more effective than ru-       SERP layout that we use in the remainder of the paper.
dimentary term matching between the query and regions of        More importantly, we develop a scalable approach to cap-
the page. Shapira et al. [27] developed a special Web           turing cursor data that enables us to analyze real user activi-
browser and recorded cursor activity from a small number        ty in a natural setting for more than 360 thousand searches
of company employees browsing the Web. They found that          from an estimated 22 thousand searchers (Study 2). Finally,
the ratio of mouse movement to reading time was a better        using two case studies, we show how cursor data can sup-
indicator of page quality than cursor travel distance and       plement click data on two search-related problems.
overall length of time that users spend on a page.
                                                                STUDY 1: GAZE-CURSOR RELATIONSHIP
In the search domain, Guo and Agichtein [12] captured           We begin by replicating and extending prior laboratory
mouse movements using a modified browser toolbar and            experiments on the relationship between gaze and cursor
found differences in cursor travel distances between infor-     activity using the same SERP layout deployed in our large-
mational and navigational queries. Furthermore, a decision      scale cursor study (Study 2, see Figure 2). Study 1 also
tree could classify the query type using cursor movements       involves more tasks and participants than prior laboratory
more accurately than using clicks. Guo and Agichtein also       studies, and measures the relationship between gaze and
used interactions such as cursor movement, hovers, and          cursor position on SERP and on non-SERP pages.
scrolling to accurately infer search intent and interest in
search results [13]. They focused on automatically identify-    Data
ing a searcher’s research or purchase intent based on fea-      We used a Tobii x50 eye tracker with 50Hz tracking fre-
tures of the interaction. Buscher et al. investigated the use   quency and 0.5° visual angle on a 1280 × 1024 resolution
of gaze tracking to predict salient regions of Web pages [2]    17 inch monitor (96.42dpi) and 1040 × 996 resolution In-
and the use of visual attention as implicit relevance feed-     ternet Explorer 7 browser. Cursor and gaze coordinates
back to personalize search [4].                                 were collected in an eye-tracking study of 38 participants
Another line of research examined the relationship between      (21 female, 17 male) performing Web searches. Participants
eye gaze and cursor positions. An early study by Chen et        were recruited from a user study pool. They ranged in age
al. [6] measured this relationship in Web browsing by re-       between 26 and 60 years (mean = 45.5, = 8.2), and had a
cording 100 gaze and cursor positions from five subjects        wide variety of backgrounds and professions.
Each participant completed 32 search tasks on the same                     Findings
search engine, with the same SERP layout template, as used                 Figure 1 shows the frequency distribution for different val-
for the large-scale cursor study described in the next section             ues of ∆ (distance between cursor -coordinate and gaze
(see Figure 2). Half of the tasks were navigational (i.e.,                   -coordinate), ∆ (distance between cursor -coordinate
they had to find a specific Web page) and half were infor-                 and gaze -coordinate), and Euclidean distance between
mational (i.e., they had to find factual information). Each                cursor and gaze coordinates, i.e.,                        . The
task started with a description of what participants should                solid lines in Figure 1 show the distances for SERP pages.
look for on the Web. Gaze and cursor positions were rec-                   As can be seen, cursor and gaze positions are quite similar
orded for each SERP as well as subsequent Web pages (i.e.,                 for both and y values, their deltas peaking near 0, when
pages visited after clicking on a search result). In total, we             the gaze and cursor positions are in the same place. The
collected data for 1,210 search tasks, 1,336,647 gaze posi-                mean Euclidean distance between cursor and gaze is 178px
tions, and 87,227 cursor positions. Gaze-specific findings                 (σ = 139px) and the median is 143px. The most common
on this data set, unrelated to cursor behavior, have been                  offset for the cursor is +3px (to the right) for the -
reported by others [5,10]. Those researchers granted us                    coordinate and +29px (lower) for the -coordinate. That is,
access to their data so that we could examine the relation-                the cursor is most likely to be just below where the user is
ship between gaze and cursor behaviors.                                    focusing with their eyes. We also observed that the differ-
Gaze and cursor positions were extracted from the eye-                     ences are greater in the than direction (average 50px in
tracking logs. In our data, the gaze positions were recorded               the direction and 7px in the direction), similar to other
approximately every 20ms, whereas cursor positions were                    studies [14, 25]. Possible explanations for the difference
recorded approximately every 100ms. Since cursor and                       between ∆ and ∆ include: (i) users may place the cursor
gaze events did not always have identical timestamps, a                    to the left or right of their gaze to prevent it from obscuring
gaze position was interpolated for every cursor position.                  the text as they read up or down, and (ii) computer screens
Interpolation was performed by calculating gaze and                        are usually wider, offering more horizontal space for the
coordinates weighted by the coordinates of the nearest gaze                cursor.
coordinates before and after the cursor position. For exam-                The dotted lines in Figure 1 represent post-SERP landing
ple, the interpolated -coordinate for eye gaze is calculated               pages. Distances between the gaze and cursor on the land-
as                                          where       is the             ing pages were greater than those on the SERP (215px vs.
time for the corresponding cursor position,      is the gaze’s             178px), perhaps due to greater variance in the layout and
  -coordinate preceding the cursor position, recorded at time              the content of those pages, as has already been suggested
   , and     is the gaze’s -coordinate following the cursor                by earlier gaze analysis [2]. Thus the cursor is a better
position, recorded at time . To reduce noise, cursor posi-                 proxy for user attention on the SERP than post-SERP pag-
tions were only captured if they occurred between gaze                     es. Monitoring cursor behavior on SERPs may help esti-
positions that were at most 100ms apart.                                   mate which results or features users attend to and when,
                                                                           and we now turn to a large-scale study of this.


                                  0.06
                                                                                                               SERP x

Proportion of all cursor events

                                                                                                               SERP y
                                  0.05
                                                                                                               SERP Distance
                                                                                                               Post-SERP x
                                  0.04                                                                         Post-SERP y
                                                                                                               Post-SERP Distance
                                  0.03

                                  0.02

                                  0.01

                                    0
                                         -600
                                         -570
                                         -540
                                         -510
                                         -480
                                         -450
                                         -420
                                         -390
                                         -360
                                         -330
                                         -300
                                         -270
                                         -240
                                         -210
                                         -180
                                         -150
                                         -120
                                          -90
                                          -60
                                          -30
                                            0
                                           30
                                           60
                                           90
                                          120
                                          150
                                          180
                                          210
                                          240
                                          270
                                          300
                                          330
                                          360
                                          390
                                          420
                                          450
                                          480
                                          510
                                          540
                                          570
                                          600

                                                                   Distance (in pixels)

        Figure 1. ∆x, ∆y, and Euclidean distance plotted in a frequency distribution for SERP and post-SERP pages. Solid lines represent
         these distances gathered on the SERP, while dashed lines represented distances gathered on post-SERP pages (landing pages).
STUDY 2: LARGE-SCALE CURSOR TRACKING STUDY                         A server-side process aggregated data from multiple
Following on from the eye-tracking study, we instrumented          pageviews belonging to the same query (e.g., from return-
cursor tracking on the SERP of the Bing search engine, de-         ing to SERP using the browser “back” button or viewing
ployed as an internal flight within Microsoft. Cursor track-       multiple result pages), to facilitate query-level in addition to
ing at scale involves careful instrumentation of the SERP to       pageview-level analysis. All analysis presented in this paper
address issues with page load latencies associated with the        is at the query level. Table 1 describes the fields present in
cursor capture script, and the need to remotely record the         each record. We identify regions that the cursor hovers over
large volumes of data generated from cursor behavior. We           using attributes in the HTML, and use two such regions in
now describe the method that we devised to capture cursor          subsequent analyses (result rank, link id).
movement data on SERPs at scale.                                     Table 1. Fields in data recorded by cursor tracking script.
Method                                                             Field               Description
We wanted to collect cursor data without requiring addi-
                                                                   Event               Cursor move or click
tional installation. To do this, we instrumented the search
                                                                   Cursor Position     x- and y-coordinates of the cursor
results page using client-side JavaScript embedded within
                                                                   Timestamp           Time that the event occurred
the HTML source for the results page. The embedded script
had a total size of approximately 750 bytes of compressed          Region              Result rank or link id
JavaScript, which had little effect on the page load time.         QueryId             Unique identifier for each query
The script recorded users’ cursor interaction within the Web       CookieId            Unique identifier for each cookie
page’s borders relative to the top-left corner of the page.        Query               Text of the issued query
Since cursor tracking was relative to the document, we cap-        Result URL          URL of clicked result (if any)
tured cursor alignment to SERP content regardless of how
                                                                   The large volume of data collected using the method de-
the user got to that position (e.g., by scrolling, or keyboard).
                                                                   scribed in this section allowed us to examine a number of
Therefore this approach did not constrain other behaviors
                                                                   aspects of how searchers use their cursors on SERPs. For
such as scrolling or keyboard input.
                                                                   this purpose, we use the query-level data, comprising all
In previous cursor tracking studies, cursor position was           clicks and cursor movements for a query instance. In addi-
recorded at particular time intervals, such as every 50 milli-     tion to the location of cursor positions, we summarize the
seconds (ms) [13] or every 100ms [25]. This is impractical         total amount of cursor activity for a query using cursor
at a large scale because of the large amount of data to trans-     trails (i.e., complete contiguous sequences of cursor move-
fer from the user’s computer to the server. One alternative is     ments on the SERP). As we show later, these trails are use-
to record events only when there is activity, but this is still    ful in situations where no clicks are observed.
problematic because even a single mouse movement can
                                                                   Data were accumulated from a random sample of Microsoft
trigger many mouse movement events. We devised a differ-
                                                                   employees’ searches on the commercial Web search engine
ent approach by only recording cursor positions after a
                                                                   used between May 12, 2010 and June 6, 2010. In total, we
movement delay. From experimentation, we found that re-
                                                                   recorded 7,500,429 cursor events from 366,473 queries
cording cursor positions only after a 40ms pause provided a
                                                                   made by 21,936 unique cookies; the actual number of users
reasonable tradeoff between data quantity and granularity of
                                                                   may be fewer since multiple cookies could belong to a sin-
the recorded events. This approach recorded sufficient key
                                                                   gle user. Although we realize that employees of our organi-
points of cursor movement, e.g., when the user changed
                                                                   zation may not be representative of the general Web search-
directions in moving or at endpoints before and after a
                                                                   er population in some respects, e.g., they were more tech-
move; occasionally, points within a longer movement were
                                                                   nical, we believe that their interaction patterns can provide
also captured if the user hesitated while moving. All mouse
                                                                   useful insights on how SERPs are examined.
clicks were recorded since they were less frequent. The
events were buffered and sent to a remote server every two         We now summarize our results on general cursor activity,
seconds and also when the user navigated away from the             evidence of search result examination patterns, and the rela-
SERP through clicking on a hyperlink or closing the tab or         tionship between click and cursor hover activity. We then
browser; this was typically 1-3 kilobytes of data. The pseu-       present two applications demonstrating the potential utility
do-code below summarizes this logic.                               of gathering cursor data at scale.
                                                          General Cursor Activity
                                                                  We begin by determining where on the SERP users click
        getCursorPos

  wait
                                               and move their mouse cursors. This offers some initial in-
             getCursorPos
      getRegion                         sight into differences between click and movement data.
                                                          Figure 2 shows heatmaps for clicks and cursor movement
     getRegion
                                                                   activity for the same query aggregated over all instances of
    !
                                                                the query [lost finale explanation] (in reference to the final
  send
                                                             episode of the US television series “Lost”) observed 25
  clear
                                                                   times from 22 different users in our data. Heavy interaction
Click positions                                                    Cursor movement positions

     Figure 2. Heatmaps of all click positions (left) and recorded cursor positions (right) for the query [lost finale explanation].
     Heavy interaction occurs in red/orange/yellow areas, moderate interaction in green areas, light interaction in blue areas.
occurs in red/orange/yellow areas, moderate interaction in
                                                                       Mean Hover Time (±SEM)

                                                                                                                                                    Mean Arrival Time (±SEM)
                                                                                                1.5                                            10
green areas, and light interaction in blue areas. Most of the                                                                                  9
clicks occur on results 1, 3 and 7, and this is also seen in the                                                                               8
                                                                             (seconds)

cursor activity. However, there are some interesting differ-

                                                                                                                                                           (seconds)
                                                                                                 1                                             7
ences as well. For example, there is considerable cursor                                                                                       6
activity on result 4 even though it is not clicked. The cursor                                                                                 5
                                                                                                                                               4
heatmap also shows some activity on query suggestions (on                                       0.5                                            3
the left rail) and advertisements (on the right rail) although                                                                                 2
there are no clicks on these regions. Across all queries, cur-                                                                                 1
sor positions are more broadly distributed over the SERP                                         0                                             0
than clicks. Thus cursor movement can provide a more                                                  1   2   3   4   5   6   7   8   9   10
complete picture of interactions with elements on the SERP.                                               Search Result Position (rank)
Such information may be useful to search engine designers
in making decisions about what content or features to show             Figure 3. Mean title hover duration (bars) and mean time for
                                                                                  cursor to arrive at each result (circles).
on search result pages.
                                                                      The figure shows that time spent hovering on the results
Search Result Examination                                             decreases linearly with rank and that the arrival time in-
In addition to monitoring general cursor movement activity            creases linearly with rank. The results are generally similar
on the SERP, we can also summarize cursor movements                   to gaze tracking findings reported in previous literature
that reflect how people examine the search results. Previous          [5,9,18]. Hover time decreases with rank as was previously
work on gaze tracking demonstrated differences in the                 reported; however, cursor hover time drops off less sharply
length of time that users spend reading each of the results           than gaze duration. This difference may be because we miss
based on its position in the ranked list [9]. In a similar way,       some of the rapid skimming behavior on low ranks that has
we were interested in whether the time participants spent             been observed previously [5,9,18] since we only recorded
hovering over the search results was related to the position          hovers after a 40ms pause (to reduce data payload) and fil-
in the ranked list. To reduce noise caused by unintentional           tered out hovers of 100ms or less (to reduce cases of captur-
hovering, we removed hovers of less than 100ms in dura-               ing accidental hovers). As expected, search results that are
tion. In Figure 3 we present a graph of the average time              lower ranked are entered later than higher ranked results
spent hovering over each search result title (shown as bars;          due to the typical top-to-bottom scanning behavior [8]. The
corresponding scale shown on the left side), and the average          arrival time is approximately linear, suggesting that users
time taken to reach each result title in the ranked list              examine each search result for a similar amount of time.
(shown as circles connected with lines; corresponding scale
on the right side). Error bars denote the standard error of the       We also examined which results were hovered on before
mean (SEM).                                                           clicking on a result, re-querying, or clicking query sugges-
tions or advertisements. This provides further information In the next section we compare the distributions of search
about how searchers are using their cursor during result results clicks and search result hovers.
examination and again allows us to compare our findings
Comparing Click and Hover Distributions
with prior eye-tracking research from Cutrell and Guan [9]. Prior studies have presented data on click distribution
Figure 4 summarizes our findings. This figure shows the [18,24] or gaze distribution for the search results [5,18].
mean number of search results hovered on before a click as These distributions tell us how much attention is given to
blue lines, and clicks as red circles. The data are broken each result because of its rank and other features such as
down by result position (1-10), and separately for clicks on snippet content [9]. Some theoretical models of behavior
query suggestions, clicks on ads, and re-queries. depend on accurate models of these distributions, e.g., [16]
assumes the frequency with which users review a search
Suggestion click
result is a power law of its rank, while [28] assumes the
Selected Search frequency with which a search result is clicked follows a
Re-query
Ad click
Result Position (rank) geometric distribution of its rank.
1 2 3 4 5 6 7 8 9 10 In this experiment, we show a cursor hover distribution, and
1 compare it with the corresponding click distribution. Figure
Mean Rank Positions
Hovered or Clicked
2 5 shows both the number and proportion of cursor hovers
3 and clicks that occur on each of the top ten search result
4 links. Bars representing absolute counts are scaled by the
5
primary -axis (on the left), e.g., there are approximately
6
7
240,000 occurrences of the cursor hovering on the first
8 search result. Circles representing percentages are scaled by
9 the secondary -axis (on the right), e.g., 50% of result
10 clicks occur on the first search result.
As is typical in SERP interactions, users interact more with
Figure 4. Mean number of search results hovered over before top-ranked search results since they are in a more accessible
users clicked on a result (above and below that result).
Result clicks are red circles, result hovers are blue lines.
location and are generally more relevant. However, Buscher
et al. [5] reported that the distribution of clicks does not
Figure 4 shows that prior to clicking on a search result, always reflect the relative distribution of visual attention
people consider the surrounding search results. For exam- (measured by gaze in their study). Similarly, we find that
ple, before clicking on result 1, people also hover on results hovers are more evenly distributed across the top-ten results
2 and 3 on average; when they click on result 2 they also than clicks, and the hover rate is higher than clickthrough
hover on results 1, 3, and 4; etc. The findings are similar to rate for all ranks beyond the first position. There are pro-
those reported by Cutrell and Guan [9], but differ in that the portionally more clicks than attention on the top-ranked
search result hovers do not appear to extend as far above result, which is consistent with previously-reported bias
the clicked search result in cases where a result is clicked towards selecting one of the top organic results [18,22].
on far down the list (in positions 6–10). This may be be- This suggests that for lower-ranked search results, result
cause queries where low-ranked clicks are observed may hovers may correlate with clicks more than at top ranks.
have clearly irrelevant results in top ranks, and by exclud-
ing hovers of less than 100ms we miss rapid skims over 250K 60%
such irrelevant results. Cursor Hover Count
Number of Click or Hover Events
% of All Click or Hover Events
The findings also show that users consider many results Cursor Click Count 50%
200K
prior to turning their attention to the additional SERP fea- Cursor Hover (%)
tures: on average six results in the case of query sugges- Cursor Click (%) 40%
150K
tions, five results in the case of advertisements, and around
four results prior to re-querying. This behavior is similar to 30%
that reported in [9], at least in terms of re-querying, which 100K
is examined in both studies. Cutrell and Guan do report 20%
inspection further down the list (up to rank position 8) prior
50K
to re-querying, whereas we find that users hover on around 10%
4 results. One explanation for the difference is that the cur-
sor does not track well with eye movements in situations 0 0%
where users rapidly skim low-ranked search results. An 1 2 3 4 5 6 7 8 9 10
alternative explanation is that in naturalistic non-laboratory Search Result Position (rank)
settings, users may only consider the top-ranked search Figure 5. Frequencies and percentages of cursor hovers and
results prior to trying another query by clicking on a query clicks occurring on the search results. Percentages reflect the
suggestion or re-querying. proportion of hover or click events over all ten results.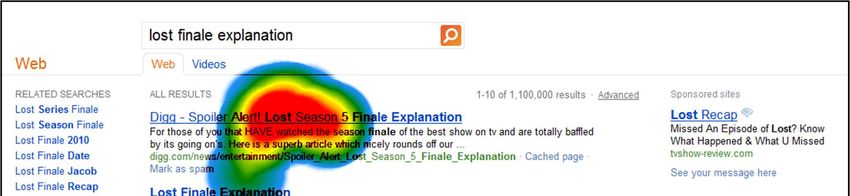
Unclicked Hovers                                                                            sults. However, when we consider that low ranked results
Finally, we are interested in seeing if hovering over a result                              typically have a low clickthrough rate, an unclicked hover
but not clicking on it can be a useful signal of user interest.                             on a low ranked result may actually provide implicit feed-
To examine this, we define an unclicked hover as an in-                                     back that the result is relevant. To show this, we overlay the
stance of the cursor hovering over a link but not clicking                                  click distribution on the chart to compare the probability
that link before being moved to another location on the                                     that an unclicked hover results in a later click (blue squares)
page. Table 2 shows the number of unclicked hovers on a                                     with the original probability that the search result will be
search result and the percentage of times that it was subse-                                clicked (red circles). We see that whether an unclicked hov-
quently clicked by the same user. Result clicks can occur                                   er is a positive or negative indicator depends on result rank.
without an unclicked hover when the user does not hover                                     To quantify the degree of this effect we compute the phi
over the result for at least 100ms and go to another location                               correlation ( ) across all queries. For the first search result,
on the page before coming back and clicking the result.                                     the presence of unclicked hovers negatively correlates with
                          Table 2. Percentage of unclicked hovers for which the             result clicks ( = −0.47), but for results at lower ranks, un-
                              hovered search result was eventually clicked.                 clicked hovers positively correlate with clicks ( = 0.59).
# unclicked
                                                                                            In this section we examined characteristics of cursor behav-
                                           0         1       2         3       4       5    ior during search result examination using data from a
hovers
                                                                                            large-scale study involving more than 20 thousand people
Result clicked                           7.0%   16.7% 19.0% 22.4% 23.3% 25.2%               and 360 thousand queries. We now turn to applications of
                                                                                            this data for improving our understanding of search.
When there are no unclicked hovers, the result is not very
likely to be clicked (only 7% of the time). Observing one or                                APPLICATIONS OF CURSOR DATA
more unclicked hovers dramatically increases the likelihood                                 There are a broad range of possible applications of large
of a result click, perhaps because it demonstrates that the                                 volumes of cursor tracking data, from query classification
user has attended to it. The more unclicked hovers the more                                 to search interface enhancements. In this section we present
likely the user will ultimately return to the result and click                              two applications mentioned earlier in this paper: estimating
it. The Pearson correlation between the number of un-                                       search result relevance and distinguishing good abandon-
clicked hovers and the percentage eventually clicked is                                     ment from bad abandonment. The first application makes
strong ( = 0.84), when considering up to 10 unclicked hov-                                  use of features from search result hovers, whereas the se-
ers. Thus the number of unclicked hovers on a result may                                    cond uses features derived from cursor trails.
help predict result clickthrough or perhaps result relevance.                               Estimating Search Result Relevance
Segmenting the unclicked hovers by the search result rank                                   One useful application of cursor movement data is for esti-
shows that result rank significantly affects unclicked hover                                mating search result relevance. At scale, these data could be
behavior. Figure 6 shows the proportion of each result rank                                 used as an additional data source to train search engine
that is eventually clicked after an unclicked hover.                                        ranking algorithms and boost retrieval performance. We
                                                                                            conducted a study in which we gathered human relevance
                          60%                                                               judgments for query-URL pairs, and examined the correla-
                                                                     Click                  tion between features of the cursor movements and the hu-
                          50%                                        Unclicked hover        man relevance judgments. In addition, we examined the
 Search Results Clicked

                                                                                            value that cursor movements provide compared with search
                          40%                                                               result clicks, the more traditional source of behavioral data
                                                                                            used to estimate search result relevance.
                          30%                                                               We obtained human relevance judgments for thousands of
                                                                                            queries as part of an ongoing evaluation of search engine
                          20%                                                               quality. Trained judges assigned relevance labels on a five-
                                                                                            point scale—Bad, Fair, Good, Excellent, and Perfect—to
                          10%                                                               top-ranked pooled Web search results for each query. This
                                                                                            provided hundreds of relevance judgments for each query.
                           0%
                                                                                            We intersected the judgment data with our cursor data, re-
                                1    2      3    4       5       6     7   8       9   10   sulting in 1,290 query-result URL pairs for which we had
                                         Search Result Position (rank)                      both explicit relevance judgments and cursor activity. These
                                                                                            pairs formed the basis of our analysis. We computed the
           Figure 6. Proportion of search results that are eventually                       following features for each pair:
             clicked after an unclicked hover, plotted against the
                       click distribution from Figure 5.                                    • Clickthrough rate: Fraction of the times that URL was
                                                                                              clicked when the query was issued (and URL returned).
The blue squares show that a search result is eventually
                                                                                            • Hover rate: Fraction of times that URL was hovered
clicked after an unclicked hover around 25% of the time for
                                                                                              over when the query was issued (and URL returned).
the top-ranked result and less than 15% for low-ranked re-
• Number of unclicked hovers: Median number of times                   Table 3. Correlations between click and hover features and
    for which the query was issued and the URL is hovered               relevance judgments for queries with and without clicks.
    on but not clicked, per the earlier definition. We selected         Result                                                  Correlation with
    the number of unclicked hovers as a feature because we             clicks or             Feature source                     human relevance
    found that it was correlated with clickthrough in our              no clicks                                                  judgments
    previous analysis.
                                                                                          Clickthrough rate (c)                           0.42
• Maximum hover time: The maximum time that the
                                                                                               Hover rate (h)                             0.46
    user spent hovering over the result per SERP instance.               Clicks
    We take the maximum as this indicates the point where                                 Unclicked hovers (u)                           -0.26
                                                                       (N=1194)
    the user was most interested in the result.                                            Max hover time (d)                            -0.15
As stated earlier, the clickthrough rate is commonly used to                                    Combined
                                                                                                                 1
                                                                                                                                          0.49
estimate the relevance of a URL to a query from behavioral
                                                                                                 Hover rate                               0.23
data [18], and is included in this analysis as a baseline.
                                                                       No clicks            Unclicked hovers                              0.06
We computed the Pearson correlations between each feature
and the human relevance judgments (represented numeri-                  (N=96)               Max hover time                               0.17
                                                                                                                 2
cally as a five-point scale ranging from 0 to 4 inclusive)                                      Combined                                  0.28
independently and in combination using linear regression.         1
                                                                      y = 2.25 – 0.1c + 1.38h – 0.08u – 0.12d;   2
                                                                                                                     y = 0.36 + 0.80h + 0.22u + 0.30d
Table 3 summarizes the findings, grouped by whether re-
                                                                  In this section we showed that the correlation between ex-
sults were clicked for the query. All correlations and differ-
                                                                  plicit relevance judgments and search activity increases
ences between correlations are significant at < 0.02 using        when cursor actions are added to clicks, especially when
Fisher’s transformations where appropriate.                       clicks are infrequent or unavailable.
The results of this analysis show that the use of cursor
                                                                  Differentiating Between Good and Bad Abandonment
tracking data can improve estimates of search result rele-
vance. Result hover features correlate better with human          A second application of cursor information is to distinguish
                                                                  between different types of abandonment. Abandonment
relevance judgments than clickthrough rates (0.46 vs. 0.42),
                                                                  occurs when searchers visit the search engine result page,
and they lead to an improved model when combined with
                                                                  but do not click. As noted in previous research [20], aban-
clickthrough (0.49 vs. 0.42). In addition, even when there
                                                                  donment can suggest that users are dissatisfied with the
are no clicks for a query, hover features show a reasonable
correlation with human judgments (0.28). This is particular-      search results (bad abandonment) or that they have found
                                                                  the answer directly on the SERP (good abandonment). For
ly important since many queries occur infrequently, result-
                                                                  example, for queries like [Vancouver weather] or [WMT
ing in little or no clickthrough data. Further analysis on the
                                                                  stock price], answers are typically shown on the SERP so
impact of query-URL popularity shows that hover features
                                                                  there is no need for people to click through to other pages.
provide most value over clickthrough rate when query-
                                                                  We now examine whether features of SERP cursor behavior
URLs are less popular. There are large and significant in-
creases in the correlation for query-URL pairs with fewer         can distinguish between good and bad abandonment.
than five instances in our cursor data (0.45 hover vs. 0.35       As reported in [20], it may be straightforward to estimate
click) and small and not significant for pairs with five or       good or bad abandonment for queries where search engines
more instances (0.59 hover vs. 0.58 click). Thus cursor data      offer special interface treatment (e.g., weather updates or
appears to be especially useful when click data is less plen-     stock quotes). A more challenging scenario is determining
tiful, which allows relevance estimates to be made for a          whether observed abandonment for other queries is good or
much larger range of queries.                                     bad. To study this we focused on selected queries from our
                                                                  log data that were short questions (ending in a question
The correlations between human judgments and unclicked
                                                                  mark) which could be answered by SERP snippets. A simi-
hovers and hover time are interesting as well. For clicked
                                                                  lar query class was also studied in earlier abandonment re-
queries, unclicked hovers and hover time are negatively
                                                                  search [20]. To identify examples of likely good abandon-
correlated with relevance judgments. This appears to con-
                                                                  ment in such cases, we performed some hand labeling.
tradict previous findings which suggested that hesitation
over a result is a positive indicator of relevance [21,23].       To determine whether these short questions were answered,
This may be because clicks often occur on top-ranked re-          one of the authors reviewed the SERPs returned to users
sults, where unclicked hovers are negatively correlated with      and identified whether an answer appeared in the snippet
clickthrough (as shown in Figure 6). For unclicked queries,       text of results. Judgments were made for results which were
we find small positive correlations between judgments and         hovered on for at least 100ms, indicating that they had been
all measures. Unclicked queries have fewer relevant results,      attended to but not clicked on. Of the 859 queries for which
leading to more exploration lower in ranked list (where           the SERPs were visually inspected, 184 (21%) contained
unclicked hovers are positively correlated with clicks).          the answer in the snippet content and hence were identified
                                                                  as likely examples of good abandonment. The remaining
                                                                  675 queries were classified as bad abandonment.
We computed summary measures that reflect how the cur- er-scale cursor data, and summarized search result examina-
sor was used on the SERPs. Specifically, we looked at cur- tion patterns evident in cursor activities. Finally, we pre-
sor trail length, cursor movement time, and cursor speed for sented two applications of these cursor data to improve es-
each SERP, defined as follows: timates of search result relevance and distinguish good from
• Cursor trail length: Total distance (in pixels) traveled bad search abandonment. We believe that these results are
by the cursor on the SERP. quite promising, but can be extended in several ways.
• Movement time: Total time (in seconds) for which the Our analyses report aggregate data averaged over all users
cursor was being moved on the SERP. and all queries. Some laboratory studies have shown differ-
• Cursor speed: The average cursor speed (in pixels per ences in search strategies for different people [2,10]. We
second) as a function of trail length and movement time. would like to examine the extent to which such individual
differences are also reflected in large-scale cursor behavior.
Table 4 shows the mean (M) and SEM for each measure. Additionally, page layouts for SERPs are constantly chang-
Table 4. Features of cursor trails for queries ing and differ between queries. We would like to better un-
associated with likely good and bad abandonment. derstand how SERP features such as advertisements, query
suggestions, or snippet presentation methods, as well as
Abandonment Type general component layout, influence cursor behavior. There
Feature Good Bad is also a need to study the effect of different methods of
M SEM M SEM scrolling (e.g., via the scrollbar or mouse scroll wheels) on
the cursor tracking data. Finally, we would like to extend
Cursor trail length (px) 1084 98 1521 71 our research to other search engines and a broader range of
Movement time (secs) 10.3 0.9 12.8 0.6 users from outside Microsoft Corporation.
Cursor speed (px/sec) 104 9 125 5 We demonstrated two applications of cursor tracking data at
Number of queries 184 675 scale: estimating search result relevance and distinguishing
good from bad search abandonment. In both cases, we
As can be seen from the table, our preliminary analysis re- showed clear value from leveraging large amounts of cursor
veals differences in trail length, movement time, and the tracking data. We showed that cursor features were useful
speed with which users moved their mouse cursor in good for queries with result clicks (where cursor data augment
and bad abandonment queries. Cursor trails were shorter in click data) and for queries without result clicks (where cur-
cases where good abandonment was likely, compared to sor data can be a reasonable substitute). We believe that
instances of bad abandonment. Searchers also spent less cursor features may also be used for other search-related
time moving the cursor, and moved the cursor more slowly tasks such as query classification or search ranking, and for
when answers were in the snippet (good abandonment). All a variety of other Web-based applications. .
differences between the measures for good and bad aban- Cursor data has qualitative uses as well. Usability tools that
donment were significant using independent measures - use cursor behavior (e.g., [1]) may be useful to search
tests (trail length: (857) = 2.58, = .01; movement time: quality analysts. For aggregate analysis of mouse move-
(857) = 2.20, = .03; cursor speed: (857) = 2.17, = .03). ments, heatmaps (such as those in Figure 2) can show
It appears that when the answer appears on the SERP, users where the interaction took place for different SERP features
need to consider fewer results, and move the cursor more or queries. Heatmaps allow analysts to quickly see aggre-
slowly as they examine snippet content in detail. These gate behavior across multiple query sessions or queries.
findings show that features of cursor trails, such as length, This may be useful for determining whether users notice
duration, and speed, are different for good and bad aban- new features and how cursor behavior changes following
donment. Further research will examine the extent to which their introduction.
these differences in feature values can be used to predict We are also interested in continuing to explore methods for
good and bad abandonment in operational settings for a summarizing cursor activity that incorporate interesting
broader set of queries. characteristics of search behavior but can also be collected
We now discuss the implications of these and other findings at large scale. Our current approach of only recording
presented in this paper for the design of search systems. movements after a 40ms pause precludes analysis of cursor
metrics such as acceleration. There may be alternative ap-
DISCUSSION AND IMPLICATIONS proaches for sampling cursor movement such as identifying
In this paper we explored how cursor data, which can be sub-movement boundaries [17]. Exploring efficient meth-
easily collected at scale, can be used to augment more ods to tune the trade-off between performance and data
commonly-used click measures to provide a richer picture granularity is an important next step.
of how searchers interact with search result pages. In Study
1 we extended previous work on the relationship between CONCLUSIONS
gaze and cursor using a large laboratory study. In Study 2 We described a study of mouse cursor behavior on SERPs
we developed and deployed a system to collect much larg- combining eye-tracking findings with analysis of large-scale cursor data. We: (i) show that cursor and gaze position 12. Q. Guo and E. Agichtein. Exploring mouse movements
are correlated especially on search result pages, confirming for inferring query intent. Proc. SIGIR ‘10, 707–708.
and extending previous findings, (ii) develop a scalable 13. Q. Guo and E. Agichtein. Ready to buy or just brows-
approach to capturing cursor movements at scale and ana- ing? Detecting web searcher goals from interaction da-
lyze search behavior evident in these data; and (iii) demon- ta. Proc. SIGIR ‘10, 130–137.
strate the value of cursor features in two applications (esti- 14. Q. Guo and E. Agichtein. Towards predicting web
mating search result relevance and distinguishing good and searcher gaze position from mouse movements. Ext.
bad search abandonment). Our study adds to the general Abstracts CHI ‘10, 3601–3606.
understanding of how users examine search results, which 15. Y. Hijikata. Implicit user profiling for on demand rele-
is typically difficult to study in naturalistic settings on a vance feedback. Proc. IUI ‘04, 198–205.
large-scale, and demonstrates utility of these data in search- 16. J. Huang and A. Kazeykina. Optimal strategies for re-
related applications. Future work will explore enhance- viewing search results. Proc. AAAI ‘10, 1321–1326.
ments to the applications presented and investigate the ap-
17. R.J. Jagacinski, D.W. Repperger, M.S. Moran, S.L.
plicability of our general approach to recording cursor Ward, and B. Glass. Fitts’ law and the microstructure of
movements at scale in settings beyond search. rapid discrete movements. J. Exp. Psychol. [Hum. Per-
ACKNOWLEDGMENTS cept.], 1980, 6(2), 309–320.
We thank Danny Bain, Craig Miller, Sarvesh Nagpal, and 18. T. Joachims, L. Granka, B. Pan, H. Hembrooke, F.
other members of the Bing team, for help with the devel- Radlinski, and G. Gay. Evaluating the accuracy of im-
opment and deployment of the cursor tracking code. plicit feedback from clicks and query reformulations in
REFERENCES Web search. ACM Trans. Inform. Syst., 25(2), 2007.
1. E. Arroyo, T. Selker, and W. Wei. Usability tool for 19. R. Kohavi, R. Longbotham, D. Sommerfield, and R.M.
analysis of web designs using mouse tracks. Ext. Ab- Henne. Controlled experiments on the Web: Survey
stracts CHI ‘06, 484–489. and practical guide. Data Mining and Knowledge Dis-
covery, 18(1), 2009, 140–181.
2. A. Aula, P. Majaranta and K-J. Raiha. 2005. Eye-
tracking reveals personal styles for search result evalu- 20. J. Li, S. Huffman, and A. Tokuda. Good abandonment
ation. Proc. INTERACT ‘05, 1058–1061. in mobile and PC internet search. Proc. SIGIR ‘09, 43–
50.
3. G. Buscher, E. Cutrell., and M.R. Morris. What do you
see when you’re surfing? Using eye tracking to predict 21. C. Liu and C. Chung. Detecting mouse movement with
salient regions of web pages. Proc. CHI ‘09, 21–30. repeated visit patterns for retrieving noticed knowledge
components on web pages. IEICE Trans. Inform. &
4. G. Buscher, A. Dengel, and L. van Elst. Eye move-
Syst., 2007, E90-D(10), 1687–1696.
ments as implicit relevance feedback. Ext. Abstracts
CHI ‘08, 2291–2996. 22. L. Lorigo, B. Pan, H. Hembrooke, T. Joachims, L.
Granka, and G. Gay. The influence of task and gender
5. G. Buscher, S. Dumais, and E. Cutrell. The good, the
on search and evaluation behavior using Google. In-
bad, and the random: An eye-tracking study of ad qual-
form. Process. Manage., 42(4), 2006, 1123–1131.
ity in web search. Proc. SIGIR ‘10, 42–49.
23. F. Mueller and A. Lockerd. Cheese: Tracking mouse
6. M.C. Chen, J.R. Anderson, and M.H. Sohn. What can a
movement activity on websites, a tool for user model-
mouse cursor tell us more?: correlation of eye/mouse
ing. Ext. Abstracts CHI '01, 279–280.
movements on web browsing. Ext. Abstracts CHI ‘01,
281–282. 24. G. Pass, A. Chowdhury, and C. Torgeson. 2006. A pic-
ture of search. Proc. InfoScale ‘06, 1.
7. M. Claypool, P. Le, M. Wased, and D. Brown. Implicit
interest indicators. Proc. IUI ‘01, 33–40. 25. K. Rodden and X. Fu. Exploring how mouse move-
ments relate to eye movements on web search results
8. N. Craswell, O. Zoeter, M. Taylor, and B. Ramsey. An
pages. Workshop on Web Information Seeking and In-
experimental comparison of click position-bias models.
teraction at SIGIR ‘07, 29–32.
Proc. WSDM ‘08, 87–94.
26. K. Rodden, X. Fu, A. Aula, and I. Spiro. Eye-mouse
9. E. Cutrell and Z. Guan. What are you looking for?: An
coordination patterns on web search results pages. Ext.
eye-tracking study of information usage in web search.
Abstracts CHI '08, 2997–3002.
Proc. CHI ‘07, 407–416.
27. B. Shapira, M. Taieb-Maimon, and A. Moskowitz.
10. S. Dumais, G. Buscher, and E. Cutrell. Individual dif-
Study of the usefulness of known and new implicit in-
ferences in gaze patterns for web search. Proc. IIiX ‘10,
dicators and their optimal combination for accurate in-
185–194.
ference of users interests. Proc. SAC '06, 1118–1119.
11. J. Goecks and J. Shavlik. Learning users’ interests by
28. K. Wang, T. Walker, and Z. Zheng. PSkip: Estimating
unobtrusively observing their normal behavior. Proc.
relevance ranking quality from web search click-
IUI ‘00, 129–132.
through data. Proc. KDD '09, 1355–1364.You can also read


