Public insurance and climate change (part one): Past trends in weather-related insurance in New Zealand - Motu Working Paper 18-09 Motu Economic ...
←
→
Page content transcription
If your browser does not render page correctly, please read the page content below

Public insurance
and climate change
(part one): Past
trends in weather-
related insurance in
New Zealand

David A. Fleming, Ilan Noy, Jacob
Pástor-Paz and Sally Owen
Motu Working Paper 18-09
Motu Economic and Public Policy
Research
July 2018
Public insurance and climate change (part one): Past trends in weather-related insurance in New Zealand

Document information
Author details
Dr David A. Fleming
Motu Economic and Public Policy Research

Professor Ilan Noy (corresponding author)
Victoria University of Wellington
ilan.noy@vuw.ac.nz

Jacob Pástor-Paz
Victoria University of Wellington

Sally Owen
Motu Economic and Public Policy Research

Acknowledgements
We gratefully acknowledge funding from New Zealand (NZ) Ministry of Business, Innovation and
Employment through the Deep South National Science Challenge’s (Deep South) Impacts and
Implications Programme and the Resilience National Science Challenge. We also thank the NZ
Earthquake Commission (EQC) for their claims data and the Deep South NSC for facilitating
access to NIWA’s historic and projected precipitation data. Thanks to Geoffrey Spurr, Isabelle Sin
and to audiences from our presentations at the NZ Treasury seminar series, the Deep South
seminar series, and the NZ Association of Economists annual conference, for all comments and
suggestions.

Disclaimer
All opinions are those of the authors. We are also responsible for all errors and omissions.

Motu Economic and Public Policy Research
PO Box 24390         info@motu.org.nz           +64 4 9394250
Wellington           www.motu.org.nz
New Zealand
© 2018 Motu Economic and Public Policy Research Trust and the authors. Short extracts, not exceeding
two paragraphs, may be quoted provided clear attribution is given. Motu Working Papers are research
materials circulated by their authors for purposes of information and discussion. They have not
necessarily undergone formal peer review or editorial treatment. ISSN 1176-2667 (Print), ISSN 1177-
9047 (Online).
                                                          i
Public insurance and climate change (part one): Past trends in weather-related insurance in New Zealand

Abstract
Climate change appears to be increasing the frequency and magnitude of extreme weather
events, negatively affecting communities as well as posing long-term sustainability challenges to
insurance (risk transfer) mechanisms. New Zealand’s public natural hazard insurer, the
Earthquake Commission (EQC), covers homeowners for damage to land (and in some cases to
dwellings and contents) caused by landslip, storm or flood. We comprehensively explore the
EQC claims data to investigate these weather-related claims from 2000-2017. We find no clear
upward trend yet emerging in the number of claims or their value. We find that the northern
regions of both islands are the source of most claims, that only a handful of weather events
caused a large proportion of EQC’s weather-related pay-outs, that the average property lodging a
weather-related claim is located twice as close to the coast as the national average, and that
properties with claims usually are cited on much steeper land than the typical property in New
Zealand. We also explore their relation between claims and socio-economic characteristics,
finding that higher income neighbourhoods appear to be those most benefiting from the EQC
coverage for weather events.

JEL codes
G22, G28, Q51, Q54, Q58, R28

Keywords
climate change, extreme weather, natural hazards, public insurance, New Zealand

Summary haiku
Climate change concern:
many insurance costs from
weather already

                                                       ii
Public insurance and climate change (part one): Past trends in weather-related insurance in New Zealand
Table of Contents
1 Introduction and Overview 5
2 NZ public natural hazard insurance and climate change 7
2.1 Placing the NZ system in a global context 7
2.2 The NZ Earthquake Commission (EQC) 7
2.3 Coverage of weather-related events by EQC 7
3 EQC weather-related claim information 8
4 EQC claim pay-outs compared to private insurance data 13
4.1 Private weather related insurance payment data 14
4.2 Comparing the EQC claim pay-outs to this private data 14
5 Weather-related insurance and historic weather data 16
5.1 Including NZ Historic Weather Events information 16
5.2 Comparing the insurance information to this weather data 16
6 Regional analysis including population and real estate data 18
6.1 Geographic, population, property and land data Error! Bookmark not defined.
6.2 Investigating public insurance distribution by region 18
6.3 Does distance to the ocean correlate with weather related claims? Error! Bookmark not defined.
6.4 Does property slope correlate with weather-related claiming? 21
7 Investigating socioeconomic characteristics 22
7.1 Meshblock-level census data Error! Bookmark not defined.
8 Discussion and conclusions 27
References 29
Appendix 30
Recent Motu Working Papers 31
iiiPublic insurance and climate change (part one): Past trends in weather-related insurance in New Zealand
List of Tables and Figures
Table 1 - Descriptive statistics: NZ Landslip/Storm/Flood claims (2000 - 2017) 9
Table 2: Eleven recent New Zealand weather events which triggered significant insurance pay-outs 17
Table 3: Investigating public weather-related insurance information between 2000 and 2017, across regions 19
Table 4: Distances of properties to the ocean 21
Table 5: Socioeconomic characteristics of meshblocks with and w/o EQC weather-related claims 23
Table 6: Claims and total pay-outs across meshblocks, by income quintiles 26
Table 7: Claims and total pay-outs across meshblocks, by population growth quintiles 27
Figure 1: Map of locations of EQC-weather related claims 10
Figure 2: Total number of weather-related claims received by EQC per year 11
Figure 3: Number of weather-related claims, by month of claim lodging 12
Figure 4: EQC weather-related claim pay-outs over time 13
Figure 5: Total value of weather-related: EQC pay-outs (upper) and private insurance payments (lower) 15
Figure 6: Slopes of properties for buildings with and without claims 22
Figure 7: Median income distribution across meshblocks in 2001 25
ivPublic insurance and climate change (part one): Past trends in weather-related insurance in New Zealand
1 Introduction and Overview
The world appears to already be facing higher frequency and intensity of natural hazards and
disasters associated with extreme precipitation (landslips, floods and storms), compounded by
sea level rise. All as a consequence of climate change (IPCC, 2012; IPCC 2014; UNISDR, 2015).
Compounding this, the exposure of communities to hazard events is likely to rise further, due to
people continuing to move to areas that are more weather-risk-prone such as coasts and river
deltas (Noy, 2016).
In this paper, we study New Zealand (NZ), an island nation exposed to oceanic storms. NZ
has seen many weather events affecting communities across the country in the last 20 years
(ICNZ, 2018). Using insurance data, we investigate this risk in NZ and analyse the data from
insurance claims received by the NZ public natural hazard insurer, the Earthquake Commission
(EQC).
Insurance systems are a key financial risk transfer tool used by millions of households
across the world to ameliorate adverse financial consequences from unlikely (small probability)
disasters. As such, insurance systems have proven both popular and useful for the economic
recovery and prosperity of entire regions, communities and households (Mills, 2005). In NZ,
more than 90% of households purchase private residential property insurance. Since 2000, NZ
households have received more than $1.4 billion in insurance compensation related to extreme
weather events (ICNZ 2018). The focus of this paper is the coverage for weather-related
events—landslips, storms, and floods.1 The data we use includes more than 26,000 weather-
related claims lodged between 2000 and 2017 to the EQC. It allows us to identify households
affected by extreme weather events, geographically and over time.
We use these EQC claims to observe how weather-related events have translated into
financial liabilities for the Crown, through EQC claim pay-outs after weather events. We analyse
how these claims are distributed across the country given their geophysical characteristics and
the socio-economic characteristics of the affected neighbourhoods.
1 Note that we are only interested in landslips caused by weather events (usually excessive rain), and not landslips
triggered by earthquakes.
5Public insurance and climate change (part one): Past trends in weather-related insurance in New Zealand
Further to the public insurance data, we utilise:
• extreme weather events across the country from the Historic Weather Events Catalog (NIWA,
2018a),
• neighbourhood demographic and socio-economic information from the NZ Census (StatsNZ,
2018),
• Topographic and land cover features (LINZ, 2018), and
• aggregated private insurance payments for each weather event (ICNZ, 2018).
We used open-source QGIS software to map the main features of these datasets and
associated them with the geo-referenced EQC claim information.
Our work shows that Northland and the Bay of Plenty are the regions with the highest
proportions of people and properties affected by weather events in the North Island of New
Zealand. In the South Island, the Nelson and Tasman regions are the most affected. Since 2000,
there have been five significant weather events (four of which happened in these regions),
which account for around a third of the total weather-related pay-outs made by EQC. We find
that, even though most properties in New Zealand are located close to the coast, properties
reporting claims to EQC are located even closer. While the average property in NZ is
approximately 11km away from the coast, the average property lodging a claim to EQC after a
weather event is located only 6km away. Though the quantity of claims is highly correlated with
population, there is no clear correlation between claim frequency (or pay-outs) and population
growth. The topography (slope) does, however, appear to be a determining factor.
Finally, we show that weather-related EQC claims tend to come from areas with higher
median incomes. We found that areas in the top two income quintiles tend to report more than
half of the total claims and pay-outs made. This finding suggests that after extreme weather
events, higher income families may make more use of EQC insurance coverage than the average
New Zealand family. The reasons for this increase in EQC pay-outs associated with higher
income households are not entirely clear. They could be associated with better access to the
system, higher exposure due to location choice, higher damages caused by higher asset values,
or having more land exposed.
Generally, household-level private insurance information on claims is unavailable for
research purposes. NZ’s publicly funded insurance system therefore provides a novel and
enlightening source of insurance data. For NZ, this study is the first in-depth analysis of EQC
claims data for weather-related events. Worldwide it is one of very few studies that uses
property level insurance claims data to analyse the impacts generated by weather events.2
This paper is the first in a series which ultimately aims to project the financial liability
from climate change for the EQC. Here, we have only begun to provide insights about the
2 See Kusuma et al. (2017) and Savitt (2017) for recent surveys of this literature, and Surminski (2014) for specific
discussion of flood insurance.
6Public insurance and climate change (part one): Past trends in weather-related insurance in New Zealand
increasing risk that current and future residential areas might face, given the possibility of
increasing frequency of extreme weather events.
2 NZ public natural hazard insurance and climate change
In this section we briefly describe other public natural hazard systems globally, give more
detailed background on the New Zealand system, and how weather-related coverage works in
NZ.
2.1 Placing the NZ system in a global context
There are at least fifteen public or public-private established natural hazard insurance systems
worldwide for personal property. Of these:
• some cover homeowners for a range of natural hazards (Austria, Belgium, France, Iceland,
Norway, NZ, Romania, Spain, Switzerland),
• a handful relate only to flood insurance (USA, UK, Denmark) and
• two state-level programs cover windstorm damage (Florida and Texas in the USA)3.
All these insurance systems cover hazards for which frequency and intensity will likely be
affected by climate change. The EQC scheme belongs to the group of schemes covering
homeowners for a range of different types of natural hazards.
2.2 The NZ Earthquake Commission (EQC)
Government-provided earthquake insurance started in NZ in 1944, after several devastating
earthquakes. The Earthquake Commission Act (1993) specifies that, in addition to covering
damages from seismological hazards, EQC will also provide insurance cover for residential
properties affected by landslips, and for damages to land on which houses are located as a
consequence of storms and floods.
2.3 Coverage of weather-related events by EQC
EQC’s main function is to insure homes, their contents and the land below and around them
against damages by earthquakes, volcanic eruptions, natural landslips, hydrothermal activities,
and tsunamis. Cover also includes fire following any of these disasters. This cover includes
buildings, contents, and the land on which the insured residential property is located.
Additional cover is also provided for residential land damaged by storm or flood; this
cover is available for land only (EQC, 2011). It is precisely these last types of cover (land for
3 Owen and Noy (2017).
7Public insurance and climate change (part one): Past trends in weather-related insurance in New Zealand
storms and floods), and landslips (following weather events), that we focus, as they directly
relate to weather events. This coverage is classified in EQC’s database as a single category called
“landslips/storms/flood”.
In contrast with earthquakes and geothermal hazards, EQC does not cover all types of
damages that may result from floods and storms. The cover mostly focuses on the land
underneath and surrounding residential properties. This is unusual as, in most countries, land is
not an independently insurable asset.
The unusual aspect of this coverage is exemplified by EQC’s statement that:
“The market failure arguments for EQC’s cover of landslips, and land cover for
storm and flood, are arguably not as strong as for events such as earthquakes
and volcanoes. Nonetheless, any changes in cover would need to be carefully
considered to identify the likely functioning of private markets in that area, and
ensure that the transfer of risks and benefits was appropriate, particularly given
historic land use decisions.” (EQC, 2011).
3 EQC weather-related claim information
In this section we describe our primary data; claims and property information from the
Earthquake Commission (EQC).
We were fortunate to have access to all the EQC insurance records. Since 1980, EQC has
received over half a million claims. Four percent of all claims have been classified under the
“landslip/storm/flood” category, i.e. relate to weather events. This represents more than 25,000
claims paid by EQC as a consequence of weather shocks in the last 18 years. These have a total
value close to NZ$ 300 million.4
The claim dataset includes information about the date of the event, the claim itself (e.g. its
status), and the amount paid by the EQC. The dataset can be linked by a unique property
identifier to another dataset that contains location information (longitude latitude pairs with a
70m anonymization offset) and property characteristics (e.g. construction type, wall materials).
These records are unreliable for the period before the late nineties, and therefore we restrict
our sample to post-millennium events, which make up 26,180 claims. Table 1 contains summary
statistics for this sample.
4 $1 NZD ~ $0.75 USD (as of February 2018)
8Public insurance and climate change (part one): Past trends in weather-related insurance in New Zealand
Table 1 - Descriptive statistics: NZ Landslip/Storm/Flood claims (2000 - 2017)
Total number of claims received 26,180
Claims with property location data 18,930
Unresolved claims 803
Claims from properties that had lodged a prior claim 2,194
Total amount paid for land damages (millions) $ 198.89
Total amount paid for building damages (millions) $ 92.99
Total amount paid for contents damages (millions) $ 2.62
Number of resolved claims - including zeroes 25,377
Mean amount paid - all resolved claims including zeroes $ 11,420
Standard deviation of amount paid - all resolved claims including zeroes $ 40,340
Number of resolved claims - excluding zeroes 14,546
Mean amount paid - all resolved claims excluding zeroes $ 19,930
Standard deviation of amount paid - all resolved claims excluding zeroes $ 51,670
Notes: This table contains descriptive statistics, for claims classified as ‘Landslip/Storm/Flood’, which
were lodged with New Zealand’s public natural hazard insurer (the NZ Earthquake Commission “EQC”)
between Jan 2000 and Oct 2017. “Claims with property location data” refer to those for which EQC hold
the data to link the claim’s unique property identifier to longitude-latitude coordinates. Unresolved
claims are those which EQC classify as ‘Open’ – where the claim has not yet been settled. A prior claim
refers to claim lodged relating to a different weather event. ‘Zeroes’ refer to claims which were lodged but
for which the records indicate that the EQC did not pay out. All monetary values are expressed in 2017 NZ
dollar values (specifically, by inflation using the NZ CPI to the second quarter of 2017). All claims exclude
GST.
As seen in Table 1, there are 18,930 geo-referenced claims (see Figure 1 for a map of
these). There are 803 claims that have an ‘open’ status as of dataset retrieval (October 2017),
meaning they have not been officially resolved. However, as some of these claims do report pay-
outs made by October 2017, we include their values in aggregated analyses. By restricting our
sample to resolved claims that receive a non-zero pay-out, the average weather-related claim
payment reached NZ $19,930.
For households to be covered by EQC the property is required to be covered for fire
damage by a private insurer. EQC claim data shows that there were 3,785 households that did
not verify a private insurer to EQC. An additional 54 claims were from properties that had
already lodged a claim in the same event, resulting in a zero pay-out as consequence of being a
repeated claim (damages, if valid, were covered in the original claim). After removing these
9Public insurance and climate change (part one): Past trends in weather-related insurance in New Zealand
claims, we still have 6,992 settled claims where the zero pay-out could be explained by points c)
to f) below.5
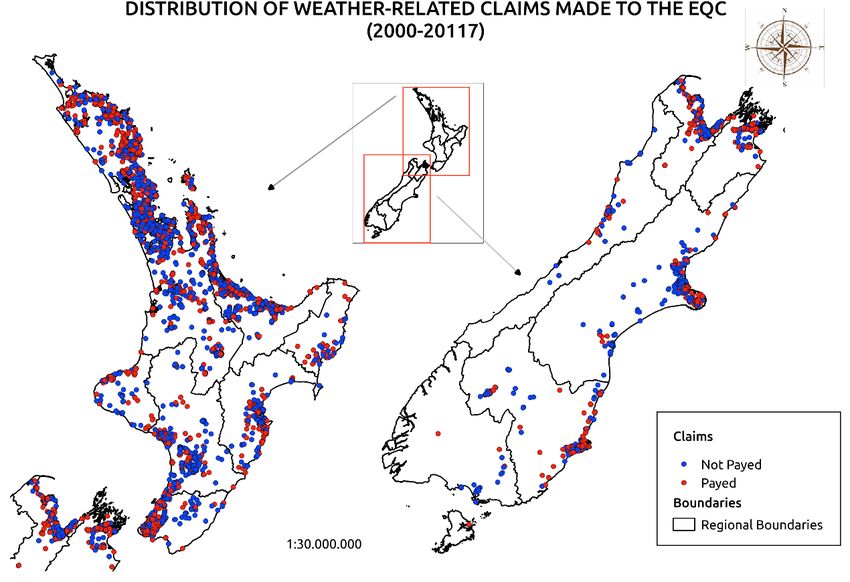
Figure 1: Map of locations of EQC-weather related claims
Not paid
Paid
Notes: This figure shows the location of weather related claims made to New Zealand’s public natural
hazard insurer (the New Zealand Earthquake Commission [EQC]) from January 2000 to October 2017.
Weather related claims are those classified in a single category as “Landslip/Storm/Flood”, which exclude
earthquake-related landslips. Of the 26,180 weather-related claims lodged in this period, only 18,930 are
able to be linked to a geo-referenced property ID and thus mapped. Claims which are “not paid” had not
yet been resolved as at time of data retrieval.
Of the total number of claims that were settled, 41% record a pay-out of zero. Reasons
that may explain a zero pay-out include:
a) the household did not have private insurance (3,785 households)
b) claims referred to damages already assessed and covered (i.e. the record is a duplicate)
c) the damage was outside scope (EQC’s limits covered land damage to 8 meters around the
covered buildings, plus the main access way to the property)
d) the cost was under excess ($500 for land damages)
e) the damage was assessed to be caused by something other than landslip/storm/flood (e.g.
was pre-existing damage)
f) the claim was made after the deadline for submitting claims had passed (the deadline to
submit is 3 months after the event)
5 An extra 424 settled claims have a pay-out of zero after being rejected by EQC for building damages coverage, but
the specific reasons are not explained.
10Public insurance and climate change (part one): Past trends in weather-related insurance in New Zealand
Regarding the temporal dimension of the data, the claims range from January 2000 to
October 2017. The number of claims received per year are shown in Figure 2. There is no
discernible trend in terms of the number of weather related claims made over these years.
Figure 2: Total number of weather-related claims received by EQC per year
2,500
2,000
Number of claims
1,500
1,000
500
0
2000 2001 2002 2003 2004 2005 2006 2007 2008 2009 2010 2011 2012 2013 2014 2015 2016 2017
Notes: This figure shows the annual number of weather-related claims (those classified as
“Landslip/Storm/Flood”) made to New Zealand’s public natural hazard insurer (the New Zealand
Earthquake Commission [EQC]) between Jan 2000 - Oct 2017. This dataset is made up of 26,180 claims,
including those which do not have a geo-reference, are unresolved, or have recorded a zero pay-out claim.
In Figure 3 we show the average number of claims received in each month across years, to
better understand the distribution of claims received within a year. There is a clear seasonal
pattern, with a concentration of claims in winter months (May-August, with a distinctive peak in
July) and in summer months (December-February).6 This pattern relates to the concentration of
storms in winter months, and heavy rainfall events that can occur during summer such as ex-
tropical cyclones. Spring and autumn report consistently fewer claims, which reflects the lower
average frequency and intensity of damage-causing extreme weather events in these months.
6 Note to the reader: New Zealand is located in the southern hemisphere, so seasons are opposite to the northern
hemisphere.
11Public insurance and climate change (part one): Past trends in weather-related insurance in New Zealand
Figure 3: Number of weather-related claims, by month of claim lodging
4,000
3,500
3,000
Number of claims
2,500
2,000
1,500
1,000
500
0
Jan Feb Mar Apr May Jun Jul Aug Set Oct Nov Dec
Note: This figure shows the number of weather related claims lodging (classified as
“Landslip/Storm/Flood”) by month of claim, made to New Zealand’s public natural hazard insurer (the
New Zealand Earthquake Commission [EQC]) between January 2000 - December 2016. This figure
excludes claims in 2017 as we only have data till October of 2017. This dataset is made up of 24,478
claims, including those which are non-geo-referenced, unresolved or zero pay-out claims.
In Figure 4 we present a series of EQC weather-related claim pay-outs by month, since 2000.
There are five clear peaks in 2005, 2008, and on three occasions in 2011. These are discussed in
more detail in Section 5, where we introduce detailed historic weather information. Once again,
there is no clear upward trend in this series.
12Public insurance and climate change (part one): Past trends in weather-related insurance in New Zealand
Figure 4: EQC weather-related claim pay-outs over time
20000 $NZD)
(thousand15000
10000
Total payment
5000
0
2000.01.01 2002.01.01 2004.01.01 2006.01.01 2008.01.01 2010.01.01 2012.01.01 2014.01.01 2016.01.01 2018.01.01
Date recorded for weather-related event triggering claim
Notes: This figure shows the total pay-outs for weather-related claims made to New Zealand’s public
natural hazard insurer (the New Zealand Earthquake Commission [EQC]) from January 2000 to October
2017. Weather-related claims are those classified in the single category of “Landslip/Storm/Flood”, which
excludes earthquake-related landslips.
In terms of location of the properties making claims, EQC provides the properties’ location
(latitude and longitude) with a 70-metre rounding. This data was originally supplied to EQC by
Corelogic (2018). In the map (figure 1) it is seen that, not surprisingly, most claims are located
in the larger population centres of the country. The highest concentration of claims is found in
metropolitan Auckland, the largest city in New Zealand. Wellington and Christchurch (the
second and third largest cities) also report a high concentration of claims. However, it is worth
noting that some less populated areas, such as the Bay of Plenty (on the east coast of the North
Island) and the Nelson/Abel Tasman region (at the northern tip of the South Island), also
present a significant concentration of claims, suggesting their exposure and vulnerability to
extreme weather events.
4 EQC claim pay-outs compared to private insurance data
In this section we introduce a second dataset, of aggregated private insurance payments, and
compare this to our EQC dataset.
13Public insurance and climate change (part one): Past trends in weather-related insurance in New Zealand
4.1 Private weather-related insurance payment data
Our second dataset is sourced from the Insurance Council of New Zealand (ICNZ, 2018). These
aggregated private insurance figures include data from all insurers who are members of the
Insurance Council of New Zealand (ICNZ). As ICNZ members underwrite more than 90% of all
policies underwritten in NZ, this captures a very large proportion of the private market.
Unfortunately, these data are available by disaster event only, and do not include details on
number of claims or location of properties. We create a sample from this dataset containing the
total reported dollar values of private insurance payments related to “weather-related natural
disasters” in NZ. Droughts are not included. (ICNZ, 2018)
4.2 Comparing the EQC claim pay-outs to this private data
Figure 5 presents the total value paid out by EQC over the years since 2000. The pay-out values
follow a similar pattern to that of the number of claims described earlier, and shown in Figure 2.
2011 is highlighted as an expensive year for weather-events for EQC, 2005 reported the 3rd
highest pay-out across years, but is only 6th in terms of numbers of claims received. As we detail
later, this is likely explained by one particular event that triggered the highest total pay-out
made by EQC for a single event since 2000 (see Table 2).
In addition to the sum of property level pay-outs from EQC, in Figure 5 we also present
the total annual values paid by NZ private insurers after a weather-related disaster. An
important point to emphasise is that the scale of the bottom chart is around five times larger
than the upper one: the total amounts paid by private insurance are much higher than those
paid by EQC. This is expected, since EQC only covers specific damages, while private insurance is
generally liable for a wider range of property damages (including damages to commercial
properties and flood-related damage to dwellings).
Figure 5 shows that in the early 2000s, there were fewer costly events affecting
properties in NZ, while more damages occurred after 2004. There were low liability years for
private insurance in 2009 and 2012. 2011 is remarkable: while for EQC it was the year with the
highest relative financial burden, for private insurers it was below the average. These
differences suggest that the 2011 events, on average, damaged more land than property
structures compared to other years. The last year for which we have data, 2017, also presents
an interesting contrast, as it was the costliest year for private insurers, but less exceptional for
the public system.
14Public insurance and climate change (part one): Past trends in weather-related insurance in New Zealand
Figure 5: Total value of weather-related: EQC pay-outs (upper) and private insurance payments (lower)
60
EQC pay-outs ($NZD millions)
50
40
30
20
10
0
2000 2001 2002 2003 2004 2005 2006 2007 2008 2009 2010 2011 2012 2013 2014 2015 2016 2017
300
Private insurance payments ($NZD millions)
250
200
150
100
50
0
2000 2001 2002 2003 2004 2005 2006 2007 2008 2009 2010 2011 2012 2013 2014 2015 2016 2017
Note: This figure compares public and private weather-related insurance pay-outs per year, between
2000 and 2017. The upper panel shows the annual sum of property-level weather-related pay-outs
(classified in a single category as “landslip/storm/flood”) by New Zealand’s public natural hazard insurer
(the New Zealand Earthquake Commission [EQC]) between January 2000 and October 2017. All EQC pay-
outs exclude GST, and are expressed in 2017 New Zealand (NZ) dollar values (specifically, these were
adjusted using the NZ CPI to the second quarter of 2017). In the lower panel, we present the total
reported dollar values of private insurance payments related to “weather-related natural disasters” in NZ.
Drought are not included. These aggregated private insurance figures report to include data from all
insurers who are members of the Insurance Council of New Zealand (ICNZ). ICNZ members underwrite
more than 90% of the policies underwritten in NZ. These data are available by disaster event only, and do
not include details on number of claims or their locations. This data is sourced from ICNZ (2018).
15Public insurance and climate change (part one): Past trends in weather-related insurance in New Zealand
5 Weather-related insurance and historic weather data
In this section we introduce weather and geographic data, and compare both the public and
private weather-related insurance claims to these.
5.1 Including NZ Historic Weather Events information
The NZ Historic Weather Events data is provided in NIWA’s online catalogue. This dataset
contains date information, an event name, and extensive characteristics associated with the
event such as location of the impacts, description of the effects, and type of hazard (storm, flood,
etc.) (NIWA 2018a). This information can be linked to the insurance data by comparing weather
date and location to property coordinates and date of claim. The web link for the particular
events from this historic weather database, where we obtain the name and characteristics of
most of the events used in our analysis, is provided in the Appendix. The only exception was the
event ‘Lower North Island flooding/wind’, which was not recorded by NIWA (2018a), but was
included in the ICNZ (2018) dataset.
5.2 Comparing the insurance information to this weather data
In Table 2, we present information on the dates between 2000 and 2017 which led to the
highest total public and private insurance pay-outs. In addition to pay-out figures, this table also
reports the number of weather-related claims received by EQC for that date, as well as the total
amounts paid by private insurance companies for the full events.
This data sheds light on our earlier Figure 4, which had five obvious peaks. Three out of
the five events happened in the north of the North Island, while the others occurred in the north
of the South Island (Nelson/Abel Tasman region). This spatial identification aligns well with the
fact that these are the two regions of NZ most exposed to ex-tropical cyclones and storms from
the Pacific Ocean. It was the 2005 flooding event in the Bay of Plenty - Waikato region which
generated the highest pay-out for EQC.
16Public insurance and climate change (part one): Past trends in weather-related insurance in New Zealand
Table 2: Eleven recent New Zealand weather events which triggered significant insurance pay-outs
(1) (2) (3) (4) (5)
Sum of EQC claim pay-
Number of EQC Paid by NZ private insurance
Date of beginning of Weather event outs for first day of
claims for first following full event
weather event characteristics event
day of event ($NZD)
(2017 $NZD)
Bay of Plenty and Waikato Flooding
2005.05.18 795 $21,400,000 $28,500,000
heavy rain
North Island Weather Bomb
2008.07.26 890 $15,900,000 $26,700,000
high winds, seas and rainfall in several regions of the country
Hawke's Bay Flooding
2011.04.25 429 $15,700,000 $6,400,000
four days of heavy rain
Tasman-Nelson Heavy Rain and Flooding
2011.12.14 964 $15,600,000 $16,800,000
no description
Ex-tropical Cyclone Wilma
2011.01.29 815 $15,000,000 $19,800,000
two days of heavy rain affecting the north of the country
Northland Flooding
2007.03.29 630 $9,400,000 $12,500,000
three days of heavy rain
North Island Heavy Rain and Flooding
2017.03.07 525 $6,100,000 $61,700,000
seven days of heavy rain
Lower North Island flooding/wind
2016.11.10 461 $5,400,000 $9,100,000
no description
Upper North Island Flooding and High Winds
2007.07.09 323 $5,400,000 $68,600,000
three days of heavy rain
North Island Storm
2004.02.16 1329 $5,000,000 $112,000,000
six days of heavy rain
New Zealand Storm
2015.06.20 440 $5,000,000 $41,500,000
one week of intense rain in western areas of the South and North Islands
Notes: This table contains information on the weather events in New Zealand between 2000 and 2017 which led to the highest total pay-out from New Zealand’s public insurer (the Earthquake
Commission (EQC)). Column (1) contains date information in YYYY.MM.DD form for the first day of the weather event. Column (2) contains the name and characteristics reported in the NZ Historic
Weather Events Catalog (NIWA 2018a).. Column (3) contains the count of EQC “landslip/flood/storm” claims which are linked to an event matching the date in column (1). Column (4) contains the sum
of EQC claim pay-outs expressed in inflation and GST adjusted 2017 NZ dollar values, and rounded to the nearest hundred thousand. Note the total number of EQC claims and EQC pay-outs are only
lower-bound figures - these show the values linked to a single day. Column (5) contains the information from ICNZ (2018) for the amount paid by NZ private insurance following the full weather event.
These are not inflation adjusted values. The web link for particular events from this historic weather database (where we obtain the name and characteristics of most of the events shown) is provided
in Appendix 1.
17Public insurance and climate change (part one): Past trends in weather-related insurance in New Zealand
Across most rows in Table 2, private insurance payments for the full event were higher
than EQC first day of event pay-outs. However, one exception is the 2011 “Tasman-Nelson
Heavy Rain” single day-long event, which triggered similar payment amounts from EQC and the
private insurance companies. One peculiarity in this table is that private insurance payments do
not have the same ranking as EQC claims pay-outs. In fact, the highest payment for a weather
event made by private insurance companies (with a figure over $100 million), was the 2004
“North Island Storm”, which is ranked 9th for EQC pay-outs. As discussed, this low correlation
marks the specific and unique nature of EQC coverage, which does not necessarily align with the
coverage provided by private insurers. 7
6 Regional analysis including population and real estate
data
We next incorporate in our geo-spatial analysis regional boundary data, population information,
slope data and other geophysical variables (urban, rural, native and exotic forest cover, distance
to water bodies such as rivers and lakes, distance to coasts, mangroves, swamps, and drainage
courses). We utilise Land Information New Zealand (LINZ, 2018) topographic and hydrographic
information. These geophysical characteristics have been associated with the properties by
either computing the shortest distance to a feature (e.g. river) or by determining if a property
sits on a particular topographic area. We also incorporate population data from Statistics NZ
(2018). Specifically, we use the subnational population estimates by regional council for 2013.
Even though most claims are concentrated in cities, there are still a significant number
occurring in rural areas. In fact, in our data, 34% of the claims are located outside the
boundaries of what is defined as “residential areas”. As noted in Table 1, only 72.3% of our
claims are geo-referenced. For this reason, all results discussed in this section only consider as
base a sub-sample of 18,930 claims.
6.1 Investigating public insurance distribution by region
We present information on weather related public insurance in New Zealand by region in Table
3. In Table 3 we separate the claim pay-out information by their region. We combine these with
population and properties counts (to 2017). As seen in table 3, the Auckland and Wellington
regions contain the largest number of claims in the country.
7 It would therefore be of interest to examine the differential impact of climate change on the EQC and the private
insurance sector, separately. For that, we would need more detail about the exposure of the insurance firms to past
and present weather risk; this is data that, as of now, we cannot access.
18Public insurance and climate change (part one): Past trends in weather-related insurance in New Zealand
Table 3: Investigating public weather-related insurance information between 2000 and 2017, across regions
(1) (2) (3) (4) (5) (6) (7) (8) (9) (10)
Average pay- No. of claims Avg. claim pay- No. of No. of claims Avg. claim
No. of Total pay- Population
Region out per claim per 1,000 out per person properties# per 1,000 pay-out per
claims outs ($)* (2017)**
($) people ($) (Oct 2017) properties property ($)
Northland 1363 17,876,533 13,116 175,400 7.77 102 65,672 20.75 272
Auckland 3132 43,135,685 13,773 1,657,200 1.89 26 471,337 6.64 92
Waikato 1409 14,212,697 10,087 460,100 3.06 31 166,605 8.46 85
Bay of Plenty 2263 20,651,354 9,126 299,900 7.55 69 108,015 20.95 191
Gisborne 194 3,528,657 18,189 48,500 4.00 73 15,927 12.18 222
Hawke's Bay 757 10,099,083 13,341 164,000 4.62 62 57,173 13.24 177
Taranaki 299 1,491,647 4,989 118,000 2.53 13 43,640 6.85 34
Manawatu-W. 969 7,874,467 8,126 240,300 4.03 33 89,724 10.80 88
Wellington 4781 32,585,246 6,816 513,900 9.30 63 173,705 27.52 188
West Coast 130 939,518 7,227 32,500 4.00 29 14,288 9.10 66
Canterbury 1118 7,303,199 6,532 612,000 1.83 12 220,365 5.07 33
Otago 894 7,328,313 8,197 224,200 3.99 33 88,168 10.14 83
Southland 22 59,347 2,698 98,400 0.22 0.6 38,826 0.57 1.5
Tasman 438 4,459,942 10,183 51,200 8.55 87 19,364 22.62 230
Nelson 932 12,587,389 13,506 51,400 18.13 245 19,031 48.97 661
Marlborough 229 2,984,624 13,033 46,200 4.96 65 20,411 11.22 146
Notes: This table contains information on weather related public insurance in New Zealand, by region, from New Zealand’s public insurer (the Earthquake
Commission (EQC)). Claim information is drawn from the set of claims between January 2000 and October 2017, Column (1) identifies the region, by regional
council area in 2013, as sourced from Statistics NZ (2013). Column (2) contains the total number of these weather-related EQC claims which have been linked to a
property in that region. Column (3) contains the sum of EQC claim pay-outs, for claims which are linked to geo-referenced properties, in NZ$ (deflated to 2017
values). Column (5) gives the regional population estimate in 2017, rounded to the nearest hundred, from StatsNZ (2018) data. Column (8) contains the number of
properties, as of October 2017, in that region. This information is derived from the Corelogic (2018) dataset of 1,612,251 properties which were able to be
intersected with the 2013 regional boundaries. Columns (4), (6), (7), (9) and (10) build off the other columns.
19Public insurance and climate change (part one): Past trends in weather-related insurance in New Zealand
However, when looking at claims on a per capita basis, the Nelson region has double the
number of claims per person than Wellington (the second highest rate). Nelson also leads the
ranking in the number of claims received per total number of properties in the region.
Northland, Bay of Plenty and the Tasman region also show a relatively high number of claims
received when compared to the total number of properties in each region.
The total value of claims paid-out by EQC tells a different story. In this case, after Auckland
and Wellington, the Bay of Plenty and Northland are the regions with the highest pay-outs
received, followed by Nelson. However, Gisborne is the region with the highest average value of
pay-out per claim (more than $18,000 received per claim, on average).
Looking at total pay-outs in a per capita and property basis, Nelson is still the region
receiving the highest amount from EQC, with an average pay-out per person of $245 and per
property of $661. Northland also received high amounts, with $272 per property, $42 more on
average than the third most affected region, Tasman.
6.2 Do geophysical features correlate with weather-related claims?
Next, we analyse and compare the geophysical context of properties with and without claims.
First, we look into how far properties are from water bodies. The vast majority of people in New
Zealand live close to the coast. 90% of all residential properties are located less than 35km from
the ocean.8 In Table 4 we show the summary statistics of the distance to the ocean for properties
with and without insurance claims. Compared to all properties in the country, properties with
weather-related EQC claims are on average almost twice as close to the coast. From Table 4 one
might infer that properties closer to the ocean are more likely to suffer EQC-insured damages
from extreme weather events in New Zealand.
We next investigated the distance of properties to big rivers, small rivers (creeks) and
other water bodies (lakes or swamps). Interestingly, in these cases, the medians are not very
different between properties with EQC claims and properties without EQC claims (less than 300
meters across cases), although they are statistically different, based on Mann-Whitney and
Pearson’s chi-squared tests. These suggest that the medians of the two samples are statistically
different at the 1% level. The medians are 3,525m vs. 3,790m for big rivers; 407m vs. 308m for
small rivers; and 1,260m vs. 1,516m for lakes/swamps. Other geographic characteristics, such as
distance from native or exotic forests, or mangroves, do not seem to be different across EQC and
non-EQC properties.
8 Based on the Corelogic (2018) dataset of 1,612,251 properties.
20Public insurance and climate change (part one): Past trends in weather-related insurance in New Zealand
Table 4: Distances of properties to the ocean
(1) (2) (3) (4)
Distance to nearest body of
water (km)
N Mean Median Std. Dev.
All properties 1,612,251 11.185 2.609 19.246
Sample w/o weather-related EQC claims 1,595,552 11.240 2.631 19.285
Sample with weather-related EQC claims 16,699 5.881 1.371 14.081
Notes: This table contains information on the distance in kilometres from properties to the shoreline.
The number of EQC properties drops from the earlier counts because in many cases there are
properties with more than one claim (triggered by a single event or triggered by different events).
Authors’ own elaboration with EQC and Corelogic (2018) data.
6.3 Does property slope correlate with weather-related claiming?
As we have the geo-location of every property in NZ, we also calculated the slopes on which
these properties are located (in degrees). Flooding is usually associated with flatter areas, and
most high flood-risk zones are very flat, while landslides are typical in steeper areas. If anything,
we were expecting the distribution of slopes for properties with claims to be “double-humped”;
concentrated on very flat and very steep terrain. This is not what we found. Figure 6 compares
the average slopes for properties with weather-related claims compared to those without. On
average, the properties with weather-related EQC claims are on steeper slopes. Almost 50% of
properties without claims are on flat areas, while the same figure for those properties with
claims is less than 20%.
A companion project, analysing in detail the claims records for Nelson, found evidence that
most EQC claims are not associated with flood zones (as delineated on flood risk maps available
for the Nelson region) (Pástor-Paz and Noy, 2018). Unfortunately, flood maps constructed with
consistent methodology are not yet available for the whole of NZ, and any analysis based on the
information we have is preliminary. At this point, these findings may suggest that flood maps
that are available may not be able to accurately assist in identifying insurance liabilities
associated with flooding.
21Public insurance and climate change (part one): Past trends in weather-related insurance in New Zealand
Figure 6: Slopes of properties (in degrees) for buildings with and without claims
Note. The graph displays the distribution (in percent) of the slope values for properties with claims and
without claims. The slope describes the gradient or steepness of the terrain, and is expressed in degrees,
the latter one ranging from 0 to 90. The light-blue bars reveal that claims tend to happen in properties
located in steep terrain, as opposed to properties without claims, which are mostly situated in relatively
flat areas. Nevertheless, there are a few properties with claims sitting in flat areas. The slope was
calculated using the method developed by Zevenbergen and Thorne (1987).
7 Investigating socioeconomic characteristics
7.1 Income and population growth for neighbourhoods with and
without claims
Meshblocks (neighbourhoods) are the smallest unit for which the government publicly provides
demographic data. In total, the country has more than 46,000 meshblocks (MBs) using 2013
boundaries. We use data on these meshblocks for the censuses of 2001, 2006 and 2013. Table 5
describes the summary statistics of the average meshblock in the country and of the average
meshblock reporting at least one claim to EQC. The median income over the years is higher in
meshblocks with EQC claims than the average meshblock in the country; providing some
suggestive evidence that homeowners who make claims to EQC may have, on average, higher
income. In Figure 7, we plot the distribution of the 2001 median personal (or household) income
in meshblocks with EQC claims and for all meshblocks. As seen, the median income distribution
of ‘EQC meshblocks’ is slightly shifted to the right from all meshblocks. In Table 6, we further
22Public insurance and climate change (part one): Past trends in weather-related insurance in New Zealand
explore this hypothesis, and disaggregate the distribution of meshblocks by income quintiles
across the censuses of 2001, 2006 and 2013.
Table 5: Socioeconomic characteristics of meshblocks with and w/o EQC weather-related claims
(1) (2)
Meshblocks containing
properties with weather- All meshblocks
related EQC claims
mean sd mean sd
Median income 2001 21,889 8,478 20,455 8,248
Median income 2006 27,855 9,575 25,973 9,567
Median income 2013 32,352 11,110 30,563 11,617
Population, 2001 102.4 61.9 80.2 62.9
Population, 2006 109.8 65.1 86.4 66.0
Population 2013 116.9 76.9 91.0 74.7
Population growth (%), 2001-2006 17.9 124.0 26.8 246.8
Population growth (%), 2006-2013 13.7 108.5 15.4 204.6
Notes: This table contains information on the meshblocks that have or have no properties with weather
related public insurance claims in New Zealand. Claim data is provided by New Zealand’s public insurer
(the Earthquake Commission (EQC)). This table refers to claim information drawn from the set of claims
between January 2000 and October 2017. The meshblock level census information is sourced from
StatsNZ (2018) and is available for Census years only. Income refers to median family income and
expressed in thousands of $NZ. The population is given by “place of usual residence”. NB: the calculated
means are not weighted by population. The number of observations for all meshblocks (MBs) varies as it
is supplied by StatsNZ, between 46,134 to 46,629. There are 4,228 meshblocks containing properties that
have ever lodged weather-related EQC claims.
In Table 6, the number of total EQC claims across the three census periods (we aggregated
claims by year ranges as shown in the table) are disproportionally concentrated in the top-two
highest quintiles, representing 52%, 55% and 50% of the total received claims for the three
periods. This is remarkably high if we consider that the total number of properties located in
these suburbs is only around 36-39% of the total number of properties in the country. In the
table we also provide the distribution of total pay-outs made by EQC across meshblocks. The
concentration of pay-outs is very similar to the concentration of the number of claims. In this
case, pay-outs in the top-two income quintile meshblocks capture around 52-53% of the total
pay-outs made by EQC in the respective periods. Similarly, Owen and Noy (2017) find that the
23Public insurance and climate change (part one): Past trends in weather-related insurance in New Zealand
distribution of EQC claim pay-outs after the Canterbury Earthquakes of 2010-2011 was skewed
toward households with higher income and wealth. It is important to note that homeowners do
not pay a premium for EQC land coverage (and premiums paid for building and contents
coverage are practically identical across all properties).
In Table 5, it can be observed that meshblocks reporting at least one EQC claim since 2000
have relatively higher population than the average. This is more in line with our expectations, as
population is closely aligned with exposure, and was already noted by the high concentration of
claims in Auckland, Wellington and Christchurch. However, it is interesting to note that EQC
meshblocks tend to have lower population growth than the average meshblock – especially in
the period 2001-06. To further explore this last finding, we look at the distribution of claims
(total number and pay-outs) across the meshblocks given their population growth. For this we
looked at the quintiles of meshblocks given population growth between 2001-06 and 2006-13,
as shown in Table 6. Results for the distribution of EQC claims across high/low population
growth meshblocks do not differ importantly from the distribution of properties or the same
meshblocks across quintiles, suggesting that claims lodgements and total pay-outs are not
necessarily more (or less) common in expanding meshblocks. This may suggest that, at the very
least, the additional exposure that is being generated by increased population is not heavily
biased toward the high at-risk areas. We plan to investigate this issue further in follow-up work.
24Public insurance and climate change (part one): Past trends in weather-related insurance in New Zealand
Figure 7: Median income distribution across meshblocks in 2001
Notes: This figure shows the distribution of median family income in 2001. Each line corresponds to a
sample: either for all meshblocks, or for those meshblocks with weather related public insurance claims in
New Zealand between Jan 2000 and Oct 2017. Claim data (and thus property sample and meshblock
sample) is provided by New Zealand’s public insurer (the Earthquake Commission (EQC)). The meshblock
level median income information is sourced from StatsNZ (2018) and is shown for the Census year 2001
only. There are around 46,000 meshblocks in total. The number of observations for all meshblocks (MBs)
varies as it is supplied by StatsNZ, between 46,134 to 46,629. There are 4,228 meshblocks containing
properties that have lodged weather-related EQC claims between Jan 2000 and Oct 2017. The red line
shows the distribution of median income reported in the 2001 Census for meshblocks containing
properties which have made weather-related EQC claims. Note charts for median income in 2006 and
2013 are structurally similar to this one.
25Public insurance and climate change (part one): Past trends in weather-related insurance in New Zealand
Table 6: Claims and total pay-outs across meshblocks, by income quintiles
(1) (2) (3) (4) (5) (6)
Income Income Meshblocks Dwellings Claims Pay-outs
quintile range ($) (%) (%) (%) (% of total)
1
=26.4 19.62 18.07 29.58 29.53
1
= 32.6 18.30 18.41 31.60 28.88
1
= 39.0 19.29 17.87 26.63 27.01
Notes: This table shows information at the meshblock level by quintiles of median family income in a
particular census year in New Zealand. The upper panel draws from a dataset made up of 2001 Census
data and information on public weather-related insurance claims from 2000-2003. The middle panel
draws on the 2006 Census and claims between 2004 and 2008. The lower panel draws on the 2013
Census and claims between 2009 and 2017. Column (3) shows the percentage of those meshblocks with
weather related public insurance claims between Jan 2000 and Oct 2017) by income quintile. Claim data is
provided by New Zealand’s public natural hazard insurer (the Earthquake Commission (EQC)). The
meshblock level median income information is sourced from StatsNZ (2018). There are around 46,000
meshblocks in total. The number of observations for all meshblocks (MBs) varies as it is supplied by
StatsNZ, between 46,134 to 46,629 There are 4,228 meshblocks containing properties that have lodged
weather-related EQC claims between Jan 2000 and Oct 2017. Income refers to median family income in
thousands of $NZ.
26Public insurance and climate change (part one): Past trends in weather-related insurance in New Zealand
Table 7: Claims and total pay-outs across meshblocks, by population growth quintiles
(1) (2) (3) (4) (5) (6) (7)
Population Population Pay-outs
Meshblocks Dwellings Claims
growth growth (% of
(%) (%) (%)
(quintile) (%) total)
1
= 20.50 19.99 18.71 14.72 26.83
1
= 17.70 19.98 20.76 17.44 23.83
Notes: This table shows information at the meshblock level by quintiles of population growth between
census years in New Zealand. The upper panel draws from a dataset made up of 2001 and 2006 Census
data and information on public weather-related insurance claims from 2004-2008. The lower panel draws
on 2006 and 2013 Census data and on claims between 2009 and 2017. Column (3) shows the percentage
of those meshblocks with weather related public insurance claims in New Zealand between Jan 2000 and
Oct 2017) by population growth quintile. The meshblock level median income information is sourced from
StatsNZ (2018). There are around 46,000 meshblocks in total. The number of observations for all
meshblocks varies as it is supplied by StatsNZ, between 46,134 to 46,629, There are 4,228 meshblocks
containing properties that had lodged weather-related EQC claims between Jan 2000 and Oct 2017.
Income range are median family income in thousands of $NZD. Claim data is provided by New Zealand’s
public natural hazard insurer (the Earthquake Commission (EQC)).
8 Discussion and conclusions
This paper describes the insurance support provided by the New Zealand Earthquake
Commission (EQC) after extreme weather events in the last 18 years. Data on EQC claims are
used to describe location characteristics, the weather events triggering high numbers of claims,
and the geophysical and socioeconomic characteristics of the neighbourhoods from where
claims come.
Our analysis shows that Northland and the Bay of Plenty in the North Island are the
regions with the highest proportion of people and properties negatively affected by weather
27Public insurance and climate change (part one): Past trends in weather-related insurance in New Zealand
disasters, while Nelson and the Tasman regions are the most affected regions in the South
Island. We also show how five extreme weather events (four of which happened in these
regions) account for about a third of the total pay-outs made by EQC for weather events since
2000.
We find that, even though most properties in New Zealand are located not far from the
coast, properties reporting claims to EQC are located even closer. While the average property in
NZ is approximately 11km away from the coast, the average property lodging a claim to EQC
after a weather event, is only about half the distance away. Properties closer to the coast are
therefore much more likely to be a potential financial liability to EQC.
We also explore the socio-economic characteristics of meshblocks from whence claims
come, and contrast these to the distribution of income across all meshblocks in the country. We
find that, even though claim numbers are highly correlated with population across meshblocks,
there is no clear correlation between claim numbers (or pay-outs) and population growth. In
other words, findings so far suggest that claims are not more likely to come from expanding
meshblocks, than from areas without major population change.
Finally, we show that more EQC claims tend to come from meshblocks with higher median
income. We find that meshblocks in the top-two income quintiles account for more than half of
the total claims and pay-outs made by the EQC. This finding suggests that after extreme weather
events, higher income families make more use of EQC insurance coverage than the average New
Zealand family. The reasons for this increase in EQC pay-outs associated with higher income
households are not yet clear. They could be associated with better access to the system, higher
exposure due to location choice, or higher damages caused by higher asset values (e.g. larger
residential land areas).
The findings described in this paper can also be considered in the context of discussions
initiated by the Parliamentary Commissioner for the Environment, which proposes to institute
an EQC-like scheme for dealing specifically with sea-level rise and flooding (PCE, 2015). It may
also be useful for current discussions about proposed revisions to the Earthquake Commission
Act (1993) and the Insurance Law Reform Act (1985). This paper is the first in a series of
projects which ultimately aim to project the financial liability from climate change for EQC and
better understand the role of the EQC in climate adaptation.
28You can also read