Institute for Economic Studies, Keio University Keio-IES Discussion Paper Series - Institute for Economic Studies, Keio University ...
←
→
Page content transcription
If your browser does not render page correctly, please read the page content below
Institute for Economic Studies, Keio University

 Keio-IES Discussion Paper Series

 コロナ禍での旅行と外食:
Go To トラベルキャンペーン、Go To Eat キャンペーンの経済分析

 大久保敏弘

 2021 年 8 月 21 日
 DP2021-016
 https://ies.keio.ac.jp/publications/14425/

 Institute for Economic Studies, Keio University
 2-15-45 Mita, Minato-ku, Tokyo 108-8345, Japan
 ies-office@adst.keio.ac.jp
 21 August, 2021
コロナ禍での旅行と外食:Go To トラベルキャンペーン、Go To Eat キャンペーンの経済分
析
大久保敏弘
IES Keio DP2021-016
2021 年 8 月 21 日
JEL Classification: H12, H20, H84
キーワード: 新型コロナウィルス感染症; 飲食宿泊業の需要喚起政策; Go To キャンペーン;
リスク; ビッグファイブ; 日本

 【要旨】
コロナ禍で一部の飲食宿泊業の打撃が大きいことが就業者調査で分かった。そこで需要面から
人々の旅行、外食行動、特にGo Toトラベル、Go To Eatキャンペーンに関して就業者調査を基に
分析した。これらの政策に反応する個人の特性や性格を多角的に分析した。結果、若い人やICT
の得意な人ほど利用が多く、リスク愛好的で外交的な人が頻繁にキャンペーンを利用している
ことが分かった。Go To Eatに関しては東京圏や女性の利用が多い。政策の問題は特定の性格を
もつ人々が政策の恩恵を受けがちなこと、キャンペーン利用者のPCR検査率が低いことがあげ
られる。

大久保敏弘
慶應義塾大学経済学部
〒108-8345
東京都港区三田2-15-45
okubo@econ.keio.ac.jp
Traveling and Eating Out during the COVID-19 Pandemic:
 The Go To Campaign Policies in Japan

 Toshihiro Okubo1
 Keio University

 Abstract

The coronavirus disease (COVID-19) pandemic plunged many sectors of the
economy into contraction, particularly the travel, hotel accommodation, and
eating/drinking industries. In Japan, some demand-inducing policies targeting such
industries were implemented, known as the Go To Travel and Go To Eat campaigns.
Using a unique individual-level survey, we investigate what factors make people respond
to these campaign policies. We find that certain socioeconomics factors as well as
noneconomic factors matter. In particular, risk attitudes, time preferences, and personal
traits (e.g., extraversion) as measured by the Big 5 categories crucially affect whether
people traveled or dined out in response to these campaigns despite the spread of
COVID-19.

Keywords: COVID-19, demand inducing policies, Go-To Campaigns, risk, Big 5, Japan

1
 Faculty of Economics, Keio University. Mail: okubo@econ.keio.ac.jp
 1
1 Introduction
Since February 2020, coronavirus disease (COVID-19) has spread with alarming
speed all over the world. Governments have imposed lockdowns to restrict
mobility and activities and contain the spread of the virus. However, the
containment measures have plunged economies worldwide into significant
contraction. The negative impact on gross domestic product growth is massive.
Many countries have implemented economic support measures, such as cash
handouts, subsidies, allowances, financial support, provisional reductions of
value added taxes (VAT), and postponement of tax payments. One of the central
issues has been whether to prioritize measures to limit the spread of infections
or to focus on mitigating the large economic downturn. Countermeasures to
COVID-19 in many countries have wavered between these two priorities.
 Some specific industries, i.e., travel, accommodation services, entertainment,
and hospitality (restaurants, cafés, eateries, etc.), suffered huge downturns.
These industries have been required to shut down their businesses or shorten
their working hours during periods of increased restrictions and lockdowns to
combat the COVID-19 spread. They have also, therefore, been a key target for
special government support, including subsidies, allowances, and postponement
of rent payments. In various countries, demand-side policies have been
implemented to stimulate the sectors of the economy hardest hit. One such policy
has been vouchers for domestic travel. For instance, governments issued
vouchers for domestic travel in Japan (“Go To Travel”), Italy (“Bonus Vacanze”),
Iceland (“Travel Gift”), Thailand (“We Travel Together”), and Singapore (“The
SingapoRediscover Vouchers”). In Hungary and Turkey, fiscal incentives
involving the reduction of VAT on travel expenses were implemented. (For more
details on such policies, see the World Tourism Organization (2020) and the
Organisation for Economic Co-operation and Development (2020).)
 However, the increased labor mobility driven by the domestic travel policies
has resulted in greater spread of the virus. In the literature on epidemics, although
they did not directly evaluate the impact of the policies, Kraemer et al. (2020) and
Zhao et al. (2020) find a positive association between traveler volume from
Wuhan City, China, and the confirmed COVID-19 cases in the other 10 major
cities in China. Policy evaluations of the “Go To Travel” campaign in Japan find
that it increased the number of new cases (Anzai and Nishiura, 2021; Miyawaki
et al., 2021). Thus, the association between the “Go To Travel” campaign and

 2
COVID-19 cases is unambiguous. In the literature on tourism management and
economics, Farzanegan et al. (2021) find that countries exposed to high flows of
international tourism tend to have more cases. Matsuura and Saito (2021)
investigate the “Go To Travel” campaign and find that tourists shifted their travel
destinations from distant to neighboring regions. Similarly, Funashima and Hiraga
(2020) find that the “Go To Travel” campaign contributed to tourism demand.
 Turning to policies stimulating demand for restaurants, cafés, and eateries,
several support policies encouraging dining out have been implemented in
various countries. In the United Kingdom, a total of GBP 500 million was spent
on subsidizing dining-out expenses under the “Eat Out to Help Out” policy
implemented for one month in August 2020, which provided discounts of up to
50% on dining out in restaurants and cafés. Likewise, the Japanese government
introduced a “Go To Eat” campaign, which involved 25% discounts for dining out.
These are large-scale demand-inducing measures. In addition, some countries
such as Austria, Germany, Belgium, and the UK temporarily reduced VAT for
restaurants, cafés, hospitality services, nonalcoholic beverages, and catering
food services. Ferzer (2020) investigates the “Eat Out to Help Out” policy in the
UK and finds that the policy contributed to a temporary rise of sales but was
responsible for 8–17% of all confirmed COVID cases. In sum, such demand-
inducing measures always involve huge risks of infections spreading, and the
pandemic spiraling out of control. This implies that to exercise these policies, it is
essential to implement an effective testing regime, with polymerase chain
reaction (PCR) and antigen tests and an effective contact tracing system.
 As noted, the existing studies have investigated how these demand-inducing
measures spread infections and whether they successfully boosted demand. By
contrast, in this paper, we use a unique individual survey to investigate what
individual socioeconomic factors (e.g. income, gender, educational background,
and age), personal behaviors (e.g., individual COVID countermeasures, such as
handwashing and mask wearing), and noneconomic factors (e.g., risk attitudes,
time preferences, and personality traits) lead people to respond to or refrain from
using the demand-inducing measures. We investigate two Japanese voucher
policies, the “Go To Travel” and “Go To Eat” campaigns, in detail from the aspect
of individual behaviors.
 The remainder of this paper is structured as follows. Section 2 describes the
background context in Japan, and Section 3 provides data and stylized facts.
Sections 4 and 5 provide estimation results. Finally, Section 6 concludes the

 3
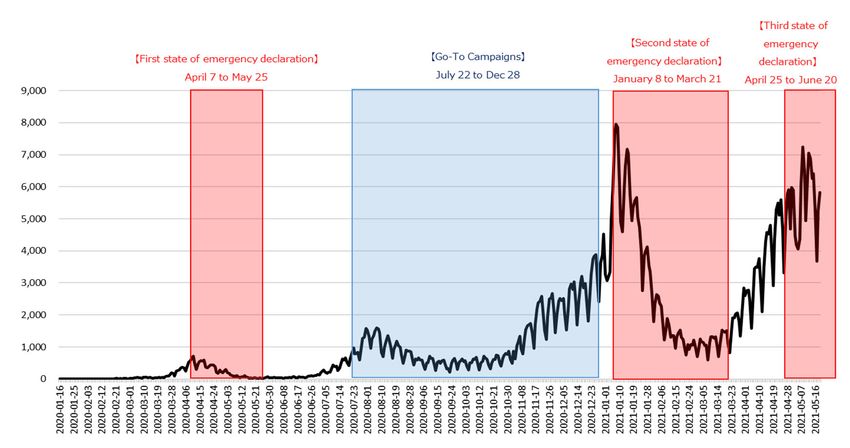
paper.

2 Background
 2.1 COVID-19 and countermeasures
Figure 1 presents an overview of the daily numbers of new COVID-19 cases in
Japan during periods when states of emergency were declared and when the Go
To campaigns were implemented. The World Health Organization declared the
COVID-19 virus a pandemic on March 11, 2020. During the early days of its
spread, the Japanese government declared a state of emergency on April 7, 2020.
The government requested people to avoid nonessential trips and to work from
home rather than commuting, and requested retail shops, department stores, and
restaurants, eateries, and cafés to shut down or shorten their business hours.
Public schools and facilities were all closed. However, the Japanese infection
control measures were “soft” in the sense that they involved a request-based
policy without legal sanctions or penalties.

Figure 1: Daily number of new infections in Japan

 After the first state of emergency was lifted on May 25, 2020, economic activity
resumed, and the government shifted its focus from containing COVID-19
infections to economic countermeasures. To aid recovery from the economic
downturn, particularly for the hotel and accommodation industries, on July 22,

 4
2020, the government initiated its Go To Travel campaign, covering 35% of
domestic travel expenses. The campaign did not initially apply to Tokyo, but it was
included in the scheme from October 1, 2020, when a 15% discount voucher was
added to the 35% discount offered originally, bringing the total discount rate to
50%. The Go To Eat campaign was launched on this same day, covering some
dining-out expenses in restaurants, cafés, and eateries. In August 2020, the
second wave of COVID-19 hit Japan, but the number of new infections gradually
decreased without the government declaring a state of emergency. Therefore,
the government’s Go To Travel campaign remained operative throughout the
second wave of COVID-19.
 However, Japan experienced a third wave with a surging number of infections
in late November 2020. On November 23, 2020, Osaka and Sapporo (in
Hokkaido prefecture) temporarily stopped accepting visitors under the Go To
Travel scheme. On November 27, a total of 11 prefectures ceased selling
coupons for the Go To Eat campaign. In December, as the third wave worsened,
the government again shifted its focus, this time away from economic
countermeasures and toward containing the spread of infections. The number of
infections in the third wave was much larger than in the first and second waves
(there were 7,880 new infections per day at the peak of the third wave, as shown
in Figure 1). Finally, the government stopped the Go To Travel campaign on
December 28, 2020, and a second state of emergency was declared on January
8, 2021.

 2.2 Go To campaign policies
As noted above, the Go To Travel campaign involves a government subsidy to
encourage domestic travel. The campaign provides people with subsidies of up
to 50% on hotel accommodation, tourist attractions, and shopping at travel
destinations. In more detail, domestic travelers received a 35% discount on travel
expenses and, after October 1, 2020, an additional 15% discount in the form of
vouchers that can be used at travel destinations. To take advantage of the
discounts, domestic travelers must book hotel accommodation affiliated with the
Go To campaigns on travel websites or through travel agencies.
The Go To Eat campaign aimed at encouraging people to dine out and involved
two forms of incentives: discount vouchers and point-based rewards. Discount
vouchers of up 25% were available after purchasing a voucher booklet from the
website prepared by each prefectural government. One voucher booklet covered

 5
various dining-out locations, although it could only be used for the restaurants,
cafés, and eateries affiliated with the Go To Eat campaign. The second incentive,
point-based rewards, meant that when diners booked certain restaurants and
eateries affiliated with the Go To campaign, they obtained points worth 500 yen
for lunches and 1,000 yen for dinners, which could then be used next time they
dined out in affiliated eateries.

3 Data and Stylized Facts
 3.1 Data
In this paper, we use data from the COVID-19 survey on Japanese workers
entitled “Questionnaire Survey on the Effects of the Spread of COVID-19 on
Telework-based Work Styles, Lifestyle, and Awareness,” which was conducted
by the Nippon Institute for Research Advancement (NIRA) and Keio University
(see Okubo, 2020; Okubo and NIRA, 2021). 2 Our paper uses the survey
conducted in April 2021 (the fourth wave of the survey), which asked respondents
about their use of the Go To campaigns, as well as provisional subsidy and
allowance programs. The sample size is 9,796 persons. The survey also asked
questions about individuals’ characteristics, changes in life and work during the
spread of COVID-19, and attitudes toward the government’s COVID-related
policies.

 3.2 Stylized facts
The survey asked whether respondents’ incomes had increased, decreased, or
experienced no change during the COVID-19 pandemic. Respondents were
asked this same question in each of the four waves of the NIRA–Keio survey, in
March, June, and December 2020, and April 2021 (Okubo and NIRA, 2021). The
survey involves a panel structure, and more than 5,000 respondents joined all
four waves.3 Based on this sample that participated in all four waves, Table 1
shows the patterns of income changes from January to December 2020 and the
share of respondents (ranked by percentage). It ranks top ten groups. The arrow
in each cell indicates whether the group experienced increase, no change, or

2
 The survey was conducted on a website constructed by Nikkei Research Co. The survey takes a stratified random
sampling strategy. Japan is stratified into five regions by regional classification and six age groups for each gender (12
age groups per region). The number of samples for 60 region–age groups is determined by population ratios. The
Population Census (Ministry of Internal Affairs and Telecommunication) is employed as the sampling unit.
3
 In the four waves of the survey, the sample sizes were 10,516, 12,138, 10,523, and 9,796, respectively.
 6
decrease in income in the time period. 48% of respondents, the largest share
group, experienced no change in income over the whole period, and 6%, the
second largest share group, experienced a reduction in income in all periods. 5%,
the third largest group, experienced a reduction only in the period of March to
June 2020, which is under the first state of emergency. A possible reason why
income remained unchanged for a half of people is partially from the policies
implemented by the government providing support, allowances, cash handouts,
and tax waivers. Although the government policies may not have prevented or
aided recovery from COVID-induced economic downturns, they appear to have
prevented a large decline in income and unemployment for many people.
However, we cannot see any positive impact of Go To Campaign policies on
income. As shown in Table 1, the third period, June to December 2020, is the
campaign period, but there are no groups to increase income in the third and
fourth periods.

Table 1: Patterns of Income Changes in the Pandemic (Total)
 June to Dec 2020 Share of
 Jan to Mar Mar to
ranking Dec 2020 to Apr respondents
 2020 June 2020
 (Go To) 2021 (%)
 1→ → → → 47.6
 2↓ ↓ ↓ ↓ 6.33
 3→ ↓ → → 5.5
 4→ → ↓ → 3.53
 5→ → → ↓ 3.47
 6↓ → → → 3.36
 7→ ↓ ↓ ↓ 3.06
 8↓ ↓ → → 2.08
 9→ → ↓ ↓ 1.99
 10 → ↓ ↓ → 1.97
 ↑: Increase, →: No change, ↓: Decrease

Table 2 lists the patterns of income changes in some representative sectors.
Some specific industries experienced substantial declines in income during the
pandemic. In the hotel accommodation and restaurant sectors, there is a
polarization of the results in terms of income changes. 19% of respondents, the
largest share group, experienced a decrease in income over the whole period,
whereas 18% of respondents, the second largest share, reported no change over

 7
all periods. 6% saw a continuous decrease since March 2020. 5% experienced a
decline in the first state of emergency (March to June 2020). This is in a sharp
contrast with Table 1.
As a comparison, Table 2 also shows the ranking of patterns of income changes
in other major industries, i.e. manufacturing, finance, and insurance, and
communication and information services. 46% in manufacturing as well as in
finance, and 53% in communication and information services had no change in
income, while only 4 to 5% of respondents experienced a decrease income over
the whole period. These industries are similar to Table 1 but in a sharp contrast
with accommodation and restaurant sector. Therefore, the negative shock to
many specific workers in the accommodation and restaurant sector appears to
have been too severe to be affected by the Go To campaign policies, government
subsidies, and allowances. The polarization of income change happened in
accommodation and restaurant sector.

Table 2: Patterns of Income Changes (representative sectors)
 Accomodation and restaurants Manufacturing
 June to Dec 2020 Share of June to Dec 2020 Share of
 Jan to Mar Mar to Jan to Mar Mar to
ranking Dec 2020 to Apr respondents ranking Dec 2020 to Apr respondents
 2020 June 2020 2020 June 2020
 (Go To) 2021 (%) (Go To) 2021 (%)
 1↓ ↓ ↓ ↓ 19.44 1→ → → → 46.39
 2→ → → → 18.06 2↓ ↓ ↓ ↓ 4.92
 3→ ↓ ↓ ↓ 6.25 3→ ↓ → → 4.82
 4→ ↓ → → 5.56 4→ → ↓ → 4.02
 5↓ ↓ ↓ → 4.86 5→ → → ↓ 3.92
 6↓ ↓ ↓ ↑ 4.17 6→ ↓ ↓ ↓ 3.71
 7↓ → → → 4.17 7↓ → → → 3.41
 8↓ ↓ → ↓ 3.47 8→ ↓ ↓ → 3.21
 9→ ↓ → ↓ 3.47 9→ → ↓ ↓ 3.01
 10 ↓ ↓ → → 2.78 10 ↓ ↓ → → 1.81
 10 → ↓ ↑ → 2.78 ↑: Increase, →: No change, ↓: Decrease
 ↑: Increase, →: No change, ↓: Decrease

 Finance, and insurance Information and communication services
 June to Dec 2020 Share of June to Dec 2020 Share of
 Jan to Mar Mar to Jan to Mar Mar to
ranking Dec 2020 to Apr respondents ranking Dec 2020 to Apr respondents
 2020 June 2020 2020 June 2020
 (Go To) 2021 (%) (Go To) 2021 (%)
 1→ → → → 46.19 1→ → → → 52.91
 2↓ → → → 5.71 2→ ↓ → → 6.58
 3→ ↓ → → 5.71 3→ → → ↓ 4.81
 4→ → ↓ → 5.24 4↓ ↓ ↓ ↓ 4.3
 5→ ↑ → → 4.76 5→ → ↓ → 3.29
 6↓ ↓ ↓ ↓ 4.29 6↓ → → → 2.53
 7→ → → ↑ 4.29 7↓ ↓ → → 2.28
 8↓ ↓ → → 3.81 8→ ↓ → ↓ 1.77
 9→ → ↑ → 2.86 9→ → → ↑ 1.77
 10 → ↓ ↓ ↓ 2.38 10 → ↓ ↓ ↓ 1.52
 10 → → → ↓ 2.38 10 → → ↑ → 1.52
 ↑: Increase, →: No change, ↓: Decrease ↑: Increase, →: No change, ↓: Decrease

 8
Next, we turn to the response to the Go To campaign policies captured by the
survey. The fourth wave of the survey asked respondents their frequency of 1)
travels using Go To Travel, 2) travels without using Go To Travel (i.e., travel at
their own expense), 3) dining out using Go To Eat, 4) dining with others (outside
their family and cohabitants), 5) PCR tests, and 6) applications for government
allowances and financial support.
 Table 3 shows the share of those who used the Go To campaign policies. In
total, 27% of respondents used Go To Travel and 25% used Go To Eat. Regarding
frequency, 14% of respondents used Go To Travel once, 7% twice, 4% three to
four times, and 2% more than five times. Go To Eat was used by 8% of
respondents once, 6% twice, 5% three to four times, and 6% more than five times.
 As a comparison, Table 3 shows the frequency of travels where Go To Travel
was not used and the frequency of dining out with others outside the
family/cohabitants in small parties. In total, 17% of people traveled without using
Go To Travel, and 31% dined out with others.

 Table 3: Frequencies in Each Behavior (%)

 Travel
 Dining-out
 Freq Go-To-Travel without Go-To-Eat
 together
 Go-To
 0 72.96 82.68 74.69 68.63
 1 14.39 9.62 8.07 8.6
 2 6.68 4.28 5.85 7.4
 3 to 4 4.29 2.22 5.4 7.52
 more than 5 1.69 1.2 5.99 7.84

 The upper panel of Table 4 shows the share of respondents who used or did
not use Go To Travel. In total, 69% of respondents did not travel at all, 14%
traveled only using Go To Travel, without undertaking any travel fully at their own
expense, 13% traveled using Go To Travel as well as traveling at their own
expense, and only 4% traveled without Go To Travel.

 9
Table 4: Use of Go-To Campaigns (%)
 Travel without Go-To-Travel
 0 1 2 3 to 4 ≧5 Total
 0 68.86 2.77 0.84 0.28 0.21 72.96
 1 9.18 3.65 1.02 0.4 0.13 14.39
 Go-To- 2 2.74 1.96 1.36 0.46 0.16 6.68
 Travel 3 to 4 1.44 1.07 0.78 0.78 0.23 4.29
 ≧5 0.47 0.17 0.28 0.29 0.47 1.69
 Total 82.68 9.62 4.28 2.22 1.2 100

 Dining-out with others
 0 1 2 3 to 4 ≧5 Total
 0 58.49 4.52 3.53 4.13 4.01 74.69
 1 3.16 2.09 1.26 0.78 0.77 8.07
 Go-To- 2 2.29 0.92 1.35 0.78 0.5 5.85
 Eat 3 to 4 2.06 0.54 0.71 1.36 0.74 5.4
 ≧5 2.63 0.52 0.55 0.47 1.82 5.99
 Total 68.63 8.6 7.4 7.52 7.84 100

 Go-To-Eat
 0 1 2 3 to 4 ≧5 Total
 0 62.68 3.22 2.17 2.45 2.44 72.96
 1 7.11 3.2 1.47 1.29 1.32 14.39
 Go-To- 2 2.71 0.95 1.44 0.84 0.75 6.68
 Travel 3 to 4 1.67 0.53 0.65 0.62 0.82 4.29
 ≧5 0.51 0.17 0.12 0.21 0.67 1.69
 Total 74.69 8.07 5.85 5.4 5.99 100

 The middle panel of Table 4 shows the share of respondents using Go To Eat
and dining out with others outside the family/cohabitants. We note that Go To Eat
covers not only dining in such small parties but also solitary dining, and thus, the
two groups partially overlap. A total of 58% of respondents did not use Go To Eat
or have dining parties, 16% did not use Go To Eat but dined together with others
outside their family/cohabitants, 10% used Go To Eat but did not dine out with
others outside their family/cohabitants, and 16% of respondents used Go To Eat
as well as dined with others outside the family/cohabitants.
 The bottom panel of Table 4 shows the share of respondents using both
programs, Go To Travel and Go To Eat: 63% did not use either programs, 10%
used only Go To Eat, 12% used only Go To Travel, and 15% used both.
 As a comparison, we show the outcome of the applications for government
support. The survey asked whether respondents applied to at least one of 13

 10
support funds and benefit programs (including Emergency Small Loans, Support
fund and allowances for enforced leave during the pandemic, and deductions of
fees on national pensions and insurance) other than the cash handouts (as all
Japanese residents received cash handouts of 100,000 yen per person). We
found that 9% of respondents applied to at least one program (see Appendix
Table 1 for basic statistics).
 The upper panel of Table 5 reports on PCR tests and indicates that 88% of
respondents did not take PCR tests; of the 12% that did get tested, 7% were only
tested once. The table also indicates that 20% of respondents used Go To Travel
without taking PCR tests. Out of all Go To Travel users, 77% did not take PCR
tests. Similar outcomes are observed for Go To Eat (the bottom panel of Table 5),
as 76% of Go To Eat users did not take PCR tests. PCR tests involve a fee in
Japan and they are not yet widely used, which is problematic in terms of infection
control.

 Table 5: Use of Go-To Campaigns and PCR tests (%)
 PCR tests
 0 1 2 3 to 4 ≧5 Total
 0 67.57 3.85 0.86 0.57 0.12 72.96
 1 11.61 1.8 0.7 0.23 0.04 14.39
 Go-To- 2 4.69 0.87 0.62 0.38 0.12 6.68
 Travel 3 to 4 3.03 0.51 0.34 0.22 0.2 4.29
 ≧5 1.27 0.1 0.02 0.11 0.18 1.69
 Total 88.17 7.13 2.53 1.5 0.66 100

 PCR tests
 0 1 2 3 to 4 ≧5 Total
 0 68.76 4.25 0.96 0.54 0.17 74.69
 1 5.89 1.26 0.57 0.25 0.1 8.07
 Go-To- 2 4.03 0.73 0.74 0.23 0.12 5.85
 Eat 3 to 4 4.22 0.51 0.16 0.39 0.12 5.4
 ≧5 5.26 0.38 0.11 0.09 0.15 5.99
 Total 88.17 7.13 2.53 1.5 0.66 100

4 Estimations and Results
 4.1 Basic estimations
In this section, using the fourth wave of the survey, we conduct econometric

 11
analyses of individuals’ travel and dining-out preferences to investigate what
factors influenced the uptake of the Go To Eat and Go To Travel programs (See
Appendix Table 1 for the basic statistics). The basic estimation equation is given
as follows:

 ,
 (1)

where dependent variable Bi denotes respondent i’s behaviors. Five behaviors
are investigated: (B1) domestic travels using Go To Travel, (B2) domestic travels
not using Go To Travel (respondents finance all expenses), (B3) dining out using
Go To Eat, (B4) dining out with other people outside the family/cohabitants, and
(B5) applying to at least one government financial support and allowance
program. The variables from B1 to B4 are measured by frequencies (0 for none,
1 for once, 2 for twice, 3.5 for 3–4 times, and 5 for more than 5 times in our
estimation). B5 is a binary variable, acting as a dummy for whether the
respondent applied for support. We conduct tobit estimations for B1–B4 because
they are expressed in frequencies (0–5) and a probit estimation for B5 because
it is a binary variable (equal to 0 or 1).
 X denotes a set of individual variables, where Male is a male dummy, Age
denotes the age variable (scaled by age 10), Income is the annual income in 2019
(scaled by 500,000 yen), Univ is a dummy for a university degree, and ICT_skill
denotes the individual’s information and community technology (ICT) skills,
measured by four levels (none, introductory, intermediate, and advanced). 4
House_own is a dummy for owning a house, which is a proxy for assets. In
addition, there are variables for family structure. Marry is a dummy for having a
spouse with whom one lives, Child is a dummy for having children under the age
20 years living in the respondent’s household, and Single is a dummy for a single
person without cohabitants.
 Y denotes a set of variables concerning the individual’s lifestyle change from
June 2020 to December 2020, derived from the third wave of our survey. The

4
 In terms of ICT skills, the following apply to each skill level: (1) personal computer (PC) not used for work
(= 0 for our calculation), (2) introductory level (e-mail and data input by PC) (= 1), (3) intermediate level (data
processing, calculations, and documentation) (= 2), and (4) advanced level (development of software,
programming, and network management) (= 3). The item of this question follows the questionnaire in PIAAC
and De la Rica and Gortazar (2016). G_Q06 in PIAAC
https://www.oecd.org/skills/piaac/BQ_MASTER.HTM#G_Q06
 12
variables are Life_1) working hours, Life_2) housekeeping time (including
childcare and nursing), Life_3) sleeping hours, Life_4) leisure and spare time,
and Life_5) monthly income. The answer to each item is either a large decrease
(= –2), a small decrease (= –1), no change (= 0), a small increase (= 1), or a large
increase (= 2).
 R denotes a set of regional variables, NCOVID denotes the number of daily
new infections in the population at respondent i’s residential place j (at the
municipality level),5 and GTokyo is a dummy for the Greater Tokyo area (Tokyo,
Kanagawa, Chiba, and Saitama prefectures). If respondent i lives in the Greater
Tokyo area, then the dummy takes a value of one, otherwise zero.
 Several fixed effects are added. Job is the occupational fixed effect, Ind is the
sector fixed effect, Emp is the employment-type fixed effect, Size is the firm-size
fixed effect, and Pref is the prefectural fixed effect.6
 The first column of Table 6 reports the results for Go To Travel (B1). Age is
significantly negative, whereas ICT_skill, Univ, Income, and House_own are
significantly positive. Thus, younger, richer, educated people with high ICT skills
tend to use Go To Travel more frequently. Marry and Single are significantly
positive, indicating that singles or married couples without children tend use Go
To Travel more frequently than others. In addition, as Life_2 is significantly
negative, whereas Life_4 is significantly positive, this indicates that people with
fewer hours of housekeeping responsibilities and more leisure and spare time
during the pandemic tend to use Go To Travel more. NCOVID and GTokyo are
not significant.

5
 In the rural areas (villages), the number of new infections is not available at the municipality level. However,
it is available from health centers jointly handled by multiple municipalities. Thus, the number of municipality-
level patients in the rural areas is derived from the number of new infections at the health center weighted
by the population of each municipality.
6 Job is based on 38 occupation categories. Ind denotes two-digit-level industries. Emp is regular employees,

nonregular employees, executive management, self-employed business owners (with employees), self-
employed business owners (no employees), helping with in-house sales, housekeepers, students, and
others. Firm size is categorized as 5–29 employees, 30–99 employees, 100–499 employees, more than 500
employees, and public offices. We note that there are 47 prefectures in Japan.
 13
Table 6: Basic Estimations
 1 2 3 4 5
 B1 B2 B3 B4 B5
 coeff t coeff t coeff t coeff t coeff z
Male -0.1384 -1.55 -0.0328 -0.29 -0.6504 -5.09 *** -0.3367 -2.84 *** -0.0137 -0.29
Age -0.0915 -5.21 *** -0.1041 -4.66 *** -0.171 -6.86 *** -0.1046 -4.56 *** -0.0673 -6.91 ***
Marry 0.78602 7.77 *** 0.6933 5.4 *** 1.46035 10.09 *** 0.2784 2.14 ** 0.05108 0.95
Child -0.0602 -0.51 0.0227 0.16 0.17385 1.06 0.1947 1.26 0.03258 0.51
Single 0.40426 3.24 *** 0.6101 3.93 *** 0.26192 1.45 0.6482 4.12 *** -0.1042 -1.62 *
Univ 0.44528 5.29 *** 0.5195 4.87 *** 0.54618 4.52 *** 0.4616 4.15 *** 0.01137 0.26
Income 0.02304 1.74 * 0.0291 1.82 * 0.04016 2.13 ** 0.0251 1.41 -0.0054 -0.76
ict_skill 0.32324 6.24 *** 0.4182 6.5 *** 0.45078 6.18 *** 0.4267 6.45 *** 0.1462 5.32 ***
House_own 0.17927 2.03 ** 0.2318 2.07 ** 0.38424 3 *** 0.0289 0.25 -0.1523 -3.21 ***
Life 1 -0.0555 -0.82 -0.1581 -1.82 * -0.0663 -0.7 0.0617 0.71 -0.1215 -3.06 ***
Life 2 -0.167 -1.94 ** -0.2149 -1.96 ** -0.1334 -1.19 0.0297 0.29 -0.0579 -1.22
Life 3 0.0338 0.38 -0.0421 -0.38 0.13625 1.11 0.1013 0.92 0.02423 0.48
Life 4 0.14283 1.97 ** 0.2506 2.68 *** 0.22389 2.17 ** 0.2714 2.93 *** 0.03805 0.95
Life 5 0.07057 1.03 0.1547 1.75 * -0.0415 -0.43 0.0054 0.06 -0.1142 -2.95 ***
GTokyo 0.17524 0.82 -0.3122 -1.2 1.36916 4.16 *** 0.356 1.27 0.01233 0.11
RCOVID 21.096 1.09 27.674 1.18 63.8544 2.35 ** 45.611 1.8 * 14.3336 1.46
NoB 9197 9197 9197 9197 9197
Log likelihood -8968 -6458.6 -9272.8 -11027 -2432.4
R2 0.0303 0.0374 0.0382 0.0236 0.1245
 Tobit Tobit Tobit Tobit Probit
NOTE: All fixed effects (Job, Ind, Emp, Size, Prefw) are included, but ommited to report from the table.
***: p
(B3). UNIV, Income, Marry, ICT_skill, and House_own are significantly positive,
and Male and Age are significantly negative. Life_4 is significantly positive. Thus,
younger, richer, highly educated females with high ICT skills, who are married
without children and have more spare time, tend to use Go To Eat more than
others. NCOVID and GTokyo are significantly positive. The Greater Tokyo area
has more available restaurants and eateries, enabling more frequent use of Go
To Eat.
 As a comparison, the fourth column of Table 6 reports the result on dining with
small groups outside the family or cohabitants (B4). The significant variables are
similar to those for the Go To Eat estimation. However, Single is now significantly
positive, whereas Income and House_own are not significant. Because the Go
To Eat campaign covers many small inexpensive eateries for single persons, it
enables frequent use by singles and those who are not wealthy. NCOVID is now
weakly significant, but GTokyo is not significant. Thus, the frequency of dining
together outside the family/cohabitants is less biased toward the Great Tokyo and
urban areas. The Go To Eat campaign operates only with affiliated restaurants
and eateries. Because urban areas have a concentration of such places,
residents have a relative advantage in terms of the availability of affiliated venues
and use of the program.
 The fifth column of Table 6 reports on whether respondents applied for a
government financial support and allowance program (B5). Age is significantly
negative, whereas ICT_skill is significantly positive. Although Income is negative
but not significant, House_own is significantly negative. Younger, less asset-rich
people with high ICT skills tend to apply for government support. Furthermore,
Life_1 and Life_5 are significantly negative, in contrast with the other estimations.
The workers who experienced significantly reduced working hours and reductions
in income in the pandemic tend to apply for financial support and allowances.
 In essence, the government policies, i.e., the Go To campaigns and
government subsidy programs, appear to work to some extent. Those whose
income declined significantly during the COVID pandemic tend to apply to the
government financial support and allowances program, whereas those with
higher incomes and assets tend to use the Go To programs. This indicates that
the government policies worked well to some extent in the sense that they
assisted people whose income declined sharply and encouraged spending by
wealthier people to stimulate the economy.

 15
4.2 Noneconomic factors (behavioral bias, attitude toward COVID, and
 personality traits)
 Now, we add a set of noneconomic factor variables, Z, to eq (1), as follows:

 ,
 (2)

where Z is composed of 1) behavioral biases, 2) attitudes toward COVID-19-
related government policies and individuals’ behaviors in terms of
countermeasures (using masks and social distancing), and 3) personality traits,
as categorized by the Big 5.
 The first set of variables concerns behavioral biases, i.e., time preferences
(Time_pref) and risk measures (Risk). The question on time preference is the
following: “Instead of receiving 10,000 yen one month later, at least how much
would you like to receive 13 months later?” There is then a choice of eight options:
1 = 9,500 yen, 2 = 10,000 yen, 3 = 10,200 yen, 4 = 10,400 yen, 5 = 10,600 yen,
6 = 11,000 yen, 7 = 12,000 yen, or 8 = 14,000 yen. Selecting a higher value infers
that the respondent has higher time preferences. Risk attitude is measured from
0 (not willing to take risk at all) to 10 (willing to take risk) in daily life. Higher values
indicate that the respondents prefer higher risk and higher returns, and vice versa.
 Second, respondents’ attitudes toward COVID-19 are added to the estimation
using two questions. In the first question, respondents were asked whether the
government should place more emphasis on economic countermeasures than on
containing COVID-19. Respondents could choose agree (= 1), or disagree (= 0),
with the variable for the estimations, Policy, being a binary variable based on the
respondents’ preferences concerning economic countermeasures. We find that
26% of respondents would prefer the government to put more emphasis on
economic countermeasures (see the variable “Policy” in Appendix Table 1). The
other question concerned the respondents’ own countermeasures against
COVID-19 in their daily life. The survey asked respondents about the frequency
with which they (1) washed their hands and used a face mask and (2) avoided
mass gatherings and followed social distancing. In the survey, the respondents
were asked to choose one of five options, “always,” “frequently,” “sometimes,”
“seldom,” and “never,” for both types of behaviors. The results are shown in
Appendix Table 2. Around 60% of respondents answered that they always or

 16
frequently washed their hands and used a mask, whereas only around 38%
responded that they always or frequently maintained social distancing. Our
variable for estimation, Mask_distance, takes the mean of the answers to (1) and
(2), where “always” = 4 for the calculation, “frequently” = 3, “sometimes” = 2,
“seldom” = 1, and “never” = 0.
 Third, personality traits measured by the Big 5 are added. In the field of
psychology, the Big 5 personality traits refer to five basic dimensions of
personality: extraversion (E), agreeableness (A), openness (O),
conscientiousness (C), and neuroticism (N) (see Nettle (2009) for more details).
It is well known that one’s Big 5 personality trait remains stable over time (Soldz
and Vaillant, 1999) and is influenced by genes and growing environments in
childhood. The genetic influence makes up 40–60% of the Big 5 personality (Jang
et al., 1996). Thus, it is unlikely that the COVID-19 pandemic would alter a
respondent’s Big 5 personality.
 Extraversion (E) features sociability, talkativeness, and social interest. Thus,
higher extraversion means a person is more outgoing, whereas lower
extraversion means a person is more reserved. In the literature, extraversion is
positively associated with spending more time in some social contexts (Diener et
al., 1984). Higher extraversion can predict more alcohol consumption, popularity,
parties attended, dating variety, and exercise (Paunonen, 2003). Extraversion is
negatively associated with being alone but positively associated with spending
time with friends and colleagues (Wrzus et al., 2016). Agreeableness (A)
indicates attributes such as trust, altruism, and being kind and considerate to
others. Agreeableness is positively associated with higher team performance
(Bell, 2007; Bradley et al., 2013). Openness (O) features characteristics such as
creativity, imagination, and insight. Higher openness indicates a broad range of
interests. This is positively associated with interacting with strangers but
negatively associated with doing nothing and being with family (Wrzus et al.,
2016). Conscientiousness (C) features thoughtfulness and goal-directed
behaviors. It is associated with behaving responsibly, carefully, and with self-
discipline. It is positively associated with engaging in working (Wrzus et al., 2016).
Persons with higher conscientiousness are likely to perform fastest in most
information-seeking tasks (AI-Samarraie et al., 2017). In the case of school
students, it has been found that the more conscientious students were, the more
time they spent in class and public places other than restaurants, bars, and cafés
(Mehl et al., 2006). Neuroticism (N) is characterized by frequent worries, sadness,

 17
and emotional instability. People with higher neuroticism tend to prefer more
strongly to be alone (Mehl et al., 2006).
 Table 7 reports the results. In all columns, Policy and Risk are significantly
positive, while Time_pref is significantly negative. Thus, people who would prefer
the government to focus more on economic countermeasures rather than strict
epidemic controls, have lower time preferences, and prefer high risk and high
returns are likely to travel and dine out more even during periods when the spread
of infections is higher. Both traveling and eating out involve a higher risk of
infection, and, therefore, those who enjoy engaging in these activities during the
pandemic tend to be risk takers. By contrast, travel and eating out during the
pandemic require careful planning, with hedging against high infection periods
and places, which requires patience and, thus, lower time preferences.

 Table 7: Non-economic Factors
 1 2 3 4 5
 B1 B2 B3 B4 B5
 coeff t coeff t coeff t coeff t coeff z
Male -0.1346 -1.48 -0.0908 -0.79 -0.5931 -4.57 *** -0.2409 -2.02 ** -0.0249 -0.51
Age -0.0853 -4.83 *** -0.089 -3.98 *** -0.1686 -6.69 *** -0.1211 -5.24 *** -0.0601 -6.1 ***
Marry 0.7153 7.15 *** 0.64048 5.06 *** 1.39538 9.67 *** 0.20207 1.57 0.04065 0.74
Child -0.0908 -0.79 -0.0143 -0.1 0.1413 0.86 0.15278 1 0.02793 0.43
Single 0.3529 2.88 *** 0.57104 3.72 *** 0.22122 1.24 0.62253 4.01 *** -0.113 -1.75 *
Univ 0.41709 4.98 *** 0.49237 4.63 *** 0.48841 4.05 *** 0.40004 3.62 *** -0.0043 -0.1
Income 0.01255 0.96 0.01711 1.08 0.02965 1.58 0.01724 0.97 -0.0098 -1.37
ict_skill 0.27033 5.27 *** 0.34352 5.4 *** 0.38271 5.26 *** 0.36853 5.59 *** 0.12516 4.55 ***
House_own 0.14193 1.63 * 0.18134 1.65 * 0.33748 2.65 *** -0.0059 -0.05 -0.1629 -3.43 ***
Life 1 -0.0373 -0.56 -0.1318 -1.58 -0.0435 -0.47 0.06957 0.83 -0.117 -3.02 ***
Life 2 -0.1812 -2.17 ** -0.2261 -2.14 ** -0.1723 -1.58 -0.03 -0.3 -0.0564 -1.22
Life 3 0.02399 0.28 -0.0401 -0.37 0.14563 1.21 0.12605 1.16 0.0261 0.52
Life 4 0.11483 1.64 * 0.20945 2.33 ** 0.18577 1.85 * 0.21605 2.39 ** 0.03585 0.91
Life 5 0.06082 0.91 0.14319 1.65 * -0.0246 -0.25 0.03956 0.45 -0.1155 -2.98 ***
GTokyo 0.14669 0.69 -0.3651 -1.41 1.34211 4.09 *** 0.32211 1.16 0.01583 0.14
RCOVID 15.1059 0.78 16.5893 0.72 56.3685 2.1 ** 41.7739 1.66 * 11.8892 1.2
Risk 0.08398 4.75 *** 0.11424 5.11 *** 0.06012 2.38 ** 0.08739 3.83 *** 0.04808 5.12 ***
Time_pref -0.0883 -5.06 *** -0.077 -3.5 *** -0.107 -4.2 *** -0.0471 -1.98 * -0.044 -4.91 ***
Policy 0.61269 7.63 *** 0.69824 7.12 *** 0.86258 7.65 *** 0.60962 5.79 *** 0.17977 4.09 ***
Mask_distance 0.04727 1.62 0.07983 2.18 ** 0.15659 3.69 *** 0.15243 3.97 *** 0.05546 3.6 ***
E 0.19294 5.23 *** 0.19246 4.11 *** 0.23145 4.32 *** 0.3359 6.82 *** 0.04574 2.29 **
A 0.08305 1.95 ** -0.0263 -0.48 0.14527 2.34 ** 0.46683 8.42 *** -0.0521 -2.24 **
C -0.069 -1.65 -0.2092 -3.95 *** -0.0796 -1.32 -0.2962 -5.47 *** -0.0169 -0.76
N -0.0125 -0.3 -0.1089 -2 ** 0.03455 0.55 0.01913 0.34 0.00097 0.04
O 0.01434 0.34 0.15 2.78 *** 0.02072 0.34 -0.0542 -0.97 0.03209 1.45
NoB 9197 9197 9197 9197 9197
Log likelihood -8885.3 -6375.9 -9208.4 -10923 -2382.7
R2 0.0393 0.0497 0.0449 0.0328 0.1424
 Tobit Tobit Tobit Tobit Probit
NOTE: All fixed effects (Job, Ind, Emp, Size, Prefw) are included, but ommited to report from ***: p
is consistent with the psychology literature, as more extraverted people tend to
attend more parties (Paunonen, 2003) and spend more time with friends and
colleagues (Wrzus et al., 2016). Furthermore, as higher extraversion means a
person is more outgoing, rather than reserved, such people tend to be frank and
unhesitant about asking for help, such as financial support from the government.
Agreeableness means people are considerate of others, which could lead them
to enjoy organizing trips and dining-out experiences for others using the Go To
programs. This is consistent with previous psychology studies on agreeableness
(Bell, 2007; Bradley et al., 2013). Conversely, those who apply for government
support tend to protect their own livelihoods and themselves and, thus, tend to
be more selfish or less altruistic, which is why they are less agreeable in our result.
Conscientiousness (C) is associated with behaving responsibly, carefully, and
with self-discipline. Because those who travel using Go To Travel have to seek
information or register with this government program, they are more
conscientious. This is consistent with the existing psychology literature on
conscientiousness and information-seeking behaviors (e.g., AI-Samarraie et al.,
2017).

5 Further Investigations
 5.1 Travelers who use Go To Travel and other travelers
Now, we focus only on those who traveled during the pandemic. Although the Go
To Travel campaign offered benefits to travelers, accessing them imposed some
burdens. As mentioned above, the program was available only at affiliated hotels
and accommodation. Moreover, some cities suddenly stopped accepting Go To
Travel visitors, for example, Osaka and Sapporo ceased participating in the
program on November 23, 2020. Thus, to use the program, travelers needed to
carefully seek information on the Internet about eligibility and consider whether
the affiliated tour packages matched to their preferences. Here, we investigate
what factors led people to choose participation in Go To Travel or to travel at their
own expense. Based on all respondents who traveled, we conduct the following
probit estimation:

 ,
 (3)

 19
where Use is a dummy for a traveler using Go To Travel. If the traveler uses Go
To Travel at least once, then the dummy takes a value of one, and zero otherwise.
All independent variables are the same as in eq (2). The first column of Table 8
reports the results. Many variables are not significant. However,
conscientiousness (C) is significantly positive and time preference is significantly
negative. Thus, travelers who are more conscientious and more patient tend to
use Go To Travel. As discussed before, because using Go To Travel involves
some information-seeking tasks, it requires more conscientious traits and more
patience. As mentioned above, the applicability and benefits of the Go To Travel
program vary across accommodations as well as destinations and services, and
are not applicable to all accommodations. Owing to considerations of infection
control, the program covered many small-scale tours and luxurious hotel
accommodation, rather than group and package tours. Thus, those who are more
conscientious tend to participate in the program and partake in smaller scale but
luxurious trips.

Table 8: Further investigations
 1 2 3 4 5
 Travellers(B1, B2) Dining-out (B3, B4) GoTo (B1, B3) PCR in B1 PCR in B3
 coeff z coeff z coeff z coeff z coeff z
Male 0.1367 1.63 -0.1053 -1.9 * 0.14633 2.33 ** 0.1713 2.17 ** 0.227 2.7 ***
Age -0.0266 -1.78 * -0.0487 -4.56 *** -0.0154 -1.31 -0.1056 -6.94 *** -0.134 -7.77 ***
Marry 0.0157 0.18 0.42429 7.11 *** 0.03173 0.48 0.0703 0.8 -0.095 -1.05
Child -0.0928 -1.02 0.05766 0.84 -0.0521 -0.72 0.0229 0.23 0.0919 0.87
Single -0.0695 -0.66 -0.0374 -0.52 0.14264 1.69 * 0.0229 0.22 0.0093 0.08
Univ 0.1104 1.56 0.07258 1.45 0.03609 0.66 -0.0043 -0.06 -0.021 -0.27
Income -0.0025 -0.21 0.00544 0.69 -0.0121 -1.32 0.0068 0.62 0.0145 1.19
ict_skill -0.0674 -1.52 0.05224 1.67 * 0.02894 0.85 0.0743 1.69 * 0.1289 2.78 ***
House_own 0.0581 0.77 0.15854 3.04 *** -0.0901 -1.53 0.0241 0.32 0.0234 0.29
Life 1 -0.0038 -0.07 -0.0626 -1.75 * 0.00382 0.09 -0.2024 -3.98 *** -0.215 -4.03 ***
Life 2 -0.0797 -1.26 -0.0647 -1.47 -0.0698 -1.45 -0.2592 -4.08 *** -0.235 -3.76 ***
Life 3 -0.0152 -0.24 0.00193 0.04 -0.0051 -0.1 -0.0585 -0.93 -0.05 -0.76
Life 4 -0.0571 -1.02 0.01319 0.33 -0.0191 -0.45 0.0389 0.71 0.0408 0.7
Life 5 -0.07 -1.34 0.00338 0.09 0.03013 0.75 0.1263 2.42 ** 0.1429 2.49 **
GTokyo 0.0088 0.05 0.33276 2.52 ** -0.2643 -1.7 * -0.1623 -0.91 -0.455 -2.23 **
RCOVID 11.398 0.68 9.40134 0.82 -7.5539 -0.58 23.831 1.53 15.583 0.96
Risk 0.012 0.85 0.0059 0.57 0.03613 3.2 0.0546 3.69 *** 0.0416 2.62 ***
Time_pref -0.0598 -3.64 *** -0.0472 -4.17 *** -0.0338 -2.72 *** -0.1037 -7.01 *** -0.106 -6.54 ***
Policy -0.103 -1.57 0.10456 2.22 ** -0.0113 -0.22 -0.0735 -1.1 -0.045 -0.65
Mask_distance -0.0221 -0.87 -0.0041 -0.22 -0.0405 -2.01 ** -0.0036 -0.14 -0.027 -0.99
E 0.0464 1.52 0.01895 0.91 0.04792 2.06 ** 0.0833 2.59 ** 0.0722 2.12 **
A -0.0287 -0.84 -0.0881 -3.63 *** -0.0121 -0.45 -0.1683 -4.7 *** -0.169 -4.3 ***
C 0.077 2.3 ** 0.05536 2.4 ** -0.0101 -0.39 -0.0007 -0.02 0.0065 0.17
N 0.0262 0.76 -0.0004 -0.02 -0.0194 -0.73 -0.0289 -0.79 -0.006 -0.16
O -0.0544 -1.57 0.02706 1.12 0.00617 0.23 0.0264 0.72 0.0345 0.88
NoB 2,809 3,803 3428 2,451 2,297
Log likelihood -1021.9 -2345.4 -1867.1 -1097.9 -973.3
R2 0.0774 0.0789 0.075 0.1877 0.2245
 Probit Probit Probit Probit Probit
NOTE: All fixed effects (Job, Ind, Emp, Size, Prefw) are included, but ommited to report from the***: p
5.2 Go To Eat campaign for eating out
Next, we focus on eating out. As discussed above, Go To Eat, similar to Go To
Travel, was available only at affiliated restaurants and eateries. We investigate
those who chose to eat out using Go To Eat. Our sample includes only those who
dined out and is composed of two groups: respondents who used Go To Eat and
those who chose to dine out with other people outside their family and/or
cohabitants. 7 We conduct a probit estimation using eq (3). The dependent
variable, Use, is now a dummy for Go To Eat users.
 The second column of Table 8 reports the results. GTokyo is significantly
positive, as are Marry, House_own, ICT_skill, Policy, and C. Then, Male, Age,
Time_pref, A, and Life_1 are significantly negative. Younger females with higher
ICT skills and lower time preferences, who are more conscientious and less
agreeable, tend to use Go To Eat. The Go To Eat campaign requires information-
seeking tasks to determine which restaurants are affiliated with the campaign and
offer reward points, and, thus, it requires conscientiousness. Reward points are
provided only to the person who booked even if others dine out with them, and,
thus, the program might attract less altruistic, i.e., less agreeable, people.
Younger persons with high ICT skills are advantaged by such a booking system.
The Greater Tokyo area has a higher concentration of eating places, and, thus,
its residents tend to use Go To Eat more than those living elsewhere.

 5.3 Comparison of Go To Travel and Go To Eat users
Now, we compare the users of Go To Travel with those using Go To Eat, using
the estimation sample of all Go To participants. We conduct a probit estimation
using eq (3). The dependent variable, Use, is now a dummy for using Go To
Travel. The third column of Table 8 reports the results. GTokyo, Time_pref, and
Mask_distance are significantly negative, whereas Male, Single, and E are
significantly positive. Thus, compared with Go To Eat users, the users of Go To
Travel are more likely to be male, be single, have lower time preferences, be
more extraverted, and live outside the Greater Tokyo area. This confirms the
results presented in Table 7.

7
 Unlike the travelers in the previous subsection, the two groups are not independent. Some of those who
dine out with others outside their family/cohabitants use the Go To Eat program.
 21
5.4 Go To campaigns and PCR tests
As the Go To campaigns promote labor mobility, they also contribute to the spread
of COVID-19 infections (Anzai and Nishiura, 2021). If PCR tests were mandatory
for use of the programs, they could function as countermeasures against COVID
to some extent and mitigate the spread of infections. However, in Japan, there is
a charge for PCR tests. As shown in Section 2, only a small share of Go To
program users took PCR tests. We investigate which individuals took PCR tests
among the Go To program users. Our survey asked respondents about their
frequency of PCR testing, although it did not ask whether the tests were
conducted because they were traveling and dining out, and they may have had
other motivations for taking the tests.
 We use the following probit estimation:

 ,
 (4)

where PCR is a dummy for taking PCR tests, which takes a value of one if
respondent i took a PCR test. The fourth (fifth) column of Table 8 reports the
results for Go To Travel (Go To Eat) users. For Go To Travel, Age is significantly
negative, whereas Male and ICT skills are significantly positive. Risk and E are
significantly positive, while Time_Pref and A are significantly negative. Life_1 and
Life_2 are negative and Life_5 is positive. Thus, among the Go To Travel users,
younger males with high ICT skills tend to take PCR tests. People with lower
working or housekeeping hours but increasing incomes in the pandemic tend to
take PCR tests. This indicates that those who took PCR tests tend to have spare
time and money. In addition, people with higher risk attitudes and lower time
preferences tended to take tests. As shown in the previous estimation, risk-taking
Go To Travelers with lower time preferences tended to travel more frequently.
Thus, they might tend to take PCR tests more. More extraverted and less
agreeable people also tend to take tests. Extraversion involves high social
interest, which triggers people to take PCR tests.
 Next, the fifth column of Table 8 reports the results for Go To Eat users. GTokyo
and Age are significantly negative, whereas Male and ICT skills are significantly
positive. Risk and E are significantly positive, whereas Time_pref and A are
significantly negative. Life_1 and Life_2 are significantly negative and Life_5 is

 22
positive. Again, those who have more spare time and money in the pandemic
tend to take PCR tests. The results are similar to those for Go To Travel. One
slight difference is the regional factor, GTokyo. People living in the Greater Tokyo
area tend to take tests more because they frequently use Go To Eat and because
they live in closer proximity to neighbors, given the density of living, which
exposes them to larger numbers of new infections.
 Although our survey cannot directly identify reasons for taking PCR tests and
cannot fully identify causality, it seems that the government cannot strategically
combine the Go To campaign policies and infection controls such as PCR tests.
However, there is scope to implement some infection controls in the Go To
campaigns. For instance, the government could provide some incentives or
regulations encouraging PCR tests and/or vaccinations when using Go To
campaigns for some specific people (e.g., the elderly and lower-income people)
and/or for specific regions (e.g., urban areas with large populations and islands
with fewer hospitals). It is problematic that there is a charge to undertake the tests,
which reduces incentives for lower-income people to take them.
 Or it might be costly to implement Go To campaign policies. Only certain people
with specific socioeconomic characteristics and personal traits tend to use the
tax-funded Go To campaign policies. On the other hand, these demand-inducing
policies do not contribute greatly to boosting income for the accommodation and
restaurant sectors. Some people in these sectors experienced continuously
declining incomes during the spread of COVID. We cannot see any large groups
of increasing income during and after the period of campaigns (i.e., June to
December 2020 and December 2020 to April 2021) in Table 2. Therefore, it
appears to be difficult or costly to combine economic countermeasures to boost
these industry sectors with policies to contain infections. It might be better to
concentrate on controlling infections and spend on PCR tests and a contact
tracing system rather than focusing on economic countermeasures. This is similar
to Acemoglu et al. (2020), who suggests that early targeted interventions
supported by an effective testing and tracing system could be the most effective
and least-cost interventions.
 Overall, users of the Go To campaigns belong to specific groups. As shown
above, those with specific characteristics, particularly personal traits such as
higher extraversion, tend to travel and eat out despite the spread of COVID
infections and benefit from the Go To campaign policies. These policies are
financed by all tax payers; however, as their impact is inequitable, they may be

 23
perceived as unfair if they persist beyond provisional or short-run policies.

6 Conclusions
This paper studies demand-inducing policies, the Go To campaigns, for traveling
and eating out during the COVID-19 pandemic in Japan. Using a unique
individual survey, we find that rich, educated persons, with high ICT skills, tend to
use these programs and, in the case of Go To Eat, those who live in the Greater
Tokyo area. In addition to these factors, personality traits matter. More risk-taking
individuals with lower time preferences and higher extraversion tend to use the
Go To programs. Most users did not take PCR tests, and, thus, these demand-
inducing policies increase the difficulty of infection control.

Reference
Acemoglu, D., V. Chernozhukov, I. Werning, and M. D. Whinston (2020). Optimal
 Targeted Lockdowns in a Multi-Group SIR Model
Anzai, A., Nishiura, H. (2021). “Go To Travel” Campaign and Travel-Associated
 Coronavirus Disease 2019 Cases: A Descriptive Analysis, July–August 2020.
 Journal of Clinical Medicine, 10, 398
Al-Samarraie, H., Eldenfria, A., & Dawoud, H. (2017). The impact of personality
 traits on users’ information-seeking behavior. Information Processing &
 Management, 53(1), 237-247.
Bell, S. T. (2007). Deep-level composition variables as predictors of team
 performance: A meta-analysis. Journal of Applied Psychology, 92, 595-615
Bradley, B. H., Baur, J. E., Banford, C. G., & Postlethwaite, B. E. (2013). Team
 players and collective performance: How agreeableness affects team
 performance over time. Small Group Research, 44(6), 680-711.
De La Rica, S., & Gortazar, L. (2016). Differences in job de-routinization in OECD
 countries: Evidence from PIAAC (No. 9736). IZA Discussion Papers.
Diener, E., Larsen, R. J., & Emmons, R. A. (1984). Person× Situation interactions:
 Choice of situations and congruence response models. Journal of personality
 and social psychology, 47(3), 580.
Farzanegan M., Gholipour, H., Feizi, M, Nunkoo, R., and A. Andargoli (2020),
 ‘International tourism and outbreak of Coronavirus (COVID-19): A cross-
 country analysis’, Journal of Travel Research.

 24
Fetzer, T. (2020). Subsidizing the Spread of Covid19: Evidence from the UK's
 Eat-out To-help-out Scheme. CAGE working paper 517, University of Warwick,
 Department of Economics.
Funashima, Y., & Hiraga, K. (2020). Where to Go: The Japanese Government's
 Travel Subsidy during COVID-19. Available at SSRN 3746114.
Jang, K. L., Livesley, W. J., & Vemon, P. A. (1996). Heritability of the big five
 personality dimensions and their facets: A twin study. Journal of
 personality, 64(3), 577-592.
Kraemer MUG, Yang C-H, Gutierrez B, et al. (2020) The effect of human mobility
 and control measures on the COVID-19 epidemic in China.
 Science;368:493–7.
Matsuura, T., Saito, H. (2021). Designing a tourism stimulus during the COVID-
 19 pandemic in Japan. RIETI Discussion Paper Series 21-E-012
Mehl, M. R., Gosling, S. D., & Pennebaker, J. W. (2006). Personality in its natural
 habitat: manifestations and implicit folk theories of personality in daily
 life. Journal of personality and social psychology, 90(5), 862.
Miyawaki, A., Tabuchi, T., Tomata, Y., & Tsugawa, Y. (2021). Association between
 participation in the government subsidy programme for domestic travel and
 symptoms indicative of COVID-19 infection in Japan: cross-sectional
 study. BMJ open, 11(4), e049069.
Nettle, D. (2009). Personality: What makes you the way you are. Oxford
 University Press.
OECD (2020), ‘Mitigating the impact of COVID-19 on tourism and supporting
 recovery’, OECD Tourism Papers, 2020/03, OECD Publishing, Paris.
Okubo, T. (2020). Spread of COVID-19 and Telework: Evidence from Japan.
 Covid Economics, 32, 1-25.
Okubo, T. & Nippon Institute for Research Advancement. (2021). Report on the
 results of a questionnaire survey concerning the impact of the use of telework
 to respond to the spread of the COVID-19 on working styles, lifestyles, and
 awareness. Nippon Institute for Research Advancement.
Paunonen, S. V. (2003). Big Five factors of personality and replicated predictions
 of behavior. Journal of personality and social psychology, 84(2), 411.
Soldz, S., & Vaillant, G. E. (1999). The Big Five personality traits and the life
 course: A 45-year longitudinal study. Journal of Research in
 Personality, 33(2), 208-232.
Wrzus, C., Wagner, G. G., & Riediger, M. (2016). Personality-situation

 25
You can also read