The labour market impact of COVID-19 lockdowns - Evidence from Ghana Simone Schotte,1,* Michael Danquah,1 Robert Darko Osei,2 and Kunal Sen1,3
←
→
Page content transcription
If your browser does not render page correctly, please read the page content below
WIDER Working Paper 2021/27

The labour market impact of COVID-19
lockdowns

Evidence from Ghana

Simone Schotte,1,* Michael Danquah,1 Robert Darko Osei,2 and
Kunal Sen1,3

February 2021
Abstract: In this paper, we provide causal evidence of the impact of stringent lockdown policies
on labour market outcomes at both the extensive and intensive margins, using Ghana as a case
study. We take advantage of a specific policy setting, in which strict stay-at-home orders were
issued and enforced in two spatially delimited areas, bringing Ghana’s major metropolitan centres
to a standstill, while in the rest of the country less stringent regulations were in place. Using a
difference-in-differences design, we find that the three-week lockdown had a large and significant
immediate negative impact on employment in the treated districts, particularly among workers in
informal self-employment. While the gap in employment between the treated and control districts
had narrowed four months after the lockdown was lifted, we detect a persistent nationwide impact
on labour market outcomes, jeopardizing particularly the livelihoods of small business owners
mainly operating in the informal economy.
Key words: COVID-19, lockdown, employment, informal economy, Ghana
JEL classification: I18, J46, J63, O55
Acknowledgements: This paper was prepared as part of the UNU-WIDER project
Transforming Informal Work and Livelihoods. The authors are grateful for valuable feedback and
comments on the survey instrument by Mike Rogan and Patricia Justino, and on earlier versions
of the paper by Costanza Biavaschi and Miri Styrjan, as well as participants in the SANEM
International Development Conference 2020 and the fifth annual conference on Inclusive Growth
in Mozambique. The authors are also indebted to the exceptional team of survey coordinators,
data managers, and research assistants at the Institute of Statistical, Social and Economic Research
(ISSER), University of Ghana, Legon, who made this research possible.

1UNU-WIDER; 2 Institute of Statistical Social and Economic Research, University of Ghana; 3 University of Manchester,
Manchester, United Kingdom; * corresponding author: schotte@wider.unu.edu
This study has been prepared within the UNU-WIDER project Transforming informal work and livelihoods.
Copyright © UNU-WIDER 2021 / Licensed under CC BY-NC-SA 3.0 IGO
Third-party content is not covered by the terms of the Creative Commons license. For permission to reuse third-party content,
please verify terms at the source and, if applicable, contact the rights holder.
Information and requests: publications@wider.unu.edu
ISSN 1798–7237 ISBN 978-92-9256-965-5
https://doi.org/10.35188/UNU-WIDER/2021/965-5
Typescript prepared by Joseph Laredo.
United Nations University World Institute for Development Economics Research provides economic analysis and policy advice
with the aim of promoting sustainable and equitable development. The Institute began operations in 1985 in Helsinki, Finland, as
the first research and training centre of the United Nations University. Today it is a unique blend of think tank, research institute,
and UN agency—providing a range of services from policy advice to governments as well as freely available original research.
The Institute is funded through income from an endowment fund with additional contributions to its work programme from
Finland, Sweden, and the United Kingdom as well as earmarked contributions for specific projects from a variety of donors.
Katajanokanlaituri 6 B, 00160 Helsinki, Finland
The views expressed in this paper are those of the author(s), and do not necessarily reflect the views of the Institute or the United
Nations University, nor the programme/project donors.
1 Introduction

To limit the spread of COVID-19, the infectious disease caused by the novel coronavirus,
policymakers around the world have enacted stringent containment and closure policies. In April
2020, rules on hygiene and social distancing reshaped daily life, schools and businesses were closed,
gatherings banned, and almost 2.7 billion workers, representing around 81 per cent of the world’s
workforce, were affected by partial or full lockdown regulations (ILO 2020a).

Stringent early confinement policies were implemented with the aim of reducing contagion and
buy time for health systems to create additional testing and treatment capacity, but at a high cost.
Beyond the drop in commodity prices and external demand, workplace closures and travel bans
led to a reduction in economic activity. Simulating different scenarios for the impact of COVID-
19 on global economic growth, the International Labour Organization (ILO) first warned in March
2020 against the risk of an economic and labour crisis that could increase global unemployment
by between 5.3 million (‘low’ scenario) and 24.7 million (‘high’ scenario), from a base level of 188
million in 2019. Beyond job losses and business closures, underemployment was also expected to
surge, as the economic consequences of the pandemic caused working hours and wages to decline,
in combination leading to a sharp rise in working poverty (ILO 2020b). Informal self-employment,
an activity of last resort that often serves to buffer the impact of economic shocks in developing
countries, was generally not available due to the imposed restrictions. Workers in this sector, who
need to earn a living on a day-to-day basis and have limited or no access to healthcare or social
safety nets, were severely hit (Danquah et al. 2020; ILO 2020c).

In this paper, we investigate changes in labour market outcomes since the onset of the pandemic,
using Ghana as a case study. We take advantage of a specific policy setting, in which strict stay-at-
home orders were issued and enforced in two spatially delimited areas, bringing Ghana’s major
metropolitan centres to a standstill, while in the rest of the country less stringent regulations were
in place. We exploit this geographic variation to estimate the differential impact of COVID-19-
related confinement measures on labour market outcomes in Ghana―at both the extensive and
the intensive margins―comparing the effects under the two alternative policy settings.

For this study, we conducted a rapid phone survey with a subsample of 662 workers drawn from
the 2018/19 Ghana Socioeconomic Panel Survey (GSPS). The data were collected between 19
August and 17 September 2020 and comprised recall information for the months of February,
before the coronavirus had reached Ghana, and April, when parts of Ghana were under lockdown,
allowing us to construct a longitudinal dataset at the worker level. Using a difference-in-differences
(DID) design, we estimate the causal short- and medium-term impact of the coronavirus pandemic
and associated lockdown measures on employment, labour earnings, and working hours. 1

Overall, the results of this study indicate that legal shutdown orders induced a substantial decline
in employment during the lockdown period in the affected districts. According to our preferred
specification―which includes worker-fixed effects and limits control districts to those in a
population density range that is comparable to the treated districts―workers in lockdown districts
faced a 63.4 per cent risk of being out of work in the month of April, compared with a ceteris
paribus risk of 28.3 per cent faced by workers located in districts not affected by the lockdown.

1
 Other studies that have used the DID design to analyse the causal effect of the COVID-19 pandemic on labour
market outcomes and wellbeing are Bargain and Aminjonov (2020), Brodeur et al. (2021), and Fang et al. (2020).

 1

This means that workers located in districts under lockdown had a 35.1 per cent lower chance of
continuing to work throughout April than workers in districts not subject to lockdown policies.

Despite this strong and significant short-term effect, we also find evidence for a strong recovery
in employment. Four months after the lockdown was lifted, we find no statistically significant
difference in employment rates between lockdown and no-lockdown districts. Nonetheless,
nationwide, workers’ chances of employment remained 11.6 percentage points below the February
2020 benchmark, indicating a persistent impact of the pandemic on the labour market. Similarly,
labour earnings and working hours remained significantly below pre-COVID levels.

Importantly, our analysis shows that the negative employment effect of the pandemic was not only
significantly more sizable in districts affected by the lockdown but was also concentrated among
workers in informal self-employment. In addition, across Ghana, the earnings of self-employed
workers and of female workers remained more negatively affected in the medium term. This
finding reinforces the results obtained by other studies in the Sub-Saharan African context,
suggesting that micro and small enterprises have experienced a greater decline in activity due to
the pandemic than medium and large enterprises (Lakuma and Sunday 2020), and informal workers
have been at the highest risk, given the nature of their work and lack of financial means to buffer
economic shocks (Balde et al. 2020; Bassier et al. 2020).

The paper is organized as follows. Section 2 provides relevant background information on the
COVID-19-related policy environment in Ghana. Section 3 introduces the data, discusses our
empirical approach and identification strategy, defines key variables of interest, and presents
descriptive statistics. Section 4 presents our estimation results, while Section 5 provides the results
of various robustness checks. Section 6 concludes.

2 Background and policy environment

The first two cases of COVID-19 were reported in Ghana on 12 March 2020. As a first response,
on 15 March, all public gatherings exceeding 25 people were banned, all schools and universities
were closed until further notice, and on 23 March all of the country’s borders were closed. Urban
market centres, providing essential services, were exempted from the suspension of public
gatherings, but measures to disinfect and enhance conditions of hygiene in markets were
implemented (Asante and Mills 2020). In addition, citizens were advised to strictly observe good
personal hygiene and social distancing to prevent the spread of the disease.

Despite these preventive measures, cases continued to rise and the two largest cities in Ghana,
Accra and Kumasi, emerged as ‘hotspots’ of the disease. As a result, on 27 March, the President
announced a partial lockdown of the Greater Accra and Greater Kumasi Metropolitan Areas and
contiguous districts, which was to take effect from 30 March 2020, 48 hours after the
announcement. The partial lockdown required that residents of the restricted districts stay at home,
and all passenger travel between the restricted districts and other parts of the country was
prohibited. Apart from essential workers, who continued their activities (including the production,
distribution, and marketing of food, beverages, pharmaceuticals, medicine, paper, and plastic
packages), people were allowed to leave home only to purchase essential goods, seek medical care,
undertake banking transactions, or use public sanitation facilities. Officers of the Ghana Police
Service and Ghana Armed Forces ware tasked to strictly enforce the lockdown (Asante and Mills
2020). The partial lockdown was initially announced for a period of two weeks, but ultimately was
extended to 21 April, lasting three weeks (21 days) in total. Although the partial lockdown was

 2
then lifted, the suspension of all public and social gatherings remained in effect throughout May
2020.

The first phase of the process of easing national restrictions began on 5 June. Provided social
distancing restrictions were met, public gatherings of up to 100 people were allowed, and junior
and senior high schools and universities re-opened from 15 June, so that older students could
resume classes ahead of exams. Large sporting events, political rallies, festivals, and religious events
remained suspended until 31 July. The second phase of re-opening started on 1 August, lifting
restrictions on the number of people in public gatherings and opening tourist sites. However,
beaches, pubs, cinemas, and nightclubs remained closed. International flights resumed from 1
September, subject to enhanced COVID-19 protocols. Land and sea borders remained closed to
human traffic.

Figure 1 illustrates the stringency of policy measures that were in place in Ghana between January
and November 2020 in response to the COVID-19 pandemic. The stringency index shows the
response level in the national subregion with the strictest policies (districts subject to lockdown
regulations) and the grey shaded area indicates the lockdown period. 2
Figure 1: COVID-19 cases and government response stringency index in Ghana

 100 900

 Confirmed COVID-19 Cases
 90 800
 Stringency Index (OxBSG)

 80 700
 70 600
 60
 500
 50
 400
 40
 30 300
 20 200
 10 100
 0 0

 Date in 2020

 Lockdown period Stringency Index (OxBSG) New COVID-19 cases (smoothed)

Note: the grey shaded area demarcates the lockdown period from 30 March to 19 April. The stringency index is a
composite measure based on nine response indicators including school closures, workplace closures, and travel
bans, rescaled to a value from 0 to 100 (strictest); it shows the pandemic response level in the districts subject to
the strictest lockdown measures.
Source: authors’ illustration based on Hale et al. (2020) and Roser et al. (2020).

Considering the evolution of newly confirmed COVID-19 cases, the Ghanaian government was
quick to implement stringent measures, when case numbers were still relatively low. From a public
health perspective, the lifting of the partial lockdown may be considered premature. The number
of confirmed COVID-19 infections continued to escalate during the lockdown and increased

2
 The Coronavirus Government Response Tracker (OxCGRT), published and managed by researchers at the Blavatnik
School of Government at the University of Oxford (Hale et al. 2020), collects publicly available information on 17
indicators of government responses, spanning containment and closure policies (such as school closures and
restrictions on movement); economic policies; and health system policies (such as testing regimes). The indicators are
aggregated into a set of four common indices, one of which is the stringency index presented here.

 3
exponentially after restrictions were lifted, reaching peak levels only in late July or early August,
after which the pandemic curve flattened. The decision to lift the partial lockdown was largely
influenced by mounting concerns regarding the severe economic burden that the restrictions
posed, especially on the livelihoods of the urban poor, many of whom had by that time run out of
money to buy food, due both to the hike in food prices and to the restricted possibilities to earn a
living (Asante and Mills 2020).

3 Data, empirical strategy, and descriptive statistics

In this section, we present our data, including descriptive statistics, and outline our empirical
strategy and approach to identification. As discussed in Section 2, to confine the spread of the
coronavirus, the Ghanaian government implemented a geographically contained three-week
lockdown covering the Greater Accra and Greater Kumasi Metropolitan Areas and contiguous
districts from 30 March to 21 April 2020, while other areas were subject to less stringent
regulations. In this study, we intend to exploit this geographic variation using a DID design to
estimate the labour market impact of the pandemic under the two distinct policy settings,
distinguishing between respondents in lockdown (treated) and no-lockdown (control) districts.

3.1 Data sources

The sample for this study was drawn from the most recent round of the Ghana Socioeconomic
Panel Survey (GSPS), which is a joint effort between the Economic Growth Centre (ECG) at Yale
University and the Institute of Statistical, Social and Economic Research (ISSER) at the University
of Ghana. The first round of the GSPS was collected in 2009/2010, consisting of a nationally
representative sample of 5,010 households in 334 enumeration areas containing 18,889 household
members. Two follow-up rounds were conducted in 2013/14 and 2018/19.

To construct the sampling frame for this study, we focused on the GSPS Wave 3 (W3) adult
population in urban areas who were heads of household and had been working (outside of
smallholder agriculture) in the last survey round. From these we drew a random sample of 937
respondents, stratified by geographic location, occupational position (wage employee vs. self-
employed) and formality status (formal vs. informal employment). Among those who were
contacted, 187 could not be reached, 17 were no longer members of the same household, 10 could
not be unequivocally identified, and in 8 cases the interview was not completed, leaving us with a
sample of 662 respondents, of whom 612 reported having been working in February 2020. To
those who were successfully contacted, a structured questionnaire was administered by trained
local enumerators using phone interviews.

The GSPS-COVID survey asked multiple questions about the respondents’ perception of and
compliance with the pandemic response measures implemented by the national government, and
the economic and labour market impact that they had experienced. Concerning the latter,
respondents were asked retrospectively about their household’s economic wellbeing and their own
employment situation in February (i.e. before the coronavirus had reached Ghana), in April (the
month when parts of Ghana were under lockdown), as well as in the seven days prior to the
interview, which took place between 19 August and 17 September 2020.

 4
3.2 Empirical strategy and identification

We centre our discussion around analysing the effect of COVID-19-related lockdown policies on
labour market outcomes in Ghana. Lockdown here refers to a legally enforceable order for
residents to remain in their homes except for essential trips. We take advantage of the Ghana-
specific policy context, in which strict lockdown policies were issued and enforced in two spatially
delimited areas, while in the rest of the country less stringent regulations were in place. We exploit
this geographic variation to estimate the differential labour market impact of strict stay-at-home
orders using a DID design.

In the first part of the analysis, we investigate the policy impact at the extensive margin, focusing
on the employment status of the worker. Here, the dependent variable is a binary indicator that
takes on a value of one if the respondent is working (actively working or on paid leave) and zero
otherwise (either temporarily or permanently out of work). The second part of the analysis
investigates the impact at the intensive margin. Here, we use working hours and labour earnings
as relevant outcomes of interest. Labour earnings are deflated to constant 2018 prices using the
Ghana Statistical Service (GSS) monthly consumer price index as of August 2020 (GSS 2020).

Our DID design builds on a basic comparison between changes in these labour market outcomes
among respondents in lockdown districts, considered ‘treated’, and respondents in no-lockdown
districts, considered ‘control’. Our analysis compares the changes in labour market outcomes
between three points in time: (i) February 2020, the base period before the COVID-19 pandemic
had reached Ghana; (ii) April 2020, when parts of Ghana were under lockdown; and (iii)
August/September 2020, when the most stringent policy measures had been relaxed. Changes that
occurred between February and April 2020 (first post-treatment period) will give an indication of
the immediate short-term effects of the COVID-19 pandemic and related policy measures, while
changes that occurred from February up to August/September 2020 (second post-treatment
period) will give an indication of the medium-term implications. In addition, a backward-looking
comparison of changes in labour market outcomes between 2018/2019 and February 2020 (pre-
treatment period) will serve to verify the common trends assumption underlying the DID
identification strategy (provided as a robustness check).

We write the DID regression model as:
 = 0 + 1 + 2 ( × 1 )
 (1)
 + 3 ( × 2 ) + 4 + +

where the dependent variable is the labour market outcome of worker in district at time .
 is a dummy variable that defines the treatment status at the district level, taking on
a value of one for districts that were subject to lockdown policies, and zero otherwise. 1 and
 2 are dummy variables that take on a value of one for the first and second post-treatment
period, respectively, and zero otherwise. The coefficients of the interaction terms, 2 and 3 , yield
the DID estimates that capture the effect of the lockdown policies on the outcome variables. We
also control for time-fixed effects, , to identify the period-specific impact on labour market
outcomes across treated and control districts. is a vector of time-fixed worker-specific control
variables, and is the error term. The standard errors are clustered at the district level.

In the base specification, we estimate equation (1) using ordinary least squares (OLS) regression.
Taking advantage of the panel structure of our data, we also estimate a second model that controls
for worker-fixed effects, :

 = 0 + 1 ( × 1 ) + 2 ( × 2 ) + + + . (2)

 5
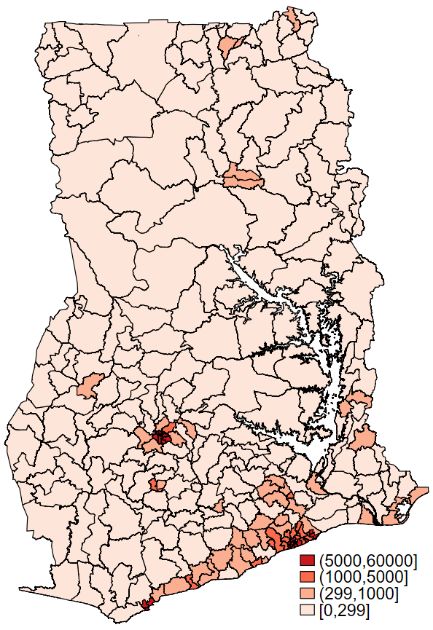
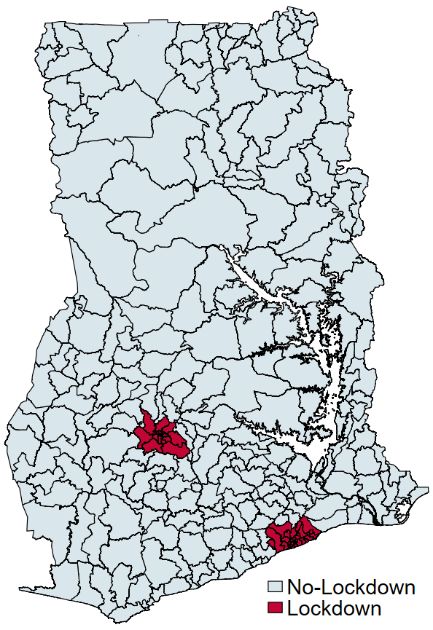
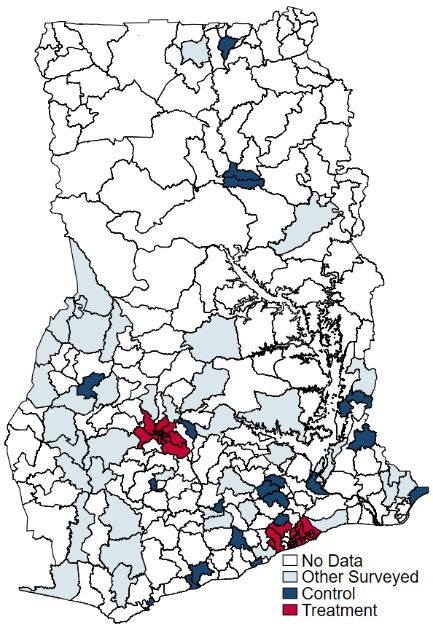
This is our preferred specification, as the worker-fixed effects, , absorb any worker-specific
heterogeneities that may contaminate our DID estimates (see Fang et al. 2020 for a similar
specification used to quantify the causal impact of human mobility restrictions on the containment
and delay of the spread of the novel coronavirus in China). Given that the location of workers is
fixed in our data over the study period, the worker-fixed effects, , also absorb any time-constant
differences between districts. To ensure the robustness of our results, we estimate several variants
of both equations on different subsamples.

As can be seen from Figure 2 panels (a) and (b), the districts that were subject to lockdown policies
in Ghana comprise the two most densely populated urban centres. To increase comparability
between the treatment and control groups, in the empirical estimation, control districts will be
limited to those with a population density above 300/km². This cut-off value is fixed in reference
to the population density in the least densely populated treated district.
Figure 2: Lockdown versus no-lockdown study areas

 a) Greater Accra and Greater b) Population density across c) Control districts limited to
 Kumasi Metropolitan Areas and districts (population per km2) those with a population density
 contiguous districts that were above 300/km²
 under lockdown
Note: population projections for 2020 by the Ghana Statistical Service (GSS) based on the 2010 Population and
Housing Census.
Source: authors’ illustration based own GSPS-COVID-19 survey.

3.3 Descriptive statistics

Table 1 reports the summary statistics of average worker characteristics by district treatment status.
Our sample was drawn from the GSPS W3 adult population, limited to those who were living in
urban areas, were heads of household, and were working outside of agriculture in 2018/19.
Accordingly, in the GSPS-COVID sample, 82.1 per cent of respondents identified as heads of
household and 92.6 per cent reported being employed in February 2020. Of the respondents in
our sample, 48.3 per cent are female and the average age is 44 years. Among those respondents
who were working in February 2020, 26.5 per cent were in formal employment, and 37.4 per cent

 6
reported being in wage employment. 3 Thus, despite the urban focus and exclusion of agriculture,
the informality rate is above 70 per cent, and every second worker was in informal self-employment
prior to the pandemic (both matching the shares observed in earlier GSPS rounds). We find no
statistically significant differences in any of these dimensions between workers in treatment versus
control districts (see Table 1).
Table 1: Average worker characteristics by district treatment status

 (1) (2) (3) (1) - (3)
Characteristics in Aug/Sep 2020 No-lockdown P-value
 Lockdown No-lockdown Difference
(unless otherwise specified) size cut-off Ha: diff != 0
Female 0.453 0.504 0.491 -0.038 0.4282
 (0.030) (0.026) (0.038) (0.048)
Age in years 45.4 43.4 43.7 1.679 0.1414
 (0.704) (0.601) (0.887) (1.134)
Head of household 0.833 0.813 0.838 -0.005 0.8938
 (0.022) (0.020) (0.028) (0.036)
Household size 2.609 3.434 3.428 -0.819*** 0.0000
 (0.094) (0.105) (0.158) (0.172)
Moved since last interview 0.087 0.122 0.139 -0.052* 0.0844
 (0.017) (0.017) (0.026) (0.030)
Married (2018/19)ª 0.471 0.488 0.456 0.014 0.7671
 (0.030) (0.026) (0.038) (0.048)
Secondary education (2018/19)ª 0.174 0.203 0.181 0.007 0.8593
 (0.024) (0.021) (0.031) (0.039)
Tertiary education (2018/19)ª 0.143 0.144 0.194 0.050 0.1761
 (0.022) (0.019) (0.031) (0.037)
Working in Feb 2020 0.935 0.919 0.925 0.010 0.6872
 (0.015) (0.014) (0.020) (0.025)
Formal employment in Feb 2020 0.244 0.279 0.267 -0.023 0.6010
 (0.027) (0.024) (0.035) (0.044)
Wage employment in Feb 2020 0.422 0.341 0.385 0.037 0.4500
 (0.031) (0.025) (0.038) (0.049)

Number of observations 276 385 173 449 449

Notes: ª Information not collected in the GSPS-COVID survey and therefore taken from GSPS Wave 3 (2018/19).
Standard errors in parentheses, * p
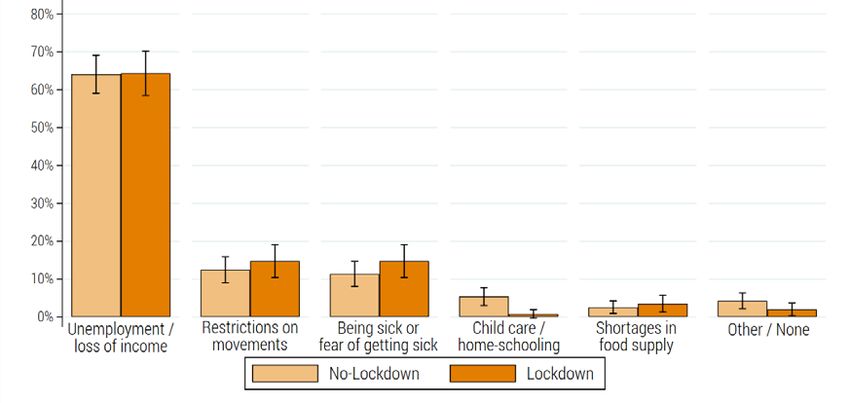
While other worker characteristics are balanced between control and treated groups, we find that
the average household size reported at the time of the interview (August/September 2020) among
respondents in lockdown districts was significantly smaller than in districts not affected by the
lockdown, and in fact had declined by 0.68 members on average compared with the 2018/19
estimate. Specifically, the average household size in the treated districts in February 2020 was 2.6
members, compared with 3.5 members in the control districts (see Table 1). The latter is close to
the average household size of 3.4 members reported by the same respondents in 2018/19, for
which we find no statistically significant difference by district treatment status. We also observe
that a larger share of respondents in control districts had moved since the last interview round in
2018/19. Previous research has shown that, in anticipation of the lockdown restrictions and the
expected consequences for doing business in affected districts, a non-negligible number of migrant
workers in Ghana relocated to their hometowns between 28 and 29 March 2020 (Asante and Mills
2020; see also Lee et al. 2020 for similar evidence from India). If respondents with a higher risk
of losing work during the lockdown were more likely to move out of treated districts and continue
work in districts with no lockdown policies in place, this self-selection could cause our estimates
to be biased. We check the robustness of our findings to the exclusion of movers in Section 5.

Figure 3 provides a ranking of aspects of the COVID-19 pandemic that, according to respondents,
had the largest impact on them personally. Just under two-thirds of respondents selected
unemployment or loss of income as the most important factor. Interestingly, this applies equally
to respondents located in lockdown versus no-lockdown districts. In addition, 14.7 per cent of
respondents in lockdown and 12.4 per cent of respondents in no-lockdown districts reported
restrictions on movement as their primary concern. Similarly, 14.7 per cent of respondents in
lockdown and 11.3 per cent of respondents in no-lockdown districts mentioned being sick or fear
of getting sick as the aspect that impacted them the most. Yet, the differences in average shares
between lockdown and no-lockdown districts are not statistically significant. With 5.4 versus 0.8
per cent, childcare and home-schooling were a significantly larger concern among respondents in
no-lockdown versus lockdown districts. In both areas, a relatively small share of 2.5 to 3.5 per cent
saw shortages in food supply as the biggest worry. Other concerns were raised by 1.7 and 0.4 per
cent of respondents in no-lockdown and lockdown districts, respectively. In the former, 2.5 per
cent of respondents said they had not been impacted by the pandemic at all, while the same applied
to 1.6 per cent of respondents in lockdown districts.
Figure 3: Aspects of the COVID-19 pandemic that had the largest impact on respondents

Note: sample limited to respondents who had been working February 2020. Average shares with 95% confidence
intervals.
Source: authors’ illustration based on GSPS-COVID-19 survey.

 8
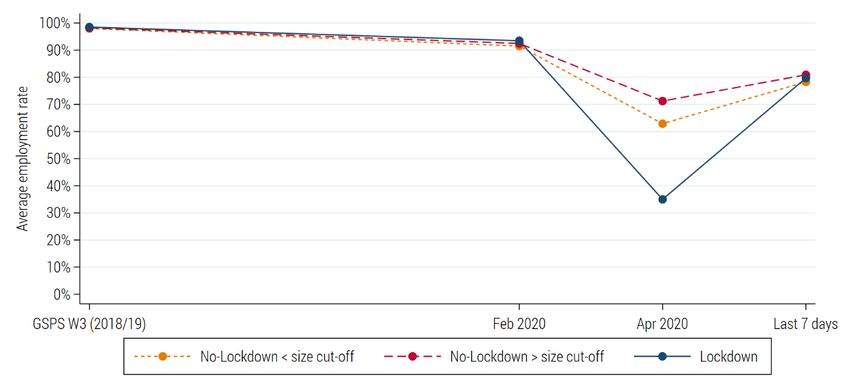
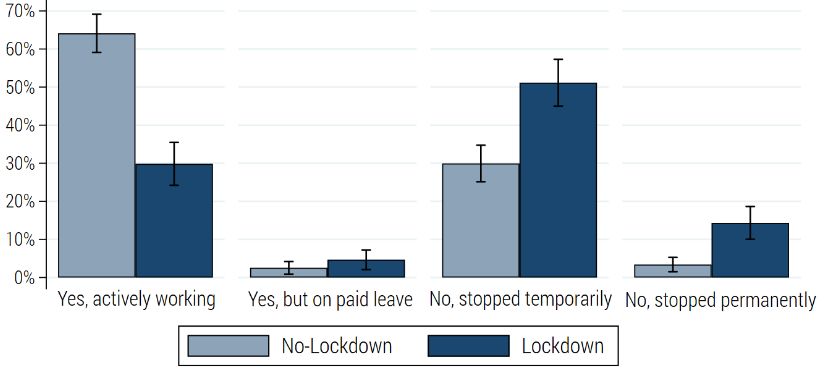
Even though the type of worries expressed by respondents in treated and control districts are very
similar, the extent to which these materialized differs considerable. Specifically, we observe a stark
difference in short-term employment effects at the extensive margin. The trends displayed in
Figure 4 reveal a much sharper drop in employment rates in treated versus control districts in the
month of April, when treated districts were under lockdown. Overall, we observe a recovery in
employment up to August/September 2020 throughout the country, with employment rates in our
sample nevertheless remaining below the February average.
Figure 4: Time trends in employment, lockdown versus no-lockdown districts

Note: the GSPS-COVID-19 sample was drawn from the GSPS W3 adult population in urban areas, limited to
those who were heads of household and had been working in 2018/19. We distinguish no-lockdown districts
below and above the population density cut-off value set at 300/km².
Source: authors’ illustration based on GSPS-COVID-19 survey.

While respondents in both lockdown and no-lockdown districts worried about unemployment and
loss of income as a result of the COVID-19 pandemic (see Figure 3), the descriptive evidence
suggests that 66.7 per cent of respondents in no-lockdown districts continued working throughout
the month of April, compared with 34.5 per cent of respondents in lockdown districts (Figure 5a).
Importantly, the majority (51.2 per cent) of respondents in lockdown districts said that they had
stopped working temporarily, while 14.3 per cent considered this break to be permanent (Figure
5b).
Figure 5: Employment status in lockdown and no-lockdown districts

 a) April 2020 and last seven days b) Detailed employment status in April 2020
Note: sample limited to respondents who had been working February 2020. Average shares with 95% confidence
intervals.
Source: authors’ illustration based on GSPS-COVID-19 survey.

 9
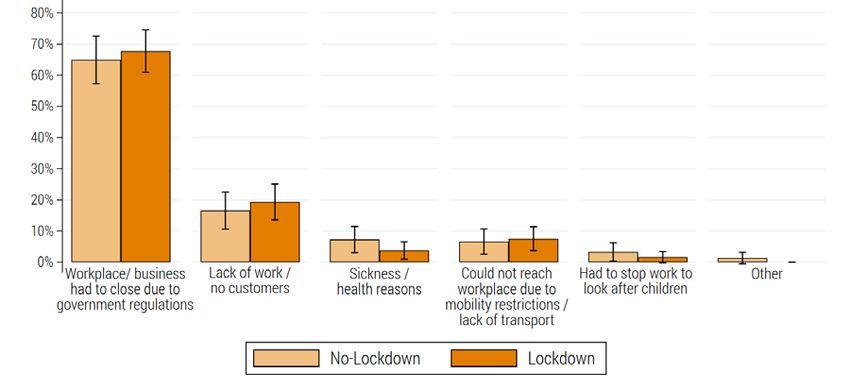
In line with this perception, we observe that at the time of the interview (August/September 2020),
the gap in employment rates between lockdown and no-lockdown districts had closed. In districts
that had been under lockdown, 84.1 per cent of respondents who had been working in February
2020 were observed to be working again, compared with 86.2 per cent of respondents in no-
lockdown districts (Figure 5a).

While the immediate employment effect was significantly more pronounced in lockdown districts,
the reasons for the break in employment reported by respondents who were out of work in April
were largely similar between both areas (Figure 6). The vast majority of respondents (64.9 per cent
in no-lockdown and 67.7 per cent in lockdown districts) reported workplace or business closures
due to government regulations as the main reason for stopping work in April, followed by a lack
of work or customers (16.6 per cent in no-lockdown and 19.4 per cent in lockdown districts).
Figure 6: Main reason for stopping work in April 2020

Note: sample limited to respondents who had been working February and out of work in April 2020. Average
shares with 95% confidence intervals.
Source: authors’ illustration based on GSPS-COVID-19 survey.

Importantly, while workers throughout Ghana reported government regulations and a lack of work
or customers as the main reasons for stopping work in April 2020, the short-term employment
effect of the pandemic was not only significantly more sizable in districts affected by the lockdown,
but was also concentrated among workers in informal self-employment (Figure 7). This finding is
in line with the evidence presented by other studies. For example, a recent rapid survey of
businesses in Uganda suggests that lockdown measures have reduced business activity by more
than half, and finds that micro and small enterprises have experienced a larger decline in activity
than medium and large enterprises (Lakuma and Sunday 2020). Similarly, real-time survey data
collected in Senegal, Mali, and Burkina Faso suggest that on average, by the end of April, one out
of four workers had lost their jobs and one out of two workers had experienced a decline in
earnings. Informal workers were at higher risk, as they generally rely on daily sales for their
earnings, lack mechanisms for collective bargaining, and tend to be in activities that are contact-
intensive and thus particularly affected by the pandemic response measures—such as restaurants,
tourism businesses, small retail shops, hairdressing, and taxi driving (Balde et al. 2020). However,
to the contrary, we also observe that workers in informal self-employment were most likely to
continue working in no-lockdown districts. As indicated, most workers in this group are low-
income earners with no or small savings, who need to earn a living on a daily basis (Danquah et
al. 2019). Therefore, where possible, they would continue working in spite of the danger posed by
the pandemic (Durizzo et al. 2021; Kazeem 2020).

 10
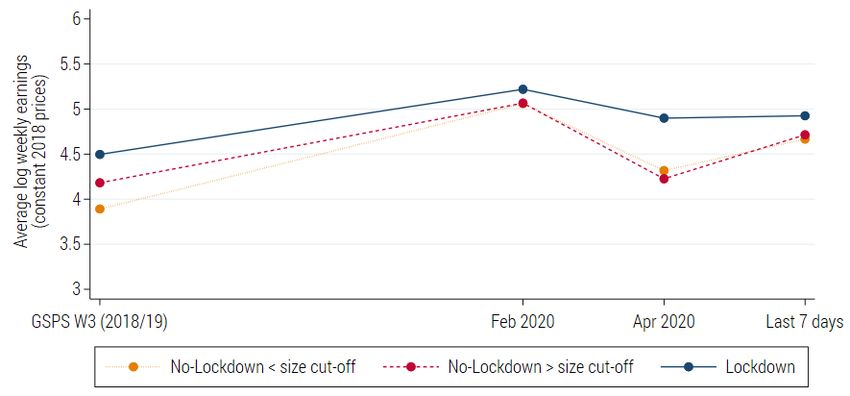
Figure 7: Employment rates in lockdown and no-lockdown districts in April, by work status in February 2020

Notes: sample limited to respondents who had been working February 2020. SE = self-employed; WE = wage
employed. Average shares with 95% confidence intervals.
Source: authors’ illustration based on GSPS-COVID-19 survey.

In districts that were not subject to the lockdown, labour market dropout in April was highest
among workers in informal wage employment. This is most likely explained by the low degree of
employment security in these jobs, which lack basic contractual rights (Danquah et al. 2019). These
workers were likely to be the first to be laid off in the face of the decline in economic activity
caused by the pandemic. At the other extreme, workers in formal wage employment were the most
likely to continue to work in spite of lockdown policies. This can be attributed to the higher level
of job security and employment protection characterizing these jobs (Danquah et al. 2019). It may
also be partly explained by the type of tasks performed in these jobs, which tend to be higher
skilled and may more often be performed from home.

Lastly, at the intensive margin, Figure 8 documents the trends in average weekly earnings among
those with non-zero labour incomes. The visual analysis suggests that the common trends
assumption for the pre-treatment period is more likely to hold when defining the control group,
which comprises no-lockdown districts with a population density above 300/km². This will be
formally tested in the next section. We observe that average earnings tended to be higher in treated
than control districts and followed relatively similar trends up to February 2020.
Figure 8: Time trends in weekly earnings, lockdown vs. no-lockdown districts

Note: sample in each period limited to respondents who reported non-zero (positive) labour incomes. We
distinguish no-lockdown districts below and above the population density cut-off value set at 300/km².
Source: authors’ illustration based on GSPS-COVID-19 survey.

 11
According to Figure 8, the drop in average log weekly earnings was more pronounced in districts
not affected by the lockdown. When interpreting this pattern, it is important to keep in mind that
here we are considering only non-zero earnings of workers who continued working in April. As
discussed above, in districts under lockdown, a substantially larger share of workers had stopped
working completely (Figure 4 and Figure 5), and workers in informal self-employment were the
worst affected (Figure 7). This implies that a larger share of low-income workers continued
working in no-lockdown districts, while formal wage workers, who tend to hold higher paying
jobs, were the most likely to continue working in April in lockdown districts. Overall, we observe
a recovery in earnings up to August/September 2020 throughout the country, with earnings levels
nevertheless remaining below the February average.

4 Estimation results

This section presents our estimation results. We first focus on the impact of coronavirus lockdown
measures at the extensive margin, investigating the short- and medium-term impact on
employment rates. Second, we examine the impact at the intensive margin, estimating the short-
and medium-term impact on labour earnings and working hours. As discussed earlier, the sample
was drawn from the GSPS W3 (2018/19) panel survey. The data were collected in
August/September 2020, comprising recall information for April 2020 and February 2020,
allowing us to construct a longitudinal dataset at the worker level and to estimate the effects using
panel data methods. Our estimations employ robust standard errors clustered at the district level.

4.1 Impact of the lockdown on employment

Table 2 shows the linear probability estimates of working in April 2020 and in the seven days prior
to the interview in August/September 2020, relative to the base period in February 2020,
depending on the treatment status of the districts were workers are located. Column (1) presents
the estimates for the full sample, while columns (2)–(4) present estimates for our preferred sample
specification, limiting no-lockdown control districts to those with a minimum population density
of 300/km². Column (3) controls for a set of worker-level covariates―including gender, head of
household, age categories (
Table 2: Impact of the coronavirus lockdown on employment

Dependent variable: (1) (2) (3) (4)
Working in period t (=1 if Full sample District size cut-off District size cut-off District size cut-off
YES) with covariates with worker FE
Post-period (base Feb 2020)
April 2020 -0.253*** -0.212*** -0.216*** -0.283**
 (0.034) (0.046) (0.046) (0.047)
Last 7 days -0.125*** -0.116*** -0.116*** -0.116***
 (0.019) (0.026) (0.026) (0.026)

Lockdown 0.015 0.010 0.017
 (0.029) (0.033) (0.036)

Lockdown × April 2020 -0.332*** -0.372*** -0.370*** -0.351***
 (0.049) (0.058) (0.058) (0.051)
Lockdown × Last 7 days -0.013 -0.022 -0.022 -0.022
 (0.024) (0.030) (0.030) (0.030)

Observations 1,936 1,318 1,318 1,318
Covariates NO NO YES NO
Worker-fixed effects (FE) NO NO NO YES

Note: covariates include gender, head of household, age categories (
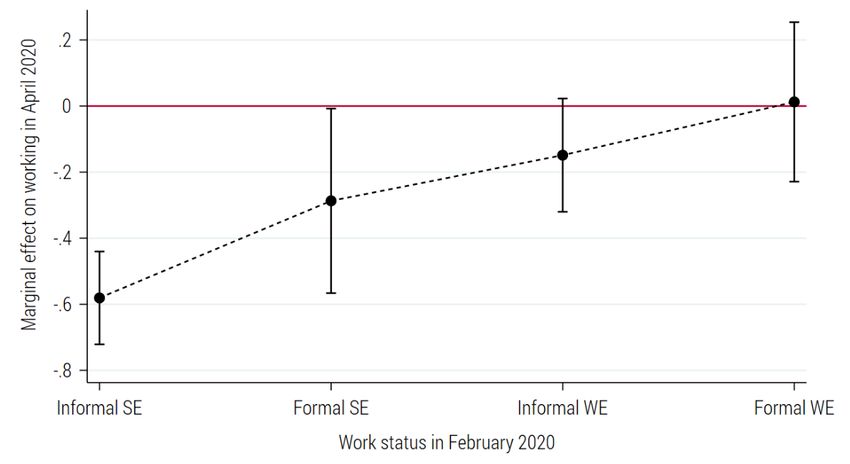
lockdown seems to have affected self-employed workers more than wage employees (Figure 9).
This observation could be explained by a larger decline in the activity of micro and small
enterprises (often operated by own account workers or family enterprises without no external
employees) compared with medium and large enterprises (Lakuma and Sunday 2020).
Figure 9: Impact of the coronavirus lockdown on employment in April, by work status in February 2020

Note: regression fitted to 418 observations. Control districts limited to those with a population density above
300/km². Sample limited to respondents who had been working in February 2020. SE = self-employed; WE =
wage employed. Covariates include gender, head of household, age categories (
had stopped work temporarily in April 2020 were only 1.7 (-18.5+16.7) per cent less likely still to
be out of work in August/September 2020, suggesting a significantly stronger recovery (Table 3).
Table 3: Impact of the coronavirus lockdown on employment in last seven days, by work status in April 2020

 (1) (2) (3)
Dependent variable: Full sample Full sample District size cut-off
Working in last 7 days (=1 if YES) with covariates with covariates
Lockdown -0.007 -0.018 -0.016
 (0.024) (0.026) (0.032)
Status in April 2020 (base: actively working)
On paid leave 0.070*** 0.012 0.031
 (0.016) (0.028) (0.029)
Temporarily stopped -0.184*** -0.185*** -0.216***
 (0.042) (0.044) (0.062)
Permanently stopped -0.430** -0.455*** 0.031
 (0.172) (0.167) (0.036)

Lockdown × On paid leave 0.007 0.051* 0.036
 (0.024) (0.031) (0.030)
Lockdown × Temporarily stopped 0.149** 0.167*** 0.194**
 (0.060) (0.060) (0.078)
Lockdown × Permanently stopped -0.033 0.015 -0.477***
 (0.196) (0.191) (0.100)

Observations 612 612 418
Covariates NO YES YES

Note: sample limited to respondents who had been working February 2020. Covariates include gender, head of
household, age categories (
2018 prices, taking into account sharp price increases in consumer products and the falling
purchasing power of earnings since the onset of the pandemic. Without accounting for inflation,
a somewhat smaller decline in average weekly earnings of 21.7–32.3 per cent would have been
estimated, depending on the specification.
Table 4: Impact of the coronavirus lockdown on log weekly earnings

Dependent variable: (1) (2) (3) (4)
Log weekly earnings in Full sample District size cut- District size cut- District size cut-off
period t (constant 2018 off off with covariates with worker FE
prices)

Post-period (base Feb 2020)
April 2020 -0.789*** -0.840*** -0.850*** -0.658***
 (0.104) (0.173) (0.161) (0.107)
Last 7 days -0.373*** -0.352*** -0.314*** -0.459***
 (0.057) (0.079) (0.083) (0.067)

Lockdown 0.156* 0.153 0.156
 (0.091) (0.124) (0.102)

Lockdown × April 2020 0.458*** 0.509** 0.442** 0.346***
 (0.137) (0.195) (0.185) (0.111)
Lockdown × Last 7 days 0.077 0.055 0.003 0.135
 (0.104) (0.118) (0.118) (0.084)

Observations 1,061 710 710 710
Covariates NO NO YES NO
Panel effects RE RE RE FE

Note: covariates include gender, head of household, age categories (
Table 5: Impact of the coronavirus lockdown on weekly working hours

Dependent variable: (1) (2) (3) (4)
Weekly hours worked in Full sample District size cut- District size cut- District size cut-off
period t off off with covariates with worker FE
Post-period (base Feb 2020)
April 2020 -19.320*** -19.197*** -15.752*** -14.226***
 (3.297) (3.905) (4.772) (4.581)
Last 7 days -6.474*** -8.278*** -4.861*** -6.955***
 (1.661) (2.413) (1.681) (1.811)

Lockdown 2.402 2.529 2.723
 (2.121) (2.668) (2.600)

Lockdown × April 2020 12.106** 11.983** 12.539* 8.902*
 (4.974) (5.416) (6.592) (5.147)
Lockdown × Last 7 days -3.751* -1.947 -0.534 0.631
 (2.134) (2.765) (2.038) (2.059)

Observations 1,177 809 761 761
Covariates NO NO YES NO
Panel effects RE RE RE FE

Note: covariates include gender, head of household, age categories (
Table 6: Changes in log weekly earnings by employment status in February 2020

Dependent variable: (1) (2) (3) (4)
Log weekly earnings in period t Full sample Full sample Full sample Full sample
(constant 2018 prices) with covariates with covariates with worker FE

Post-Period (base Feb 2020)
Last 7 days -0.227** -0.230** -0.187** -0.222***
 (0.101) (0.089) (0.087) (0.055)

Self-employed in Feb 2020 0.126 0.289*** 0.271***
 (0.121) (0.103) (0.099)
Formal work in Feb 2020 0.301*** 0.181* 0.187*
 (0.102) (0.101) (0.101)
Female -0.290*** -0.230**
 (0.091) (0.101)

Last 7 days × Self-employed in Feb 2020 -0.265*** -0.263*** -0.222** -0.170**
 (0.091) (0.089) (0.106) (0.076)
Last 7 days × Formal in Feb 2020 0.088 0.114 0.099 0.067
 (0.120) (0.122) (0.119) (0.089)
Last 7 days × Female -0.144 -0.205**
 (0.115) (0.087)

Observations 876 876 876 876
Covariates NO YES YES NO
District fixed effects YES YES YES NO
Panel effects RE RE RE FE

Note: sample limited to respondents who had been working February 2020. Covariates include gender, head of
household, age categories (
Table 7: Impact of the coronavirus lockdown on labour market outcomes

 (1) (2) (3)
 Working in period t Log weekly earnings Weekly hours worked
 (=1 if YES) (constant 2018 prices) in period t
 in period t
Post-period (base Feb 2020)
April 2020 -0.283** -0.658*** -14.226***
 (0.047) (0.107) (4.581)
Last 7 days -0.116*** -0.459*** -6.955***
 (0.026) (0.067) (1.811)

Lockdown × April 2020 -0.351*** 0.346*** 8.902*
 (0.051) (0.111) (5.147)
Lockdown × Last 7 days -0.022 0.135 0.631
 (0.030) (0.084) (2.059)

Observations 1,318 710 761
Panel effects FE FE FE

Note: FE = fixed effects (within) regression; control districts limited to those with a population density above
300/km²; standard errors in parentheses, clustered at the district level; *p
Table 8: Pre-treatment trends in labour market outcomes by treatment status

 (1) (2) (3)
 Working in period t Log weekly earnings Weekly hours worked
 (=1 if YES) (constant 2018 prices) in period t
 in period t
Pre-period (base Feb 2020)
GSPS W3 (2018/19) 0.0602*** -0.799*** -0.338
 (0.022) (0.188) (3.164)

Lockdown × GSPS W3 -0.008 0.096 0.258
 (0.027) (0.220) (3.537)

Observations 884 734 846
Panel effects FE FE FE

Note: FE = fixed effects (within) regression; control districts limited to those with a population density above
300/km²; standard errors in parentheses, clustered at the district level; *p
Table 9: Impact of the coronavirus lockdown on labour market outcomes, exclusion of movers

 (1) (2) (3)
 Working in period t Log weekly earnings Weekly hours worked
 (=1 if YES) (constant 2018 prices) in period t
 in period t
Post-period (base Feb 2020)
April 2020 -0.282*** -0.710*** -13.476****
 (0.038) (0.121) (3.959)
Last 7 days -0.114*** -0.507*** -10.188***
 (0.026) (0.085) (2.949)

Lockdown × April 2020 -0.349*** 0.386*** 3.604
 (0.050) (0.126) (5.339)
Lockdown × Last 7 days -0.0208 0.216** -0.294
 (0.035) (0.100) (3.146)

Observations 1,178 636 724
Panel effects FE FE FE

Note: FE = fixed effects (within) regression; control districts limited to those with a population density above
300/km²; standard errors in parentheses, clustered at the district level; *p
Table 10: Impact of the coronavirus lockdown on labour market outcomes, exclusion of major metropolitan districts

 (1) (2) (3)
 Working in period t Log weekly earnings Weekly hours worked
 (=1 if YES) (constant 2018 prices) in period t
 in period t
Post-period (base Feb 2020)
April 2020 -0.283*** -0.658*** -14.226***
 (0.036) (0.107) (4.592)
Last 7 days -0.116*** -0.459*** -6.955***
 (0.024) (0.067) (1.816)

Lockdown × April 2020 -0.319*** 0.300** 12.401**
 (0.063) (0.127) (6.080)
Lockdown × Last 7 days -0.032 0.135 3.394
 (0.044) (0.136) (2.265)

Observations 785 444 467
Panel effects FE FE FE

Note: FE = fixed effects (within) regression; control districts limited to those with a population density above
300/km²; standard errors in parentheses, clustered at the district level; *p
effect from 30 March to 21 April 2020, had a large and significant immediate negative impact on
employment in the affected districts.

While the gap in employment between workers located in treated versus control districts had
narrowed four months after legal shutdown orders had been lifted, we find a persistent nationwide
effect of the pandemic on labour market outcomes in Ghana, at both the extensive and the
intensive margins. This effect, however, does not seem to depend on the stringency level of
confinement policies, but may rather be attributable to an overall economic decline, which in the
case of Ghana has been driven by the global drop in commodity prices and external demand from
the main trading partners―including China, India, the United States, and several European
countries―amongst other factors.

Importantly, we find that the short-term employment effect of the lockdown was felt most by
workers in informal self-employment and, across the country, the earnings of self-employed
workers and women remained more negatively affected in the medium term. To this extent, our
results also echo concerns regarding the poverty and livelihoods implications of the COVID-19
pandemic. As Bassier et al. (2020) point out in their analysis on South Africa, not only were
informal workers and their households particularly vulnerable to the negative economic
consequences of the pandemic and associated lockdown measures, considering their need to earn
a living on a daily basis, but the very fact of their informality also presented a challenge for
governments to provide targeted economic relief. To prevent a persistent deepening of existing
vulnerabilities and labour market inequalities, our results point to a continued need for effective
strategies to address the business and livelihood needs of small business owners, especially women
and those operating in the informal sector.

References

Asante, L.A., and R.O. Mills (2020). ‘Exploring the Socio-Economic Impact of COVID-19 Pandemic in
 Marketplaces in Urban Ghana’. Africa Spectrum, 55(2): 170–81. https://doi.org/10.1177/
 0002039720943612
Balde, R., M. Boly, and E. Avenyo (2020). ‘Labour Market Effects of COVID-19 in Sub-Saharan Africa:
 an Informality Lens from Burkina Faso, Mali and Senegal’. Working Paper 022. Maastricht: UNU-
 MERIT.
Bargain, O., and U. Aminjonov (2020). ‘Trust and Compliance to Public Health Policies in Times of
 COVID-19’. Journal of Public Economics, 19: 104316. https://doi.org/10.1016/j.jpubeco.2020.104316
Bassier, I., J. Budlender, R. Zizzamia, M. Leibbrandt, and V. Ranchhod (2020). ‘Locked down and Locked
 out: Repurposing Social Assistance as Emergency Relief to Informal Workers’. World Development, 139:
 105271. https://doi.org/10.1016/j.jpubeco.2020.104316
Bertrand, M., E. Duflo, and S. Mullainathan (2004). ‘How Much Should We Trust Differences-in-
 Differences Estimates?’. The Quarterly Journal of Economics, 119(1): 249–75.
 https://doi.org/10.1162/003355304772839588
Brodeur, A., A.E. Clark, S. Fleche, and N. Powdthavee (2021). ‘COVID-19, Lockdowns and Well-being:
 Evidence from Google Trends’. Journal of Public Economics, 193: 104346.
 https://doi.org/10.1016/j.jpubeco.2020.104346
Crossley, T.F., P. Fisher, and H. Low (2020). ‘The Heterogenous and Regressive Consequences of COVID-
 19: Evidence from High Quality Panel Data’. Journal of Public Economics, 19: 104334.
 https://doi.org/10.1016/j.jpubeco.2020.104334

 23
Danquah, M., S. Schotte, and K. Sen (2019). ‘Informal Work in Sub-Saharan Africa: Dead End or
 Steppingstone?’. UNU-WIDER Working Paper 107/2019. Helsinki: UNU-WIDER.
 https://doi.org/10.35188/UNU-WIDER/2019/743-9
Danquah, M., S. Schotte, and K. Sen (2020). ‘COVID-19 and Employment: Insights from the Sub-Saharan
 African Experience’. The Indian Journal of Labour Economics, 63: 23–30.
 https://doi.org/10.1007/s41027-020-00251-4
Durizzo, K., E. Asiedu, A.V.D. Merwe, A. Niekerk, and I. Gunther (2021). ‘Managing the COVID-19
 Pandemic in Poor Urban Neighbourhoods: the Case of Accra and Johannesburg’. World Development,
 137: 105175. https://doi.org/10.1016/j.worlddev.2020.105175
Fang, H., L. Wang, and Y. Yang (2020). ‘Human Mobility Restrictions and the Spread of the Novel
 Coronavirus (2019-nCoV) in China’. Journal of Public Economics, 19: 104272.
 https://doi.org/10.1016/j.jpubeco.2020.104272
GSS (2020). Newsletter: Consumer Price Index (CPI) October 2020. Accra: Ghana Statistical Service.
 Available at: https://www.statsghana.gov.gh/gssmain/storage/img/marqueeupdater/
 Newsletter_CPI_Oct_2020.pdf (accessed 15 November 2020).
Hale, T., A. Petherick, T. Phillips, and S. Webster (2020). ‘Oxford COVID-19 Government Response
 Tracker (OxCGRT)’, last updated 10 November 2020, 08:30 (London time). Available at:
 https://ourworldindata.org/coronavirus (accessed 10 November 2020).
ILO (2020a). ILO Monitor, second edition: COVID-19 and the World of Work, Updated Estimates and Analysis (18
 March 2020). Geneva: ILO.
ILO (2020b). ILO Monitor, first edition: COVID-19 and the World of Work, Impact and Policy Responses (7 April
 2020). Geneva: ILO.
ILO (2020c). ILO Monitor, third edition: COVID-19 and the World of Work, Updated Estimates and Analysis (29
 April 2020). Geneva: ILO.
Kazeem, Y. (2020). ‘Staying Alive: Across Africa, a Reliance on the Informal Sector Threatens Effective
 Coronavirus Lockdowns’. Quartz Africa. Available at: https://qz.com/africa/1831785/coronavirus-
 citizens-in-africas-informal-economy-try-to-survive/ (accessed 29 November 2020).
Lakuma, C.P., and N. Sunday (2020). ‘Africa in Focus: Impact of COVID-19 on Micro, Small, and Medium
 Businesses in Uganda’. Available at: https://www.brookings.edu/blog/africa-in-
 focus/2020/05/19/impact-of-covid-19-on-micro-small-and-medium-businesses-in-uganda/
 (accessed 15 June 2020).
Lee, J.N., M. Mahmud, J. Morduch, S. Ravindran, and A.S. Shonchoy (2020). ‘Migration, Externalities, and
 the Diffusion of COVID-19 in South Asia’. Journal of Public Economics, 193: 104312.
 https://doi.org/10.1016/j.jpubeco.2020.104312
Roser, M., H. Ritchie, E. Ortiz-Ospina, and J. Hasell (2020). ‘Coronavirus Pandemic (COVID-19)’. Our
 World Data file. Available at: https://ourworldindata.org/coronavirus (accessed 10 November 2020).

 24
Appendix

Table A1: Impact of the coronavirus lockdown on employment, pre- and post-treatment periods

Dependent variable: (1) (2) (3) (4)
Working in period t (=1 if Full sample District size cut- District size cut- District size cut-off
YES) off off with covariates with worker FE
Pre-period (base Feb 2020) 0.061*** 0.057** 0.056** 0.055**
GSPS W3 (2018/19) (0.015) (0.022) (0.023) (0.024)

Post-period (base Feb 2020)
April 2020 -0.253*** -0.212*** -0.215*** -0.261***
 (0.034) (0.046) (0.046) (0.046)
Last 7 days -0.125*** -0.116*** -0.116*** -0.116***
 (0.019) (0.026) (0.026) (0.026)
Lockdown 0.015 0.010 0.013
 (0.029) (0.033) (0.035)

Lockdown × GSPS W3 -0.011 -0.007 -0.005 -0.006
 (0.025) (0.030) (0.030) (0.031)
Lockdown × April 2020 -0.332*** -0.372*** -0.371*** -0.358***
 (0.049) (0.058) (0.058) (0.052)
Lockdown × Last 7 days -0.013 -0.022 -0.022 -0.022
 (0.024) (0.030) (0.030) (0.030)

Observations 2,571 1,753 1,753 1,753
Covariates NO NO YES NO
Panel effects RE RE RE FE

Note: covariates include gender, head of household, age categories (
Table A2: Impact of the coronavirus lockdown measures on log weekly earnings, pre- and post-treatment periods

Dependent variable: (1) (2) (3) (4)
Log weekly earnings in Full sample District size cut- District size cut- District size cut-off
period t (constant 2018 off off with covariates with worker FE
prices)
Pre-period (base Feb 2020)
GSPS W3 (2018/19) -1.003*** -0.833*** -0.848*** -0.809***
 (0.103) (0.142) (0.144) (0.179)
Post-period (base Feb 2020)
April 2020 -0.789*** -0.840*** -0.847*** -0.799***
 (0.104) (0.173) (0.160) (0.139)
Last 7 days -0.373*** -0.352*** -0.307*** -0.441***
 (0.057) (0.079) (0.087) (0.067)

Lockdown 0.156* 0.153 0.154
 (0.090) (0.124) (0.104)

Lockdown × GSPS W3 0.302** 0.132 0.135 0.092
 (0.138) (0.169) (0.168) (0.209)
Lockdown × April 2020 0.458*** 0.509** 0.375** 0.396***
 (0.137) (0.195) (0.181) (0.143)
Lockdown × Last 7 days 0.077 0.055 -0.020 0.137
 (0.104) (0.118) (0.121) (0.099)

Observations 1,624 1,097 1,097 1,097
Covariates NO NO YES NO
Panel effects RE RE RE FE

Note: covariates include gender, head of household, age categories (
Table A3: Impact of the coronavirus lockdown measures on weekly working hours, pre- and post-treatment periods

Dependent Variable: (1) (2) (3) (4)
Weekly hours worked in Full sample District size cut- District size cut- District size cut-off
period t off off with covariates with worker FE

Pre-period (base Feb 2020)
GSPS W3 (2018/19) -1.912 -1.091 0.793 0.993
 (2.001) (3.251) (2.984) (2.862)
Post-period (base Feb 2020)
April 2020 -19.320*** -19.197*** -15.487*** -13.956***
 (3.296) (3.904) (4.881) (5.143)
Last 7 days -6.474*** -8.278*** -4.964*** -6.220***
 (1.660) (2.413) (1.676) (1.717)

Lockdown 2.402 2.529 2.932
 (2.120) (2.667) (2.459)

Lockdown × GSPS W3 2.433 1.612 0.166 -0.379
 (2.715) (3.740) (3.954) (3.507)
Lockdown × April 2020 12.106** 11.983** 12.326* 7.609
 (4.973) (5.414) (6.557) (6.448)
Lockdown × Last 7 days -3.751* -1.947 -0.457 0.018
 (2.134) (2.765) (2.040) (2.103)

Observations 1,802 1,237 1,176 1,176
Covariates NO NO YES NO
Panel effects RE RE RE FE

Note: covariates include gender, head of household, age categories (
You can also read