MONTHLY INVESTMENT INSIGHTS - MAY 2019 - PSG

 
CONTINUE READING
MONTHLY INVESTMENT INSIGHTS - MAY 2019 - PSG
MONTHLY INVESTMENT INSIGHTS
MAY 2019
MONTHLY INVESTMENT INSIGHTS - MAY 2019 - PSG
Contents

1. The monthly interview – Chair of the ANC sub-committee on economic transformation, Enoch Godongwana     3

2. Tactical asset allocation preferences                                                                   5

3. Market commentary                                                                                       6

4. Local unit trust solutions                                                                              8

5. Offshore unit trust solutions                                                                           13

6. PSG Wealth equity portfolios                                                                            20

7. Other publications                                                                                      26

2 | PAGE                                                                PSG Wealth | Monthly Insights - May 2019
MONTHLY INVESTMENT INSIGHTS - MAY 2019 - PSG
The monthly interview

At the PSG Annual Conference held earlier this month, Bruce Whitfield, financial journalist, interviewed Enoch
Godongwana, chair of the ANC sub-committee on economic transformation. His responses highlight the
importance of correcting the ruling party’s mistakes and rebuilding the ANC’s stature after the 2019 general
elections.

                           What’s your take on the election                             Tell us a bit more about land redistribution, how
                           outcome, are you concerned                                   will it not endanger the economy as the president
                           about the latest results?                                    indicated?
                           The voter turnout wasn’t as good as I                        Part of the problem in the ANC is that we need to address
                           would have liked, but I am not worried                       people not doing what they are meant to, instead of the
Enoch Godongwana. Chair of
                           about the results. I’m already preparing                     policies. On the ANC’s priority list, land is number 30.
the ANC sub-committee on   for the inauguration of President Cyril                      There’s also a conceptual difference between the ANC
economic transformation
                           Ramaphosa on 25 May and preparing                            and the EFF. The EFF wants the nationalisation of land – all
for his state of the nation address on 20 June.                                         land. What the ANC wants to achieve is redistribution.

Are the EFF and ANC separate, or do we see a union                                      In other words, you take land for public purposes; not just
of ideologies?                                                                          because you want it in state hands. There is already too
The truth of the matter is that we fought for these                                     much land in state hands that isn’t used productively. In
elections with our backs against the wall. I said to the EFF                            fact, our target is to start redistributing land that’s in the
that once they let us win these elections, there’s no going                             hands of the state.
back. Our preoccupation going forward must be to correct
our mistakes and rebuild our stature as an organisation.                                Decades later and we can’t even undo District 6,
                                                                                        a small part of the country where people were
The ANC has seen its support slide, and we’ve seen                                      forcibly removed. What hope is there for fair and
low voter turnout. Have people lost faith in the                                        equitable restitution, redistribution and correction
political process?                                                                      of the past when we can’t fix one small example?
This is not a South African phenomenon, but a global                                    The constitution talks about three pillars. The first one is
phenomenon – e.g. also in the UK. Once democracy                                        restitution and we have made progress, but it is taking
matures, people lose interest in participating in the political                         longer than we think. Our focus is more on redistribution
process.                                                                                than on restitution, and restitution will take another 109
                                                                                        years. Another pillar of this is tenure. In rural areas, we
The EFF has forced the ANC’s hand on policy positions                                   have permission to occupy, we don’t have titles. That’s the
very effectively, e.g. the land issue, nationalisation                                  kind of transformation we need.
of the South African Reserve Bank (SARB), would
you agree?                                                                              What about the power of traditional leaders,
I would imagine that’s not correct. There’s too much                                    having a say of who gets to stay where? Surely that
speculation around the role of the EFF. Its leaders still have                          is something in a 21st democracy that has to change.
close ties to people in the ANC. So, whatever happens in                                In the ANC, we’ve adopted a model of one size fits all.
the ANC, leaks [out to the EFF]. Julius Malema will then                                But the power of the traditional leaders in KZN is not the
rush out and announce what he hears. Then people think                                  same as elsewhere. Yet, people extrapolate this power.
Malema is driving the agenda. On the nationalisation of                                 What has failed is not economic policy; what has failed is
the SARB, I suspect that some of the shareholders of the                                implementation.
SARB want the bank to be nationalized, because they
want to extract some benefit. This debate was initiated                                 After the Global Financial Crisis (GFC), we saw a temporary
in 2010.                                                                                recovery, but this was short-lived. You are not going to
                                                                                        have social cohesion and stability until we ensure the
It is perceived that the ANC is seen to act according                                   economy grows.
to the whim of the EFF, e.g. Julius Malema calls for
the nationalisation of the SARB and suddenly the                                        The first issue: How do we build confidence in the mind
ANC has a vote on it and EFF members are seen to                                        of South Africans, and investors?
lead it, what’s your take on this?
Malema was putting us on the spot. He simply moved a                                    The second issue: What are the key structural constraints
motion that the ANC took to parliament after we passed                                  we need to address? Do we need to amend any regulation
the resolution – it wasn’t the EFF’s resolution.                                        so that the private sector can put money into the economy?

The opinions expressed in this interview are the opinions of the interviewee and not necessarily those of PSG and do not constitute advice. Although the utmost care has
been taken in the research and preparation of this document, no responsibility can be taken for actions taken on information in this interview.

3 | PAGE                                                                                                        PSG Wealth | Monthly Insights - May 2019
MONTHLY INVESTMENT INSIGHTS - MAY 2019 - PSG
The monthly interview

Third: How do we build a partnership between business                                   Why should people have faith in the ANC’s
and government?                                                                         policymaking structures if one guy on his way out
                                                                                        can make such a snap decision?
What about prescribed assets?                                                           On the economic front, since 1992, we’ve had consistent
I write these resolutions carefully when I do so. The                                   leadership that’s been producing rational policies. We’ve
resolution on prescribed assets says ‘investigate’. There is                            had our challenges recently, that’s a different matter,
a perception that we want to take money, loot it and put                                but generally policy has been focused on growing the
it into Eksom. But the first thing you must understand:                                 economy and doing the right thing. Our current leadership
we have not even started the process of investigating. Not                              and president are focused on doing the right thing.
every resolution gets implemented.
                                                                                        Why do many in the ANC not support the notion of
In what aspect would the notion of prescribed                                           eliminating State-Owned Enterprises (SOEs)? One
assets be positive? Asset managers can currently                                        gets the sense the broader ANC doesn’t actually
invest in these assets, but they don’t.                                                 have a clear single vision for this economy.
How it was applied in the past was destructive. This is not                             The ANC does have a clear single vision. The ANC’s position
a good template. This is why we need to investigate. We                                 has not changed since 1992, contained in a document
need a better template if we decide to implement.                                       called ‘Ready to govern’. That document says that we
                                                                                        will be guided by balance of evidence; facts. We are not
How then do we fund coal in SA?                                                         religious about nationalisation or privatisation. That is the
The outcome of the energy plan will be what is going to                                 position as it stands. There is nothing in ANC policy which
be our energy mix going forward. We need to conclude                                    is against privatisation.
this discussion. We have six billion tons of coal in this
country. There is currently research underway to generate                               Is there a chance that Moody’s might lower our
clean coal. We cannot say we will not be part of it.                                    credit rating to so-called ‘junk status’? Can we
                                                                                        avoid this?
Why does policymaking take so long in SA?                                               I am praying that we avoid this. Moody’s has been rational.
Policymaking in a democratic environment with the                                       President Ramaphosa has to say a number of things and
constitution we have, takes this long. And anyone can                                   take a number of actions to take South Africans with us.
contest a process in court.
                                                                                        Is around 57% (as currently indicated) of the vote
SA now has a free education liability we cannot                                         a strong enough mandate for Ramaphosa to grow
afford. Yet Jacob Zuma can make an instant                                              this country and to put the challenges of the last
guarantee that we can offer this, a decision that did                                   decade behind us?
not follow the appropriate process.                                                     Yes, for me this is strong enough. People are fearful he
A committee chaired by Naledi Pandor has been working                                   will be undermined internally. I can tell you now there’s
on this matter. They came to the conclusion that we                                     no such (problem). Anyone who is going to try and make
needed to fund students in need. On the eve of the Nasrec                               Ramaphosa’s life difficult will also run for cover.
conference, Zuma made that announcement. Which was
unfortunate.

The opinions expressed in this interview are the opinions of the interviewee and not necessarily those of PSG and do not constitute advice. Although the utmost care has
been taken in the research and preparation of this document, no responsibility can be taken for actions taken on information in this interview.

4 | PAGE                                                                                                        PSG Wealth | Monthly Insights - May 2019
MONTHLY INVESTMENT INSIGHTS - MAY 2019 - PSG
Tactical asset allocation preferences

                                                                EMERGING                                                                                  EQUITY                                                 DEVELOPED
                                                                South Africa                                                  ITY                                                                                           Global
                                                                                                                           U                                                             PRO
                                                                                                                    EQ                                                                      PER
                                                                                                                                                     Cyclical    Defensive                        TY
                                                                                                                                         sive                                   Retail
                                                                                                                                    Defen
Challenging economic conditions persist.                                                                                   l                                                                                                                                               The inverted yield curve in the US
Liquidity in the event of a market shock                                                                              clica                                                                                                                                                continues to make news headlines every
                                                                                                                   Cy
remains a concern.                                                                                             l                                                                                  Re                                                                       other day. This is simply because it acts
                                                                                                           ntia                                                                                     sid
                                                                                                                                                                                                       en                                                                  as a strong leading indicator, but the lead

                                                                                          TY
                                                                                                    s  ide                                                                                                tia
                                                                                                  Re

                                                                                          ER
                                                                                                                                                                                                             l                                                             can also be relatively long.

                                                                                     OP

                                                                                                                                                                                                                 Go

                                                                                                                                                                                                                                BO
                                                                               PR

                                                                                                                                                                                                                 ve
                                                                                                                                                                                                                  rn

                                                                                                                                                                                                                                     ND
                                                                                                                                                                                                                      m
Oversupply and lagging demand are

                                                                                                                                                                                                                       en

                                                                                                                                                                                                                                      S
                                                                                                                                                                                                                       t
causing headwinds in the retail property                                                                                                                                                                                                                                   Particularly in the US, stronger growth

                                                                                                                                                                                                                            Cre
                                                                                           l
space. Here we are very cautious with our

                                                                                          tai
                                                                                                                                                                                                                                                                           favours credit over government bonds,

                                                                                                                                                                                                                               dit
                                                                                          Re
allocations.                                                                                                                                                                                                                                                               although there exists a caveat for high
                                                                                                                                                                                                                                                                           quality, investment grade exposure, and

                                                                                     it
                                                                                                                                                                                                                                                                           very selective buying.

                                                                                                                                                                                                                                     USD
                                                                              Cred
                                                                BONDS

                                                                                                                                                                                                                                                 CURRENCY
Our current view on government bonds has
                                                                            t
                                                                         Governmen

changed to neutral due to a decline in the

                                                                                                                                                                                                                                       GBP
                                                                                                                                                                                                                                                                           The USD seems too strong, while
yield curve.
                                                                                                                                                                                                                                                                           the GBP and EUR seems too weak in
                                                                                                                                                                                                                                                                           relation to the USD.
                                                                CASH

                                                                          ZAR

                                                                                                                                                                                                                                           EUR
                                                                                                                                                   Strategic asset allocation

                                                                                                                                                   Tactical asset allocation
Cash is the least striking local asset class as                                                                                                    Changes this month
valuations across all other asset classes are
generally very attractive.
                                                                            Overweight:                                                         Neutral:                                           Underweight:
                                                                            Tactical recommendation to                                          Tactical recommendation to                         Tactical recommendation to
                                                                            hold more of the asset class                                        hold the asset class in line                       hold less of the asset class
                                                                            than specified in the                                               with its weight in the                             than specified in the
                                                                            strategic asset allocation                                          strategic asset allocation                         strategic asset allocation

Bottom line
•   Tactically, we remain bullish on equities on the domestic           over preceding years, especially in cases where the                                               included most of the bad news. Everything considered,                                 investments like property.
    front. We think the market offers value, but only when              outlook for earnings growth is more uncertain. Equities                                           we recognise the higher yields, but remain cautious                               •   We are overweight on domestic government bonds
    you adjust valuations to remove some of the more                    still offer the greatest opportunity set for longer-term                                          about the asset class as funding pressure could well                                  because their yields are attractive.
    expensive counters. We think there is particular value              investments.                                                                                      accelerate in an increasing interest rate environment.                            •   Domestic cash remains unattractive from a long-
    in selected small and mid-cap stocks if attended to           •     We are marginally negative on domestic property at                                                Our view on global property remains negative despite                                  term wealth creation perspective, although the
    carefully. We caution against counters which have                   this stage. The fundamentals truly look dire, but many                                            robust global growth, especially as the potential rate                                diversification and risk management benefits remain
    been significant beneficiaries of severe rand weakness              counters are also trading at levels that seem to have                                             hikes could be a substantial deterrent to bond proxy                                  attractive.

5 | PAGE                                                                                                                                                                                                                                                                     PSG Wealth | Monthly Insights - May 2019
MONTHLY INVESTMENT INSIGHTS - MAY 2019 - PSG
Market commentary

In their monthly review, Schroders notes that global equity markets advanced in April, boosted by a continued
dovish tone from key central banks, together with better-than-expected economic data. GDP growth in the US
over the first quarter supported US equity performance while emerging markets kept their nerve amid mounting
pressure from the threat of a slowing global economy. South Africa pushed the MSCI Emerging Markets Index
higher as equities surged in anticipation of the 6th general election. US 10-year treasury yields bounced back from
their lowest level in over a year in April, following the release of positive data as the US economy continued to
grow. Strong US and Chinese economic data enhanced government bond yields, increasing investor appetite for
riskier assets.

JSE All Share Index - April 2019
60 500
60 000                                                                                                                                                   3.41%
59 500
59 000
58 500
58 000
57 500
57 000
56 500
56 000
55 500
55 000
54 500
54 000

53 500
53 000
52 500                  1.34%                                   1.12%                                       0.74%                                       0.50%
52 000
51 500    The JSE closed up on                   South African markets                      The JSE closed in the red on              South African markets closed
51 000    3 April after Moody’s                  closed in the green on 16                  24 April, weighed down by                 in the red on 25 April, pulled
          kept their current credit              April, boosted by broad                    broad-based losses in the                 down by losses in mining
50 500
          rating for South Africa                based gains in gold mining                 retail and banking sectors.               sector stocks.
50 000    unchanged.                             and retail sector stocks.
49 500
49 000

   01 April          04 April         07 April     10 April           13 April   16 April              19 April            22 April   25 April             28 April

Source: Bloomberg

Domestic key moves                                                               Global key moves

          South Africa’s unemployment rate went up to                            US
27.60%    27.60% in 1Q19, compared to 27.10% in the
previous quarter. The number of unemployed persons                                         US manufacturing production went down by
increased by 62 thousand to 6.20 million, marking the                             0.50%    0.50% in April compared to market predictions
highest jobless rate since the 3Q17.                                             of a 0.10% increase. This decline can be attributed to
                                                                                 a sizable drop in factory output as the production of
          Local retail sales took a 0.70% knock in March                         automobiles dropped over the last few months.
  0.70%
          compared to a 0.60% increase in the previous
month. Annually, retail sales rose by 0.20% in March                                       US import prices edged 0.20% higher in April,
                                                                                  0.20%
following an upwardly revised 1.40% increase in                                            following a 0.60% gain in March and missing
February.                                                                        market forecasts of a 0.70% gain.

6 | PAGE                                                                                                      PSG Wealth | Monthly Insights - May 2019
MONTHLY INVESTMENT INSIGHTS - MAY 2019 - PSG
Market commentary

EU                                                            Japan

         Eurozone’s inflation rate for April was in line                Japan’s producer prices increased to 101.80
 0.70%                                                         101.80
         with market predictions rising by 0.70%,                       index points in April from 101.50 in March. On
compared to a 1% increase in March.                           an annual basis, producer prices went up by 1.20% over
                                                              the same period, slightly missing market forecasts of
          Following a downwardly revised 0.10%                1.10%.
 0.10%    decrease in February, industrial production in
the Eurozone declined by 0.30% in March, on par with                   Preliminary estimates showed that Japan’s
                                                               0.50%
market expectations.                                                   GDP expanded by 0.50% in the first quarter of
                                                              2019, well above market expectations of a 0.10%
China                                                         decline.

        Decelerating from an 8.50% rise in March,
 5.40%
        China’s industrial production figure went up
by 5.40% y/y, missing market expectations of a 6.50%
gain.

            Missing market projections of an 8.60%
 7.20%
            increase, Chinese retail sales surged 7.20% y/y
in April from a month earlier.

7 | PAGE                                                                      PSG Wealth | Monthly Insights - May 2019
MONTHLY INVESTMENT INSIGHTS - MAY 2019 - PSG
PSG Wealth Fund of Funds Solutions

Local funds
Performance table

 Fund                                                          6-Month             1-Year                2-Years        3-Years           4-Years          5-Years
 PSG Wealth Enhanced Interest D                                3.94%                8.02%                8.03%           8.09%            7.86%             7.52%
 PSG Wealth Income FoF D                                       4.24%                7.45%                7.91%           8.31%            8.10%             8.14%
 PSG Wealth Preserver FoF D                                    4.88%                5.79%                6.11%           6.23%            6.37%             7.41%
 PSG Wealth Moderate FoF D                                     6.22%                4.79%                5.53%           5.65%            5.47%             7.09%
 PSG Wealth Creator FoF D                                      8.17%                2.58%                4.58%           5.20%            3.46%             5.46%

Source: PSG Wealth research team

Local fund performance
12.00%

10.00%

 8.00%

 6.00%

 4.00%

 2.00%

 0.00%
                     6-Month                          1-Year                             2-Years                         3-Years                      5-Years
  PSG Wealth Enhanced Interest D         PSG Wealth Income FoF D            PSG Wealth Preserver FoF D        PSG Wealth Moderate FoF D      PSG Wealth Creator FoF D

Source: PSG Wealth research team data as at 30 April 2019                                                                *Dots represent the relevant benchmark

Disclaimer: All performance is reported in ZAR unless specified otherwise

8 | PAGE                                                                                                             PSG Wealth | Monthly Insights - May 2019
MONTHLY INVESTMENT INSIGHTS - MAY 2019 - PSG
PSG Wealth Domestic Solutions

   PSG Wealth Local Fund of Funds bubble chart
                                15.0
Returns (3yr)

                                             Income FoF D, 0.84                                                                       Global Creator FF D, 1.20

                                                  SA MA Income, 0.94             Preserver FoF D, 1.14
                                                                                                                               Global Equity General, 1.46
                                10.0
                                                                                                   Moderate FoF D, 1.20

                                                                                                                          Creator FoF D, 1.28

                                 5.0

                  Enhanced Interest D, 0.49            SA MA Low Equity, 1.46
                                                                                                                                          Global MA Flexible, 1.89
                                 0.0
           -2.0                        0.0                        2.0                     4.0                       6.0                            8.0                      10.0                  12.0

                                                      SA IB Money Market, 0.40                                                                                       Global Moderate FF D, 1.44
                                                                                          SA MA High Equity, 1.50                  SA Equity General, 1.15

                                -5.0

                               -10.0

                               -15.0

                                                                                                                                                                      Downside Deviation (3yr)
   Source: PSG Wealth research team

      HOW TO READ THE BUBBLE CHARTS
                                                                                                                                                Shows TER which is an indication of cost. The
      Vertical axis           Shows the return of each fund                                                  Size of the bubble                 TERs for the fund benchmarks are assumed to
                                                                                                                                                be 1.14% including VAT.
      Horizontal axis Shows the downside deviation which is a measure of                                     Grey bubbles                       Indicate relevant fund benchmarks
                      downside risk that focuses on returns that fall below a
                      minimum threshold or minimum acceptable return (MAR)                                   Gold bubbles                       Represent PSG Wealth EB solutions

   Disclaimer: All performance is reported in ZAR unless specified otherwise

   9 | PAGE                                                                                                                                PSG Wealth | Monthly Insights - May 2019
MONTHLY INVESTMENT INSIGHTS - MAY 2019 - PSG
PSG Wealth Domestic Solutions

PSG Wealth Enhanced Interest Fund                                         PSG Wealth Income FoF

•    The PSG Wealth Enhanced Interest Fund delivered                      •    The PSG Wealth Income FoF delivered a return of
     a return of 0.68% for April 2019, outperforming                           0.94% for April 2019, compared to the 0.64% of its
     the South Africa IB Money Market sector average                           benchmark, the Stefi 12 Months NCD.
     benchmark that delivered a return of 0.55% over                      •    The PSG Wealth Income FoF has an investment
     the same period.                                                          horizon of two years, and it has underperformed
•    This fund has an investment horizon of one year                           its benchmark with 7.91% against 8.05% over the
     and has outperformed its benchmark with 8.02%                             two-year period and is ranked 48th out of 73 funds
     against 7.41% over a one-year period.                                     over this period.
•    The fund has also outperformed its benchmark over                    •    This fund also delivered first, second or third quartile
     all measurement periods.                                                  performances for all measurement periods over two
                                                                               years.
Asset allocation
                                                                          Asset allocation

                                                                                                              Domestic cash and money market, 45.25
                                                                                                              Domestic bonds, 39.26
                                                                                                              Foreign bonds, 4.36
                                                                                                              Domestic property, 2.93
                                    Domestic cash and money market, 100
                                                                                                              Foreign cash and money market, 2.10
                                                                                                              Domestic equity, 1.58
                                                                                                              Domestic other, 1.30
                                                                                                              Foreign equity, 1.21
                                                                                                              Foreign other, 1.13
                                                                                                              Foreign property, 0.87

Source: PSG Wealth research team
                                                                          Source: PSG Wealth research team

    Risk and expectations: We are confident the fund will
    continue to deliver returns in access of money market rates               Risk and expectations: We expected that higher inflation
    to reduce the negative effects of high inflation on cash.                 and rising interest rates could be a drag on performance
    Radar: No funds on the radar screen.                                      over the short-term, but current indications are that the
    Changes: There are no changes to the underlying funds.                    underlying portfolio managers are able to take advantage
                                                                              of the higher yields on short-term instruments to deliver
                                                                              attractive returns close to the top of the inflation cycle. We
                                                                              are confident that the underlying portfolio managers will
                                                                              continue to deliver attractive above average returns until
                                                                              well after the interest rate cycle has peaked.
                                                                              Radar: The Prudential Enhanced Income Fund and the
                                                                              PSG Diversified Income Fund were removed from the
                                                                              radar screen.
                                                                              Changes: No changes to underlying funds.

10 | PAGE                                                                                      PSG Wealth | Monthly Insights - May 2019
PSG Wealth Domestic Solutions

PSG Wealth Preserver FoF                                                  PSG Wealth Moderate FoF

•    The PSG Wealth Preserver FoF delivered a return of                   •    The PSG Wealth Moderate FoF delivered a return of
     1.81% for April 2019, compared to the 1.06% of its                        2.41% for April 2019, compared to the 2.58% of its
     performance target of CPI plus three percent.                             benchmark, the South African MA High Equity sector
•    This FoF has an investment horizon of three years,                        average.
     and it has underperformed CPI plus three percent                     •    This FoF has an investment horizon of five years and
     with 6.23% against 7.98% over this period.                                has outperformed its benchmark with 7.09% against
•    The fund outperformed the 5.61% of the South                              5.75% over the five-year period. It is also ranked 19th
     African MA Low Equity sector average over the                             out of 100 funds over this period.
     three-year period and is ranked 40th out of 120 funds                •    It also delivered first or second quartile performances
     over this period.                                                         for all measurement periods over six months.

Asset allocation                                                          Asset allocation

                                  Domestic bonds, 31.04
                                                                                                              Domestic equity, 41.26
                                  Domestic cash and money market, 20.78
                                                                                                              Foreign equity, 24.36
                                  Domestic equity, 20.12
                                                                                                              Domestic bonds, 18.67
                                  Foreign equity, 16.06
                                                                                                              Domestic cash and money market, 6.31
                                  Domestic property, 5.32
                                                                                                              Domestic property, 4.42
                                  Foreign bonds, 2.79
                                                                                                              Foreign property, 1.25
                                  Foreign cash and money market, 1.97
                                                                                                              Foreign bonds, 1.19
                                  Foreign property, 1.29
                                                                                                              Domestic other, 0.52
                                  Foreign other, 0.55
                                  Domestic other, 0.06                                                        Foreign cash and money market, 0.02

Source: PSG Wealth research team                                          Source: PSG Wealth research team

    Risk and expectations: The PSG Wealth Preserver FoF
    can hold up to a total of 40% in domestic equities and                    Risk and expectations: The PSG Wealth Moderate
    offshore equities and may deliver negative short-term                     FoF may hold up to a total of 75% in domestic equities
    performances in sharp equity corrections or equity bear                   and offshore equities and could deliver negative short-
    markets. We are, however, confident that the fund                         term performances in sharp equity corrections or equity
    will always deliver positive returns over the preferred                   bear markets. We are, however, confident that the fund
    investment period of three years and longer, and that it                  will always deliver positive returns over the preferred
    will protect the capital of clients during severe negative                investment period of five years and longer, and that it will
    market corrections.                                                       continue to deliver above-average long-term returns with
    Radar: The PSG Stable Fund remains on the radar screen.                   below average risk overall market cycles.
    Changes: No changes to underlying funds.                                  Radar: The PSG Balanced Fund remains on the radar
                                                                              screen.
                                                                              Changes: No changes to underlying funds.

11 | PAGE                                                                                     PSG Wealth | Monthly Insights - May 2019
PSG Wealth Domestic Solutions

PSG Wealth Creator FoF

•   The PSG Wealth Creator FoF delivered a return of
                                                                      Risk and expectations: Although the outlook for
    3.10% for April 2019, compared to the 3.99% of
                                                                      equities is still uncertain, we are confident that the relative
    its benchmark, the South African EQ General sector                performance of the underlying managers in the fund will
    average.                                                          continue to improve in the near future. The managers are
•   The FoF has an investment horizon of five years and               all active managers that have demonstrated the ability
    longer, and has underperformed its benchmark with                 to add alpha through careful share selection, particularly
    5.46% against the 4.04% over the five-year period.                during turbulent equity markets. This fund will always
    It is also ranked 38th out of 98 funds over this period.          maintain an equity exposure of close to 100% in domestic
•   It also delivered second quartile performances for all            and offshore equities. It will deliver negative performances
    measurement periods longer than six months.                       in sharp equity corrections or equity bear markets. We
                                                                      are, however, confident that the fund will always deliver
                                                                      positive returns over the preferred investment period of
Asset allocation                                                      five years and longer. It will continue to deliver above-
                                                                      average long-term returns with below-average risk overall
                                                                      market cycles.
                                                                      Radar: The PSG Equity Fund remains on the radar
                               Domestic equity, 80.53                 screen.
                               Foreign equity, 14.29                  Changes: No changes to underlying funds.
                               Domestic property, 2.31
                               Domestic cash and money market, 2.03
                               Foreign property, 0.51
                               Foreign cash and money market, 0.32

Source: PSG Wealth research team

12 | PAGE                                                                              PSG Wealth | Monthly Insights - May 2019
PSG Wealth Offshore Solutions

Offshore funds
Performance table

Reported in USD
 Fund                                                            6-Month               1-Year        2-Years             3-Years               4-Years           5-Years
 PSG Wealth Global Preserver FoF D USD                                 4.70%                 3.81%         3.30%               4.67%                3.40%               3.46%
 PSG Wealth Global Moderate FoF D USD                                  5.92%                 0.86%         3.98%               4.65%                1.72%               2.03%
 PSG Wealth Global Flexible FoF D USD                                10.63%                  8.83%         9.30%             10.77%                 7.63%               6.96%
 PSG Wealth Global Creator FoF D                                     11.57%                  8.67%       10.86%              11.78%                 7.86%               7.72%

Reported in GBP
 Fund                                                            6-Month               1-Year        2-Years             3-Years               4-Years            5-Years
 PSG Wealth Global Preserver FoF D GBP                                 2.51%                 7.32%         3.00%               7.38%                6.36%               6.84%
 PSG Wealth Global Flexible FoF D GBP                                  7.95%             13.85%            8.05%             13.68%               10.69%              11.66%

Source: PSG Wealth research team

Offshore funds performance
14.00%

12.00%

10.00%

 8.00%

 6.00%

 4.00%

 2.00%

 0.00%
                   3-Month                      6-Month                       1-Year                   2-Years                       3-Years                       5-Years
   PSG Wealth Global Preserver FoF D USD              PSG Wealth Global Moderate FoF D USD           PSG Wealth Flexible FoF D USD              PSG Wealth Global Creator FoF D

Source: PSG Wealth research team data as at 30 April 2019                                                                   *Dots represent the relevant benchmark

All performance is reported in USD unless specified otherwise.

13 | PAGE                                                                                                              PSG Wealth | Monthly Insights - May 2019
PSG Wealth Offshore Solutions

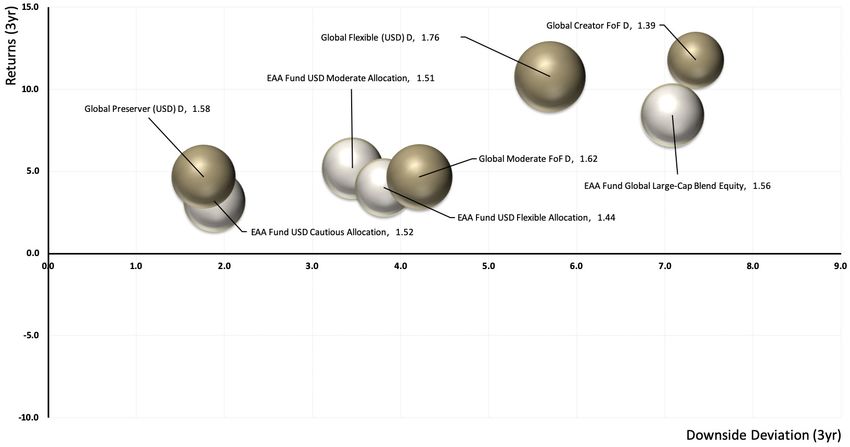
PSG Wealth Offshore Fund of Funds (USD)

Source: PSG Wealth research team

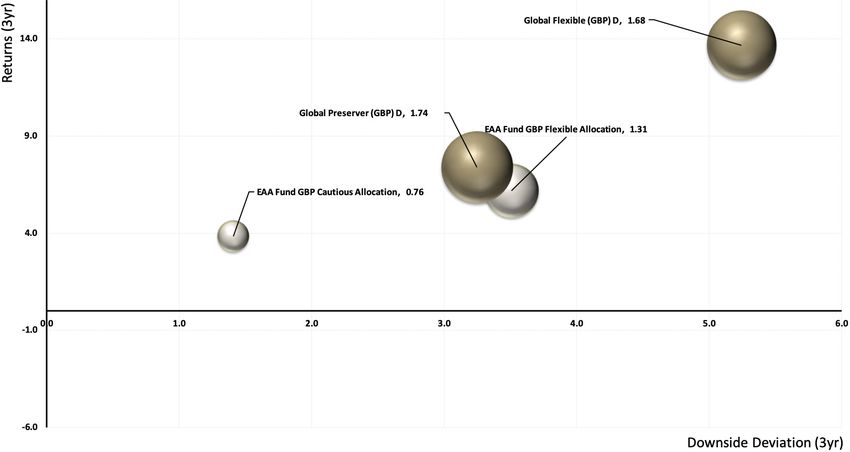
PSG Wealth Offshore Fund of Funds (GBP)

Source: PSG Wealth research team

HOW TO READ THE BUBBLE CHARTS
Vertical axis   Shows the return of each fund                             Size of the bubble    Shows TER which is an indication of cost
Horizontal axis Shows the downside deviation which is a measure of        Grey bubbles          Indicate fund peers
                downside risk that focuses on returns that fall below a
                minimum threshold or minimum acceptable return (MAR)      Gold bubbles          Represent PSG Wealth solutions

14 | PAGE                                                                                      PSG Wealth | Monthly Insights - May 2019
PSG Wealth Offshore Solutions

PSG Wealth Global Preserver FoF (USD)

•     The PSG Wealth Global Preserver FoF USD returned 1%
      for April in line with the benchmark, the Morningstar                            Risk and expectation: The portfolio has a high equity
      EAA Funds USD Cautious Allocation sector average.                                allocation relative to peers and could underperform during
•     The PSG Wealth Global Preserver FoF USD ranked                                   periods of strong equity market declines, conversely
                                                                                       the portfolio will perform well when equity markets
      in the second quartile of its global sector over the
                                                                                       outperform other asset classes. Rising global interest rates
      previous month and is ranked 5th out of 70 funds over                            could also result in capital losses on the fixed interest and
      the past five years. The FoF has delivered 1.70% per                             property portions of the portfolio. However, this impact is
      annum above the benchmark sector average over five                               limited due to the FoF’s low bond duration. Additionally,
      years.                                                                           sufficient diversification through its overweight allocation
                                                                                       to equities to provide some protection to the portfolio in
Asset allocation                                                                       the event of any unexpected interest rate increases.
                                                                                       Radar: There are no funds on the radar screen.
                                                                                       Changes: No changes were made to underlying
                                                                                       managers.
                                                Foreign bonds, 71.12
                                                Foreign equity, 36.16
                                                Foreign other, 12.15
                                                Foreign cash and money market, 10.21
                                                Foreign property, 2.49
                                                Domestic bonds, 0.67

Source: PSG Wealth research team

All performance is reported in USD unless specified otherwise.

15 | PAGE                                                                                               PSG Wealth | Monthly Insights - May 2019
PSG Wealth Offshore Solutions

PSG Wealth Global Preserver FoF (GBP)                                                 PSG Wealth Global Moderate FoF (USD)

•     The PSG Wealth Global Preserver FoF GBP returned                                •    The PSG Wealth Global Moderate FoF returned
      0.70% for April in GBP, in line with the Morningstar                                 1.80% for April, overperforming the Morningstar
      EAA Funds GBP Cautious allocation sector average                                     EAA Funds USD Moderate Allocation sector average,
      benchmark, which also delivered a return of 0.70%.                                   which delivered 1.60%.
•     The PSG Wealth Global Preserver FoF GBP ranked                                  •    The PSG Wealth Global Moderate FoF is ranked in
      in the first of its global sector over all measurement                               the second quartile of Global Moderate Allocation
      periods over six months and is ranked 1st out of 29                                  Funds for all measurement periods over six months
      funds over the past five years. The FoF delivered                                    and is ranked 76th out of 201 funds over the past
      1.98% per annum above-the-benchmark sector                                           five years.
      average over five years.
                                                                                      Asset allocation
Asset allocation
                                                                                                                           Foreign equity, 63.45
                                                                                                                           Foreign bonds, 22.86
                                                Foreign bonds, 52.97                                                       Foreign cash and money market, 9.11
                                                Foreign equity, 26.47                                                      Foreign other, 2.45
                                                Foreign other, 10.92                                                       Foreign property, 1.87
                                                Foreign cash and money market, 6.78                                        Domestic bonds, 0.19
                                                Foreign property, 2.18                                                     Domestic equity, 0.09
                                                Domestic bonds, 0.68                                                       Domestic cash and money market, -0.02

                                                                                      Source: PSG Wealth research team
Source: PSG Wealth research team

                                                                                          Risk: The portfolio is defensively positioned with a
    Risk and expectation: The portfolio has a high equity                                 developed market overweight and performance will likely
    allocation relative to peers and could underperform during                            be muted during periods of positive market sentiment
    periods of strong equity market declines, conversely                                  when risky assets such as emerging markets outperform.
    the portfolio will perform well when equity markets                                   The portfolio currently has 27% in bonds, which could be
    outperform other asset classes. Rising global interest rates                          negatively impacted by unexpected interest rate increases.
    could also result in capital losses on the fixed interest and                         However, this risk is mitigated to an extent by relatively
    property portions of the portfolio. However, this impact is                           large equity allocation.
    limited due to the FoF’s low bond duration. Additionally,                             Expectation: We expect volatility to remain high in the
    sufficient diversification through its overweight allocation                          short term with fluctuating market sentiment in global
    to equities to provide some protection to the portfolio in                            equity markets, the cash position provides a buffer
    the event of any unexpected interest rate increases.                                  against market downturns. Our underlying managers
    Radar: No funds are currently on the radar screens.                                   are also able to deploy this cash when they find more
    Changes: No changes were made to underlying                                           attractive opportunities in the market. Interest rate risk is
    managers.                                                                             actively managed by our underlying managers, with most
                                                                                          positioned on the shorter end of the yield curve.
                                                                                          Radar: The BlackRock Global Allocation fund was removed
                                                                                          from the quantitative risk radar.
                                                                                          Changes: No changes to underlying managers.

All performance is reported in USD unless specified otherwise.

16 | PAGE                                                                                                  PSG Wealth | Monthly Insights - May 2019
PSG Wealth Offshore Solutions
PSG Wealth Global Moderate FF (ZAR)                                                   PSG Wealth Global Flexible FoF (USD)

•     The PSG Wealth Global Moderate FF D delivered                                   •    The PSG Wealth Global Flexible FoF USD delivered
      a return of 0.68% in rand-terms for April,                                           3.10% for April, outperforming the Morningstar
      underperforming the Morningstar EAA Funds USD                                        EAA Funds USD Flexible allocation sector, which
      Moderate allocation sector average, which delivered                                  returned 1.50%.
      1.03%.                                                                          •    The PSG Wealth Global Flexible FoF USD ranked in the
•     The rand increased by approximately 1.42% against                                    first quartile of its global sector over all measurement
      the US Dollar over April, thus decreasing the global                                 periods and is ranked 8th out of 70 funds over the
      portfolio returns reported in rand.                                                  past five years.
•     The PSG Wealth Global Moderate FF D is ranked in                                •    The PSG Wealth Global Flexible FoF USD has delivered
      the second quartile of the ASISA Global Multi Asset                                  excess returns of 5.21% per annum above the sector
      Flexible sector over all measurement periods over five                               average over the past five years.
      years.
                                                                                      Asset allocation
Asset allocation

                                               Foreign equity, 63.26
                                               Foreign bonds, 22.79                                                         Foreign equity, 64.95
                                               Foreign cash and money market, 9.09                                          Foreign bonds, 22.26
                                               Foreign other, 2.45                                                          Foreign cash and money market, 9.14
                                               Foreign property, 1.87                                                       Foreign other, 3.59
                                               Domestic cash and money market, 0.27                                         Foreign other, 0.07
                                               Domestic bonds, 0.19
                                               Domestic equity, 0.09

                                                                                      Source: PSG Wealth research team
Source: PSG Wealth research team

                                                                                          Risk and expectation: The portfolio currently has an
    Risk and expectation: We expect increased volatility                                  equity allocation of 64.95%, thus the portfolio will likely
    in the rand over the short term, which could have a                                   underperform should there be a significant correction in
    significant impact on rand returns for our global funds.                              global equity markets. We expect volatility to remain high
    However, over longer periods (seven years +) we expect                                in the short term with fluctuating market sentiment in
    the currency effect will be relatively flat and given the                             global equity markets. However, we are confident that
    relative valuation of global assets, especially equities, we                          our underlying managers will adjust the positioning of
    still believe the fund offers good opportunities.                                     their portfolios as they find opportunities that offer good
                                                                                          returns relative to the risk taken.
                                                                                          Radar: There are no funds on the radar screen.
                                                                                          Changes: During October 2018 the PSG Wealth fund
                                                                                          committee accepted a proposal to align the PSG Wealth
                                                                                          Global Flexible FoF (both USD and GBP classes) with its
                                                                                          intended role within the PSG Wealth Global Fund range
                                                                                          as a global multi-asset flexible fund. The main objective is
                                                                                          to align the fund with the PGS Multi Management’s split
                                                                                          funding investment philosophy and process. Over the
                                                                                          quarter, the following mandates were removed from the
                                                                                          PSG Wealth Global Flexible FoF (USD and GBP): Schroders
                                                                                          Global Multi-Asset Income, Fundsmith Equity and Veritas
                                                                                          Global Real Return. They were replaced with HSBC Global
                                                                                          Strategic Dynamic and Investec Global Multi-Asset Total
                                                                                          return funds. The new funds are a better mandate fit for
                                                                                          the FoF given their unconstrained multi asset approach.

All performance is reported in USD unless specified otherwise.

17 | PAGE                                                                                                 PSG Wealth | Monthly Insights - May 2019
PSG Wealth Offshore Solutions

PSG Wealth Global Flexible FoF (GBP)                                                   PSG Wealth Global Creator FF (ZAR)

                                                                                       •    The PSG Wealth Global Creator FF D delivered a return
•     The PSG Wealth Global Flexible FoF GBP returned
                                                                                            of 2.82% for April in rand terms, outperforming the
      2.90% in GBP for April, outperforming the
                                                                                            global sector average, which returned 2.69% as well
      benchmark Morningstar GBP Flexible Allocation
                                                                                            as the ASISA Global Equity General sector, which
      sector average, which delivered 1.80%.
                                                                                            returned 2.75%.
•     The PSG Wealth Global Flexible FoF GBP ranked in the
                                                                                       •    The rand increased by approximately 1.42% against
      first quartile of its global sector over all measurement
                                                                                            the US dollar over April, thus decreasing the global
      periods and is ranked 1st out of 69 funds over the
                                                                                            portfolio returns reported in rand.
      past five years. The PSG Wealth Global Flexible FoF
                                                                                       •    Over the past five years, the PSG Wealth Global
      GBP has delivered excess returns of 6.53% per
                                                                                            Creator FF D outperformed the ASISA Global Equity
      annum above the sector average over this period.
                                                                                            General sector average by 3.48%, recording 14.58%
                                                                                            per annum.
Asset allocation
                                                                                       Asset allocation

                                                 Foreign equity, 65.35
                                                 Foreign bonds, 22.13
                                                                                                                           Foreign equity, 93.33
                                                 Foreign cash and money market, 8.89
                                                                                                                           Foreign cash and money market, 3.06
                                                 Domestic property, 3.57
                                                                                                                           Foreign property, 1.93
                                                 Foreign other, 0.07
                                                                                                                           Domestic cash and money market, 1.26
                                                                                                                           Foreign other, 0.41

Source: PSG Wealth research team
                                                                                       Source: PSG Wealth research team
    Risk and expectation: The portfolio currently has an
    equity allocation of 65.35%, thus the portfolio will likely
    underperform should there be a significant correction in                               Risk and expectation: We expect increased volatility
    global equity markets. We expect volatility to remain high                             in the rand over the short term, which could have a
    in the short term with fluctuating market sentiment in                                 significant impact on rand returns for our global funds.
    global equity markets. However, we are confident that                                  However, over longer periods (seven years +) we expect
    our underlying managers will adjust the positioning of                                 the currency effect will be relatively flat and given the
    their portfolios as they find opportunities that offer good                            relative valuation of global equities we still believe the
    returns relative to the risk taken.                                                    fund offers good opportunities.
    Radar: No funds on the radar screen.
    Changes: No changes were made to underlying
    managers.

All performance is reported in USD unless specified otherwise.

18 | PAGE                                                                                                  PSG Wealth | Monthly Insights - May 2019
PSG Wealth Offshore Solutions

PSG Wealth Global Creator FoF (USD)

•     The PSG Wealth Global Creator FoF returned 4.10%
      for April, outperforming the benchmark Morningstar                              Risk: Most of our underlying managers remain relatively
      EAA Funds Global Large-Cap Blend equity sector                                  defensively positioned, with a preference for high-quality
                                                                                      stocks with very strong balance sheets, strong moats
      which delivered 3.30%.
                                                                                      and steady earnings outlooks. Given the high allocation
•     The PSG Wealth Global Creator FoF is ranked in the                              to quality large caps, mostly in developed markets, we
      first or second quartile of its global sector over all                          expect to underperform global markets when sentiment
      measurement periods.                                                            is very positive and relatively risky assets, such as emerging
•     The PSG Wealth Global Flexible FoF USD has delivered                            market equities, perform strongly (risk-on trade).
      excess returns of 1.71% per annum above the sector                              Expectation: We are confident that our underlying
      average over the past five years.                                               managers will adjust the positioning of their portfolios
•     The ranking universe is not restricted to only funds                            (including exposure to emerging markets) as they find
      registered for sale in South Africa and includes the                            opportunities that offer good returns relative to the
                                                                                      risk taken. We expect volatility to remain high in the
      full range of global open-ended funds falling within
                                                                                      short term with fluctuating market sentiment in global
      the Morningstar GIFS Global Large Cap Blend sector.                             equity markets, thus we are comfortable with the overall
                                                                                      defensive positioning of our fund.
Asset allocation                                                                      Radar: No funds on the radar screen.
                                                                                      Changes: No changes to underlying managers.

                                                Foreign equity, 93.72
                                                Foreign cash and money market, 3.07
                                                Foreign other, 1.94
                                                Foreign property, 1.27

Source: PSG Wealth research team

All performance is reported in USD unless specified otherwise.

19 | PAGE                                                                                              PSG Wealth | Monthly Insights - May 2019
PSG Wealth Equity Portfolios

Performance table

 PSG Wealth equity portfolios
 Fund                                             1-Month   3-Months 6-Months 12-Months 2-Years               Since
                                                                                                              inception
 PSG Wealth SA Equity Portfolio                     3.60%      3.88%        4.82%        -3.71%      2.92%        6.64%
 PSG Wealth SA Property Portfolio                   1.12%     -4.73%       -3.24%      -12.30%      -4.65%       -3.95%
 PSG Wealth Offshore Equity Portfolio (USD)         4.33%      8.30%        9.11%       11.41%      14.71%       13.42%
 PSG Wealth SA Dividend Income Equity Portfolio     5.53%      1.59%        3.96%        -7.05%      4.91%        4.43%
 PSG Wealth Managed Volatility Equity Portfolio     3.40%      0.50%       -1.77%      -11.71%      -2.73%       -1.34%
Source: PSG Wealth research team

                                            PSG Wealth SA Equity Portfolio
                                            Appropriate for investors seeking real returns
                                            in capital that exceed the local equity market
                                            returns, but who are comfortable with the capital
                              fluctuations that characterise an investment of this type.

              PSG Wealth
              SA Managed
              Volatility Equity
                                                                                                      PSG Wealth
  Tailored for investors who
                                                                                                      Offshore Equity
  require a smoother path
                                                                                                      Portfolio
  to long-term returns by
                                                                                                      Appropriate for
  reducing downside risk while                         Overview                          investors seeking real returns
  maintaining full exposure                            of equity                         in capital that exceed the
  to the equity risk premium
  in the long run. Benefits of                         portfolios                        international benchmark
                                                                                         returns.
  this strategy should be more
  pronounced during periods of
  heightened volatility.

              PSG Wealth SA Dividend                                              PSG Wealth SA Property
              Income Equity Portfolio                                             Equity Portfolio
              Suitable for investors that                                         For the more risk-averse investor
  require a regular and growing stream of                                         who requires a regular income.
  income derived from dividends with the
  potential for real growth in capital value.

20 | PAGE                                                                        PSG Wealth | Monthly Insights - May 2019
PSG Wealth Equity Portfolios

PSG Wealth SA Equity Portfolio

•     The PSG Wealth SA Equity Portfolio made a return
      of 3.60%, while the FTSE/JSE Capped All Share TR                                         Expectations:
      returned 5% for April.                                                                   • Equity market returns are slightly behind their long-
•     Eight (40%) of the 20 stocks in this portfolio ended                                        term averages.
      above its benchmark last month.                                                          • With multiples ahead of their long-term averages,
                                                                                                  we expect returns to materialise primarily through
                                                                                                  growth in earnings and not through a material
Performance since inception
                                                                                                  change in valuation multiples.
 8.00%
                                                                                               • We expect value to outperform growth and have
                                                                                                  tilted the portfolio’s exposure accordingly.
 6.00%
                                                                                               • Our largest underweight position is towards the
 4.00%                                                                                            stable consumer sector, primarily due to concerns
                                                                                                  regarding the valuation of food and drug retailers.
 2.00%
                                                                                               • Our foreign exposure is through domestic
 0.00%                                                                                            investments with international exposure rather than
-2.00%                                                                                            through pure rand hedges which we feel offer less
                                                                                                  value.
-4.00%
                                                                                               • Selected large rand hedges, however, continue to
-6.00%                                                                                            hold value on a relative basis.
           1-Month     3-Month       6-Month      12-Month         2-Years   Since inception   • Exchange rate movements will remain a dominant
                              PSG Wealth SA Equity Portfolio
                                                                                                  driver of short-term equity market returns.
                                                                                               • Sensible policy changes by a new administration
Disclaimer: Annualised for periods greater than one year
                                                                                                  could become a tailwind.
                                                                                               • A weaker exchange rate is likely to be a headwind to
Source: PSG Wealth research team data as at 30 April 2019
                                                                                                  relative returns, however, given the diversification of
*Inception date: 30 August 2015
                                                                                                  the portfolio and the quality of its investments, we
                                                                                                  believe its performance should not be fundamentally
Asset allocation                                                                                  dependent on exchange rate movements.
                                                                                               • Global investment markets are expected to remain
                                                                                                  volatile given the difficulty to forecast macro
                                                     Materials                                    variables.
                                                     Communication services                    • Our focus will remain on the underlying fundamentals
                                                     Consumer discretionary
                                                                                                  of the individual companies rather than on broad
                                                                                                  macro-issues.
                                                     Consumer staples
                                                     Financials
                                                                                               Risk:
                                                     Industrials                               • Changes in the perception of sovereign risk (positive
                                                     Cash                                         and negative) and its flow through to exchange- and
                                                                                                  interest rates can have an impact on portfolio values.
                                                                                               • Accommodative monetary policy continues to
                                                                                                  provide support to developed economies and creates
                                                                                                  artificial demand for high-yielding emerging market
Source: PSG Wealth research team
                                                                                                  securities. Should foreign capital inflows from these
                                                                                                  markets end abruptly, it will have an adverse impact
                                                                                                  on market valuations.
                                                                                               • The portfolio is likely to underperform should
                                                                                                  international monetary easing prove sustainable. An
                                                                                                  environment of sustained monetary easing should
                                                                                                  support ‘bond-proxy stocks’ to which the portfolio is
                                                                                                  underexposed to due to our valuation concerns. This
                                                                                                  could lead to portfolio underperformance.
                                                                                               • Overestimating        growth       and     operational
                                                                                                  improvements in highly-rated and large benchmark
                                                                                                  constituents.

21 | PAGE                                                                                                      PSG Wealth | Monthly Insights - May 2019
PSG Wealth Equity Portfolios

PSG Wealth SA Property Portfolio

•      The PSG Wealth SA Property Equity Portfolio made
       a return of 1.12% during April, underperforming                                       Expectations:
       the FTSE/JSE SA Listed Property Capped TR which                                       • The sluggish economic environment will continue
       returned 1.72%                                                                           to place pressure on the real estate sector.
•      Ten (50%) of the 20 stocks in the portfolio performed                                 • There is generally an oversupply of office space.
       above its benchmark.                                                                     New local developments could lead to a higher
                                                                                                supply while demand is weak.
Performance since inception                                                                  • Demand for vacant space will remain muted,
    2.00%                                                                                       placing further pressure on rentals. Weak
    0.00%
                                                                                                economic growth might result in higher vacancy
                                                                                                profiles and rental reversions.
 -2.00%
                                                                                             • Due to the highly competitive and weak market
 -4.00%
                                                                                                dynamics, attracting and retaining tenants has
 -6.00%                                                                                         become costlier with retail companies increasing
 -8.00%                                                                                         incentives for tenants.
-10.00%                                                                                      • Improving tenant retention rates have come at
-12.00%                                                                                         the expense of lower escalations.
-14.00%
                                                                                             • Capital market changes generally dominate
            1-Month    3-Month       6-Month      12-Month        2-year   Since inception      short-term returns.

                             PSG Wealth SA Property Portfolio
                                                                                             Risk:
Disclaimer: Annualised for periods greater than one year
                                                                                             • Weaker-than-expected growth could erode
                                                                                                 dividends underpinning the current valuations.
Source: PSG Wealth research team data as at 30 April 2019
*Inception date: 1 December 2015
                                                                                             • Cannibalisation is a risk in the retail segment.
                                                                                             • Low global bond yields have aided valuations –
                                                                                                 a reversal of this trend and tighter US monetary
Asset allocation                                                                                 policy could impact valuations.
                                                                                             • Changes in sovereign risk (positive and negative)
                                                                                                 and its flow through to capital markets can
                                                                                                 have a significant impact on valuations.
                                                                                             • Value-destructive acquisitions, especially in
                                               Diversified REITs                                  offshore territories where management has less
                                               Real estate Operating Companies
                                                                                                 experience, could impact the portfolio.
                                               Retail REITs
                                                                                             • Liquidity risk which could lead to the inability to
                                               Cash
                                                                                                 sell underperforming assets quickly.

Source: PSG Wealth research team

22 | PAGE                                                                                                  PSG Wealth | Monthly Insights - May 2019
PSG Wealth Equity Portfolios

PSG Wealth Offshore Equity Portfolio                        Performance since inception
                                                             16.00%
•    The PSG Wealth Offshore Equity Portfolio returned
                                                             14.00%
     4.33% (USD) in April, overperforming the Dow Jones
     Global Titans 50 TR that delivered 4.04%.               12.00%
•    Ten (50%) of the 20 stocks in this portfolio ended      10.00%
     above its benchmark.
                                                              8.00%

                                                              6.00%

    Expectations:                                             4.00%
    • Investment markets are expected to remain               2.00%
       volatile given the high amount of uncertainty in
                                                              0.00%
       forecasting macro variables.
                                                                       1-Month       3-Month      6-Month      12-Month        2-Years   Since inception
    • Given the diversification of the portfolio and
       the quality of its chosen investments, we believe                              PSG Wealth Offshore Equity Portfolio (USD)
                                                            Disclaimer: Annualised for periods greater than one year
       that the impact of macro variables should be
       reduced.                                             Source: PSG Wealth research team data as at 30 April 2019
                                                            *Inception date: 30 August 2015
    • Our focus will remain on the underlying
       fundamentals of the individual companies rather
       than on broad macro issues.                          Asset allocation

    Risk:
                                                                                                                 Communication services
    • Sustained international monetary easing
                                                                                                                 Consumer discretionary
        creates demand for quality, stable, high yielding
                                                                                                                 Consumer staples
        equities. This provides a valuation to underpin
                                                                                                                 Energy
        investments in the portfolio. The portfolio is
                                                                                                                 Financials
        likely to underperform should this deteriorate.                                                          Healthcare
                                                                                                                 Industrials
                                                                                                                 Information technology
                                                                                                                 Cash

                                                            Source: PSG Wealth research team

23 | PAGE                                                                              PSG Wealth | Monthly Insights - May 2019
PSG Wealth Equity Portfolios

PSG Wealth SA Dividend Income Equity                        Performance since inception
Portfolio
                                                             8.00%

•    The PSG Wealth SA Dividend Income Equity Portfolio      6.00%

     made a return of 5.53% during April, outperforming      4.00%

     its benchmark, the FTSE/JSE Dividend Plus TR, which     2.00%
     made a return of 5% over the same period.               0.00%
•    Twelve (75%) of the 16 stocks in this portfolio came    -2.00%
     in above the benchmark.
                                                             -4.00%

                                                             -6.00%

    Expectations:                                            -8.00%
    • Investment markets are expected to remain volatile               1-Month      3-Month      6-Month      12-Month        2-Years   Since inception
       given the difficulty to forecast macro variables.
                                                                                  PSG Wealth SA Dividend Income Equity Portfolio
    • A shift from highly-valued, high-quality defensive
       stocks toward more reasonable priced consumer        Disclaimer: Annualised for periods greater than one year (since inception)

       cyclical and financial stocks in the medium term.    Source: PSG Wealth research team data as at 30 April 2019
                                                            *Inception date: 29 April 2016
    Risk:
    • Changes in the perception of sovereign risk           Asset allocation
        (positive and negative) and its flow through to
        exchange rates and interest rates can have an
        impact on portfolio values.                                                                             Materials
    • The portfolio is likely to underperform should                                                            Consumer discretionary
        international monetary easing prove sustainable.                                                        Consumer staples
        An environment of sustained monetary easing                                                             Energy
        should support ‘bond-proxy stocks’ to which the                                                         Financials
        portfolio is underexposed to due to valuation                                                           Healthcare
        concerns.                                                                                               Industrials
                                                                                                                Cash

                                                            Source: PSG Wealth research team

24 | PAGE                                                                             PSG Wealth | Monthly Insights - May 2019
PSG Wealth Equity Portfolios

PSG Wealth SA Managed Volatility Equity                     Performance since inception
Portfolio                                                    6.00%
                                                             4.00%
•    The PSG Wealth SA Managed Volatility Equity             2.00%
     Portfolio recorded a return of 3.40% for April          0.00%
     compared to its benchmark, the PSG Wealth Custom        -2.00%
     Low Volatility Index TR, which ended the month with     -4.00%
     a return of 3.66%.                                      -6.00%
•    Two (10%) of the 21 stocks in this portfolio came in    -8.00%
     above the benchmark.                                   -10.00%
                                                            -12.00%
                                                            -14.00%
    Expectations:                                                      1-Month       3-Month      6-Month      12-Month      2-Years   Since inception
    • The valuation of most benchmark constituents
                                                                                 PSG Wealth SA Managed Volatility Equity Portfolio
       currently seems elevated.                            Disclaimer: Returns annualised since inception
    • Relative outperformance against the benchmark
                                                            Source: PSG Wealth research team data as at 30 April 2019
       through not owning the most expensive pockets        *Inception date: 28 July 2016
       of shares.
    • Lower portfolio drawdown, while still
       participating in equity market returns.
                                                            Asset allocation
    • Low volatility investing in a defensive way to
       take risks.
    • Portfolio outperformance relative to local equity                                                      Materials
       markets during periods of stress.                                                                     Consumer discretionary
    • Positive relative performance over the longer                                                          Consumer staples
       term.                                                                                                 Financials
                                                                                                             Healthcare

    Risk:                                                                                                    Industrials
                                                                                                             Cash
    • A negative performance relative to the local
        equity market during strong bull markets.

                                                            Source: PSG Wealth research team

25 | PAGE                                                                              PSG Wealth | Monthly Insights - May 2019
Other publications

Previous publications

  Daily                                                    Weekly
                   29 May                                              22   May    17 Oct    09 May    20 Sept    05   April
                                                                       07   May    10 Oct    18 Apr    13 Sep     22   Mar
                                                                       17   Apr    03 Oct    11 Apr    06 Sep     15   Mar
                                                                       10   Apr    19 Sept   04 Apr    23 Aug     08   Mar
                                                                       03   Apr    12 Sept   22 Mar    16 Aug     01   Mar
                                                                       20   Mar    05 Sept   14 Mar    03 Aug     15   Feb
                                                                       13   Mar    22 Aug    07 Mar    19 July    06   Feb
                                                                       06   Mar    15 Aug    21 Feb    12 July    18   Jan
                                                                       27   Feb    08 Aug    07 Feb    21 June    11   Jan
                                                                       13   Feb    18 Jul    17 Jan    14 June    14   Dec
                                                                       06   Feb    11 Jul    06 Dec    07 June    07   Dec
                                                                       16   Jan    04 Jul    22 Nov    31 May     30   Nov
                                                                       12   Dec    20 Jun    15 Nov    17 May     16   Nov
                                                                       05   Dec    13 Jun    08 Nov    10 May     09   Nov
                                                                       21   Nov    06 Jun    18 Oct    03 May     02   Nov
                                                                       14   Nov    23 May    11 Oct    19 April   26   Oct
                                                                       07   Nov    16 May    04 Oct    12 April   12   Oct

  Monthly                                                  Research and Strategy Report
               Apr    2019   May    2018    Jun   2017                            Autumn 2019         Summer		2018
               Mar    2019   Apr    2018    May   2017                            Summer		2019        Spring		2017
               Feb    2019   Mar    2018    Apr   2017                            Spring		2018        Winter		2017
               Jan    2019   Feb    2018    Mar   2017                            Winter		2018        Autumn		2017
               Nov    2018   Jan    2018    Feb   2017                            Autumn		2018        Summer 		2017
               Oct    2018   Nov    2017    Jan   2017
               Sep    2018   Oct    2017    Nov   2016
               Aug    2018   Sep    2017    Oct   2016
               Jul    2018   Aug    2017    Sep   2016
               Jun    2018   July   2017    Aug   2016

  Special report                                           Wealth Perspective
               Our view on Tito Mboweni as new                          Mar    2019
               Minister of Finance                                      Dec    2018
               Value investing in the 21st century                      Sep    2018
               Our bear risk indicator                                  Jun    2018
               Sequence risk and our bucket philosophy                  Mar    2018
               Sequence risk video                                      Dec    2017
               New Offshore Brochure                                    Sept   2017
               Volatility is uncomfortable, but expected                Jun    2017
               Stocks that could outperform in stronger                 Mar    2017
               economy                                                  Dec    2016
               New ANC leader, too close to call                        Sep    2016
               Our exposure to Steinhoff                                Jul    2016
               Local currency downgraded to junk                        Apr    2016
               Blockchains and Bitcoins
               UK snap election
               Berkshire 2017 AGM
               Distributions explained
               S&P junk status
               Research provided
               Fed hike inevitable?

26 | PAGE                                                                   PSG Wealth | Monthly Insights - May 2019
Disclaimer

PSG Wealth is a brand underneath PSG Konsult Ltd, which consists of the following legal entities: PSG Multi-Management (Pty) Ltd, PSG Securities Ltd, PSG Fixed Income and Commodities
(Pty) Ltd, PSG Scriptfin (Pty) Ltd, PSG Invest (Pty) Ltd, PSG Life Ltd, PSG Employee Benefits Ltd, PSG Trust (Pty) Ltd, and PSG Wealth Financial Planning (Pty) Ltd.

Affiliates of the PSG Konsult Group are authorised financial services providers. The opinions expressed in this document are the opinions of the writer and not necessarily those of PSG Konsult Group.
The information is provided as general information. It does not constitute financial, tax, legal or investment advice and the PSG Konsult Group of Companies does not guarantee its suitability or potential
value. Although the utmost care has been taken in the research and preparation of this document, no responsibility can be taken for actions taken on information in this document. Should you require
further information, and since individual needs and risk profiles differ, we suggest you consult a qualified financial adviser, if needed.

Collective Investment Schemes in Securities (CIS) are generally medium- to long-term investments. The value of participatory interests (units) may go down as well as up and past performance is not a
guide to future performance. CIS are traded at ruling prices and can engage in borrowing and scrip lending. A fund of funds is a portfolio that invests in portfolios of collective investment schemes, which
levy their own charges, which could result in a higher fee structure for these portfolios. Fluctuations or movements in the exchange rates may cause the value of underlying international investments
to go up or down. A schedule of fees and charges and maximum commissions is available on request from PSG Collective Investments Limited. Commission and incentives may be paid and if so, are
included in the overall costs. Forward pricing is used.

The portfolios may be capped at any time in order for them to be managed in accordance with their mandate. Different classes of participatory interest can apply to these portfolios and are subject to
different fees and charges. Figures quoted are from I-Net, Stats SA, SARB, © 2015 Morningstar, Inc. All Rights Reserved for a lump sum using NAV-NAV prices net of fees, includes income and assumes
reinvestment of income. PSG Collective Investments Limited is a member of the Association for Savings and Investment South Africa (ASISA) through its holdings company PSG Konsult Limited.

Conflict of Interest Disclosure: The fund may from time to time invest in a portfolio managed by a related party. PSG Collective Investments Limited or the Fund Manager may negotiate a discount on
the fees charged by the underlying portfolio. All discounts negotiated are reinvested in the fund for the benefit of the investor. Neither PSG Collective Investments Limited nor the Fund Manager retain
any portion of such discount for their own accounts. PSG Multi-Management (Pty) Ltd (FSP No. 44306), PSG Asset Management (Pty) Ltd (FSP No. 29524) and PSG Collective Investments Limited are
subsidiaries of PSG Group Limited. The Fund Manager may use the brokerage services of a related party, PSG Securities Ltd.
You can also read