State of Mineral Finance 2018: Gaining Momentum - PROSPECTORS & DEVELOPERS ASSOCIATION OF CANADA - Prospectors & Developers Association ...

Page created by Jerry Lyons
 
CONTINUE READING
State of Mineral Finance 2018: Gaining Momentum - PROSPECTORS & DEVELOPERS ASSOCIATION OF CANADA - Prospectors & Developers Association ...
State of Mineral
Finance 2018:
Gaining Momentum

PROSPECTORS &
DEVELOPERS
ASSOCIATION
OF CANADA
State of Mineral Finance 2018: Gaining Momentum - PROSPECTORS & DEVELOPERS ASSOCIATION OF CANADA - Prospectors & Developers Association ...
State of Mineral Finance 2018: Gaining Momentum

Forward
The following report provides a detailed retrospective of financing dynamics for the
mineral exploration and mining industry since 2011. Based on analysis of a broad set of
financial metrics, the report outlines how available funding for, and activity levels within,
the mineral industry have improved in recent years from low points in 2015. However,
the apparent industry recovery has not been evenly distributed, and both financing
opportunities and activity levels remain well below peaks realized in 2011.

About the organizations
The Prospectors & Developers Association of Canada (PDAC) is the leading voice of the
mineral exploration and development community. With 8,000 members around the world,
PDAC’s mission is to promote a globally-responsible, vibrant and sustainable mineral
sector that encourages best practices in technical, operational, environmental, safety
and social performance. PDAC is known worldwide for the annual PDAC Convention—the
premier international event for the industry. It has attracted over 25,000 people from
135 countries in recent years and will next be held March 3-6, 2019 in Toronto.
Please visit www.pdac.ca

Oreninc.com is North America’s leading provider of relevant financing information in the
junior commodities space. Since 2011, the company has been keeping track of financings
in the junior mining as well as oil and gas space. Logging all relevant deal and company
information into its proprietary database, called the Oreninc Deal Log, Oreninc quickly
became the go-to website in the mining financing space for investors, analysts, fund
managers and company executives alike.
Please visit www.oreninc.com

Contribution:
PDAC: Ran Maoz, Jeff Killeen, Lesley Williams, Cameron Ainsworth-Vincze,
Lisa Davis, Tom King, Michael Fowler
Oreninc: Kai Hoffmann, Jared Lemen

                                   PROSPECTORS &
                                   DEVELOPERS
                                   ASSOCIATION
                                   OF CANADA

                                                                                                            2
State of Mineral Finance 2018: Gaining Momentum

Executive Summary
►	Following a prolonged downturn in mineral industry activity, 2016 and 2017 were
  characterized by rising commodity prices that sparked increased financing opportunities
  and exploration expenditures, both in Canada and globally. A cyclical upswing in global
  economic activity, coupled with USD depreciation and low interest rates, has driven
  an improvement in the commodity complex. However, improvements in financing and
  exploration activity has not spread evenly across the mineral industry.

►	International Monetary Fund (IMF) estimates for global economic growth—measured
  by GDP (Gross Domestic Product)—have rebounded from a low of 3.2% in 2016 to 3.7%
  in 2017, and is expected to increase to 3.9% through 2018-2019.1 A rebound in global
  GDP combined with increased expectations for growth in China and other advanced
  economies, as well as U.S. domestic infrastructure spending, are likely drivers behind
  increased demand for industrial commodities. As a result, monthly average prices of key
  base metals improved significantly over the past two years (36%-110%), while monthly
  average prices for precious metal have experienced more modest increases (6%-15%)
  over the same period.2

►	Global mineral sector investment deteriorated from a peak in 2012 through to 2016 as
  funds raised globally for the mineral sector declined by 56% compared to 2012 levels.
  This trend reversed in 2017 as total global financing increased 61% year-over-year. The
  relative increase is largely attributed to increased debt financing, which doubled between
  2016 and 2017.3 Given that debt is not a typical financing vehicle for non-revenue
  generating exploration companies, debt expansion may suggest that a shift in market
  dynamics for the mineral industry is underway.

►	Global equity financing peaked in 2011 at US$53 billion and fell sharply to reach US$24
  billion in 2013. Global equity financing has subsequently stabilized but with a moderate
  decreasing trend, declining from US$37 billion in 2014 to US$27 billion in 2016, and
  slightly improving to US$29 billion in 2017. Canadian stock exchanges continue to be a
  material source of equity financing for the global mineral industry, with TSX and TSXV
  contributing on average 19% of the funds raised from 2011-2017. Due to the focus on
  Canadian markets, all monetary figures in this report are expressed in Canadian
  Dollars (CAD) unless otherwise stated.

►	Mineral industry financing via Canadian stock exchanges in 2017 expanded 83% from a
  2015 low. Total financing activity was more prominent on the TSXV, with a 243% increase
  over two years, compared to 64% on the TSX. Most of the increases occurred in 2016
  and, similar to the global trend, the majority of funding expansion is attributed to an
  increase in debt financing, which rose from $0.5 billion in 2015 to $6.6 billion in 2017 or
  roughly 52% of total funds raised.4

►	Data provided by Oreninc on junior mineral industry financing in Canada shows a mixed
  picture for 2017.5 Equity raises by junior companies listed on the TSXV increased by 18%
  compared to 2016, whilst the CSE recorded a 123% increase in funds raised. Conversely,

                                                                                                         3
State of Mineral Finance 2018: Gaining Momentum

  the value of financing for junior companies on the TSX declined 32% from 2016 levels.
  In 2017, bought-deal transactions became more significant, with their value increasing
  12%, while the value of best-efforts transactions fell by 21% and 15% for brokered and
  non-brokered transactions, respectively. Lastly, while the value of equity financing for
  projects targeting minerals associated with battery-technology grew 200% in 2017, the
  same fund flow for both precious and base metals fell by 12% and 11%, respectively.
  Notably, over 85% of funds generated via equity financing for junior companies was by
  those with a market capitalization of less than $500 million.

►	Global financing explicitly for mineral exploration from 2012 to 2015 was negatively
  impacted by reduced overall investment in the mineral industry, and declined by
  85% from US$19.4 billion to US$2.9 billion over this period. Between 2015 and 2017
  financing for exploration nearly tripled to reach US$4.8 billion in 2016 and US$8.9
  billion in 2017. In Canada, similar trends are observed with a 75% decline in financing
  for exploration between 2012 and 2015, followed by an increase of nearly 200%
  between 2015 and 2016 (from $1.02 billion in 2015 to $3.0 billion in 2016), and a
  further 7% increase in 2017.6

►	Global exploration expenditures from 2012-2017 followed exploration financing trends,
  declining over 65% from a peak of US$20.5 billion in 2012 to US$6.9 billion in 2016.
  The trend reversed in 2017 as expenditures increased approximately 15% compared to
  2016 (to US$7.9 billion). Canada and Australia continued to lead global activity in 2017,
  accounting for 13.8% and 13.5% of expenditures, respectively. Noteworthy is a long-
  term decline in Canada’s share of global exploration spending, from 20.5% in 2008 to
  13.8% in 2017.7

►	The profile of Canadian exploration expenditures followed global trends, peaking in
    2012 at $3.2 billion, declining by nearly 60% to $1.3 billion in 2016 and rebounding
    by 10% in 2017. Analyzing expenditures based on the stage of project development
    highlights a somewhat alarming long-term trend of grassroots exploration
    representing a decreased share—from 45% of exploration expenditures in 2008 to 21%
    in 2016, before slightly improving to 28% in 2017.8

►	The flow-through share (FTS) regime continues to be a critical source of exploration
    financing in Canada. From 2011-2017, funds raised in Canada for domestic exploration
    via FTS financing averaged 68% of the total funds generated.9 A notable development
    in fiscal policies related to the FTS regime is the expansion of Canadian Exploration
    Expenses (CEE) to include certain expenses on community consultation and certain
    environmental studies.

►	New prospectus exemptions were adopted or amended in various provinces in 2015-
    2016, which may have contributed to the rebound in mineral industry financings.
    According to data gathered from the Ontario Securities Commission (OSC), the
    most relevant exemption for mineral sector was the friends, family and business
    associates. However, the scale of use in the new exemptions has been immaterial
    relative to the total market size, according to OSC data.

                                                                                                         4
State of Mineral Finance 2018: Gaining Momentum

Table of Contents
Executive Summary                ◆ ◆◆◆◆◆◆◆◆◆◆◆◆◆◆◆◆◆◆◆◆◆◆◆◆◆◆◆◆◆◆◆◆◆◆◆◆◆◆◆◆◆◆◆◆◆◆◆◆◆◆◆◆◆◆◆◆◆◆◆◆◆◆◆◆◆◆◆◆◆◆◆◆◆◆◆◆◆◆◆◆◆◆◆◆◆◆◆◆◆◆◆◆◆◆◆◆◆◆◆◆◆◆◆◆◆◆◆◆◆◆◆◆                                                                                                                       3
Table of Contents      ◆◆ ◆ ◆ ◆ ◆ ◆ ◆ ◆ ◆ ◆ ◆ ◆ ◆ ◆ ◆ ◆ ◆ ◆ ◆ ◆ ◆ ◆ ◆ ◆ ◆ ◆ ◆ ◆ ◆ ◆ ◆ ◆ ◆ ◆ ◆ ◆ ◆ ◆ ◆ ◆ ◆ ◆ ◆ ◆ ◆ ◆ ◆ ◆ ◆ ◆ ◆ ◆ ◆ ◆ ◆ ◆ ◆ ◆ ◆ ◆ ◆ ◆ ◆ ◆ ◆ ◆ ◆ ◆ ◆ ◆ ◆ ◆ ◆ ◆ ◆ ◆ ◆ ◆ ◆ ◆ ◆ ◆ ◆ ◆ ◆ ◆ ◆ ◆ ◆ ◆ ◆ ◆ ◆ ◆ ◆ ◆ ◆ ◆ ◆ ◆ ◆ ◆ ◆ ◆ ◆ ◆ ◆ ◆ ◆ ◆ ◆ ◆ ◆ ◆ ◆ ◆ ◆ ◆ ◆ ◆   5
Introduction    ◆◆◆◆◆◆◆◆◆◆◆◆◆◆◆◆◆◆◆◆◆◆◆◆◆◆◆◆◆◆◆◆◆◆◆◆◆◆◆◆◆◆◆◆◆◆◆◆◆◆◆◆◆◆◆◆◆◆◆◆◆◆◆◆◆◆◆◆◆◆◆◆◆◆◆◆◆◆◆◆◆◆◆◆◆◆◆◆◆◆◆◆◆◆◆◆◆◆◆◆◆◆◆◆◆◆◆◆◆◆◆◆◆◆◆◆◆◆◆◆◆◆◆◆◆◆◆◆                                                                                                                          6
   Sources of Information                            ◆◆ ◆ ◆ ◆ ◆ ◆ ◆ ◆ ◆ ◆ ◆ ◆ ◆ ◆ ◆ ◆ ◆ ◆ ◆ ◆ ◆ ◆ ◆ ◆ ◆ ◆ ◆ ◆ ◆ ◆ ◆ ◆ ◆ ◆ ◆ ◆ ◆ ◆ ◆ ◆ ◆ ◆ ◆ ◆ ◆ ◆ ◆ ◆ ◆ ◆ ◆ ◆ ◆ ◆ ◆ ◆ ◆ ◆ ◆ ◆ ◆ ◆ ◆ ◆ ◆ ◆ ◆ ◆ ◆ ◆ ◆ ◆ ◆ ◆ ◆ ◆ ◆ ◆ ◆ ◆ ◆ ◆ ◆ ◆ ◆ ◆ ◆ ◆ ◆ ◆ ◆ ◆ ◆ ◆ ◆ ◆ ◆ ◆ ◆ ◆ ◆ ◆ ◆ ◆ ◆   6
   Assumptions and Limitations                                                 ◆◆ ◆ ◆ ◆ ◆ ◆ ◆ ◆ ◆ ◆ ◆ ◆ ◆ ◆ ◆ ◆ ◆ ◆ ◆ ◆ ◆ ◆ ◆ ◆ ◆ ◆ ◆ ◆ ◆ ◆ ◆ ◆ ◆ ◆ ◆ ◆ ◆ ◆ ◆ ◆ ◆ ◆ ◆ ◆ ◆ ◆ ◆ ◆ ◆ ◆ ◆ ◆ ◆ ◆ ◆ ◆ ◆ ◆ ◆ ◆ ◆ ◆ ◆ ◆ ◆ ◆ ◆ ◆ ◆ ◆ ◆ ◆ ◆ ◆ ◆ ◆ ◆ ◆ ◆ ◆ ◆ ◆ ◆ ◆ ◆ ◆ ◆ ◆ ◆ ◆ ◆ ◆   7

SECTION 1: The Macroeconomic Environment and Commodity Prices                                                                                                                                                                                ◆ ◆◆◆◆◆◆◆◆◆◆◆◆◆◆◆            8
  The Macroeconomic Environment                                                                 ◆◆ ◆ ◆ ◆ ◆ ◆ ◆ ◆ ◆ ◆ ◆ ◆ ◆ ◆ ◆ ◆ ◆ ◆ ◆ ◆ ◆ ◆ ◆ ◆ ◆ ◆ ◆ ◆ ◆ ◆ ◆ ◆ ◆ ◆ ◆ ◆ ◆ ◆ ◆ ◆ ◆ ◆ ◆ ◆ ◆ ◆ ◆ ◆ ◆ ◆ ◆ ◆ ◆ ◆ ◆ ◆ ◆ ◆ ◆ ◆ ◆ ◆ ◆ ◆ ◆ ◆ ◆ ◆ ◆ ◆ ◆ ◆ ◆ ◆ ◆ ◆ ◆ ◆ ◆ ◆ ◆ ◆ ◆    8
   A Prolonged Commodity Price Decline Reverses in 2016                                                                                                                                    ◆ ◆◆◆◆◆◆◆◆◆◆◆◆◆◆◆◆◆◆◆◆◆◆◆◆◆◆◆◆◆◆◆◆◆◆                                     10

SECTION 2: Financing Trends                                              ◆◆◆◆◆◆◆◆◆◆◆◆◆◆◆◆◆◆◆◆◆◆◆◆◆◆◆◆◆◆◆◆◆◆◆◆◆◆◆◆◆◆◆◆◆◆◆◆◆◆◆◆◆◆◆◆◆◆◆◆◆◆◆◆◆◆◆◆◆◆◆◆◆◆◆◆◆◆◆◆◆◆◆◆◆◆◆◆◆◆◆◆                                                                                               13
  Global Financing Trends Show Signs of Recovery                                                                                                             ◆ ◆◆◆◆◆◆◆◆◆◆◆◆◆◆◆◆◆◆◆◆◆◆◆◆◆◆◆◆◆◆◆◆◆◆◆◆◆◆◆◆◆◆◆◆◆◆◆◆◆                                                    13
   The Financing Landscape in Canada                                                                      ◆ ◆◆◆◆◆◆◆◆◆◆◆◆◆◆◆◆◆◆◆◆◆◆◆◆◆◆◆◆◆◆◆◆◆◆◆◆◆◆◆◆◆◆◆◆◆◆◆◆◆◆◆◆◆◆◆◆◆◆◆◆◆◆◆◆◆◆◆◆◆◆◆◆◆◆◆                                                                             14
   The Junior Mineral Sector in Canada                                                                      ◆◆ ◆ ◆ ◆ ◆ ◆ ◆ ◆ ◆ ◆ ◆ ◆ ◆ ◆ ◆ ◆ ◆ ◆ ◆ ◆ ◆ ◆ ◆ ◆ ◆ ◆ ◆ ◆ ◆ ◆ ◆ ◆ ◆ ◆ ◆ ◆ ◆ ◆ ◆ ◆ ◆ ◆ ◆ ◆ ◆ ◆ ◆ ◆ ◆ ◆ ◆ ◆ ◆ ◆ ◆ ◆ ◆ ◆ ◆ ◆ ◆ ◆ ◆ ◆ ◆ ◆ ◆ ◆ ◆ ◆ ◆ ◆ ◆ ◆    17

SECTION 3: Exploration Trends                                                    ◆ ◆◆◆◆◆◆◆◆◆◆◆◆◆◆◆◆◆◆◆◆◆◆◆◆◆◆◆◆◆◆◆◆◆◆◆◆◆◆◆◆◆◆◆◆◆◆◆◆◆◆◆◆◆◆◆◆◆◆◆◆◆◆◆◆◆◆◆◆◆◆◆◆◆◆◆◆◆◆◆◆◆◆◆◆◆◆◆                                                                                          26
  Financing for Mineral Exploration Begins to Rebound                                                                                                                        ◆◆ ◆ ◆ ◆ ◆ ◆ ◆ ◆ ◆ ◆ ◆ ◆ ◆ ◆ ◆ ◆ ◆ ◆ ◆ ◆ ◆ ◆ ◆ ◆ ◆ ◆ ◆ ◆ ◆ ◆ ◆ ◆ ◆ ◆ ◆ ◆ ◆ ◆ ◆ ◆ ◆ ◆   26
   Global Exploration Expenditures                                                         ◆ ◆◆◆◆◆◆◆◆◆◆◆◆◆◆◆◆◆◆◆◆◆◆◆◆◆◆◆◆◆◆◆◆◆◆◆◆◆◆◆◆◆◆◆◆◆◆◆◆◆◆◆◆◆◆◆◆◆◆◆◆◆◆◆◆◆◆◆◆◆◆◆◆◆◆◆◆◆◆◆◆◆◆                                                                                     27
   Exploration Expenditures in Canada                                                                    ◆◆◆◆◆◆◆◆◆◆◆◆◆◆◆◆◆◆◆◆◆◆◆◆◆◆◆◆◆◆◆◆◆◆◆◆◆◆◆◆◆◆◆◆◆◆◆◆◆◆◆◆◆◆◆◆◆◆◆◆◆◆◆◆◆◆◆◆◆◆◆◆◆◆◆◆                                                                               29
   Exploration Expenditures by Commodity Type                                                                                                     ◆ ◆◆◆◆◆◆◆◆◆◆◆◆◆◆◆◆◆◆◆◆◆◆◆◆◆◆◆◆◆◆◆◆◆◆◆◆◆◆◆◆◆◆◆◆◆◆◆◆◆◆◆◆◆◆◆                                                         31

SECTION 4: Fiscal Incentives and Capital Markets Reforms                                                                                                                                               ◆ ◆◆◆◆◆◆◆◆◆◆◆◆◆◆◆◆◆◆◆◆◆◆◆◆◆◆◆◆                               33
  The Flow-through Share (FTS) Regime                                                                                ◆◆ ◆ ◆ ◆ ◆ ◆ ◆ ◆ ◆ ◆ ◆ ◆ ◆ ◆ ◆ ◆ ◆ ◆ ◆ ◆ ◆ ◆ ◆ ◆ ◆ ◆ ◆ ◆ ◆ ◆ ◆ ◆ ◆ ◆ ◆ ◆ ◆ ◆ ◆ ◆ ◆ ◆ ◆ ◆ ◆ ◆ ◆ ◆ ◆ ◆ ◆ ◆ ◆ ◆ ◆ ◆ ◆ ◆ ◆ ◆ ◆ ◆ ◆ ◆ ◆ ◆ ◆ ◆ ◆ ◆   33
   Regulatory Developments in Canadian Capital Markets                                                                                                                                ◆◆ ◆ ◆ ◆ ◆ ◆ ◆ ◆ ◆ ◆ ◆ ◆ ◆ ◆ ◆ ◆ ◆ ◆ ◆ ◆ ◆ ◆ ◆ ◆ ◆ ◆ ◆ ◆ ◆ ◆ ◆ ◆ ◆ ◆ ◆ ◆ ◆    35

ENDNOTES       ◆ ◆◆◆◆◆◆◆◆◆◆◆◆◆◆◆◆◆◆◆◆◆◆◆◆◆◆◆◆◆◆◆◆◆◆◆◆◆◆◆◆◆◆◆◆◆◆◆◆◆◆◆◆◆◆◆◆◆◆◆◆◆◆◆◆◆◆◆◆◆◆◆◆◆◆◆◆◆◆◆◆◆◆◆◆◆◆◆◆◆◆◆◆◆◆◆◆◆◆◆◆◆◆◆◆◆◆◆◆◆◆◆◆◆◆◆◆◆◆◆◆◆◆◆◆◆                                                                                                                      38

                                                                                                                                                                                                                                                                              5
State of Mineral Finance 2018: Gaining Momentum

Introduction
As the leading voice of Canada’s mineral exploration and development industry, the
Prospectors & Developers Association of Canada (PDAC) undertakes numerous initiatives
to support industry’s efforts to raise capital and to invest such funds in exploration and
development. This State of Mineral Finance 2018: Gaining Momentum report highlights
the financial aspects of mineral exploration up to the end 2017. The report was produced
by PDAC in collaboration with Oreninc, a data provider focused on junior mining companies
that are listed on Canadian stock exchanges.

This report is divided into four key sections:
   1. The macroeconomic environment and commodity prices
   2. Financing trends
   3.	Exploration trends
   4.	Fiscal incentives and capital market reforms

Section 1 includes a macroeconomic overview and provides background on key factors
that impact the business environment under which the mineral sector operates, including
fluctuations in the demand for raw materials that significantly affect commodity prices. Due
to the strong correlation of commodity prices to the level of activity in the mineral sector, it
also includes a brief overview of the prices of key commodities.

Section 2 addresses financing trends, beginning with an overview of global and Canadian
financing trends, followed by a focused overview of financing trends among junior mining
companies in Canada that was provided by Oreninc.

Section 3 provides an overview of trends for exploration expenditures, disaggregated by
commodity, region, stage of exploration and company type. This section begins with some
information on the state of financing, specifically for exploration activities.

Section 4 of the report provides updated information about the flow-through share regime,
a leading fiscal policy that Canada has in place to support a vibrant exploration sector. The
section also includes an update on securities regulation in Canada, such as new exemptions,
and attempts to improve the efficiency of securities regulation for smaller issuers, such as
mineral exploration companies, while maintaining investors’ confidence by improving the
transparency of the disclosure aspects.

Sources of Information
This report analyses data on financing undertaken by mineral industry participants and on
exploration expenditures from several recognized industry sources. The definitions used in
this report are taken directly from the sources and have not been altered by the authors.

                                                                                                           6
State of Mineral Finance 2018: Gaining Momentum

The data collected in the report is primarily sourced from the following:
   ►   S&P Global Market Intelligence (Formerly SNL Metals & Mining)
   ►   Oreninc
   ►   TMX Group
   ►   International Monetary Fund’s World Economic Outlook
   ►   Ontario Securities Commission’s report on the exempt markets

Specifically, financing data is taken from the TMX group, S&P Global Market Intelligence
and Oreninc, which all use different methodologies and definitions in collecting data. In
relevant places, references identify the source of the data and clarifications are provided
in endnotes.

Additional information is collected from various sources for which the reference is made
in the appropriate text, tables and charts.

Assumptions and Limitations
The report examines trends from a 2011-2012 peak in mineral industry activity to the
end of 2017 and has been prepared for the purpose of informing readers about recent
developments in financing and exploration expenditures, as well as to provide a backdrop
for work undertaken by the PDAC on behalf of its members.

This publication focuses on the Canadian landscape with all monetary figures
stated and analyzed in Canadian Dollars (CAD). Exceptions include global figures
and commodity prices, which are presented in United States Dollars (USD) to
enable global comparisons, and such figures are clearly marked by a “US$” sign.10

Stated figures in this report for exploration expenditures refer only to non-ferrous
exploration.

The data used in the report is considered to be accurate as of March 19, 2018.
Assumptions and estimates used to produce the data are taken from the sources. For
further information about data in this report, please contact Ran Maoz (rmaoz@pdac.ca),
Jeff Killeen (jkilleen@pdac.ca) or for specific information on Oreninc’s data, contact
Kai Hoffmann, the CEO of Oreninc at hoffmann@oreninc.com.

                                                                                                           7
State of Mineral Finance 2018: Gaining Momentum

      SECTION I: The Macroeconomic
      Environment and Commodity Prices
      Following a peak in commodity prices in 2011-2012, a long period of price decline led the
      mineral sector into a period of stagnation. A rebound in activity within the mineral and
      exploration sector has been supported by a cyclical upswing in global economic activity
      since mid-2016. It is important to note that the increase in financing and exploration
      expenditures has not spread evenly among the entire mineral sector. Moreover, key financial
      indicators continue to demonstrate volatility in terms of the amount of financing available
      for the mineral sector. Therefore, it is likely too early to determine whether recent increases
      in financing for the mineral sector will be sustained.

      The Macroeconomic Environment
      According to the International Monetary Fund (IMF) in its January 2018 update, global
      economic activity has improved significantly since mid-2016, and is more robust than
      previously expected. This section will focus on some of the key macroeconomic factors
      that impact the activity of the mineral sector.

      Solid Growth of Gross Domestic Product (GDP)
      The global economy improved significantly in 2017, with an estimated 3.7% growth in global
      GDP, compared to 3.2% in 2016. This growth reflects the improved performance of China and
      other advanced economies since mid-2016, and contributed to an increase in the demand for
      various industrial commodities over the past 18 months.11 Increased activity was observed in
      Canada, with an estimated 3% growth in GDP during 2017, doubling the 2016 figure of 1.5%.
      In China, the worlds’ biggest consumer of commodities, GDP growth was estimated at 6.8%
      in 2017 (Chart 1.1).12

      IMF projections for global GDP growth through 2018 and 2019 are at 3.9% in both years.
      For advanced economies, the IMF projects 2.3% and 2.2% GDP growth for 2018 and 2019,
      respectively. In China, the slowdown in growth rates continues, but at a more moderate
      pace with 6.6% and 6.4% annual growth rates estimated for 2018 and 2019, respectively.

      Chart 1.1: Real GDP Growth (% per Annum) China vs. Advanced Economies vs. the World
                                                                                                                                      World
10%        9.5%
                                                                                                                                      China
9%
                         7.9%                                                                                IMF Forecasts            Advanced
8%                                     7.8%
                                                     7.3%                                                                             Economies
7%                                                                 6.9%          6.7%          6.8%          6.6%          6.4%
6%
5%
        4.3%
                                                                                            3.7%          3.9%          3.9%
4%                    3.5%          3.5%          3.6%          3.4%          3.2%
3%
                                                         2.1%          2.2%                        2.3%          2.3%          2.2%
2%             1.7%                                                                  1.7%
                             1.2%          1.3%
1%
0%
          2011          2012          2013          2014          2015          2016         2017E         2018F         2019F
                                                            Source: IMF                                                                           8
State of Mineral Finance 2018: Gaining Momentum

                        Low Inflation and Interest Rate Environment Supports Demand for Industrial Metals
                        Following the 2008 global financial crisis, and over the last decade, central banks of key
                        economies (e.g. Federal Reserve, European Central Bank (ECB), and the Bank of Japan)
                        have shifted attention from maintaining price levels (i.e. implementing measures against
                        inflation) to steps aimed at spurring growth and preventing the global economy from
                        sinking into a prolonged recession. Despite implementation of such policies, inflation
                        pressures have remained muted in most advanced economies since 2008, which has
                        enabled central banks around the world to keep interest rates at historically low levels
                        (with negative interest rates in some economies) for a prolonged period. Increased global
                        economic activity since mid-2016, combined with historically low interest rates, has
                        resulted in new investments that have supported demand for various industrial metals
                        and consequently, pushed respective prices higher.

                        USD Depreciation in 2017 Supported Higher Commodity Prices
                        A key factor that contributed to the increase in prices of many commodities is the recent
                        depreciation of the USD. Since commodities are generally traded in USD, a negative
                        correlation typically exists between moves in USD and the price of commodities. USD
                        depreciation typically results in a traded commodity becoming less expensive in other
                        currencies, which can spark demand and push the price of the commodity higher.

                        Chart 1.2 shows the monthly average of the USD index against the price of copper (further
                        explanation on the USD index is found in endnote 13).13 The USD index indicates relative
                        USD strength against a weighted average of the U.S. trade partners’ currencies. Previous
                        notable low points for the index (2008 and 2011), corresponded with the last two times
                        that commodity prices peaked. Conversely, increased USD strength from 2011 through
                        2016 coincided with a period of price decline of most commodities. The trend reversed
                        in 2017 with USD depreciation aligning with price increases of most commodities,
                        further reinforcing the inverse relationship. Chart 1.2 exemplifies the negative correlation
                        between the USD index and commodity prices, as they relate to copper.
                                                                                                                           USD Index
                        Chart 1.2: USD Index Against Copper Price (2006-2017)
                                                                                                                           Copper - Monthly
                                                                                                                           Average Price
                                                                                                                           ($/Tonne)
                  105                                                                                                   10,000
                                                                                                                        9,000
                                                                                                                                 Cu Price ($/Tonne)
USD Index Price

                  100
                                                                                                                        8,000

                  95                                                                                                    7,000
                                                                                                                        6,000
                  90                                                                                                    5,000
                                                                                                                        4,000
                  85
                                                                                                                        3,000
                  80                                                                                                    2,000
                        Jan-06
                        Jun-06
                                 Nov-06
                                 Apr-07
                                 Sep-07
                                 Feb-08
                                 Jul-08
                                 Dec-08
                                 May-09
                                 Oct-09
                                 Mar-10
                                 Aug-10
                                 Jan-11
                                 Jun-11
                                 Nov-11
                                 Apr-12
                                 Sep-12
                                 Feb-13
                                  Jul-13
                                 Dec-13
                                 May-14
                                 Oct-14
                                 Mar-15
                                 Aug-15
                                 Jan-16
                                 Jun-16
                                 Nov-16
                                 Apr-17
                                 Sep-17

                                  Sources: www.macrotrends.net, S&P Global Market Intelligence and PDAC analysis

                                                                                                                                                      9
State of Mineral Finance 2018: Gaining Momentum

         Electric Vehicle (EV) Revolution Boosts Prices of Battery-Technology Metals
         Another aspect that significantly supported the price of several metals has been
         expansion of the Electric Vehicle (EV) market. Significant growth of EV production since
         2010 has resulted in increased demand for certain metals, such as cobalt, lithium and
         vanadium, which are essential components of electric batteries and other components of
         EVs. For example, the price of lithium, which ranged from US$4,000-US$5,000 per tonne
         for the bulk of 2011-2015, increased in January 2016 to US$7,250 per tonne, and since
         then has more than doubled to reach US$14,750 in 2017. The increase in cobalt price
         has been even more dramatic with prices increasing from US$24,300 per tonne at the
         beginning of 2016, to US$75,500 at the end of 2017.14

         A Prolonged Commodity Price Decline Reverses in 2016
         From a broad perspective, commodities prices peaked in 2011-2012 after a “super cycle”
         that began in the early 2000s. Following the 2008 global financial crisis, and during the
         recession in Europe and the U.S., demand for commodities was primarily supported by
         the continuous double digit growth of China’s economy. However, China’s growth slowed
         sharply in 2012, leading to a decline in the demand for many commodities until 2016
         when China’s growth outlook improved and expectations for increased infrastructure
         spending in the U.S. led to commodity price appreciation.

         Base Metals
         Chart 1.3 outlines the relative change in the average monthly prices of key base metals
         compared to their peak in 2011.15 It also illustrates improvement in key base metal
         prices after bottoming at different points in time.

         Chart 1.3: Base Metals Price Change (2011-2017)
                                                                                                                                                                                                                                                                   Copper
145%
                                                                                                                                                                                                                                                    129%           Nickel
130%
                                                                                                                                                                                                                                                                   Zinc
115%                                                                                                                                                                                                                                                               Lead
100%
                                                                                                                                                                                                                                                          97%
85%
                                                                                                                                                                                                                                                      69%
70%
                                                                                                                                                                          62%                  62%
55%
                                                                                                                                                                                                                                                      41%
40%                                                                                                                                                                                     45%
                                                                                                                                                                                      29%
25%
       Feb-11
                May-11
                         Aug-11
                                  Nov-11
                                           Feb-12
                                                    May-12
                                                             Aug-12
                                                                      Nov-12
                                                                               Feb-13
                                                                                        May-13
                                                                                                 Aug-13
                                                                                                          Nov-13
                                                                                                                   Feb-14
                                                                                                                            May-14
                                                                                                                                     Aug-14
                                                                                                                                              Nov-14
                                                                                                                                                       Feb-15
                                                                                                                                                                May-15
                                                                                                                                                                         Aug-15
                                                                                                                                                                                  Nov-15
                                                                                                                                                                                           Feb-16
                                                                                                                                                                                                    May-16
                                                                                                                                                                                                             Aug-16
                                                                                                                                                                                                                      Nov-16
                                                                                                                                                                                                                               Feb-17
                                                                                                                                                                                                                                        May-17
                                                                                                                                                                                                                                                 Aug-17
                                                                                                                                                                                                                                                          Nov-17

                                                                 Source: S&P Global Market Intelligence and PDAC analysis

                                                                                                                                                                                                                                                                            10
State of Mineral Finance 2018: Gaining Momentum

         Notable in the chart above is the price increase of zinc, which surpassed its 2011 peak by
         nearly 30%. Also, the price of lead has rebounded nearly to 2011 levels. Copper, despite a
         significant price increase in 2017, is still traded far below its historical peak price. While nickel
         prices have improved from a trough in early 2016, the upswing has been far less pronounced
         versus the group.

         Chart 1.4 provides a closer look at the increase in base metals’ prices through 2016 and 2017.
         There have been significant increases in average monthly prices, from 36% and up to 110%.
         The increase in zinc prices may be partly attributed to a supply deficit caused by a significant
         reduction in zinc concentrate production by major producers over the last two years.

         Chart 1.4: Base Metals Price Change (2016-2017)
220%                                                                                                                                                                                                                                                    Copper
                                                                                                                                                                                                                                       210%
200%                                                                                                                                                                                                                                                    Nickel

180%                                                                                                                                                                                                                                                    Zinc
                                                                                                                                                                                                                                                        Lead
160%                                                                                                                                                                                                                                   153%
                                                                                                                                                                                                                                       152%
140%
                                                                                                                                                                                                                                       136%
120%

100%

 80%
       Jan-16
                 Feb-16
                            Mar-16
                                      Apr-16
                                                May-16
                                                          Jun-16
                                                                    Jul-16
                                                                             Aug-16
                                                                                          Sep-16
                                                                                                    Oct-16
                                                                                                              Nov-16
                                                                                                                       Dec-16
                                                                                                                                Jan-17
                                                                                                                                          Feb-17
                                                                                                                                                    Mar-17
                                                                                                                                                               Apr-17
                                                                                                                                                                         May-17
                                                                                                                                                                                  Jun-17
                                                                                                                                                                                            Jul-17
                                                                                                                                                                                                      Aug-17
                                                                                                                                                                                                               Sep-17
                                                                                                                                                                                                                            Oct-17
                                                                                                                                                                                                                                      Nov-17
                                                                                                                                                                                                                                               Dec-17
                                                                   Source: S&P Global Market Intelligence and PDAC analysis

         Precious Metals
         From a peak in late 2011 through to 2015, prices of precious metals declined sharply with
         gold, platinum and silver dropping some 40%, 51% and 63%, respectively. As can be seen
         in Chart 1.5, although precious metal prices have shown some improvement from 2015
         levels, none have approached peaks reached in 2011.

         Chart 1.5: Precious Metals Price Change (2011-2017)
110%                                                                                                                                                                                                                                                    Gold
100%                                                                                                                                                                                                                                                    Silver
 90%
                                                                                                                                                                                                                                                        Platinum
80%                                                                                                                                                                                                                                      71%
70%
60%                                                                                                                                                                     60%                                                              52%
50%
                                                                                                                                                                        49%
40%                                                                                                                                                                                                                                      42%
                                                                                                                                                                               37%
30%
       Sep-11
                Dec-11
                          Mar-12
                                   Jun-12
                                            Sept-12
                                                      Dec-11
                                                               Mar-13
                                                                        Jun-13
                                                                                 Sep-13
                                                                                           Dec-13
                                                                                                     Mar-14
                                                                                                              Jun-14
                                                                                                                       Sep-14
                                                                                                                                Dec-14
                                                                                                                                         Mar-15
                                                                                                                                                   Jun-15
                                                                                                                                                             Sep-15
                                                                                                                                                                      Dec-15
                                                                                                                                                                               Mar-16
                                                                                                                                                                                        Jun-16
                                                                                                                                                                                                 Sep-16
                                                                                                                                                                                                          Dec-16
                                                                                                                                                                                                                   Mar-17
                                                                                                                                                                                                                             Jun-17
                                                                                                                                                                                                                                      Sep-17
                                                                                                                                                                                                                                               Dec-17

                                                                   Source: S&P Global Market Intelligence and PDAC analysis
                                                                                                                                                                                                                                                                   11
State of Mineral Finance 2018: Gaining Momentum

        Chart 1.6 focuses on the change in average monthly prices of precious metals since 2015’s
        bottom.

        Chart 1.6: Base Metals Price Change (2016-2017)
145%
                                                                                                                                                                                                                               Gold
140%
                                                                                                                                                                                                                               Silver
135%
130%                                                                                                                                                                                                                           Platinum
125%
120%                                                                                                                                                                                                           116%
115%                                                                                                                                                                                                           115%
110%
105%                                                                                                                                                                                                          106%
100%
       Jan-16
                Feb-16
                         Mar-16
                                  Apr-16
                                           May-16
                                                    Jun-16
                                                             Jul-16
                                                                      Aug-16
                                                                               Sep-16
                                                                                        Oct-16
                                                                                                 Nov-16
                                                                                                          Dec-16
                                                                                                                   Jan-17
                                                                                                                            Feb-17
                                                                                                                                     Mar-17
                                                                                                                                              Apr-17
                                                                                                                                                       May-17
                                                                                                                                                                Jun-17
                                                                                                                                                                         Jul-17
                                                                                                                                                                                  Aug-17
                                                                                                                                                                                           Sep-17
                                                                                                                                                                                                    Oct-17
                                                                                                                                                                                                             Nov-17
                                                                                                                                                                                                                      Dec-17
                                                         Source: S&P Global Market Intelligence and PDAC analysis

        Through 2016-2017, prices of gold and silver increased by 16% and 15%, respectively,
        while platinum saw a more modest price increase of only 6%. Precious metal prices
        appear to have broadly followed a seasonal pattern through 2016-2017 with price
        appreciation occurring more prominently through the first half of each year versus
        the second half. Short-term price spikes for gold and silver, in particular, have largely
        coincided with recent interest rate decisions by the U.S. Federal Reserve, which
        highlights the relationship between gold/silver prices with inflationary pressures on
        global currencies and specifically the USD.

        While gold and silver prices are typically impacted by aspects related to currencies,
        platinum is impacted mostly by industrial factors. The main use of platinum is as a
        catalyst in diesel engines. Increased manufacturing focus on electric vehicles in the
        coming years is projected, which could have a negative impact on diesel vehicle demand
        and, in turn, result in reduced overall demand for platinum.

        While there are many factors that influence and impact investment in mineral
        exploration and mining, prices of commodities is a key one. Therefore, broad-based
        commodity price appreciation over the last two years should expand investors’ appetite
        for investment in the mineral industry and positively impact the financing landscape of
        the sector as a whole.

                                                                                                                                                                                                                                          12
State of Mineral Finance 2018: Gaining Momentum

                     SECTION 2: Financing Trends
                     This section will cover several dynamics related to financing trends for the mineral
                     industry. First, global and domestic trends for financing in the mineral sector will be
                     presented. The remainder of the section will focus on financings undertaken by the junior
                     mining sector in Canada.16

                     Global Financing Trends Show Signs of Recovery
                     Global mineral industry financing declined from a peak in 2012 to bottom in 2016 as can
                     be seen in Chart 2.1. In 2016, financing for the sector constituted only 44% of the 2012
                     value. In comparison, 2017 marked a year of recovery as total financings for the global
                     mineral sector increased by over 60% compared to 2016.

                     Chart 2.1: Financing for the Global Mineral Industry (US$B)
               140                                                                                                       Equity

               120                                                                                                       Debt

               100
US$ Billions

                          65.7         99.4
               80                                                                                           66.1
                                                     94.9           65.8
               60                                                                   56.2

               40                                                                                    32.2

                          53.7
               20                      33.9                          37.2          29.3              26.8   29.2
                                                     24.2
                0
                          2011         2012          2013           2014           2015              2016   2017
                                          Source: S&P Global Market Intelligence and PDAC analysis

                     Notable in Chart 2.1 above is a distinct difference between the rebound of debt and equity
                     financing. Equity financing, which accounts for on average roughly 35% of the funds
                     raised globally, declined the most in 2013 but has subsequently improved modestly and
                     essentially flattened out over the last three years. Debt financing declined sharply in 2016
                     only to increase significantly in 2017, doubling its value compared to 2016. It is important
                     to note that debt financing is not a typical fundraising option for non-revenue generating
                     companies such as mineral exploration companies.

                     Chart 2.2 provides a sense of Canada’s leading role in equity financing for the mineral
                     industry. Funds raised from 2011-2017 on Canada’s two key stock exchanges, the TSX and
                     TSX Venture (TSXV), accounted on average for 19% of the total equity raised globally.

                                                                                                                                   13
State of Mineral Finance 2018: Gaining Momentum

                     Chart 2.2: Equity Financing for the Global Mineral Industry (US$B)
               60                                                                                                                                                                                                                 Canada
                                                                                                                                                                                                                                  Rest of
               50                                                                                                                                                                                                                 the World

               40
US$ Billions

               30               45.4

               20                                                                                                   30.9
                                                           27.2                                                                                                                                             24.6
                                                                                                                                                 24.3                         20.5
                                                                                         18.6
                10
                                8.3                            6.8                        5.6                         6.3                                                      6.3
                                                                                                                                                  5.0                                                       4.6
                0
                            2011                         2012                          2013                         2014                        2015                          2016                          2017
                                                                     Source: S&P Global Market Intelligence and PDAC analysis

                     Chart 2.2 above also illustrates the 25% year-over-year increase in equity financing
                     on Canadian stock exchanges in 2015-2016. However, globally there was a decline of
                     8.5% over the same period. Fluctuations continued in 2017 with equity capital raised on
                     Canadian stock exchanges declining 27% to US$4.6 billion, whereas the level of global
                     equity financing increasing 9% compared to 2016.

                     The Financing Landscape in Canada
                     In the last quarter of 2016, the number of mineral industry issuers on the TSX and TSXV
                     (combined) reached its lowest point with only 1,206 companies listed as compared to
                     1,665 in the first quarter of 2013. Throughout 2017, the number of listings continued
                     to hover above 1,200, as illustrated in Chart 2.3. Roughly 80% of the issuers listed on
                     Canadian stock exchanges are listed on the TSXV and 20% on the TSX—a ratio that has
                     remained relatively stable during the period outlined in Chart 2.3.

                     Chart 2.3: Number of Listed Mineral Industry Issuers (TSX & TSXV)
        1,800                                                                                                                                                                                                                     TSXV
        1,600                                                                                                                                                                                                                     TSX

        1,400                                                                                                                                                                                                                   Source:
                                                                                                                                                                                                                                TMX Group17
        1,200

        1,000

               600

               400

               200

                 –
                      Q1-2013

                                 Q2-2013

                                           Q3-2013

                                                     Q4-2013

                                                                Q1-2014

                                                                          Q2-2014

                                                                                    Q3-2014

                                                                                              Q4-2014

                                                                                                        Q1-2015

                                                                                                                  Q2-2015

                                                                                                                            Q3-2015

                                                                                                                                      Q4-2015

                                                                                                                                                Q1-2016

                                                                                                                                                          Q2-2016

                                                                                                                                                                    Q3-2016

                                                                                                                                                                              Q4-2016

                                                                                                                                                                                        Q1-2017

                                                                                                                                                                                                  Q2-2017

                                                                                                                                                                                                            Q3-2017

                                                                                                                                                                                                                      Q4-2017

                                                                                                                                                                                                                                              14
State of Mineral Finance 2018: Gaining Momentum

                   Looking at each exchange separately, from 2013-2016 the number of mineral exploration
                   and mining issuers on the TSX decreased over 37%, while TSXV saw a decrease of
                   approximately 25% over the same period (Table 2.1).

                   Table 2.1: Number of Exploration and Mining Issuers in TSX & TSXV

                                                                                                                                                 TSXV                                              TSX                                              TSX+TSXV
                     Q1–2013: # of issuers                                                                                                           1,308                                             357                                                     1,665
                     Q4-2016: # of issuers                                                                                                            987                                              224                                                         1,211
                     Decrease in # of issuers                                                                                                        (321)                                         (133)                                                           (454)
                     % of decrease                                                                                                              (24.5%)                                          (37.3%)                                                      (27.3%)
                                                                                                                                     Source: TMX Group

                   The aggregate market capitalization of mineral exploration and mining issuers on the TSX
                   and TSXV reached a low point towards the end of 2015 and has since improved, as Chart
                   2.4 demonstrates. Rising commodity prices and an improvement in financing in 2016-17
                   have pushed the aggregate market capitalization of mineral exploration and mining
                   equities on the TSX and TSXV to exceed $300 billion at the end of 2017, approximately
                   10% share of a total market capitalization (for all industries) of $3 trillion.

                   Chart 2.4: Aggregate Market Capitalization of Exploration and Mining
                   Listed Issuers (TSX & TSXV)
                                                                                                                                                                                                                                                                                                           TSXV
             600                                                                                                                                                                                                                                                                                           TSX

             500
$ Billions

             400

             300

             200

             100

               –
                   Q1-2011
                             Q2-2011
                                       Q3-2011
                                                 Q4-2011
                                                           Q1-2012
                                                                     Q2-2012
                                                                               Q3-2012
                                                                                         Q4-2012
                                                                                                   Q1-2013
                                                                                                             Q2-2013
                                                                                                                       Q3-2013
                                                                                                                                 Q4-2013
                                                                                                                                           Q1-2014
                                                                                                                                                     Q2-2014
                                                                                                                                                               Q3-2014
                                                                                                                                                                         Q4-2014
                                                                                                                                                                                   Q1-2015
                                                                                                                                                                                             Q2-2015
                                                                                                                                                                                                       Q3-2015
                                                                                                                                                                                                                 Q4-2015
                                                                                                                                                                                                                           Q1-2016
                                                                                                                                                                                                                                     Q2-2016
                                                                                                                                                                                                                                               Q3-2016
                                                                                                                                                                                                                                                         Q4-2016
                                                                                                                                                                                                                                                                   Q1-2017
                                                                                                                                                                                                                                                                             Q2-2017
                                                                                                                                                                                                                                                                                       Q3-2017
                                                                                                                                                                                                                                                                                                 Q4-2017

                                                                                                                                     Source: TMX Group

                   In Canada, the aggregate value of total financing for the mineral sector (debt and equity
                   combined) increased significantly in 2016, but improved only slightly in 2017. Total funds
                   raised on the two key Canadian stock exchanges (TSX and TSXV combined) increased by
                   83% from 2015-2017.

                                                                                                                                                                                                                                                                                                                  15
State of Mineral Finance 2018: Gaining Momentum

                  As can be seen in Chart 2.5, the relative increase in financing on the TSXV was much
                  more prominent than on the TSX (237% in TSXV versus 64% on the TSX from 2015-2017).
                  In absolute dollar terms, 2017 financing on the TSXV approached the level reached
                  in 2011, which may indicate increased investor appetite for earlier-stage exploration
                  companies. It is worth noting that the aggregate data may be skewed due to a number of
                  large transactions—out of 215 transactions recorded on the TSX in 2017, the largest 20
                  transactions (or 9% of recorded transactions) accounted for 77% of the total funds raised.

                  Chart 2.5: Financing for the Mineral Sector on Canadian Stock Exchanges
                  (TSX vs. TSXV)
                                                                                                                            TSXV
             18
             16                                                                                                             TSX
                                     1.5                             1.1
             14
                       3.1                            1.0
             12
$ Billions

                                                                                                      2.1      2.6
             10
              8                                                     15.0
                                    14.1              12.6                          0.8
              6       10.8                                                                            9.9      10.0
              4
                                                                                    6.1
              2
              0
                      2011          2012             2013           2014           2015           2016         2017

                                       Source: S&P Global Market Intelligence and PDAC analysis

                  In terms of financing in Canada by funding type (equity vs. debt), Chart 2.6 illustrates that
                  over the last two years debt financing on TSX and TSXV expanded significantly compared
                  to 2015. Debt financing is typically used for funding of larger, late-stage developments
                  rather than early stage exploration. As such, improvement in debt financing is likely less
                  relevant for mineral exploration companies that typically rely on equity financing. Equity
                  financing increased in 2016 to match 2011 investment but declined again in 2017 to sub-
                  2015 levels. Note that the $6 billion of equity financing raised in Canada is presented in
                  Chart 2.6 in Canadian Dollars, and is approximately equivalent to the US$4.6 billion, a
                  figure which was presented in USD to enable global comparisons.

                  Chart 2.6: Financing for the Mineral Sector on Canadian Stock Exchanges
                  (Debt vs. Equity)

             18                                                                                                             Equity
             16                                                                                                             Debt
             14
             12
$ Billions

                       5.7          8.9                              9.2
             10                                       7.8                                             3.7
                                                                                                                6.6
              8
              6                                                                     0.5
              4                                                                                       8.3       6.0
                       8.2          6.8               5.8            6.9            6.3
              2
              0
                      2011          2012             2013           2014           2015           2016         2017
                                           Source: S&P Global Market Intelligence and PDAC analysis

                                                                                                                                       16
State of Mineral Finance 2018: Gaining Momentum

                   The Junior Sector in Canada
                   While many mineral sector companies are able to raise equity capital through public
                   offerings on financial markets, junior mining companies typically raise money via private
                   placements. In this light, understanding trends in private placement financings can
                   provide insight into the health of the junior market segment.

                   The data in this section shows private placement financings by junior mineral industry
                   companies (“juniors”). For the purposes of the financial indicators illustrated in this
                   section, Oreninc’s definition of a junior mining company has been applied (i.e. only private
                   placement transactions of less than $100 million, and only of companies with market
                   capitalization below $1.5 billion).

                   Financial markets for mineral companies showed marked improvement in 2016-2017
                   compared to the previous three years, particularly amongst the smaller exchanges such
                   as the TSXV and Canadian Securities Exchange (CSE), as can be seen in Chart 2.7.

                   Chart 2.7: Aggregate Value of Juniors' Financing by Exchange
                                                                                                                                      CSE
                                 4.9
             5.0
                                                                                                                                      TSX
             4.5
                                                                                                                                      TSX-V
             4.0
             3.5           3.3                                                                                                  3.1
             3.0                                                                                             2.6
$ Billions

             2.5                          2.3 2.3
                                                                                                       2.1
             2.0                                                         1.6 1.6
             1.5                                                                      1.3 1.1                             1.4
                                                       1.2 1.1
             1.0
             0.5                                                                                                   0.12
                    0.03               0.04         0.01          0.02             0.02         0.05
             0.0
                       2011               2012         2013           2014            2015         2016               2017
                                                                 Source: Oreninc

                   From Chart 2.7 we see TSXV equity raises by junior mining/exploration companies in 2017
                   increased by 18.2% to $3.1 billion from $2.7 billion in 2016, while the CSE saw 122.6%
                   growth in financings to $118.3 million. Despite greater activity in smaller exchanges, there
                   was less activity on the main exchange as the value of financing on the TSX fell 31.9% to
                   $1.4 billion from $2.1 billion in 2016. With respect to junior mining companies, TSX and
                   TSXV financings have yet to return to the 2011 levels, when junior companies listed on
                   these exchanges raised $3.2 billion on the TSX and $5.0 billion on the TSXV.

                   In 2017, financings on the TSX and TSXV exchanges in terms of both total number of
                   deals and aggregate value were more prominent in the first and fourth quarters with less
                   activity during the middle two periods of the year. That said, activity on the TSXV was
                   more evenly spread throughout the year compared to TSX transactions (See quarterly
                   results on Chart 2.8).

                                                                                                                                              17
State of Mineral Finance 2018: Gaining Momentum

                     Chart 2.8: Aggregate Value of Financing for Juniors by Exchange (Quarterly)
                                                                                                                                                                                                                                                                                                                   CSE
                                                                                                                                                                                                                                                                                                                   TSX
             1,800
                                                                                                                                                                                                                                                                                                                   TSX-V
             1,600
             1,400
             1,200
$ Millions

             1,000
              800
              600
              400
              200
                0
                     Q1-2011
                               Q2-2011
                                         Q3-2011
                                                   Q4-2011
                                                             Q1-2012
                                                                       Q2-2012
                                                                                 Q3-2012
                                                                                           Q4-2012
                                                                                                     Q1-2013
                                                                                                               Q2-2013
                                                                                                                         Q3-2013
                                                                                                                                    Q4-2013
                                                                                                                                               Q1-2014
                                                                                                                                                          Q2-2014
                                                                                                                                                                     Q3-2014
                                                                                                                                                                               Q4-2014
                                                                                                                                                                                         Q1-2015
                                                                                                                                                                                                   Q2-2015
                                                                                                                                                                                                             Q3-2015
                                                                                                                                                                                                                       Q4-2015
                                                                                                                                                                                                                                 Q1-2016
                                                                                                                                                                                                                                           Q2-2016
                                                                                                                                                                                                                                                     Q3-2016
                                                                                                                                                                                                                                                               Q4-2016
                                                                                                                                                                                                                                                                         Q1-2017
                                                                                                                                                                                                                                                                                   Q2-2017
                                                                                                                                                                                                                                                                                             Q3-2017
                                                                                                                                                                                                                                                                                                       Q4-2017
                                                                                                                                          Source: Oreninc

                     Chart 2.9 outlines the number of transactions completed by junior companies by exchange
                     on a quarterly basis. The 1,129 TSXV transactions completed in 2017 represents a
                     6.5% decline relative to 1,207 in 2016 and remained well below the 1,371 transactions
                     completed in 2011. In 2017 there were 150 transactions on the TSX, which was down
                     24.2% from the 198 in 2016. The CSE saw 74 transactions in 2017, up 2.8% over 2016.

                     Chart 2.9: Number of Completed Junior Transactions by Exchange (Quarterly)
                                                                                                                                                                                                                                                                                                                   CSE
              450
                                                                                                                                                                                                                                                                                                                   TSX
              400
              350                                                                                                                                                                                                                                                                                                  TSX-V

              300
              250
              200
              150
              100
               50
                0
                     Q1-2011
                               Q2-2011
                                         Q3-2011
                                                   Q4-2011
                                                             Q1-2012
                                                                       Q2-2012
                                                                                 Q3-2012
                                                                                           Q4-2012
                                                                                                     Q1-2013
                                                                                                               Q2-2013
                                                                                                                          Q3-2013
                                                                                                                                     Q4-2013
                                                                                                                                                Q1-2014
                                                                                                                                                           Q2-2014
                                                                                                                                                                      Q3-2014
                                                                                                                                                                                Q4-2014
                                                                                                                                                                                          Q1-2015
                                                                                                                                                                                                    Q2-2015
                                                                                                                                                                                                              Q3-2015
                                                                                                                                                                                                                        Q4-2015
                                                                                                                                                                                                                                  Q1-2016
                                                                                                                                                                                                                                             Q2-2016
                                                                                                                                                                                                                                                       Q3-2016
                                                                                                                                                                                                                                                                 Q4-2016
                                                                                                                                                                                                                                                                           Q1-2017
                                                                                                                                                                                                                                                                                     Q2-2017
                                                                                                                                                                                                                                                                                               Q3-2017
                                                                                                                                                                                                                                                                                                         Q4-2017

                                                                                                                                              Source: Oreninc

                     The average amount per transaction on the TSXV increased to $2.8 million in 2017, a 26.3%
                     increase over the $2.2 million average in 2016, yet it remained below the 2011 average of
                     $3.6 million. The TSX recorded a decline of 10.3% in the average amount per transaction—

                                                                                                                                                                                                                                                                                                                           18
State of Mineral Finance 2018: Gaining Momentum

                   from $10.7 million in 2016 to $9.6 million in 2017. The CSE continued to show growth with
                   an average transaction amount of $1.6 million in 2017, up 114.5% from $745,000 in 2016.
                   Chart 2.10 shows the average transaction value both quarterly and annually.

                   Chart 2.10: Average Dollar Amount of Transactions by Exchange
                                                                                                                                                    CSE
             25                                                                                                                                     TSX
                                                                                                                                                    TSX-V
             20
$ Millions

             15

             10

              5

              0
                   2011
                     Q1
                     Q2
                     Q3
                     Q4
                   2012
                     Q1
                     Q2
                     Q3
                     Q4
                   2013
                     Q1
                     Q2
                     Q3
                     Q4
                   2014
                     Q1
                     Q2
                     Q3
                     Q4
                   2015
                     Q1
                     Q2
                     Q3
                     Q4
                   2016
                     Q1
                     Q2
                     Q3
                     Q4
                   2017
                     Q1
                     Q2
                     Q3
                     Q4
                                                                          Source: Oreninc

                   Chart 2.11 compares the aggregate value of non-brokered and brokered best-efforts
                   transactions to bought-deal transactions in the junior mining sector (refer to Endnote 18
                   for a brief exploration on bought-deal vs. best efforts).18

                   Chart 2.11: Aggregate Value-Brokered vs Non-Brokered Transactions
                                                                                                                                                    Non-Brokered
                                                                                                                                                    Best Efforts
             3.5
                                3.2
                                                                                                                                                    Brokered
             3.0                                                                                                                                    Best Efforts

             2.5    2.4                                                                                                                             Bought
                          2.3                                                                                                                       Deals
                                                                                                                2.1
$ Billions

             2.0                                                                                                                  1.8
                                      1.7         1.6
                                                                            1.4                                                               1.5
             1.5                            1.3                                                                             1.4
                                                        1.1                                   1.2
                                                                                        1.0
             1.0                                                                                                      0.8
                                                                    0.6                                   0.7                           0.6
                                                              0.5                 0.5
             0.5
                                                                                                    0.1
              0
                      2011              2012              2013                2014              2015              2016              2017
                                                                          Source: Oreninc

                   Bought-deal transactions represented 39% of all funds raised on Canadian stock
                   exchanges in 2017, up from 33% of the funds raised in 2016. Conversely, funds raised via
                   brokered and non-brokered best-efforts transactions decreased in 2017. Given bought-
                   deal financing can inherently expose underwriters to greater financial risk, the more than
                   two-fold increase in bought-deal financing value from 2015 to 2017 may indicate mineral
                   sector investment is stabilizing.

                                                                                                                                                               19
State of Mineral Finance 2018: Gaining Momentum

                    Chart 2.12 outlines the number of transactions by type, and reflects a similar profile to
                    financing figures displayed in Chart 2.11. The number of bought-deal transactions increased
                    34.4% to 86 in 2017 from 64 in 2016. The number of best-efforts brokered and non-
                    brokered transactions in 2017 declined year-over-year by 11.5% and 11.3%, respectively.

                    Chart 2.12: Number of Transactions-Brokered vs Non-Brokered
                                                                                                                                                                                        Non-Brokered
             1400                                                                                                                                                                       Best Efforts
                                                                                                                                            1,232
             1200   1,105                1,152                                                                                                                                          Brokered
                                                                                                                                                               1,093
                                                                  979                                                                                                                   Best Efforts
             1000                                                                            931
                                                                                                                        839                                                             Bought
             800                                                                                                                                                                        Deals
             600
             400           306
                                             256
             200                130                                      102                        88 59                                       96 64
                                                        79                     41                                             41 34                                          85 86
                0
                          2011               2012                        2013                      2014                   2015                  2016                         2017
                                                                                          Source: Oreninc

                    Compared to 2011, the number of non-brokered best-efforts transactions for the subsequent
                    six-year period was relatively stable, while brokered best-efforts transactions and bought-deal
                    transactions declined significantly and remain well below the levels reached in 2011.

                    Investors’ appetite for Canadian project spending seemed to improve in 2017 compared to the
                    previous year as aggregate funds raised intended for domestic project expenditures increased
                    14.4% to $1.025 billion, up from $896 million in 2016. Saskatchewan, British Columbia, Manitoba,
                    Nova Scotia and Nunavut saw significant growth in terms of funds raised, while Ontario, Alberta,
                    Yukon and Newfoundland and Labrador saw significant decreases, as seen in Chart 2.13.19

                    Chart 2.13: Amount of Funds Raised for Projects by Province
                                                                                                                                                                                        2016
             300                                                                                                                                291
                                                                                                                                                  265                                   2017
             250
                                   208
             200                                                                                                                                               194
$ Millions

                                                                                                                          159 162
                                 149
              150

             100                                                                                                        80               84                                    87
                                                                          53
              50                                                            30                                                                                                   30
                     21                                                                    15 16              15                                             23
                          8                  5 9             8 8                                         3
               0
                      Alberta

                                   British
                                 Columbia

                                             Manitoba

                                                                  New
                                                             Brunswick

                                                                          Newfoundland
                                                                           and Labrador

                                                                                           Northwest
                                                                                           Territories

                                                                                                          Nova Scotia

                                                                                                                         Nunavut

                                                                                                                                      Ontario

                                                                                                                                                    Quebec

                                                                                                                                                              Saskatchewan

                                                                                                                                                                                Yukon

                                                                                          Source: Oreninc
                                                                                                                                                                                                   20
State of Mineral Finance 2018: Gaining Momentum

                    The next three charts examine funds raised by junior mining companies on Canadian
                    exchanges, based on commodity grouping:
                       ► Precious metals: gold, silver and platinum
                       ► Base metals: copper, tin and zinc
                       ► Battery metals: cobalt, graphite, lithium and vanadium

                    Financing for battery-technology metal projects grew by 200% in 2017 to $741.6 million,
                    as compared to $247.3 million in 2016. The 2017 figure represents some 13.9% of total
                    funds raised, compared to only 4.5% in 2016. Financing for precious metals decreased from
                    $4.1 billion in 2016 to $3.6 billion in 2017. Financing for base metals’ projects also dropped
                    from $1.1 billion in 2016 to $981 million in 2017. As can be seen in Chart 2.14, the value
                    of financing for both precious and base metals in 2017 was far below 2011 levels, while
                    financing for battery-technology metals in 2017 far exceeded the 2011 level.

                    Chart 2.14: Amount of Funds Raised by Commodity Grouping
                                                                                                                                                   Precious Metals
              6.0    5.9
                                                                                                                                                   Base Metals
              5.0                                                                                                                                  Battery Metals
                                                                                                              4.1
              4.0                      3.7                                                                                       3.6            Source: Oreninc
$ Billions

              3.0
                                                                         2.3
                           2.1                                                             1.9
              2.0                                       1.7
                                             1.0                                                                    1.1             1.0
              1.0                                                              0.6                                                        0.7
                                 0.3                      0.5                                    0.4
                                               0.2              0.1                  0.2               0.2                0.2
              0.0
                        2011             2012             2013             2014              2015               2016               2017

                    The expansion of total financing value for battery-technology metals is also reflected in the
                    number of transactions, as outlined in Chart 2.15. In 2017 there were 163 battery-technology
                    metal transactions representing 10.3% of all transactions, which is up significantly from 99
                    in 2016 (5.5% of all transactions). Precious metals transactions fell 16.1% year-over-year to
                    1,030 in 2017 while base metal transactions fell 12.2% to 396 over the same period.

                    Chart 2.15: Number of Transactions by Commodity Grouping
                                                                                                                                                   Precious Metals
             1400    1,294             1,249                                                                 1,227                                 Base Metals
             1200
                                                                                                                                1,030              Battery Metals
             1000                                       945              934
             800                                                                           767
                                                                                                                                                Source: Oreninc
             600
                           436               423                                                                    451            396
             400                                              316          354
                                                                                             290
             200                                                                                                                        163
                                                   56               73               84                64                 99
                                 36
               0
                        2011             2012             2013             2014              2015               2016               2017

                                                                                                                                                                  21
State of Mineral Finance 2018: Gaining Momentum

                 Furthermore, Chart 2.16 illustrates a near doubling in the average transaction amount
                 of battery-technology metals’ financing in 2017 to $3.8 million from $1.9 million in 2016.
                 The average precious metals and base metals transaction amounts also increased
                 over the same period, but at a more modest rate of 18.6% and 9.0%, respectively. That
                 said, notable is the average amount per transaction for all the types of metals in 2017
                 remained well below 2011 levels.

                 Chart 2.16: Average Amount per Transaction by Commodity Grouping
                                                                                                                                                  Precious Metals
             7             6.8
                                                                                                                                                  Base Metals
             6                                                                                                                                    Battery Metals

             5           4.8
                   4.3
$ Millions

             4                                                                                                                              3.8
                                                                                                                                3.5
                                                                                                              3.0
             3                       2.7                                                                                              2.6
                                           2.3 2.2                       2.2               2.4                      2.4
                                                        1.8                          2.0               1.8                1.9
             2                                                1.6 1.5          1.6               1.6
             1

             0
                     2011              2012                 2013            2014             2015                2016                 2017

                                                                        Source: Oreninc

                 Chart 2.17 shows the distribution of financings done in 2017 based on the specific
                 targeted commodity. It shows that 72% of funds raised in 2017 targeted five key
                 commodities. Gold leads the list by far at 51%, followed by copper, silver, uranium and
                 lithium at 8.3%, 5.3%, 4.2% and 3.2%, respectively.

                 Chart 2.17: Financing of Juniors by Commodity Type (2017)

                                                                                                                                  Gold
                                           1.4%               21.4%
                                                                                                                                  Copper
                                    1.6%
                                                                                                                                  Silver
                                  2.1%
                                 2.1%                                                                                             Uranium
                                           2.3%                                                                                   Lithium
                                           3.0%                                                              51.0%                Precious Metals
                                            3.0%                                                                                  Diversified
                                             3.2%                                                                                 Iron Ore
                                                     4.2%                                                                         Potash
                                                            5.3%                                                                  Diamond
                                                                        8.3%                                                      Zinc
                                                                                                                                  Nickel
                                                                                                                                  Other
                                                                        Source: Oreninc

                                                                                                                                                             22
State of Mineral Finance 2018: Gaining Momentum

                   Chart 2.18 below shows the distribution of total funds raised by company market
                   capitalization between 2011 and 2017, based on Oreninc transaction tracking of financings
                   of less than $100 million by companies with market capitalization of up to $1.5 billion.

                   Chart 2.18: Junior Fundraising Distribution by Market Capitalization
                                                             3.01%

                                                                          11.65%

                                                                                                       $1.0B < Market Cap < $1.5B
                                    48.14%                                                             $0.5B < Market Cap < $1.0B
                                                                                                       $0.1B < Market Cap < $0.5B
                                                                                    37.20%
                                                                                                       Market Cap < $0.1B

                                                        Source: Oreninc

                   As outlined above, nearly half of the funds raised were by companies with a sub-$100 million
                   market capitalization, while less than 15% of the funds were raised by companies with
                   market capitalization above $500 million. One possible explanation for this dynamic is that
                   larger companies tend to target transactions in excess of the $100 million threshold, and
                   therefore do not appear in the Oreninc database.

                   Chart 2.19 profiles the value of the funds raised by market capitalization range from 2011-2017.
                   It can be seen from the chart that financing flows for all market ranges declined materially
                   from 2011-2015 but subsequently have improved. That said, 2017 figures show a moderate
                   year-over-year decline in financings and overall levels remain well below the 2011 peak.

                   Chart 2.19: Financing for Juniors, Grouped by Market Capitalization
             9.0                                                                                                         $1.0B
                       0.2                                                                                               < Market Cap
             8.0                                                                                                         < $1.5B
                        1.2
             7.0                                                                                                         $0.5B
                                                                                                                         < Market Cap
             6.0                                                                                                         < $1.0B
$ Billions

                        3.2
             5.0                     0.2                                                      0.1          0.2           $0.1B
                                                                                              0.6                        < Market Cap
                                     0.3                                                                   0.5
             4.0                                                                                                         < $0.5B
                                     2.0                          0.0                          1.7
             3.0                                                  0.5                                      1.6           Market Cap
                                                  0.0                              0.1                                   < $0.1B
             2.0                                  0.2             1.2              0.3
                        3.6
                                                  0.7                              0.9
                                     2.2                                                      2.4          2.3
             1.0                                                  1.1
                                                  1.3
                                                                                   1.1
             0.0
                       2011         2012         2013            2014              2015       2016        2017
                                                            Source: Oreninc                                                         23
State of Mineral Finance 2018: Gaining Momentum

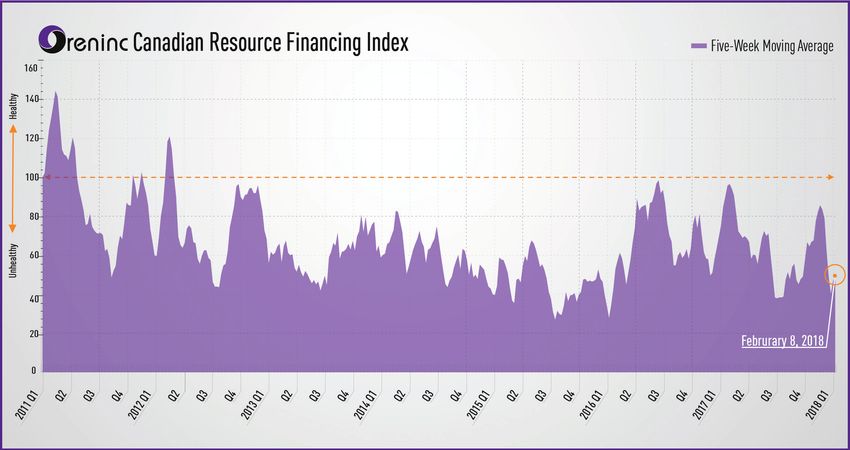
Oreninc Index indicates a limited improvement of the Junior Sector in 2016-17
The Oreninc Index, a proprietary tool, was created and launched when Oreninc was
formed in January 2011. The Index is intended to measure the overall health of the junior
mining sector in terms of financing activity.
The weighted index measures three factors on a weekly basis:
   ► Broker participation
   ► Total number of transactions opened
   ► Total amount of funds raised

The score that is calculated indicates the overall health of the Canadian junior mining
sector.

While total amount of funds raised and the number of transactions opened increased
significantly in 2016-17 compared to previous years, broker participation was still low
(with some increase in 2017). As a result, the index did not peak above the 100 point
mark—the level of the index when it was created in January 2011 (Chart 2.20). This
reflects the fact that the junior mining sector is still not as healthy as it was in 2011.

Chart 2.20: Oreninc Index

                                        Source: Oreninc

One unique data point that Oreninc collects is the location of both the company
headquarters and project sites. This information, as well as the companies’ stated
intent for the use of the funds, allows tracking of flow of funds raised on Canadian stock
exchanges to different regions in Canada and around the world.

Table 2.2 illustrates the number of transactions and the dollar flow from Canadian stock
exchanges to different world regions. The table shows that while approximately 40% of
funds went for Canadian projects, roughly 60% of funds raised in Canada went abroad,
with South America and the U.S. as key destinations in 2017.

                                                                                                        24
State of Mineral Finance 2018: Gaining Momentum

Table 2.2: The Flow of Funds to Canada and Abroad

                                   2016                                       2017
                                    Funds
                     Number of                     % of        Number of       Funds
        Region                      Raised                                                 % of total
                    transactions                   total      transactions   Raised ($M)
                                     ($M)
 Africa                  98          608           13.2%          65            241          5.3%
 Asia                    21          88            1.9%           16             35          0.8%
 Australia               7           37            0.8%            6             65          1.4%
 Canada                 859         1,773          38.4%          702           1,911       42.2%
 Caribbean               5            8            0.2%            5             27          0.6%
 Europe                  40          62            1.3%           42            214          4.7%
 Mexico &                92          363           7.8%           64            363          8.0%
 Central America
 Oceania                 10          92            2.0%           11             34          0.7%
 South America          134          968           20.9%          141           1,081       23.9%
 United States          178          622           13.5%          177           554         12.3%
 Total                  1,444       4,620          100%          1,229         4,525         100%

                                            Source: Oreninc

Table 2.3 lists the Top 10 financings that closed in 2017 for the junior mining sector.

Table 2.3: 2017 Top 10 Financing Transactions in the Junior Mining Sector

             Company                        Commodity                    Funds Raised ($M)
 Encanto Potash Corp.                          Potash                              100
 Fortuna Silver Mines Inc.                      Silver                                98
 Cobalt 27 Capital Corp.                       Cobalt                              97.8
 Bluestone Resources Inc.                      Copper                                 80
 Solgold PLC                                    Gold                               75.6
 NexGen Energy Ltd.                           Uranium                              65.2
 JDL Gold Corp.                                 Gold                               63.4
 MAG Silver Corp.                               Silver                             61.6
 McEwen Mining Inc.                             Gold                               57.3
 Novo Resources Corp.                           Gold                                  56

                                            Source: Oreninc

                                                                                                                25
State of Mineral Finance 2018: Gaining Momentum

                    SECTION 3: Exploration Trends
                    In the previous section, financing for the mineral industry was examined with a focus
                    on the junior sector. This section will describe and analyse non-ferrous exploration
                    expenditures by mineral exploration and mining companies, beginning with a brief
                    presentation of financing specifically for mineral exploration.

                    Financing for Mineral Exploration Begins to Rebound
                    Global financing explicitly for mineral exploration declined steeply from 2012-2015 but
                    has since showed significant improvement, increasing 64% and 85% year over year in
                    2016 and 2017, respectively. It should be noted that the dramatic year-over-year increase
                    in 2014 was impacted by three outlier transactions, which were classified as exploration/
                    development financings and accounted for US$3.5 billion. Excluding these transactions,
                    the amount raised in 2014 would have been similar to 2015.

                    Chart 3.1 outlines exploration financing from 2011-2015 and also illustrates Canada’s
                    significant role in financing for global exploration as the TSX and TSXV account for 30%
                    on average of the funds raised globally.

                    Chart 3.1: Global Financing for Exploration (US$B)

                                                                                                                         Canada
               20                                                                                                        The Rest
                                                                                                                         of the
                                                                                                                         World
               15
US$ Billions

                                     15.4
               10
                         8.4
                                                                                                            6.4
                5                                                 6.0
                                                                                                   2.5
                         3.8          4.0          1.9                           2.1
                                                   1.1             1.3                             2.3       2.5
               0                                                                 0.8

                        2011        2012          2013           2014           2015           2016         2017

                                        Source: S&P Global Market Intelligence and PDAC analysis

                                                                                                                                    26
State of Mineral Finance 2018: Gaining Momentum

                   Chart 3.2 provides a closer look at exploration financing on the two main Canadian stock
                   exchanges in CAD and highlights the sharp decline from the 2012 peak through 2013-
                   2015, followed by significant improvement of nearly 200% from 2015-2016, with a more
                   subdued increase of 7% in 2017.

                   Chart 3.2: Financing in Canada for Exploration - TSX vs. TSXV
             4.5                                                                                                            TSXV
             4.0
                                                                                                                            TSX
             3.5                    1.0
             3.0
$ Billions

                       2.2
             2.5                                                                                     1.1       1.5
             2.0
             1.5                    3.0
                                                                    0.5
             1.0                                     0.5                                             1.9       1.7
                       1.6                                                         0.4
             0.5                                                    0.9
                                                     0.6                           0.6
             0.0
                      2011         2012             2013           2014           2015           2016         2017

                                          Source: S&P Global Market Intelligence and PDAC analysis

                   Global Exploration Expenditures
                   The following section examines exploration expenditures, both globally and in Canada
                   with analyses by region, stage of exploration, company type and commodity type.

                   Global exploration expenditures have decreased between 2013 and 2016, mirroring
                   the decline in financing for mineral exploration. From a peak of US$20.5 billion in 2012,
                   money spent globally on exploration decreased by more than 66%, with only US$6.95
                   billion spent in 2016. In 2017 global exploration expenditures increased 14.5%, to
                   US$7.95 billion from US$6.95 in 2016.

                   By Region
                   Chart 3.3 illustrates the amount of funds spent on mineral exploration by region. Canada
                   and Australia are the two leading countries in terms of funds spent on exploration,
                   with respective shares of 13.8% and 13.6% of global exploration expenditures in 2017.
                   However, these figures exclude expenditures on ferrous exploration, which, if included,
                   would increase Australia’s global share beyond that of Canada. As indicated in the chart,
                   Canada remains the top destination for non-ferrous exploration. However, its share of
                   global exploration expenditures has declined from 20.5% in 2008 to less than 14% in
                   recent years.

                                                                                                                                      27
State of Mineral Finance 2018: Gaining Momentum

                    Chart 3.3: Global Exploration Expenditures by Region (US$B)

                                                                                                                      25%     Canada
               20                                                                                                             Australia
                     20.5%
                                                                                                                      20%     USA

               15                                                                                                             Africa
US$ Billions

                                                                               13.9%                         13.8%    15%     Latin
                                                                                                                              America
               10                                                                                                             Pacific/
                                                                                                                      10%     SE Asia
                                                                                                                              Rest of
                5                                                                                                             the World
                                                 2.3        2.5                                                       5%
                      2.0
                                        1.5                            1.9                                                    Share of
                               1.1                                               1.3        1.1               1.1             Canada
                      2.8               2.2      3.1        3.2                                      0.9
                               1.4                                    1.9        1.5        1.2      1.0      1.1
               0                                                                                                      0%
                     2008     2009     2010      2011      2012       2013      2014        2015    2016     2017

                                        Source: S&P Global Market Intelligence and PDAC analysis

                    By Project Stage
                    Looking at global exploration expenditures by stage (Chart 3.4), there is a worrisome
                    decline in grassroots exploration. The share of global exploration expenditures spent
                    on grassroots exploration decreased from 38.2% in 2008 to 27.4% in 2017. This decline
                    is concerning because the decline in grassroots exploration reduces the probability of
                    discovering new deposits—and the lack of new discoveries will impact the number of
                    future mines.

                    Chart 3.4: Global Exploration Expenditures by Stage (US$B)
                                                                                                                              Grassroots
                                                                                                                      50%
               20                                                                                                             Late Stage
                      38.2%                                                                                                   & Feasibility
                                                             5.2                                                      40%
                                                                      33.0%
                                                  4.2
US$ Billions

               15                                                                                                             Mine site
                                                                                                            27.4%
                                                                       4.2                                            30%     Share of
                      3.0
                                                            9.0                                                               Grassroots
               10                       2.8       7.2                            3.3                                  20%
                      5.6                                              5.5
                               2.1                                                           3.0              2.9
                                        4.9                                                          2.5
                5                                                                4.2
                               3.2                                                           3.2              2.9     10%
                                                  5.8       6.3                                      2.6
                      5.3               3.8                            4.8
                               2.7                                               3.2         2.5     1.9      2.2
                0                                                                                                     0%
                      2008    2009      2010     2011       2012      2013      2014        2015     2016     2017

                                        Source: S&P Global Market Intelligence and PDAC analysis

                                                                                                                                       28
State of Mineral Finance 2018: Gaining Momentum

                    By Company Type
                    Chart 3.5 provides a breakdown of global exploration expenditures by company type. Data
                    gathered by S&P Global Market Intelligence indicates a decline in the share of global
                    exploration expenditures by junior exploration companies, from over 50% in 2008 to
                    28.2% in 2017.20

                    Chart 3.5: Global Exploration Expenditures by Company Type (US$B)
                                                                                                                            Junior
               25    50.7%                                                                                          60%     Major
                                                 44.1%
                                                                                                                    50%     Intermediate
               20
                                                                        33.8%
US$ Billions

                                                                                                                            Government
                                                                                                                    40%
               15                                                                                           28.2%           Other
                                                                                                    26.3%
                                                             9.1                                                    30%
                                                   6.7                                                                      Share of
               10     48                                                                                                    Juniors
                                                                        6.9                                         20%
                                         4.2                                      5.2
                5               3.4                7.6       8.0                             4.3             4.3    10%
                      7.0                                                                            3.7
                                         5.1                            4.9
                                3.2                                               3.5        2.6             2.2
                                                                                                     1.8
               0                                                                                                    0%
                      2008     2009     2010      2011       2012      2013      2014       2015    2016    2017

                                         Source: S&P Global Market Intelligence and PDAC analysis

                    A decline in junior company exploration spending is concerning given they have shown
                    greater efficiency in making discoveries over time, relative to larger peers. According to
                    a MinEx Consulting research paper presented at PDAC 2015 Convention, the ratio of the
                    value of the discoveries relative to the money spent on exploration is significantly higher
                    for junior exploration companies compared to senior producing companies (“majors”)—
                    0.83 for junior exploration companies compared to only 0.63 for majors.21

                    Exploration Expenditures in Canada
                    Similar to global trends, exploration expenditures in Canada declined significantly from
                    2012-2016. In 2016, exploration expenditures in Canada totaled $1.3 billion, a 60% decline
                    from the $3.25 billion spent in 2012. Following a year-over-year increase in exploration
                    financing in 2016, exploration expenditures in Canada showed the first increase in five
                    years of approximately 10%, to $1.43 billion in 2017. With this in mind, presented later
                    in this document is data from Natural Resources Canada (NRCan) that shows a greater
                    year-over-year increase in exploration spending in 2017.

                    By Project Stage
                    Reviewing exploration expenditures by project stage, similar to global trends there is a
                    sharp decline in grassroots exploration in Canada—the share of expenditures spent on
                    grassroots exploration dropped from 45.1% in 2008 to 21.1% in 2016. A reversal was
                    noted in 2017; however, as grassroots activity increased to 28.8% of total expenditures,
                    which is outlined in Chart 3.6.

                                                                                                                                    29
State of Mineral Finance 2018: Gaining Momentum

                   Chart 3.6: Exploration Expenditures in Canada by Stage
                                                                                                                            Grassroots
             4.0    45.1%                                                                                          50%      Late Stage
                                              40.1%                                                                         & Feasibility
             3.5
                                                                                                                   40%      Mine site
             3.0                                          0.5                 32.6%
                     0.4                        0.5
                                                                                                                            Share of
$ Billions

                                                                                                  27.4%    28.8%
             2.5                                                                                                   30%      Grassroots
             2.0     1.3              0.4       1.4       1.8       0.4
             1.5                                                               0.4                                 20%
                              0.2     1.1
                                                                    0.9                   0.5               0.3
                                                                                                   0.3
             1.0              0.8                                              0.7
                     1.4                                                                  0.6      0.6      0.7    10%
             0.5                                1.2       1.0
                                      0.8                            0.7
                              0.6                                              0.5        0.4      0.4      0.4
             0.0                                                                                                   0%
                    2008     2009    2010      2011       2012      2013      2014        2015     2016    2017E

                                      Source: S&P Global Market Intelligence and PDAC analysis

                   By Company Type
                   Chart 3.7 shows exploration expenditures in Canada by company type and
                   demonstrates how the share of exploration expenditures by junior exploration
                   companies has declined from nearly 70% in 2008 to roughly 50% in 2016. However,
                   2017 marked a slight increase in the junior share.

                   Chart 3.7: Exploration Expenditures in Canada by Company Type
                                                                                                                            Junior
             3.5                                                                                                    80%
                    69.5%                                                                                                   Major
             3.0                                                                                                    70%     Intermediate
                                                                                                          56.3%
                                                                                                                    60%     Government
             2.5     0.7                        0.8                 49.0%                        50.1%
$ Billions

                                                           1.0                                                      50%     Other
             2.0
                                      0.6                                                                           40%     Share of
             1.5                                                                                                            Juniors
                     2.1                                             0.7                                            30%
                              0.5               2.0                            0.6         0.6
             1.0                                          1.8                                               0.5
                                                                                                   0.5              20%
                              0.9     1.5                            1.0
             0.5                                                               0.8         0.8     0.7      0.8     10%

             0.0                                                                                                    0%
                     2008    2009    2010      2011       2012      2013      2014        2015     2016    2017E

                                      Source: S&P Global Market Intelligence and PDAC analysis

                                                                                                                                     30
You can also read