LOSS PREVENTION Towards Effective Navigation - The ...
←
→
Page content transcription
If your browser does not render page correctly, please read the page content below

LOSS PREVENTION Towards Effective Navigation
© British Crown Copyright and/or database rights. Reproduced by permission of the
Controller of Her Majesty’s Stationery Office and the UK Hydrographic Office
(www.gov.uk/government/organisations/uk-hydrographic-office).
The information and recommendations in this booklet are given in good faith and are meant
to highlight best practices, good seamanship and common sense to reduce incidents that result
in related claims. However, Members must take into consideration the guidance and regulatory
requirements given by Flag states and other governing authorities when formulating policy in
line with the contents of this publication.
NOT TO BE USED FOR NAVIGATION.
Foreword
The Shipowners’ Club provides P&I insurance for small and specialised vessels and, as such, the
majority of our vessels trade in coastal waters. The art of navigation is second nature to
deep-sea mariners but it can be something of a mystery to those crews who do not need to use
this particular skill very often.
Our Condition Survey Programme often highlights the fact that crews have a limited
understanding of the rudiments of basic navigation and we also see claims arising where poor
navigation is a main contributing factor. A better understanding of the subject will hopefully go
some way in reducing the incidence of those claims.
The purpose of this booklet is to open the window on navigation in a very basic way. It is primarily
aimed at those mariners who are not fully trained in the art of navigation.
This booklet is one of three publications in a series and it is envisaged that together they will
help eliminate some of the difficulties that befall those not so well versed in marine
navigation.
We remain forever indebted to Captain H. Subramaniam for compiling this booklet series for
us. Captain Subramaniam was a distinguished member of the nautical fraternity in a career
spanning over 6 decades, including over 30 years of teaching experience. Apart from this
series, he also authored eight textbooks on the operation of merchant ships which continue
to be used by seafarers across the globe. It was his ability to put a subject across in a nutshell
that made all his books easy to understand and helpful to those these are intended for.
Contents

Chapter 1    Principles of navigation                                                  2
             Positional references                                                     2
            Distance                                                                    9

Chapter 2	Directional references                                                     11
             The three-figure system                                                  11
             The gyro compass                                                         12
             The magnetic compass                                                     16
             Relative bearing                                                         31
             The quadrantal system                                                    34

Chapter 3	Introduction to charts                                                     37
             Mercator charts                                                          37
             Natural scale of a chart                                                 39
             Types of navigational charts                                             39
             Characteristics of navigational charts                                   40
             Titles of charts                                                         41
             Datum for depths and heights on charts                                   44
             Chart symbols                                                            46
             Chart catalogues and folios                                               52

Chapter 4    An Introduction to ECDIS                                                 54

Chapter 5    Nautical publications                                                    57

Chapter 6	Notices to Mariners and chart correction                                   68

                                         Loss Prevention: Towards Effective Navigation I 1
Chapter 1
 Principles of navigation

 POSITIONAL REFERENCES

                                           Figure 1

 Axis of rotation
 The Earth rotates around an imaginary line called its axis of rotation once a day from west
 to east as shown in Figure .

 2 I Loss Prevention: Towards Effective Navigation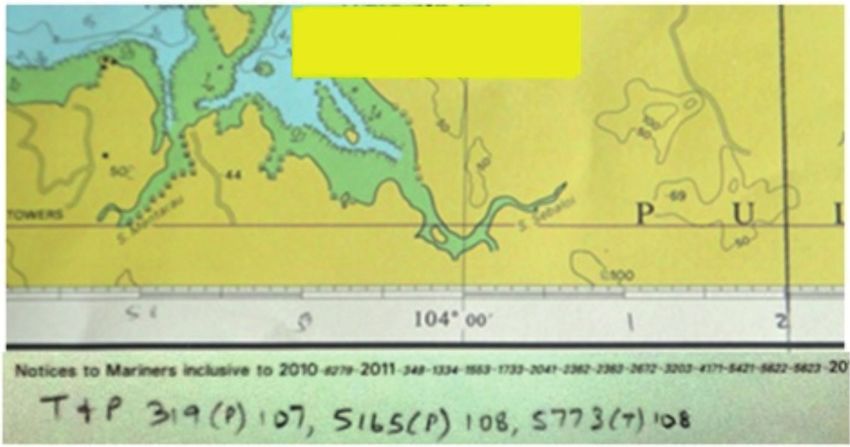
The North and South Poles
The points where the axis of rotation cuts the Earth’s surface are called the poles. The
one on top is called the North Pole and the one at the bottom is called the South Pole as
shown in Figure 2.

                                         Figure 2

Equator
The Equator is an imaginary line on the Earth’s surface, midway between the two poles.
The Equator divides the Earth into two halves, called the Northern hemisphere and the
Southern hemisphere as shown in Figure2.

                                          Loss Prevention: Towards Effective Navigation I 3
Parallels of latitude
Parallels of latitude are imaginary lines on the Earth’s surface that are parallel to the
Equator. They are named North or South according to the hemisphere in which they lie
as shown in Figure 3.

                                          Figure 3

The Earth’s surface from the Equator to each pole is divided into 90 equal parts. Each part
is called a degree of latitude. The Equator is 0°. The North Pole is 90°N. The South Pole is
90°S. The minimum value of latitude is 0°. The maximum value of latitude is 90°N or 90°S.

4 I Loss Prevention: Towards Effective Navigation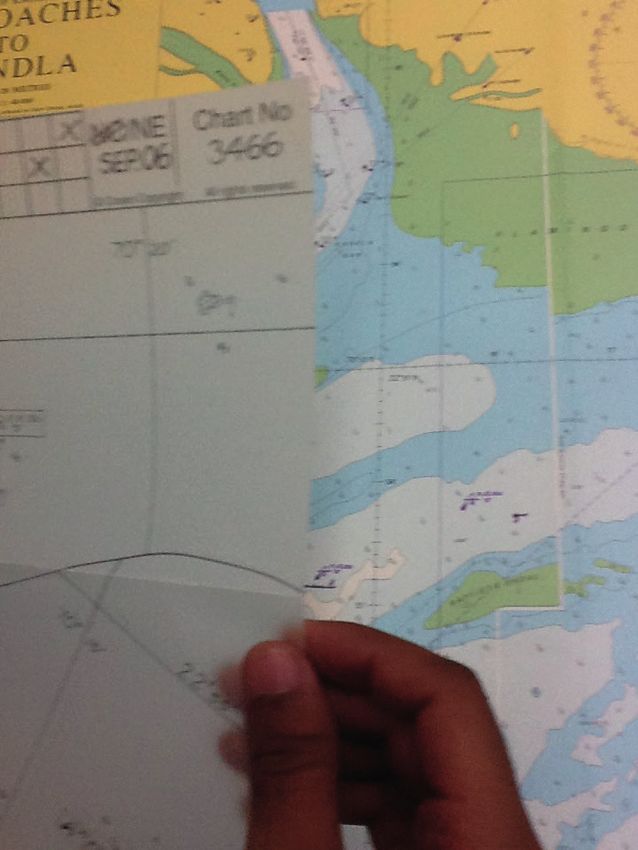
Meridians of longitude
Meridians are imaginary lines on the surface of the Earth that go from one pole to the
other by the shortest path. Meridians cross the Equator and all parallels of latitude at 90° as
shown in figure 4.

                                           Figure 4

If you stand on any meridian, the North Pole will be exactly north of you and the South
Pole will be exactly south of you. When you face north, the areas on your right will be
to the east of you. The areas to your left will be west of you.

                                             Loss Prevention: Towards Effective Navigation I 5
The Prime Meridian
The Prime Meridian is the meridian that passes through the Greenwich Observatory in
London. The Prime Meridian divides the Earth into two hemispheres – the Eastern
hemisphere and the Western hemisphere (Figures 5 and 6).

                                          Figure 5

6 I Loss Prevention: Towards Effective Navigation
Longitude
Look at the Earth from above the North Pole as shown in Figure 6. The circle you see is
the Equator. P is the North Pole. The centre of the Earth is directly below the P. The line
P–G is the Prime Meridian, dividing the Earth into the Eastern and Western hemispheres.

                                         Figure 6

Starting from G, divide the Equator on the Western hemisphere into 180 parts and call
each a degree of west longitude.

                                           Loss Prevention: Towards Effective Navigation I 7
In Figure 7, the line P–G is the Prime Merdian. Starting from G, divide the Equator on the
Eastern hemisphere into 180 parts and call each a degree of east longitude.
As shown in Figure 7:
Longitude of A = 045°E Longitude of C = 135°E Longitude of E = 090°W
Longitude of B = 090°E Longitude of D = 045°W Longitude of F = 135°W.
Figure 7
Notice that the line P–H is both 180°E and 180°W. Hence the meridian PH is called 180°
without the E or W attached to it. The minimum value of longitude is 0°. The maximum value
of longitude is 180°.
8 I Loss Prevention: Towards Effective NavigationPosition of a place
Each degree of latitude and longitude is divided into 60 parts, each called a minute of arc
(not to be mixed up with minute of time).
The position of a place or a ship on the Earth is indicated by its latitude and longitude in
degrees and minutes.
The following is an extract from Norie’s Nautical Tables:
Latitude Longitude
London (UK) 51° 30’N 000° 05’W
Mumbai (India) 18° 55’N 072° 50’E
Keppel Harbour (Singapore) 01° 16’N 103° 50’E
Distance
Distances at sea are expressed in nautical miles. Abbreviation for nautical miles is NM
and for metres is m.
1 NM = 1,852 m.
Loss Prevention: Towards Effective Navigation I 9It is interesting to know how the value of 1 NM was arrived at. Figure 8 shows the Earth,
with O at the centre and O–B as a radial line. The O–B line rotates by 360° and covers an
approximate distance on the Equator of 40,000 km.
Hence 360° = 40,000 km on the Equator.
Or, 1° = 40,000 km
360
or 1 minute of arc = 40,000 = 1.852 km
360 x 60
Hence 1 NM = 1 minute of arc = 1.852 km = 1,852 m.
It has been internationally agreed that 1 NM = 1,852 m.
Figure 8
Also = 1.852 km = 6,076 feet = 1.15 land miles. Also 1 km = 0.54 NM.
Cable
0.10 NM (1/10 of a nautical mile) = 1 cable or 10 cables = 1 NM.
Speed
A speed of one nautical mile per hour is called a knot. It is wrong to say ‘knots per hour’.
10 I Loss Prevention: Towards Effective NavigationChapter 2
Directional references
THE THREE-FIGURE SYSTEM
Directions are normally indicated in degrees clockwise from north. So, 000° is north, 090°
is east, 180° is south, 270° is west and 360° (i.e. 0°) is north again as shown in Figure 9.
Your ship’s bridge is indicated by 0.
000°
315° 045°
N
NW NE
270° W
O E 090°
SW SE
S
225° 135°
180°
Figure 9
Loss Prevention: Towards Effective Navigation I 11There are two sources for direction on board a ship: the gyro compass; and the
magnetic compass.
THE GYRO COMPASS
The gyro compass is an electrically-driven mechanical instrument that works on the
directional property of a wheel spinning at a very high rate.
Its principle is similar to that of a spinning top that children play with. So long as its
rotational speed is above a critical level, it will maintain its direction in space (Figure 10).
Figure 10
So long as the power supply is continuous and does not fluctuate, the gyro compass
will be reliable.
12 I Loss Prevention: Towards Effective NavigationIn case of power failure, an alternate power supply should normally take over
automatically and ensure uninterrupted power supply for several hours.
Steering repeater
Bridge centre repeater
Master
gyro Bridge wing repeaters
compass
Navigation/Global Maritime Distress
Safety System instruments (GMDSS)
Steering flat repeater
Figure 11
Gyro is not affected by external magnetic influences. When in proper running order, the
gyro compass points constantly to true north. The main unit is called the master gyro
and other units that get input from it are called repeaters, as depicted in Figure 11.
Loss Prevention: Towards Effective Navigation I 13Gyro error The gyro compass may have a small error which is usually between 0.0° and 0.5° but may sometimes be as much as 2.0°. This varies according to changes in latitude, course and speed of the ship. When the gyro reading is higher than the true value, the error is termed high or H. Hence, to all readings of the gyro compass, the error is subtracted to get true values. Example 1: If gyro error is 1° (H): Gyro bearing of lighthouse = 247° (G) Gyro error = 1° H True bearing of lighthouse = 246° (T) When the gyro reading is less than the true value, the error is termed low or L. Hence, to all readings of the gyro compass, the error is added to get true values. Example 2: If gyro error is 1° (L): True course to steer = 102° (T) Gyro error = 1° L Gyro course to steer = 103° (G) 14 I Loss Prevention: Towards Effective Navigation
Test yourself
Gyro error
You are given the true (T) and gyro (G) readings. Fill in the gyro compass error and its name:

                       1              2                3               4              5
 Reading (T)         275°            126°            341°           192.5°          044°
 Reading (G)         276°            124°            342.5°         191.5°          044°
 Error

You are given the true reading and the gyro error. Fill in the gyro reading:

                       6              7                8               9             10
 Reading (T)         144°            186°            337°            000°           359°
 Error               H 1°            L 2°            H 0.5°         L 1.5°           H 1°
 Reading (G)

You are given the gyro reading and the gyro error. Fill in the true reading:

                      11              12               13             14             15
 Reading (G)         129°            221°            343°            180°           119°
 Error               H 2°            L 1°            L 0.5°          H 1°            H 1°
 Reading (T)

Answers:
 Error:             1. 1°(H)       2. 2°(L)         3. 1.5°(H)      4. 1°(L)       5. 0°
                    6. 145°        7. 184°          8. 337.5°       9. 358.5°      10. 000°
                    11. 127°       12. 222°         13. 343.5°      14. 179°       15. 118°

                                             Loss Prevention: Towards Effective Navigation I 15
THE MAGNETIC COMPASS
A magnetic compass rarely points to true north. Are you surprised? Normally, the error
is predictable and can be corrected with reasonable accuracy. The magnetic compass
is very reliable and serves as a check on the gyro compass.
Compass error
Compass error (CE) is the angle of the compass between true north and compass north
expressed in degrees.
Clarification
When you stand on any meridian, the direction of the North Pole is true north. The direction
indicated by the north point of the compass is called compass north (CN).
CE is named east (E) if the compass north lies to the right of true north (Figure 12A).
CE is named west (W) if the compass north lies to the left of true north (Figure 12B).
True N True N
A Terrestrial B
345° (C) 010° (C)
object
CN CN
000° (C) 000° (C)
Colour code for arrows:
Comp bearing
True bearing
Comp error
Bearing = 050˚ (T) Bearing = 330˚ (T)
035˚ (C) 340˚ (C)
Comp error = 15˚ E Comp error = 10˚ W
Figure 12
16 I Loss Prevention: Towards Effective NavigationFigures 12A and 12B are purely theoretical. At sea, how would you know where true north
is? If you can answer that question, there is no need for a magnetic compass!
At sea you can always get the compass reading at a glance and apply CE to it to obtain the
true direction. This is why a magnetic compass is needed on board.
Conversion of bearings
Conversion of compass bearings to true bearings, and vice versa, becomes very easy if a
rule of thumb is applied as follows:
Error east, compass least
Error west, compass best
Example 1:
If the bearing is 035°(C) and CE is 15° E, find the true bearing.
Using the rule of thumb, ‘error east, compass least’, you work it out as follows:
Bearing 035°(C)
CE 15° E
Bearing 050°(T)
You can verify the answer by checking Figure 12A.
Example 2:
If the bearing is 330°(T) and CE is 10°W, find the compass bearing.
Using the rule of thumb, ‘error west, compass best’, you work it out as follows:
Bearing 330°(T)
CE 10°W
Bearing 340°(C)
You can verify the answer by checking Figure 12B.
Loss Prevention: Towards Effective Navigation I 17Test yourself
Compass error
You are given the true and compass bearings. Fill in the CE:
1 2 3 4 5
Bearing (T) 275° 126° 001° 192.5° 044°
Bearing (C) 276° 124° 350° 201.5° 044°
CE
You are given the true bearing and the CE. Fill in the compass bearing – Bearing (C):
6 7 8 9 10
Bearing (T) 265° 136° 001° 182.5° 034°
CE 16°E 12°W 2.5°E 19.5°E 4°W
Bearing (C)
You are given the compass bearing and the CE. Fill in the true bearing – Bearing (T):
11 12 13 14 15
Bearing (C) 127° 350° 159° 261° 089°
CE 6°W 14°E 17°W 11.5°E 14°E
Bearing (T)
Answers:
CE: 1. 1°W 2. 2°E 3. 11°E 4. 9°W 5. 0°
(C): 6. 249° 7. 148° 8. 358.5° 9. 163° 10. 038°
(T): 11. 121° 12. 004° 13. 142° 14. 272.5° 15. 103°
18 I Loss Prevention: Towards Effective NavigationComponents of compass error
The error of the magnetic compass is made up of two variables – variation and deviation.
Geographic Magnetic
North Pole blue pole
About 11.3°
Axis of
rotation
Magnetic
Geographic
red pole
South Pole
Figure 13
Causes of variation
The core of the Earth is like a bar magnet. Its magnetic axis is about 11.3° to the axis of
rotation (Figure 13). The positions of the magnetic poles are not constant. They change
erratically by about 8 nautical miles a year. Navigators call the magnetic poles blue and
red, as shown in Figure 13.
Loss Prevention: Towards Effective Navigation I 19Magnetic variations
The angular difference of the ship between true north and magnetic north expressed in
degrees.
Geographic
North Pole Magnetic
blue pole
B
A
Magnetic
red pole Geographic
South Pole
Figure 14
The value of variation depends on the position of the ship with respect to the geographic
pole and the magnetic pole. Figure 14 shows the variation at positions A and B.
Value of variation
This is indicated by compass roses at various locations on navigational charts. A compass
rose shows true north and degrees of directions clockwise from 0° to 360° and the magnetic
north. It also shows the variation at that location, the year it was measured and the annual
change in that value (Figure 15).
20 I Loss Prevention: Towards Effective NavigationAnnual change of variation
As explained earlier, the magnetic poles shift erratically by about eight nautical miles a
year. This causes a slight change in the value of variation each year. This annual change is
indicated near the value of variation. The change has to be calculated for the current year
and applied to the value indicated for the year when the variation was measured (Figure 15).
Compass Rose
Figure 15
Loss Prevention: Towards Effective Navigation I 21Sample calculation At the location of the centre of the compass rose, the variation was 6° 40’W in 1992. The annual change is 8’E. Find the variation in 2012. Variation in 1992 = 6° 40’W Change = 8 x 20 = 2° 40’E Variation in 2012 = 4° 00’W Conversion of magnetic bearings Conversion of magnetic bearings (M Brg) to true bearings (T Brg) and vice versa becomes very easy if a rule of thumb is applied as follows: Error east, magnetic least. Error west, magnetic best. 22 I Loss Prevention: Towards Effective Navigation
Example 1:
If the bearing is 047°(M) and variation is 8°E, find the true bearing.
Using the rule of thumb, ‘error east, magnetic least’, we work as follows:

 Bearing                                                            047°(M)
 Variation                                                           8° E
 Bearing                                                            055°(T)

The answer can be verified by checking Figure 16.

                           True                                                        True
                           north                                                       north
                                                                                 B
                                                                                                Terre
                                                                                                  ob
                                   Magnetic                                 Magnetic
                                    north                                    north
                                                      Terrestrial
                                                        object
                                                                                                   M
                                                    T Brg
                                               M Brg
                                                                                                   T
                                              Var E                           Var W

                                          Figure 16

                                           Loss Prevention: Towards Effective Navigation I 23
Example 2:
If the bearing is 052°(T) and variation is 6°W, find the magnetic bearing:
Using the rule of thumb, ‘error west, magnetic best’, we work as follows:
Bearing 052°(T)
Variation 6°W
Bearing 058°(M)
The answer can be verified by checking Figure 17.
rue True
orth north
A B
Terrestrial
object
Magnetic Magnetic
north north
Terrestrial
object
M Brg
T Brg
M Brg
T Brg
Var E Var W
Figure 17
24 I Loss Prevention: Towards Effective NavigationTest yourself
Variation
You are given the true and magnetic bearings. Fill in the variation:
1 2 3 4 5
Bearing (T) 245° 116° 002° 182.5° 065°
Bearing (M) 246° 114° 350° 195.5° 065°
Variation
You are given the true bearing and the deviation. Fill in the magnetic bearing – Bearing (M):
6 7 8 9 10
Bearing (T) 275° 147° 004° 142.5° 039°
Variation 15°E 12°W 6.5°E 15.5°E 05°W
Bearing (M)
You are given the magnetic bearing and the deviation. Fill in the compass bearing - Bearing (C):
11 12 13 14 15
Bearing (M) 120° 352° 169° 260° 099°
Variation 8°W 15°E 17°W 11.5°E 15°E
Bearing (T)
Answers:
Var: 1. 1°W 2. 2°E 3. 12°E 4. 13°W 5. 0°
(M): 6. 260° 7. 159° 8. 357.5° 9. 127° 10. 044°
(T): 11. 112° 12. 007° 13. 152° 14. 271.5° 15. 114°
Loss Prevention: Towards Effective Navigation I 25Deviation for the ship’s head
Deviation is the angle of the compass between the magnetic north and the compass
north. It is expressed in degrees and minutes of arc.
Deviation is named east if the compass north lies to the right of the magnetic north (Figure 19).
Deviation is named west if the compass north lies to the left of magnetic north (Figure 20).
Deviation is caused by the magnetic influence of the ship’s steel and iron structure.
The value of deviation and its name – east or west – depends on the compass course of the ship.
Deviation of the compass is caused by the magnetic properties of the ship’s structure.
The compass would point in a direction slightly away from the magnetic north.
If we were on a wooden boat with no iron or steel structure, there would be no deviation.
The compass would point to the magnetic north.
The value of deviation depends on the ship’s head. The value and name of deviation can
be obtained at a glance from a document called the deviation card illustrated in Figure 18.
Note: To avoid clutter, many horizontal lines have not been shown.
Compass course
West 4º 2º 0º 2º 4º East
000º (c)
090º (c)
180º (c)
270º (c)
360º (c)
Figure 18
26 I Loss Prevention: Towards Effective NavigationIf the bearing of an object is 135°(C) while steering 200°(C), the deviation should be taken
out from the card for 200°(C) not 135°(C). The value of deviation depends on the ship’s
head not on the compass bearing. From the deviation card shown in Figure 18, deviation
= 1°W and not 3°E.
Conversion of bearings
Conversion of compass bearings (C Brg) to magnetic bearings (M Brg) and vice versa
becomes very easy if a rule of thumb is applied as follows:
Error east, compass least.
Error west, compass best.
Example 1:
If the bearing is 022°(C) and deviation is 5°E, find the magnetic bearing.
Using the rule of thumb, ‘error east, compass least’, we work as follows:
Bearing 022°(C)
Deviation 5° E
Bearing 027°(M)
The answer can be verified by checking Figure 19.
Magnetic Magnetic
north north
Terrestrial
object
C Brg
Compass Compass
north north
C Brg
M Brg Terrestrial
object M Br
Deviation E Deviation W
Figure 19
Loss Prevention: Towards Effective Navigation I 27Example 2:
If the bearing is 045° (M) and variation is 7° W, find the magnetic bearing.
Using the rule of thumb, error west, magnetic best we work as follows:
Bearing 045°(M)
Deviation 7°W
Bearing 052°(C)
The answer can be verified by checking Figure 20.
Magnetic Magnetic
north north
Terrestrial
object
C Brg
Compass Compass
north north
C Brg
M Brg Terrestrial
object M Brg
Deviation E Deviation W
Figure 20
28 I Loss Prevention: Towards Effective NavigationTest yourself
Deviation
You are given the compass and magnetic bearings. Fill in the deviation:
1 2 3 4 5
Bearing (C) 205° 120° 358° 178.5° 035°
Bearing (M) 203° 124° 359° 175.5° 035°
Deviation
You are given the true bearing and the variation. Fill in the magnetic bearing – Bearing (M):
6 7 8 9 10
Bearing (C) 265° 147° 003° 122.5° 038°
Deviation 5°E 2°W 3.5°E 4.5°E 5°W
Bearing (M)
You are given the magnetic bearing and the variation. Fill in the true bearing – Bearing (T):
11 12 13 14 15
Bearing (M) 110° 342° 165° 270° 180°
Deviation 4°W 5°E 2°W 1.5°E 4°E
Bearing (C)
Answers:
Deviation 1. 2°W 2. 4°E 3. 1°E 4. 3°W 5. 0°
Bearing (M) 6. 270° 7. 145° 8. 006.5° 9. 127° 10. 033°
Bearing (C) 11. 114° 12. 337° 13. 167° 14. 268.5° 15. 176°
Loss Prevention: Towards Effective Navigation I 29Compilation of compass error
CE is the combination of deviation and variation. Tabulate the values and names and
obtain the CE, using the rule of thumb as shown below.
Rule of thumb:
If deviation and variation are of the same name, add and retain the name. If they are
of opposite names, subtract the smallest number from the larger and retain the name
of the larger one as shown below:
Deviation 3°E 6°E CE 8°E 8°W
Variation 14°E 10°W Variation 10°E 12°W
CE 17°E 4°W Deviation 2°W 4°E
Test yourself
Compilation of CE
You are given the deviation and variation. Fill in the CE:
1 2 3 4 5
Deviation 5°E 4°E 2°W 2°E 4°W
Variation 16°W 12°W 3°E 3.5°E 3°W
CE
You are given the CE and the variation. Fill in the deviation:
6 7 8 9 10
CE 15°E 11°W 1°E 2.5°W 3°W
Variation 3°E 6°W 3°W 5°W 4°W
Deviation
Answers:
CE: 1. 11°W 2. 8°W 3. 1°E 4. 5.5°E 5. 7°W
Deviation 6. 12°E 7. 5°W 8. 4°E 9. 2.5°E 10. 1°E
30 I Loss Prevention: Towards Effective NavigationRelative bearing
The relative bearing of an object is the angle of the observer between the ship’s head and
the line of sight of the object, measured clockwise from 0° to 360°. Figure 21 shows the
various terms used in relative bearings.
Course
Degrees from
0º to 360º
Ahead
Port Starboard
bow 000º bow
Port Starboard
beam 270º 090º beam
Port 180º Starboard
quarter quarter
Astern
Figure 21
Relative bearings are fairly simple to understand as all objects are as you see them while
driving a car – in front is ahead, behind is astern, right and left sides are relative to you.
This is unlike a chart where everything is north up. Relative bearings are important as
collision avoidance rules are based solely on relative bearings – the direction of other
ships from your ship’s head.
Loss Prevention: Towards Effective Navigation I 31Figure 22 shows an object whose relative bearing = 245°.
Degrees from
0º to 360º
Ahead
000º
270º 090º
Object
Relative 180º
bearing 245º
Figure 22
Conversion of bearings
A simple formula can be applied to find this:
Relative bearing (Rel Brg) + true course (T Course) = true bearing (T Brg)
To convert relative bearings to true bearings, just add the relative bearing to the true
course. If the total exceeds 360°, subtract 360 from the total as shown in Example 1.
Rel Brg 200°
T Course 260°
T Brg 460°
-360°
T Brg 100°
Example 1
32 I Loss Prevention: Towards Effective NavigationTo convert true bearings to relative bearings, subtract true course from true bearing.
If not possible, add 360 to the true course and then subtract as shown in Example 2.
T Brg 100° 460°
T Course 260° 260°
Rel Brg 200°
Example 2
Test yourself
Relative bearings
You are given the relative bearing and the true course. Fill in the true bearing:
1 2 3 4 5
Rel Brg 300° 090° 316° 280° 000°
T Course 200° 100° 210° 200° 189°
T Brg
You are given the true bearing and the true course. Fill in the relative bearing:
6 7 8 9 10
T Brg 300° 040° 310° 000° 000°
T Course 200° 100° 069° 090° 180°
Rel Brg
Answers:
(T Brg): 1. 140° 2. 190° 3. 166° 4. 120° 5. 189°
(Rel Brg): 6. 100° 7. 300° 8. 241° 9. 270° 10. 180°
Loss Prevention: Towards Effective Navigation I 33THE QUADRANTAL SYSTEM
The quadrantal system of naming courses is useful, especially in calculations involving
courses, distances and positions.
N
Quadrantal Quadrantal
course NW course NE
W E
Quadrantal Quadrantal
course SW course SE
S
Figure 23
In Figure 23, 000° (T) is called N, 090° is called E, 180° is called S and 270° is called W.
All other values of courses in three-figure notations are converted into the two-figure
quadrantal system as follows:
All courses from 000° to 090° (T) are called NxxE (example: 078° = N78°E).
alues of courses from 090° to 180° (T) are subtracted from 180° and are then called
V
SxxE (example: 157° = S23°E).
alues of courses from 180° to 270° (T) are decreased by 180° and are then called
V
SxxW (example: 224° = S44°W).
alues of courses from 270° to 360° (i.e. 000°) (T) are subtracted from 360° and are
V
then called NxxW (example: 358° = N02°W).
34 I Loss Prevention: Towards Effective NavigationWhy do we use the quadrantal system in plain sailing?
You have angles less than 90° thereby making calculations easy.
ou obtain the name of difference in latitude (d’lat) and difference in longitude (d’long)
Y
directly by the name of the course.
Example:
Convert 243° (T) to quadrantal course.
Since it is in the SW quadrant, we subtract 180° from it and then name the balance SW.
So 243°–180° = 63°. Hence the quadrantal course is S63°W, as illustrated graphically
in Figure 24.
000º (T)
True course Quadrantal
243º (T) course
S63º W
180º (T)
Figure 24
Loss Prevention: Towards Effective Navigation I 35Test yourself
Quadrantal courses
Fill in the quadrantal course (Quad):
1 2 3 4
T Course 275° (T) 126° (T) 001° (T) 192° (T)
Quad
Fill in the true course (T Course):
5 6 7 8
Quad N62°W SO7°E N02°W S42°W
T Course
Answers:
Quad: 1. N85°W 2. S54°E 3. N01E° 4. S12°W
T Course 5. 298° 6. 173° 7. 358° 8. 222°
36 I Loss Prevention: Towards Effective NavigationChapter 3
Introduction to charts
MERCATOR CHARTS
For convenience in navigation, you need a two-dimensional, flat chart representing the
three-dimensional, curved surface of the Earth. Mercator charts solve this problem.
Figure 25 illustrates how it is done.
E F
H
C D
Area increases
as latitude
increases
A B G
Figure 25
In Figure 24:
C and D are places in the same latitude on a globe.
C–A and D–B are their meridians on the globe.
A–B is part of the Equator.
A–B is the difference of longitude between the meridians of C and D.
C–D is the distance between them in nautical miles.
Mercator projection has pulled C to E and D to F.
The meridians are now parallel to each other.
The parallel latitudes of C and D have moved away from the Equator to E–F.
Figure 25 also shows what happens to the size of an area on a mercator chart. Area G at
the Equator increases gradually in length and breadth as you go away from the Equator.
In the latitude of C and D, it looks as big as H.
Loss Prevention: Towards Effective Navigation I 37However, directions are maintained. In this case, the diagonals of G and H are parallel.
On a mercator chart, directions are maintained despite a change in size.
Properties of a mercator chart
1. Though areas appear larger at higher latitudes, directions are correct.
2. The Equator appears as a straight line.
3. All meridians appear as straight lines parallel to one another.
4. The distance between consecutive meridians is constant at all latitudes.
5. All meridians cross the Equator at right angles.
6. All meridians and all parallels of latitude cross at right angles.
7. Parallels of latitude would appear as straight lines parallel to one another.
8. The distance between consecutive parallels increases as latitude increases.
9. One minute of longitude is the same size in all parts of the chart (see point 4 above).
10. One minute of latitude increases in size steadily as we go away from the Equator
(see point 8 above).
Measurement of distance on a mercator chart
On a mercator chart, distances measured in any direction, using minutes of the latitude
scale of the chart, are in nautical miles.
Since the size of one minute of latitude on a mercator chart increases as latitude increases,
you should use the chart dividers against the latitude in which the distance lies.
For example, if place A is in latitude 24°N longitude aaa°, and place B is in latitude 26°N
longitude bbb°, you should place one leg of the chart divider on A, the other on B and the
spread of the divider represents the distance AB on that chart.
To read off the value of the distance, you should place the divider N-S along the latitude
markings on the chart such that the centre of the divider lies on latitude 25°N.
Now read off the value of the distance, contained between the legs, in minutes. Suppose
the value of the distance so obtained is 136’, the distance AB is 136 nautical miles.
38 I Loss Prevention: Towards Effective NavigationNATURAL SCALE OF A CHART
The natural scale of a chart is the ratio of the distance between two points on the chart
to the actual distance between them on the surface of the Earth.
For example, if the natural scale of a chart is stated to be 1:30,000, it means that 1cm on
the chart represents an actual distance of 30,000cm on the Earth.
Since on a mercator chart the size of a nautical mile changes with latitude, the natural
scale mentioned in a mercator chart would be for the specified latitude mentioned next
to it. The natural scale mentioned would, therefore, be valid only at that latitude.
TYPES OF NAVIGATIONAL CHARTS
There are three types of navigational charts in common use at sea:
1. Ocean charts.
2. Coastal charts.
3. Plan charts.
Ocean charts
These cover large areas of the Earth’s surface. They are useful in planning ocean voyages.
They are unsuitable for plotting positions at small intervals such as one hour or fractions
of an hour.
Furthermore, since the area covered is very large, ocean charts do not show any details
of dangers such as shoals. Ocean charts have a natural scale from 1:600,000 to
1:14,000,000.
Coastal charts
These charts are used for coastal navigation. They show detailed information regarding
navigational aids, soundings, shoals, tidal flow and features suitable to help navigation.
Coastal charts which have a natural scale of 1:150,000 to 1:600,000 are called general
coastal charts.
Coastal charts which have a natural scale of 1:50,000 to 1:150,000 are used for coastal
navigation close to the shore and are generally referred to as inshore charts.
Plan charts
These charts show small areas such as harbours, ports and docks. They display details of
jetties, berths, docks, ports, canal, rivers and harbours. They facilitate navigation in narrow,
confined waters.
Loss Prevention: Towards Effective Navigation I 39Their natural scale may be from 1:50,000 down to about 1:12,500.
CHARACTERISTICS OF NAVIGATIONAL CHARTS
Chart number
Every chart has a distinct number which is usually mentioned in three places.
1. On the bottom right corner outside the margin (Figure 26).
Figure 26
2. On the top left corner outside the margin (Figure 27).
Figure 27
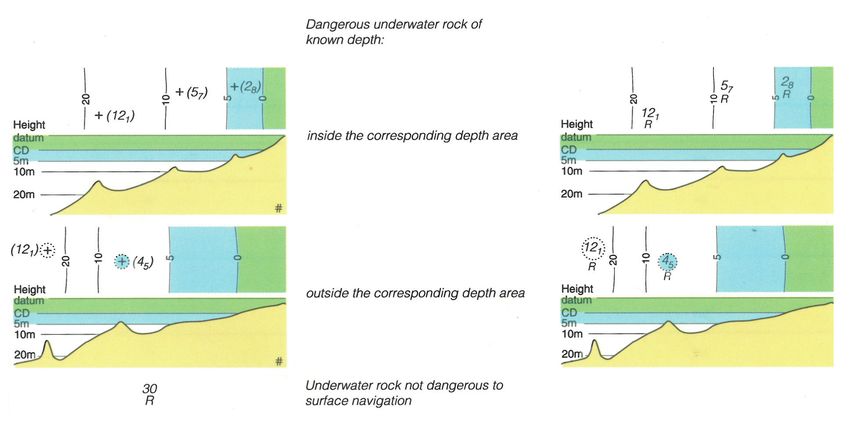
40 I Loss Prevention: Towards Effective Navigation3. O
n the outside centre of the nearer edge so that it is visible after folding the chart
(Figure 27). The title of the chart is also mentioned next to it.
Figure 28
TITLES OF CHARTS
The title of the chart refers to the area covered by the chart. This is given in two places:
1. O
n the outside centre of the nearer edge so that it is visible after folding the chart
(Figure 27). The number of the chart is also mentioned here.
2. Within the chart in an area where it will not affect the use of the chart (Figure 28).
Figure 29
Loss Prevention: Towards Effective Navigation I 41Natural scale
This is stated under the title inside the chart (Figure 29).
Publishing authority
This is stated at the bottom centre outside the margin (Figure 30).
Figure 30
Date of publication
This is stated at the bottom centre, outside the margin along with the name of the publishing
authority (Figure 30).
Date of new edition
This is stated outside the bottom margin of the chart (Figure 31).
Customer information Notices to Mariners 2008-3497-5112-
Edition number: 3 2009-73-4802-6798- 2010-371-847
Edition date: 17th April 2008 2011-258-341
Figure 31
42 I Loss Prevention: Towards Effective NavigationSmall corrections
Small corrections are entered at the bottom margin, next to the date of the new edition
(Figure 31).
The notations indicate that this chart has been corrected:
In the year 2008: for notice numbers 3497 and 5112.
In 2009: for notice numbers 73, 4802 and 6798.
In 2010: for notice numbers 371 and 847.
In 2011: for notice numbers 258 and 341.
Dimensions of chart
The dimensions of the chart refer to the inner margins of the chart. This is stated in the
bottom right outside the margin of the chart (Figure 32).
Figure 32
Loss Prevention: Towards Effective Navigation I 43DATUM FOR DEPTHS AND HEIGHTS ON CHARTS
Depths and heights are illustrated by the examples below. Figure 33 shows the cross
section of a swimming pool.
All depths are measured from the designated water level downwards as illustrated in the
two areas of the swimming pool – the adult area and the children’s area. All heights are
measured from the ground level upwards. A similar system is followed on charts.
Swimming pool
Height of changing rooms
Datum for heights
Datum for depths
Depth of water
Depth of water
Children’s
area
Figure 33
Chart datum
Chart Datum (CD) is the water level at which all the depths shown on the charts would be
correct. This is the lowest level of water expected in that area and is usually the level at
lowest astronomical tide (LAT) or mean low water springs (MLWS) (Figure 34).
44 I Loss Prevention: Towards Effective NavigationTide tables would take this level as zero and any height of tide calculated would be above
this CD.
If at a particular location the charted depth is 5m, and the height of tide was calculated
to be 1.2m, the actual depth of water at that location, at that time, would be 6.2m.
Chart height datum
Chart Height Datum (CHD) is the level of water from which all heights of objects are marked
on the chart. It is the highest level of water expected in that area and is usually the level at
highest astronomical tide (HAT) or mean high water springs (MHWS). See Figure 34 where
CHD is shown by a light green dotted line.
If at a particular location the charted height of an object is 15m, and the height of tide was
calculated to have fallen below CHD by 0.8m, the actual height of that object visible at
that time would be 15.8m.
Drying heights
The part of the coast that lies between the CD and CHD is called a drying bank (Figure 34).
The rock marked X in the sketch is said to be awash – it is at the water level at CD.
The rock marked Y in the sketch has 0m height above CHD but 1.4 m of it is visible above
water at CD. Such a rock will be marked on the chart as ‘Dries 14’ or ‘Dries 1.4’.
Figure 34
Loss Prevention: Towards Effective Navigation I 45CHART SYMBOLS
Symbols are used on charts to depict locations of various navigational marks or hazards.
Chart no: INT 5011, published by the United Kingdom Hydrographic Office (UKHO),
contains ‘Symbols and abbreviations’ used on charts.
Some important symbols:
1. Rocks
International symbols Description International symbols
Figure 35
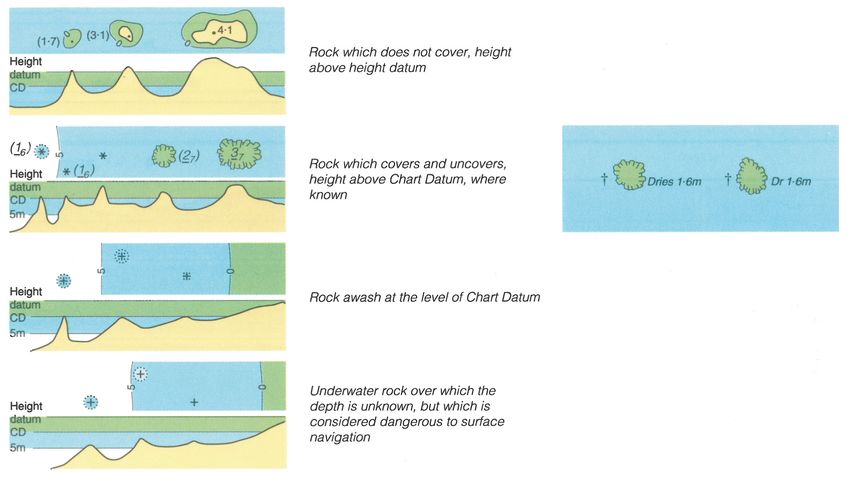
46 I Loss Prevention: Towards Effective Navigation1. Rocks (continued)
International symbols Description International symbols
Figure 36
Loss Prevention: Towards Effective Navigation I 472. Wrecks
International symbols Description International symbols
Figure 37
48 I Loss Prevention: Towards Effective Navigation2. Wrecks (continued)
International symbols Description International symbols
Figure 38
Loss Prevention: Towards Effective Navigation I 493. Obstructions
International symbols Description International symbols
Figure 39
50 I Loss Prevention: Towards Effective Navigation4. Offshore installations, cables and pipelines
International symbols Description International symbols
Figure 40
Loss Prevention: Towards Effective Navigation I 51CHART CATALOGUES AND FOLIOS
Chart catalogue
A chart catalogue is a list of charts and publications available.
A chart catalogue is published by an office authorised by the government of a country:
I n the USA, it is the National Oceanic and Atmospheric Administration (https://www.
noaa.gov/).
I n the UK, it is the United Kingdom Hydrographic Office (www.gov.uk/government/
organisations/uk-hydrographic-office).
In India, it is the National Hydrographic Office (www.hydrobharat.nic.in).
Chart catalogues are updated and published annually to cover a calendar year.
Contents of chart catalogues
Chart catalogues give information on:
omprehensive reference in textual and graphical form of charts and publications
C
available.
Details of electronic charts available.
Full details of each chart – title, number, scale, coverage, and price.
Full details of each publication – title, number, area covered, and price.
Regional listing for easy reference with a composite index.
List of distributors worldwide.
ontact details of hydrographic offices in various countries, availability of Notices to
C
Mariners and consultancy services offered.
Chart folio
A chart folio is a group of charts kept together usually in a canvas or cloth cover. Chart
folios may be grouped either according to their distinct numbers or according to their
sequence of use along a coast.
52 I Loss Prevention: Towards Effective NavigationBy distinct numbers
Publishers and suppliers of charts may find it convenient to group charts by their distinct
numbers so that they can be easily found when required. However, it is possible that chart
numbers 845 and 846 do not cover adjacent areas. They may be in different parts
of the world!
By sequence of use
Ships’ officers prefer to store charts according to geographic location and in a possible
sequence of use. Since paper charts are heavy, more than 50 charts in a folio would
make it bulky and inconvenient.
Usefulness to navigators
Ships’ folios contain only charts of ports and areas in which the ship is expected to ply.
They do not contain all the charts available in that region. For example, if a ship expected
to ply from Singapore to Manila, charts covering ports en route, such as those on the
western coast of Borneo or the eastern coast of Vietnam need not be on board. Unnecessary
charts on board will increase the cost of acquisition and will burden the navigating officers
with keeping them correct and up-to-date. All charts on board must be kept correct and
up-to-date, though priority must be given to charts that would be used in the immediate
passage. The officers may name the folios in a way that is convenient for their trading
areas so that handling of the folios is easy.
When voyage orders are received, the navigating officer only has to pull out the concerned
folio and ensure that the required charts are on board and also correct and up-to-date.
Loss Prevention: Towards Effective Navigation I 53Chapter 4
Introduction To ECDIS
An Electronic Chart Display and Information System (ECDIS) is a computer-based
electronic navigation system that uses a screen to show the position of the vessel
superimposed on a chart image to assist with route planning and monitoring. The
display is both, dynamic and automatic in that it changes as the ship moves along its
track on the chart, without any intervention by the navigating officer.
An ECDIS needs to comply with the International Maritime Organisation (IMO)
Performance Standards and when provided with adequate back up arrangement as per
the requirements of the Flag Administration, can be used as an alternative to paper
nautical charts.
Electronic Charts
There are two types of electronic charts:
1. Raster charts -
These charts are exact scanned, digital copies of paper charts used for marine
navigation, produced in a raster (bitmap) format. The user may be allowed to zoom in
and out of the raster chart where possible. However, due caution must be exercised
when zooming in, as raster charts may be images of small scale charts and relevant data
as required by the large scale chart of that area may not be reflected in the small scale
raster chart.
2. Vector charts –
These charts are digitally constructed and contain varied navigational information such
as coastal features, objects on land, soundings and depth contours, navigational buoys,
racons, lights and wrecks etc. Each of these pieces of information are stored in separate
databases with each such database available as an individual overlay on the basic chart.
Electronic Navigation Charts (ENC)
ENCs are vector charts that meet the criteria specified by IMO and International
Hydrographic Organisation (IHO) for use on an ECDIS.
Electronic Chart Systems (ECS)
ECS is the generic name for digitised charts that do not meet the IMO Performance
Standards prescribed for ECDIS. These can include terrestrial Global Positioning Systems
(GPS) sets that have been fitted before the IMO specifications came into force and are
therefore not approved for marine navigation. The use of these systems is not
54 I Loss Prevention: Towards Effective Navigationrecommended.
Although IMO standards require that ECDIS must work on ENCs, they may operate in a
Raster Chart Display System (RCDS) mode in locations of the world not covered by ENCs,
provided that the RCDS meet the standards prescribed by the IHO.
Salient features of an ECDIS:
Real time availability of vessel’s position, course, heading and speed.
Bespoke display picture can be set up upon an operator’s preference by ‘on-demand’
display of additional chart layers.
Seamless transfer between charts.
T extual information related to navigation and other chart symbols is available.
Information on charted objects can be obtained by clicking them.
larms or indication with respoect to the information diaplyed or malfunction of the
A
equip
larms or indications with respect to the information displayed or malfunction of the
A
equipment are provided.
wn vessel’s symbol commensurate with the scale in use. On small scale charts, or
O
when large scale charts are zoomed out, the symbol for own vessel would be as
shown below in fig 1 with the centre indicating the conning position. On large scale
charts, or when small scale charts are zoomed in, the symbol for own vessel would be
as shown in fig 2.
Fig.1 Fig.2
Figure 1 Figure 2
Loss Prevention: Towards Effective Navigation I 55Advantages of using an ECDIS:
ith real time availability of position, course, heading and speed, progress of own
W
vessel along an intended track can be monitored continuously and corrective action
taken with minimal delay.
n ECDIS is useful for voyage planning and for scanning the intended route for
A
possible hazards and dangers. Admiralty List of Radio Signals.
n ECDIS may also display additional navigation related information from relevant
A
nautical publications, such as Sailing Directions, Port Approach Guides and relevant
maritime safety information from sources like Navtex, when integrated and
compliant to relevant standards.
n ECDIS compiles and coherently presents navigational data; however, it is not
A
designed to be a standalone collision avoidance instrument as it usually does not
indicate Closest Point of Approach (CPA), Time of Closest Point of Approach (TCPA)
and trial manoeuvres etc. These aspects are available on a Radio Detection and
Ranging (RADAR) / Automatic Radar Plotting Aid (ARPA). Nonetheless, many
modern ECDIS receive integrated feeds from compliant RADAR/ARPAs in additional
to information from Automatic Identification System (AIS).
E CDIS also include an important feature of voyage recording. This data can be useful
in an incident investigation as well as for internal training purposes.
E CDIS are most useful with regard to the ‘Anti-grounding’ function that has
parameters that can be set as follows:
afety depth – A safe depth based on the vessel’s draft and a safe under keel
S
clearance. The ECDIS will highlight spot soundings on the display equal to or
less than the set value.
afety contour – A safety contour to generate an anti-grounding alarm. The
S
safety contour effectively works as an outline which marks the division
between safe and unsafe waters.
ime warning before grounding - The interval to sound an alarm before
T
which the vessel will cross into water shallower than the safety contour.
56 I Loss Prevention: Towards Effective NavigationChapter 5
Nautical publications
Important nautical publications
In addition to the chart catalogue, navigational charts, Nautical Almanac and nautical
tables, the important nautical publications on a ship’s bridge are:
Admiralty Sailing Directions.
Admiralty List of Lights and Fog Signals.
Admiralty List of Radio Signals.
Admiralty Tide Tables.
Mariner’s Handbook.
Ocean Passages for the World.
Admiralty Distance Tables.
The chart catalogue, explained in the previous chapter, gives details of each of these
publications.
Figure 41
The UK Admiralty publishes a booklet called ‘How to Keep Your Admiralty Products
Up-to-Date’ which gives detailed instructions (Figure 41).
Loss Prevention: Towards Effective Navigation I 57Admiralty Sailing Directions
Admiralty Sailing Directions, also called ‘British Admiralty Pilot Books’ or ‘Pilot Books,’
are published by the UKHO.
There are 75 volumes covering all navigable areas in the world. Each volume covers a
different geographic area and is given a distinctive number and name.
For example, Figure 42 shows the area of coverage of each pilot volume:
NP33 – Philippine Islands Pilot.
NP021 – Bay of Bengal Pilot.
B
A
Figure 42
Purpose
Pilot Books provide complete information on navigational hazards, buoyage systems,
pilotage, local regulations, general notes on countries, port facilities, seasonal currents,
ice and climatic conditions. Before planning a passage, and also while on passage, you
must consult Pilot Books, other navigational publications, and the navigational charts
of the relevant areas.
58 I Loss Prevention: Towards Effective NavigationUpdates
Section IV of the weekly editions of Admiralty Notices to Mariners (WANM), include any
corrections, if any, of immediate importance for each volume of the Pilot Books.
Figure 43 Figure 44
The Admiralty recommends that you cut out the correction from the WANM and paste it in
the relevant page of the Pilot Book. It is then called a ‘paste up’. The reference number of the
notice should be entered near the paste up. The pasting is usually done in a way that does
not obscure the original words of the book. One end of the ‘paste up’ is stuck on the margin
of the page so that it is like a flap (Figures 43 and 44). The superceded lines of the original
text are scored out in pencil and the reference number of the correction stated next to it.
Loss Prevention: Towards Effective Navigation I 59Minor corrections can be written in by hand but notation of the WANM number must be
entered in the margin alongside. You have to maintain a record (as shown in Figure 45),
of each correction made, on the inside cover of the Pilot Book for verification by various
authorities.
NP 44
RECORD OF AMENDMENTS
The table below is to record Section IV Notices to
Mariners amendments affecting this volume.
Sub-paragraph numbers in the margin of the body of
the book are to assist the user when making
amendments to this volume Weekly Notices to
Mariners (Section IV)
Figure 45
60 I Loss Prevention: Towards Effective NavigationWhen a large number of corrections are necessary, the Admiralty publishes supplements
which are small booklets. Each supplement cancels the previous one. For example, when
supplement no. 2 is received, supplement no. 1 is to be discarded after writing ‘Obsolete’
on its cover.
New editions are published when necessary and intimation is given through the WANM.
Admiralty List of Lights and Fog Signals
The Admiralty List of Lights and Fog Signals (ALLFS) consists of 14 volumes covering all
navigable areas in the world. Each volume covers a different geographic area and is given
a distinctive alphabet A to P (there is no I and O) and a name. For example, see Figure 47
– Volume E: West Mediterranean.
Vol A - NP74 British Isles and North coast of France Vol G - NP80 Western side of South Atlantic Ocean and East Pacific Ocean
Vol B - NP75
Vol C - NP76
Southern and Eastern sides of the North Sea
Baltic Sea FigureVol H - NP81 Northern and Eastern coasts of Canada
Vol 47
J - NP82 Western side of North Atlantic Ocean
Vol D - NP77 Eastern Atlantic Ocean, Western Indian Ocean, Vol K - NP83 Indian and Pacific Oceans, south of the Equator
Arabian and Red Seas Vol L - NP84 Northern Seas
Purpose
Vol E - NP78 West Mediterranean Vol M - NP85 Western side of North Pacific Ocean
Vol N - NP86 East Mediterranean and Black Seas
Vol F - NP79 North-East Indian Ocean, Central part of South China and Eastern
These volumes provide extensive information on Vol all lighthouses,
P - NP87 North part of South lightships,
Archipelagic Seas (North of the Equator), excluding China, lit floating
China and Eastern Archipelagic Seas, marks
plus Western part of East China, Philippine and Yellow Seas,
and South-West part of Philippine Sea
(over 8m in height), fog signals and other lights of navigational significance.
including Taiwan Strait and Eastern part Each publication
of Gulf of Tonkin
also gives the characteristics of lights and fog signals, together with the equivalent foreign
language descriptions of lights. Tables are included to calculate the geographical and
luminous ranges of lights (this will be explained later). Details for all lights listed include
the international number, location and/or name, geographical co-ordinates, characteristics
and intensity, elevation in metres, range in nautical miles and description of structure.
Loss Prevention: Towards Effective Navigation I 61Updates
Corrections are given in Section V of the WANM and the procedure for correction and
record-keeping is exactly the same as for Pilot Books. Since many changes occur in the
contents, new editions are published at intervals of 12 months, one volume every month
and intimation is given in Section I of WANM.
Admiralty List of Radio Signals
The Admiralty List of Radio Signals (ALRS) provides comprehensive information on all
aspects of maritime radio communications. The data is organised into six volumes, some
divided into several parts for ease of handling. Each of the six volumes is presented in a
user-friendly format with full colour photographs and figures.
The six volumes are:
Volume 1 – (Parts 1 and 2) – Maritime Radio Stations.
Volume 2 – Radio Aids to Navigation, Differential GPS (DGPS), Legal Time,
Radio Time Signals and Electronic Position Fixing System.
Volume 3 – (Parts 1 and 2) – Maritime Safety Information Services.
Volume 4 – Meteorological Observation Stations.
Volume 5 – Global Maritime Distress and Safety System (GMDSS).
Volume 6 – (Parts 1–8) – Pilot Services, Vessel Traffic Services and Port Operations.
Purpose
The contents of ALRS range from a complete listing of stations handling maritime public
correspondence to a full range of products and services essential for compliance with
the Global Maritime Distress and Safety System (GMDSS). The volumes also feature radio
stations broadcasting weather services and forecasts and a detailed explanation of the
complexities of Global Satellite Position Fixing Systems. ALRS are presented in a user-
friendly format.
Updates
ALRS volumes are updated through Section VI of the WANM and the procedure for correction
and record-keeping is exactly the same as for Pilot Books. New editions are published annually
containing all changes up to the date of publication.
62 I Loss Prevention: Towards Effective NavigationAdmiralty Tide Tables
Admiralty Tide Tables (ATT) contain tidal information of all ports in the world. They are
published in eight volumes (Figure 48):
Volume I – United Kingdom and Ireland (including European Channel Ports)
Volume 2 – North Atlantic Ocean and Arctic Regions
Volume 3 – Indian Ocean (including Tidal Stream Tables)
Volume 4 – South Pacific Ocean (including Tidal Stream Tables)
Volume 5 – South China Sea and Indonesia (including Tidal Stream Tables)
Volume 6 – North Pacific Ocean (including Tidal Stream Tables)
Volume 7 – South West Atlantic Ocean and South America
Volume 8 – South East Atlantic Ocean, West Africa and Mediterranean
(including Tidal Stream Tables)
LIMITS OF ADMIRALTY TIDE TABLES
160° 120° 80° 40° 0° 40° 80° 120° 160°
VOL 2 VOL 2 VOL 2
70° 70°
VOL 1
VOL 6 VOL 6
40°
VOL 2 40°
VOL
0°
5 0°
VOL 3
VOL 4
40° 40°
VOL 7 VOL 8
VOL 4
160° 120° 80° 40° 0° 40° 80° 120° 160°
Figure 48
Loss Prevention: Towards Effective Navigation I 63Purpose Tide tables are useful when it is necessary to calculate the actual depth of water available at a place to ensure safe passage of your ship over that area. Updates Tide tables are published for each calendar year, a few months before 1 January. Any corrections to the volumes are given in WANM no. 1 of that year. Note: Pilot Books, ALLFS and ATT consist of a considerable number of volumes each. All ships do not carry all the volumes. Each ship carries only those volumes that cover its anticipated area of trade. This will avoid unnecessary costs and also save efforts in correction of volumes that are not going to be used by that ship. Each volume is divided into three parts: Part I covers important ports in that area designated as standard ports. The daily times and heights of High Water (HW) and Low Water (LW) and details for calculating intermediate times or heights are also provided. Part II covers a large number of less-important ports in that area designated as secondary ports. A number of secondary ports are based on a standard port nearby and the times and heights of HW and LW are obtained by applying a time and height difference to those at the standard port. Part III contains ‘harmonic constants’ for tidal prediction by simplified harmonic method. 64 I Loss Prevention: Towards Effective Navigation
You can also read