Geo-engineering Reconnaissance of the 2010 Maule, Chile Earthquake
←
→
Page content transcription
If your browser does not render page correctly, please read the page content below
GEO-ENGINEERING EXTREME EVENTS
RECONNAISSANCE (GEER) ASSOCIATION
Turning Disaster in Knowledge

Geo-engineering Reconnaissance of the 2010 Maule,
Chile Earthquake
Report of the NSF Sponsored GEER Association Team

Editors:
Jonathan Bray and David Frost

GEER Team Leaders:
Jonathan Bray, UC Berkeley; David Frost, Georgia Tech; Ramon Verdugo, Universidad de Chile;
Christian Ledezma, Pontificia Univ. Católica de Chile; and Terry Eldridge, Golder Associates

Lead Authors:
Pedro Arduino, Univ. of Washington; Scott Ashford, Oregon State Univ.;Dominic Assimaki, Georgia
Tech; Jonathan Bray, UC Berkeley; Terry Eldridge, Golder Assoc.; David Frost, Georgia Tech; Tara
Hutchinson, UC San Diego; Laurie Johnson, Laurie Johnson Consulting; Keith Kelson, Fugro William
Lettis & Assoc.; Robert Kayen, US Geological Survey; Christian Ledezma, Pontificia Univ. Católica de
Chile; Robb Moss, California Polytechnic State Univ. San Luis Obispo; George Mylonakis, Univ. of
Patras; Scott Olson, Univ. of Illinois; Kyle Rollins, Brigham Young Univ.; Nicholas Sitar, UC Berkeley;
Jonathan Stewart, UC Los Angeles; Alfredo Urzúa, Prototype Engineering Inc.; Ramon Verdugo,
Universidad de Chile; Rob Witter, DOGAMI; and Nick Zoa, Univ. of Maryland

Contributing Authors:
Rodrigo Betanzo, Universidad de Concepcion; Ramon Boroschek, Universidad de Chile; Gabriel Candia,
UC Berkeley; Leonardo Dorador, Universidad de Chile; Aldo Faúndez, Servicio de Salud Arauco;
Gabriel Ferrer, Pontificia Univ. Catolica de Chile; Lenart González, Golder Assoc.; Katherine Jones, UC
Berkeley; Dong Youp Kwak, UC Los Angeles; Jaimé Salazar Lagos, Burgos Arquitectos; José Miguel
Lopez, Vale Exploraciones; Walter Lopez, UC Los Angeles; Claudio Medina, Golder Assoc.; Eduardo
Miranda, Stanford Univ.; Gonzalo Montalva, Universidad de Concepcion; Sebastian Maureira,
Universidad de Chile; William Siembieda, California Polytechnic State Univ. San Luis Obispo;
Constanza Tapia, Pontificia Univ. Catolica de Chile; Mesut Turel, Georgia Tech; Ramon Verdugo,
Universidad de Chile; and Claudia Welkner, Golder Assoc.

                     GEER Association Report No. GEER-022
                                      Version 1: April 15, 2010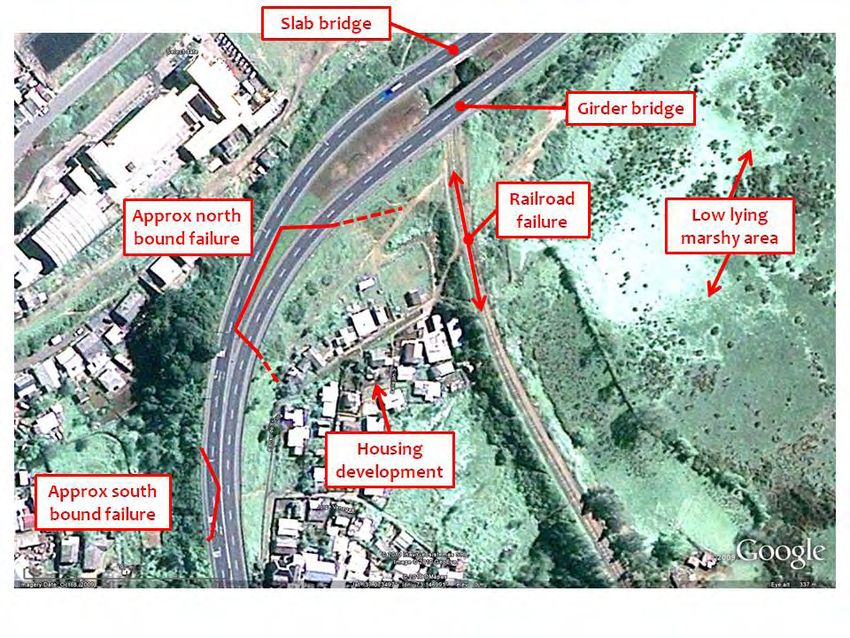
NSF AWARD ACKNOWLEDGMENT

The information contained in this report is based upon work supported by the National Science
Foundation through the Geotechnical Engineering Program under Grant No. CMMI-Proposal
No. 1034831. Any opinions, findings, and conclusions or recommendations expressed in this
material are those of the authors and do not necessarily reflect the views of the NSF. The
recommendation of support of this RAPID proposal by the NSF Geotechnical Engineering
Program Director, Dr. John L. Daniels, is greatly appreciated.

The GEER Association is made possible by the vision and support of the NSF Geotechnical
Engineering Program Directors: Dr. Richard Fragaszy and the late Dr. Cliff Astill. GEER
members donate their time, talent, and resources to collect time-sensitive field observations of
the effects of extreme events. The GEER Association web site, which contains additional
information, may be found at:

                               http://www.geerassociation.org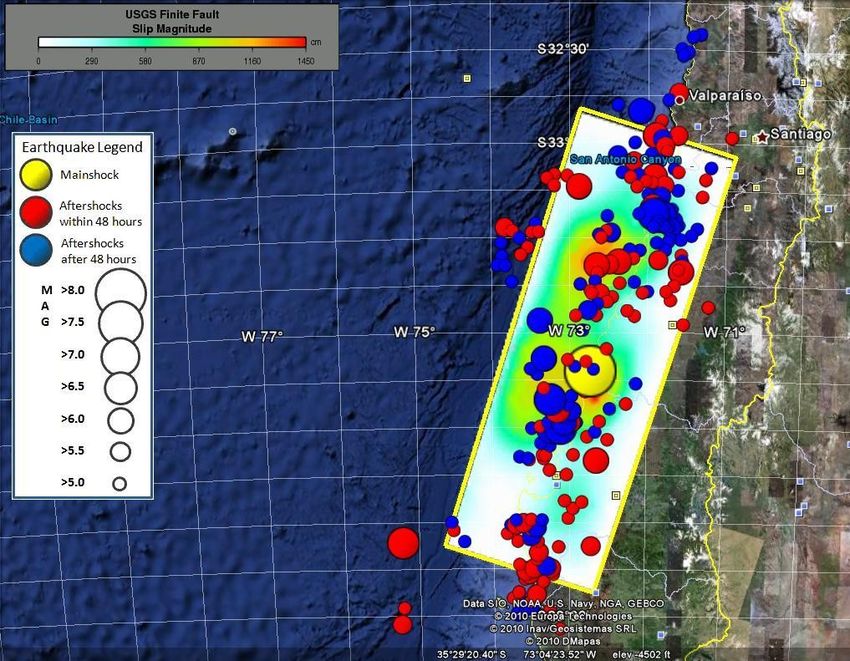
Acknowledgments and Collaborations

Extreme Event Reconnaissance is a challenging activity that requires extremely careful planning and
implementation. Safety is always of paramount importance. In many cases, the hazards are not just the
result of already existing collapses but are just as likely to be the result of additional extreme events such
as earthquake aftershocks or delayed collapse of already weakened infrastructure systems due to ongoing
rescue and recovery activities. To ensure that individuals participating in such reconnaissance activities
due so with the utmost attention to safety, GEER has developed a culture of safety and collaboration as it
plans and implements its activities and considers these two factors to be critical components of their
work. The response to the February 27, 2010 Maule, Chile event was no exception to this approach and
thus GEER is particularly grateful for the collegial interactions and collaborations it had with a variety of
organizations both within the US as well as in Chile in support of the individuals deployed there. The
collaborations and cooperation with the following organizations is most gratefully recognized:

U.S. National Science Foundation (NSF)
U.S. Geological Survey (USGS)
Earthquake Engineering Research Institute (EERI)
Pacific Earthquake Engineering Research Center (PEER)
Tsunami Ocean Sciences Group (TOSG)
Mid-America Earthquake Center (MAE)
American Society of Civil Engineers (ASCE)
Universidad de Chile
Pontificia Universidad Católica de Chile
Universidad de Concepción
CODELCO, Vicepresidencia de Proyectos
Golder Associates
Burgos Arquitectos
Vale Exploraciones
Chilean Air Force
Dr. Rafael Avaria, Hospital Curanilahue

The assistance of Karina Morales, Universidad de Concepcion with accommodation and logistics for team
members in Concepcion and Gabriela Mesias, Golder Associates Santiago with overall logistics and
meeting planning was invaluable. The support of Gustavo Peters who devoted significant time to safely
driving team members in and around Concepcion is also appreciated. Coordination with Dr. Jack Moehle
of UC Berkeley, who led the EERI LFE team, and with Dr. Steve Mahin of UC Berkeley, who is the
Director of the PEER Center, was very helpful. Finally, the assistance and guidance of Interim NSF
Program Director, Dr. John Daniels in recommending support of the RAPID Proposal submitted by
Jonathan Bray, UC Berkeley, and David Frost, Georgia Tech, to fund the response of the GEER Teams in
Chile is recognized. His early recognition of both the scale of this event as well as its relevance to future
similar events in the US enabled a timely and effective response from GEER. Finally, the careful
reviewing and format homogenizing of Paula Fowler, Georgia Tech significantly enhanced the final
report and is much appreciated.
Executive Summary

         The February 27, 2010 Maule, Chile earthquake (Mw = 8.8) is the fifth largest earthquake to occur
since 1900. Its effects were felt along 600 km of the central Chile coast. Initial field observations suggest
that tectonic displacement of the hanging wall produced both uplift of over 2 m and subsidence of up to 1
m in coastal regions. The tsunami initiated by the rupture devastated parts of the coast and killed hundreds
of people. Strong shaking lasted for over a minute in some areas, and widespread damage occurred in
some cities. A large number of significant aftershocks contributed additional damage to an already fragile
infrastructure.
         The earthquake tested numerous modern structures and facilities. Most of these systems
performed well, although some did not. Most often, poor performance resulted from construction
deficiencies or oversights in the design process related to structural detailing or recognition of
geotechnical effects, such as liquefaction.
         This major earthquake was the subject of several post-earthquake reconnaissance efforts. This
report presents the observations of the NSF-sponsored Geo-engineering Extreme Events Reconnaissance
(GEER) team. GEER team members included engineers, geologists, and scientists from Chile and the
United States. The GEER team worked closely with other reconnaissance teams, including EERI, USGS,
NIST, FEMA, TOSG, PEER, and ASCE, amongst others, to document the geotechnical effects of this
significant event so that our understanding of earthquakes can be improved and we may turn disasters
such as this one into knowledge for advancing societal resilience.
         In this report, key observations were carefully documented and geo-referenced with the use of
GPS and other geospatial tools such as Google Earth. A selected number of critical sites were further
characterized using advanced tools, such as LiDAR, SASW, and DCPT. Reconnaissance was performed
remotely using satellite imagery, efficiently through aerial reconnaissance, and in detail through
coordinated ground-based reconnaissance studies.
         This report includes a brief summary of engineering seismology and earthquake ground motions
for this event, a description of the use of remote sensing to provide insight into damage patterns, and an
in-depth discussion of the important role of coastal uplift and subsidence resulting from the underlying
tectonic movement. Localized damage patterns observed during the 2010 Chile earthquake and findings
from previous earthquake studies indicate that seismic site effects were also important in this earthquake.
         Soil liquefaction occurred at many sites, and often led to ground failure and lateral spreading. Of
special interest are the effects of liquefaction on the built environment. Several buildings were damaged
significantly due to foundation movements resulting from liquefaction. Liquefaction-induced ground
failure displaced and distorted waterfront structures, which adversely impacted the operation of some of
Chile’s key port facilities. Critical lifeline structures, such as bridges, railroads, and road embankments,
were damaged by ground shaking and ground failure. The damage to some sections of Ruta 5, the primary
North-South highway in Chile, was pervasive, which disrupted the flow of supplies and traffic following
the event.
         Most dams, levees, and mine tailings dams performed well. However, several key earth structures
experienced some distress, and in one case a liquefaction-induced tailings dam failure produced a flow
slide that killed a family of four. Most earth retention systems, such as retaining walls and basement
walls, proved to be inherently robust. Landsliding was not pervasive, which appears to have resulted from
native slopes that are generally composed of competent earth materials and the relatively low
groundwater levels present at the end of the dry season.
         All of these consequences impact how society responds to, plans for, and rebuilds after a major
earthquake, which will occur again in this region and other regions such as the Pacific Northwest. GEER
team urban planners, geologists, and engineers documented the impacts of the geologic and tsunami
hazards and identified the challenges and opportunities that will confront Chile as it rebuilds and
addresses these hazards in the future. Careful documentation of the geotechnical effects of the 2010 Chile
earthquake will enable advancements in the art and science of engineering that will save lives during the
next major event.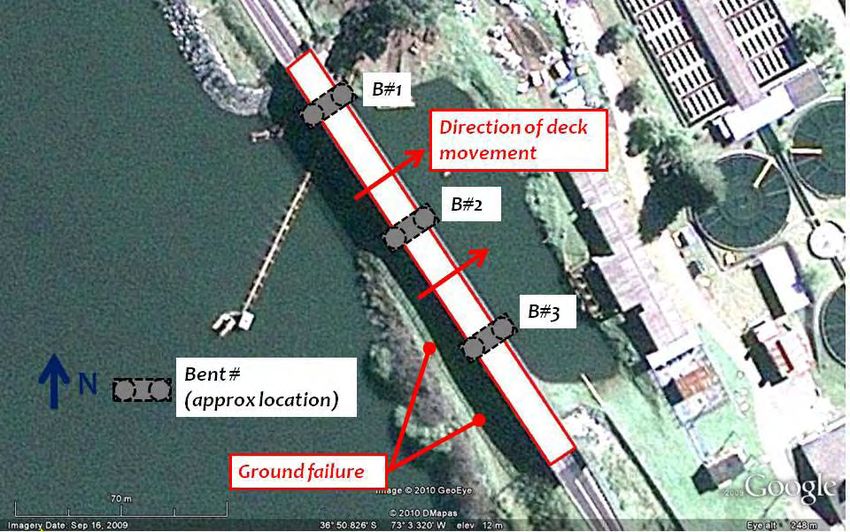
2.0 ENGINEERING SEISMOLOGY AND EARTHQUAKE GROUND MOTIONS

2.1 Tectonic Setting

The information presented in this section is derived from the USGS “Earthquake Summary” web site
page at: http://earthquake.usgs.gov/earthquakes/eqinthenews/2010/us2010tfan/#summary. Additional
information on the geology in the region affected by the 2010 Mw=8.8 Chile earthquake is presented in
Section 3 of this report.

The February 27, 2010 Mw = 8.8 Offshore Maule, Chile earthquake occurred in a subduction zone in
which the Nazca plate passes eastward and downward beneath the South American plate. The rate of
convergence of the two plates is 70 mm/year.

Human inhabitants of the Chilean coast report numerous major prior events in this region. One of the first
recorded events was a shock near Concepción in 1562. Another earthquake in 1570 triggered a tsunami
that led Spaniards to rebuild Concepción on higher ground. Earthquakes in 1730 (apparently near
Valparaíso) and 1751 (Concepción) generated tsunamis that caused flooding and damage in Japan. The
effects of an 1835 earthquake near Concepción were observed by Charles Darwin and Robert Fitz-Roy. A
1906 earthquake near Valparaíso of magnitude 8.2 generated a tsunami that produced run up heights in
Hawaii as great as 3.5 m. The southern extent of that earthquake overlaps with the northern extent of the
2010 event. To the south of the 2010 earthquake zone is the source of the giant 1960 earthquake of
magnitude 9.5, which was the largest 20th earthquake world-wide. Since 1960, the largest event prior to
the 2010 earthquake was a magnitude 8.0 earthquake north of Valparaíso in 1985. That event generated a
Pacific Ocean tsunami that reached heights of 9 m on the Chilean coast near Coquimbo and affected boats
in Hawaii.

A recent paper authored by Ruegg et al. (2009) identified the Concepción–Constitución area (S35o–S37o)
as a “mature seismic gap, since no large subduction earthquake has occurred there since 1835.” They
noted that the convergence of about 68 mm/year since the last large interpolate subduction earthquake of
1935 would have accumulated more than 10 m of displacement. Ruegg et al. (2009) warn, “Therefore, in
a worst case scenario, the area already has a potential for an earthquake of magnitude as large as 8–8.5,
should it happen in the near future.” Thus, earth scientists were aware of the potential for a large
earthquake in the south central Chile area.

2.2 Earthquake of February 27, 2010

The main shock occurred at 3:34 am local time on February 27, 2010. Its epicenter is located at S36.027 ,
W72.834       (http://earthquake.usgs.gov/earthquakes/eqinthenews/2010/us2010tfan/neic_tfan_cmt.php).
The USGS moment tensor solution indicates a seismic moment of 1.8×10²² N m, moment magnitude of
MW = 8.8, and hypocentral depth of 30 km. Based on the regional tectonics, the critical nodal plane from
the moment tensor solution strikes 14 west of due north and dips at 19 to the east.

Figure 2.1 shows a Google Earth image superimposed with the main shock location and aftershock
locations segregated by date (those within the first 48 hours of the event and those occurring
subsequently). Aftershocks within the first 48 hours are often assumed to result from redistribution of the
stress in the main shock rupture zone (e.g., Benioff, 1985; Kiratzi et al. 1985). Aftershock locations were
obtained from the USGS server. Most of the aftershocks occur in a region approximately 530 km long
(along strike) by 180 km wide. Figure 2.2 shows the aftershock distribution color-coded by depth along

                                                    3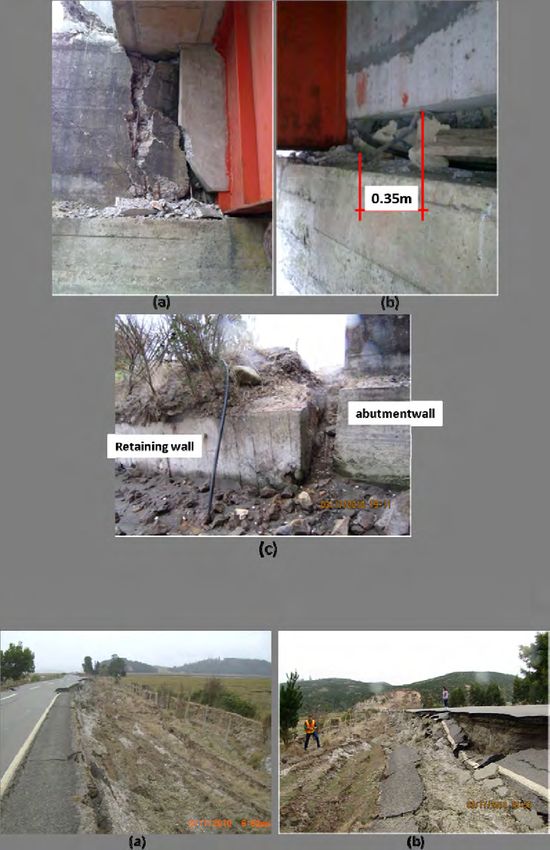
with a section of the aftershock pattern, which shows the dipping fault surface. The closest distance from
the fault to the coastal areas of Chile was approximately 25 km.

The surface projection of a finite fault model of the main shock generated by Gaven Hayes (image from
http://earthquake.usgs.gov/earthquakes/eqinthenews/2010/us2010tfan/finite_fault.php), which is based on
waveform inversion, is also shown on Figure 2.1. The rectangular model strikes at 17.5 west of north and
dips at 18.0 to the east. The seismic moment release based upon this plane is 2.39×1029+029 dyne cm. As
shown in Figure 2.1, there are two zones of high slip, with the maximum slip being approximately 1450
cm.

        Figure 2.1. Google Earth image superimposed with aftershock distribution (locations from USGS)
                     and fault plane solution from G. Hayes (obtained from USGS web page)

                                                      4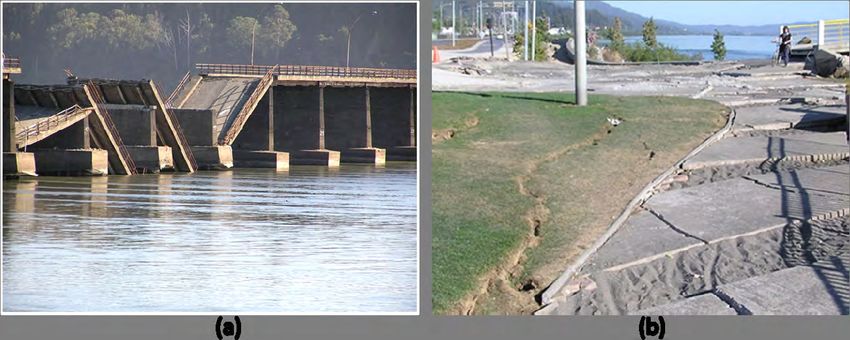
Figure 2.2. Aftershock distribution by depth. Star indicates hypocenter of main shock. Figure from
         USGS web page (http://neic.usgs.gov/neis/eq_depot/2010/eq_100227_tfan/neic_tfan_c.html).

2.3 Ground Motions

Seismograph networks in the portions of Chile that experienced strong ground motion from the Offshore
Maule earthquake are maintained by RENADIC (Red National de Acelerografos Departamento de
Ingenieria Civil, Universidad de Chile = National Network of Seismic Monitoring Devices – Department
of Civil Engineering, University of Chile) and Pontificia Universidad Católica de Chile (Catholic
University of Chile).

                                                       5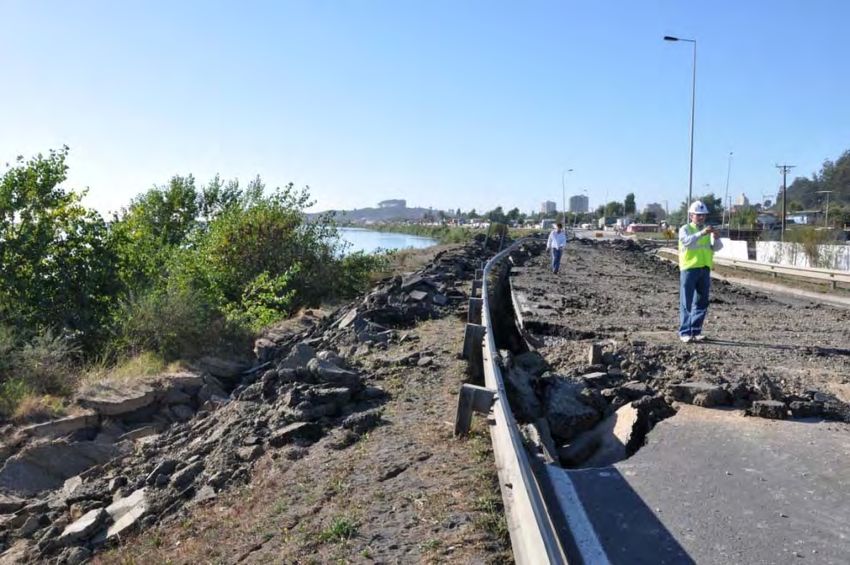
As of this writing, preliminary results from the RENADIC network have been released in a series of web
reports (http://www.terremotosuchile.cl/). However, the data released to date does not include geodetic
coordinates for the ground motion stations, digital acceleration files, or response spectra. Figure 2.3
shows locations of stations from the regions of Arica (Region I) and Valdivia (Region XIV) from the
RENADIC web site. The web site reports that there are 60 instruments within these regions, but we do
not know how many of these produced usable recordings.

          Figure 2.3. Locations of stations in the Arica (left) and Valdivia (right) regions maintained by
                                 RENADIC (http://www.terremotosuchile.cl/)

Plots of acceleration waveforms and response spectra have been released in PDF reports from selected
stations operated by RENADIC (i.e., Boroschek et al. 2010). Stations for which this information is
available are indicated in Table 2.1. An example of the type of records that are currently available in the
Boroschek et al. (2010) preliminary reports is shown in Figure 2.4.

We understand that the Pontificia Universidad Católica array is concentrated in Concepción, which was
strongly shaken by this event. There are unconfirmed reports that these stations did not record the main
shock or its principal aftershocks due to maintenance problems. However, no official reports on station
locations or data availability are available as of this writing.

                                                         6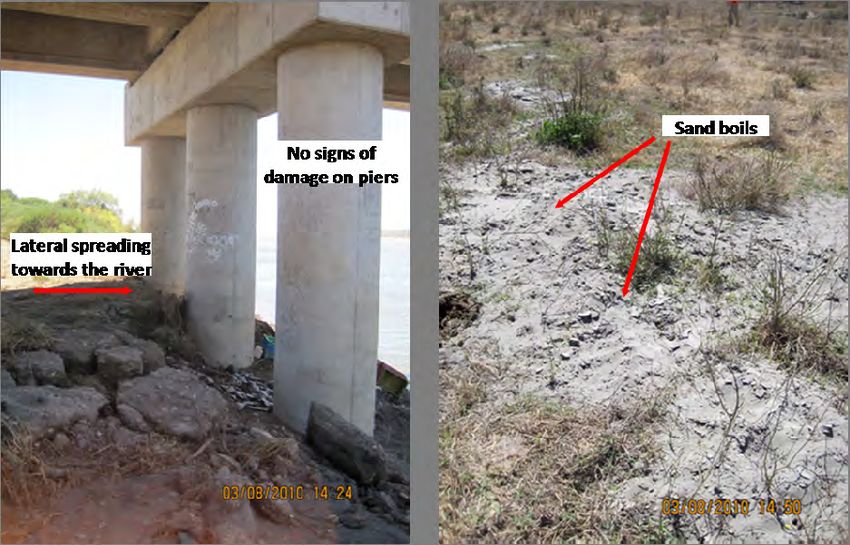
Table 2.1. Information on RENADIC strong motion data released in plots within PDF files as of this
                                 writing (Boroschek et al. 2010).

                         Station Name                            PHA (g)            PVA (g)
         Universidad de Chile Depto Ing. Civil (Interior           0.17                0.14
                      Edificio) Santiago
              Estación Metro Mirador Santiago                      0.24                0.13
                       CRS MAIPU RM                                0.56                0.24
                       Hosp. Tisne RM                              0.30                0.28
                   Hosp. Sotero de Río RM                          0.27                0.13
                         Hosp. Curico                              0.47                0.20
                        Hosp. Valdivia                             0.14                0.05
                 Vina del Mar (Marga Marga)                        0.35                0.26
                    Vina del Mar (Centro)                          0.33                0.19

Figure 2.4. Acceleration-time series recorded at the Hospital in Curico during the 2010 Mw=8.8 Chile Earthquake
                                             (Boroschek et al. 2010).

                                                      7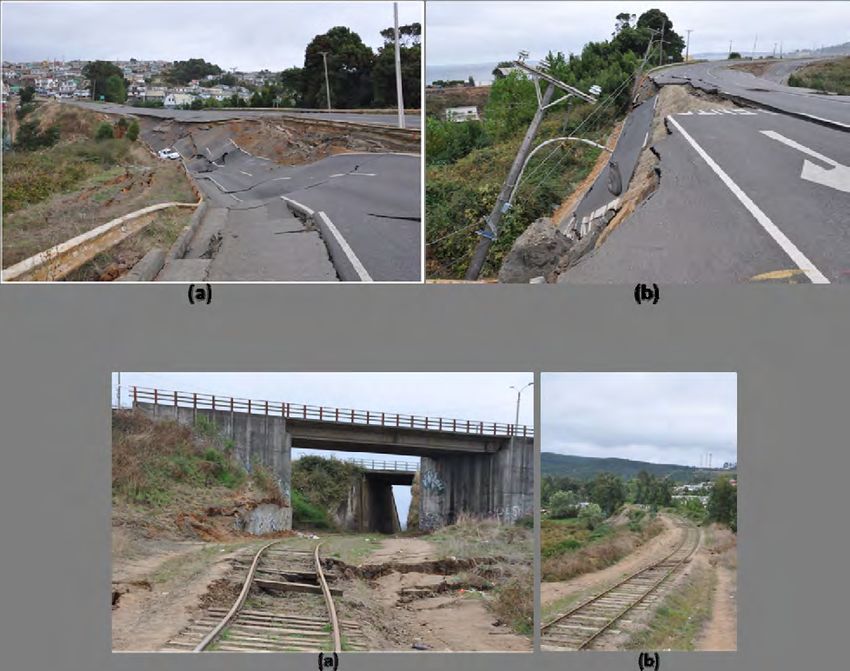
2.4 References
Benioff, H., 1955. Mechanism and strain characteristics of the White Wolf fault as indicated by the
aftershock sequence. In: “Earthquakes in Kern County, California, during 1952”. Calif. Dept. Nat. Res.
Div. Mines, Bull., 171, 199-202.
Boroschek, R., Soto, P., Leon, R., and Comte, D. (2010). “Informe preliminary, RED Nacional de
acelerografos, terremoto centro sur Chile, 27 de Febrero 2010,” Informe Preliminar No. 4, Facultad de
Ciencias Fisicas Y Matematicas, Universidad de Chile, 5 April 2010.
Kiratzi, A.A., Karakaisis, G.F., Papadimitriou, E.E. and Papazachos, B.C. 1985. Seismic source-
parameter relations for earthquakes in Greece. Pure Appl. Geophys., 123, 27-41.
Ruegg, J.C., Rudloff, A., Vigny, C., Madariaga, R., de Chabalier, J.B., Campos, J., Kausel, E., Barrientos,
S., and Dimitrov, D. (2009). “Interseismic strain accumulation measured by GPS in the seismic gap
between Constitución and Concepción in Chile.” Physics of the Earth and Planetary Interiors, 175, 78-
85.
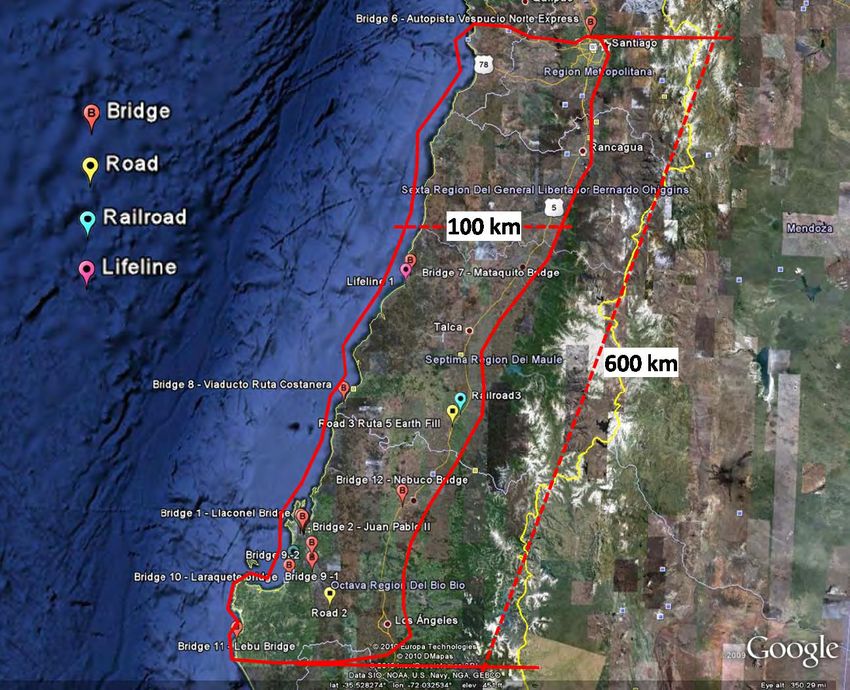
89.0 EFFECTS OF GROUND FAILURE ON BRIDGES, ROADS, RAILROADS, AND LIFELINE
SYSTEMS
9.1 Introduction
The February 27, 2010, the Mw=8.8 Chile earthquake caused significant damage to Chile’s infrastructure.
After the event, GEER personnel in cooperation with the University of Chile and Universidad Católica de
Chile visited the affected area and evaluated the seismic performance of bridges, roads, railroads, and
lifelines. Evaluation of this infrastructure required covering a large area (approximately 600km x 100km),
including several regions and metropolitan areas of Chile. Figure 9.1 shows a Google map indicating the
affected region and location of selected cases which are presented in this section.
Figure 9.1. Area covered by GEER reconnaissance team and location of select bridge, road, railroad, and lifeline
cases described in this section.
Chile’s two largest urban centers (Santiago and Concepción) are within the area impacted by this
earthquake. These cities are connected by an important highway network, which runs primarily in the
north-south direction (main highway Route 5). Moreover, due to its geographic characteristics, a large
number of rivers that run predominantly in the east-west direction are in this region. Therefore many
bridges, roads, railroads and water crossings are present in this area and were affected by earthquake
strong shaking.
151Most bridge structures performed well during the earthquake. From a geotechnical perspective, the most
significant bridge damage appeared to be associated with lateral spreading or strong shaking. Certainly,
the most sizable failures were near river crossings along the coast where several bridge spans became
unseated (e.g., in Tupul and Concepción), which were subjected to both lateral spreading and strong
shaking. However, strong shaking appeared to be the cause of most widespread damage, including a large
number of overcrossings along Route 5 inland, as well as a number of underpasses and connectors in
Santiago. The strong shaking in many of these cases appeared to be related to seismic site effects (e.g.,
local soil conditions or subsurface topography), as the damage appeared to be quite localized and nearby
similar structures were undamaged (e.g., Quilicura area of Santiago or near Ercilla along Route 5 in the
south). While damage was widespread to these smaller bridge structures, in general they performed well
in that few totally collapsed onto the underlying roadway. Those that did completely collapse within the
inland areas along Route 5 may be attributed to older construction and poor detailing.
Retaining walls, MSE walls, and tie-back walls associated with transportation structures, including bridge
abutments, appeared to perform well throughout the affected region. Even in locations of significant
lateral spreading, which caused considerable damage, bridge abutments performed well.
Widespread damage was observed in roads. Perhaps the most widespread geotechnical related issue was
associated with settlement of compacted earth fills throughout the affected region. While there were
isolated cases of embankment fill failures resulting in the closure of roadways (e.g., in and north of Lota),
most noticeable were the patches of gravel quickly placed after the earthquake to compensate for
settlement of bridge approach fills and culvert backfills. While generally not a life safety concern, these
widespread settlements were a nuisance, leading to traffic problems.
Railroads were also damaged during the earthquake. The most common failure was associated with
embankment loss of stability due to ground shaking, loss of rail alignment, and unseated railroad bridges
Nevertheless, in most cases the damage appeared to be limited and repairable, indicating good railroad
performance despite the strong shaking that affected the region.
The following sub-sections of this section of the report include brief descriptions of selected bridge,
roads, and railroad damage cases investigated by the GEER team during its visit in March 2010.
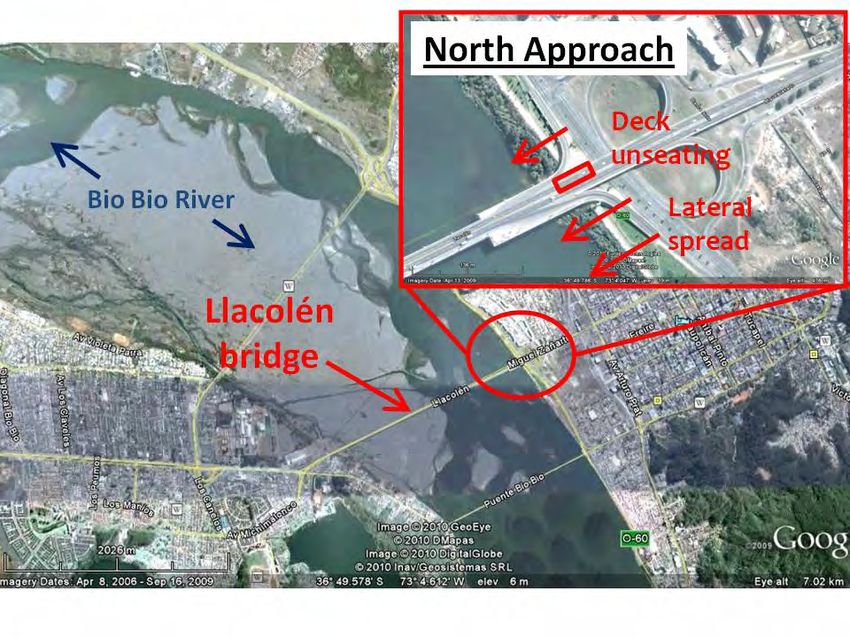
9.2 Llacolén Bridge (north approach), the Middle Bridge across the River Bio Bio in Concepción
The observed damage at the north approach of the Llacolén Bridge (S36.830108°; W73.067991°) suffered
deck unseating and lateral spreading.
Lateral spreading ground was observed at the Llacolén Bridge in Concepción on the North approach
shore (Figure 9.2). The Llacolén Bridge in Concepción was constructed in 2000 and spans 2,160 m across
the Bio Bio river supporting four lanes of vehicular as well as pedestrian access to downtown Concepción
(Figure 9.3). Ground damage at the north approach area was observed to extend inland into the
southbound traffic lane of Calle Nueva road and south below the bridge’s exit ramp continuing along a
pedestrian walkway (Figure 9.4). Calle Nueva parallels the coastline and runs under the approach to the
bridge. The lateral spreading ground resulted in unseating of the west and east bound traffic support deck
(Figure 9.5). Flexural cracks on the river-side face of the 1.5 m diameter support columns were observed
near the ground surface typically tightly spaced at approximately 0.10-0.20 m on center (Figure 9.6). The
distribution of flexural cracking was more severe for those columns supporting the unseated deck,
however, all columns at the north shoreline support observed flexural cracking at their construction joint
(between 2-2.5m above ground surface). Ground settlement of 0.25-0.30 m was also noted to surround
each of the exit ramp bents (Figure 9.7).
152Figure 9.2. Plan view of the Bio Bio river region locating the damaged region of the Llacolén bridge in Concepción
(S36.830108°, W73.067991°)
Figure 9.3 Elevation photograph of the Llacolén bridge in Concepción (S36.830108°, W73.067991°).
153Figure 9.4. Plan view of the North approach to the damaged Llacolén bridge in Concepción (S36.830108°,
W73.067991°).
Figure 9.5. Deck unseating at Llacolén bridge in Concepción. (note the temporary deck supporting approach traffic).
View South (S36.829707°, W73.068220°, 1809 hrs on 3/14/2010) and (b) view north (S36.830380°, W73.067541°,
1911 hrs on 3/14/2010).
154Figure 9.6. Substructure of the of the north approach to the damaged Llacolén bridge in Concepción showing the
unseated deck in the foreground. Flexural cracking of the column supports was observed at ground level and
extending to the construction joint (2-2.5m above ground) for all columns at this support (S36.830232°,
W73.068379°, 1936 hrs. on 3/14/2010).
Figure 9.7. Ground settlement surrounding an exit ramp support bent at the Llacolén bridge in Concepción
(S36.830380°, W73.067541°, 1901 hrs. on 3/14/2010).
9.3 Juan Pablo II Bridge, the North Bridge across the River Bio Bio, in Concepción
The Juan Pablo II Bridge (S36.815864°; W73.083674°), also known as Puente Nuevo (New Bridge), is
the longest vehicular bridge in Chile with a length of 2310 m. The damage observed here was lateral
spreading on the North East approach and liquefaction-induced settlements along the bridge (Figure 9.9a).
The Juan Pablo II Bridge, shown in Figure 9.8, connects the cities of Concepción and San Pedro de la Paz
across the Bio-Bio River. The bridge was designed by E.W.H Gifford & Partners and opened to the public
in 1974. The bridge consists of 70 spans (L = 33 m, W = 21.9 m) each one composed of 7 reinforced
concrete girders and a concrete slab. The segments sit on reinforced concrete bents with drilled pier
supports. Figure 9.9(b) shows an example of a typical bridge bent configuration.
155Figure 9.8. Juan Pablo II bridge connecting the cities of Concepción and San Pedro de la Paz across the Bio Bio
River (S36.815122° W73.084369°; 1453 hrs on 3/15/2010)
During the 2010 Chile earthquake, the bridge suffered severe damage and was closed to the public.
Evidence of liquefaction and lateral spreading was observed in the north-east approach with significant
effects on the bridge. A Google Earth view of the northeast approach with schematics of the observed
ground failure and structural effects is shown in Figure 9.9b. As shown in Figure 9.10, liquefaction of the
soil and lateral spreading in the embankment contributed to settlements and lateral displacement of the
bridge deck. Visual inspection of the surrounding soils indicated the presence of fine loose sands. Several
sand ejecta features were observed near the structure on the south and north sides of the embankment as
shown in Figure 9.12. Several samples of the ejected soil were taken at this site, and grain size analysis
and Atterberg limit testing are being performed. The results of this testing will be included in later
versions of this report.
Figure 9.9. Juan Pablo II Bridge (a) Google Earth view of northeast Approach with schematics of observed damage
(S36.815864° W73.083674°) (b)Typical bridge bent configuration (S36.828181° W73.095850°; 1636 hrs on
3/15/2010)
156Figure 9.10. Juan Pablo II northeast approach: (a)Settlement of bridge deck near bridge approach (S36.815900°
W73.084064°; 1455 hrs on 3/15/2010), (b) Lateral spreading on northeast bridge abutment.
Column shear failure and significant displacements and rotation of the bridge bent were observed on the
north-east approach. Figure 9.11(a) shows shear failure of the column facing the bent’s south side. The
north column, shown in Figure 9.11(b), shows evidence of tension cracks and rotation and also suffered
shear failure. In contrast with the damage observed at the northeast approach to the bridge, the southwest
approach suffered minor damage.
Figure 9.11. Juan Pablo II northeast approach: (a) Column shear failure (S36.816233 W73.084144°; 1528 hrs on
3/15/2010) (b) Rotation and lateral displacement of bridge bent (S36.816233° W73.084144°; 1530 hrs on
3/15/2010)
Noticeable pier settlements were observed at several locations along the length of the bridge. Vertical
settlements appeared to be due to liquefaction of the soil near the pier foundations. Visual inspection of
the surrounding soils indicated the presence of loose sands near the surface. Although the Bio Bio River
was once navigable by ship up to the City of Nacimiento, over-logging during the twentieth century has
led to heavy erosion that has choked the river with silt and rendered it impossible to ship traffic. Near
Concepción the river behaves as a meandering river with fine-grained material deposited on the
floodplains. The GEER team identified several sand boils near the approaches (e.g. Figure 9.12a) and
along the bridge spans (in sections not covered by water). The presence of fine material is clearly shown
in Figure 9.12(b).
157Figure 9.12. Juan Pablo II bridge: (a) Sand ejecta near northeast approach and (S36.815619° W73.083311°; 1522 hrs
on 3/15/2010) (b) Fine-grained material in the floodplains (S36.825592° 73.093264° on 3/15/2010).
Settlements on the order of 0.50 m to 0.70 m were observed in piers #73-76 and piers #113-116 as
indicated in Figure 9.13 (odd numbers for piers on the north side and even numbers for piers on the south
side). The bridge deck accommodated these settlements with large vertical deformations but with
relatively minor damage of the asphaltic layer. This is observed in Figure 9.14(b). Settlements of piers #
73, 75, 113 and 115 on the south side were larger than those at piers #74, 76, 114, and 116 on the north
side indicating rotation of the bridge bents.
Figure 9.13. Juan Pablo II bridge – Pier settlements (S36.815122° W73.084369°; 1453 hrs on 3/15/2010)
Figure 9.14. Juan Pablo II bridge (a) View of bridge bent settlement (S36.826596° W73.094345° on 3/15/2010)(b)
View of bridge deck settlement (S36.826596° W73.094345° on 3/15/2010)
158Although the GEER team had no direct access to the piers subjected to liquefaction and settlement it was
possible to obtain some photos of the affected foundations. Figure 9.15(a) and (b) show the top view of a
pier corresponding to pier group #113-116 and a close-up of the soil-pier interface. The figure shows the
effects of liquefaction of the soil surrounding the pier with soil depressions and standing water covering
an annular section around the pier. The soil in the vicinity of the pier shows evidence of water being
brought to the surface and accumulation of sand probably ejected during the liquefaction event.
Figure 9.15. Juan Pablo II bridge–Evidence of liquefaction at piers subjected to settlements.(a)column and pier, (b)
detail of pier and surrounding soil. (S36.826596° W73.094345° on 3/15/2010)
9.4 La Mochita Bridge, a Four-Span Bridge Parallel to the River Bio Bio in Concepción
La Mochita bridge, shown in Figure 9.16 (S36.846841°; W73.055496°), is a 4-span concrete bridge
supported by seat-type abutments at each end and two-column bents at the interior locations. At this site,
ground failure occurred which induced transverse movement of the bridge superstructure.
The bridge, which was constructed in 2005, spans north-south along the east bank of the Bio-Bio river,
crossing a small inlet of water which fronts a water treatment facility in south Concepción. Bents are
comprised of two 1.20 m diameter concrete columns (estimated) with pin connections at the deck, which
are restrained vertically with a pair of tie bars integrated with a concrete block assembly (vertical
restrainer blocks). The column bases are integrated with a concrete cap embedded below the ground. The
bridge superstructure is composed of precast I-girders and a concrete slab. Bents 2 and 3 are founded on a
soil mass that slopes towards the east water inlet. The high point of the soil mass is between 6-10 m east
of the Bio-Bio river, with the low point at the water level of the east inlet, which at the time of the teams
visit was below the base of the pile cap.
The bridge superstructure shifted transversely largely as a unit towards the east due to failure of the soil
mass surrounding bents 2 and 3. Upon inspection of the ground at bents 2 and 3, significant spreading-
like failure towards the water treatment plant inlet water was observed (Figure 9.17). This failure may
have been attribute to either a deep seated slope instability or liquefaction-induced lateral spreading
mechanism. It is noted that sand boils below the bridge were observed near bent #2 and 3 (Figure 9.18).
Follow-up site investigation is being conducted by GEER to more fully understand the characteristics of
159soils at the site and understand the underlying ground failure mechanism. Measurements taken by the
team on March 15, 2010 indicated that the north end of the bridge deck shifted 0.5 m to the east relative
to the approach fill, while the south end of the bridge shifted 0.9 m towards the east relative to the
approach fill on that side. Bents 2 and 3 subassemblies (columns, bent cap and pile cap) were observed to
rotate about the longitudinal axis of the bridge towards the east in consistent fashion with the deck
movement. Rotations of bents 2 and 3 were measured as 2 and 4 degrees, respectively (Figure 9.19a).
Bent 1 could not be accessed at the time of the teams visit, however, views from the land mass at bent 2
indicate that the deck moved independently of bent 1 (Figure 9.19b). In addition, ground failure was not
immediately visible from this vantage point, or above the north shore of the bridge. Movement of the
abutments was observed to be minimal, with the resulting damage to the superstructure largely attributed
to the rotation of the bents (Figure 9.20 and Figure 9.21). It is noted that movement of the bridge resulted
in damage on both east and west end transverse shear keys of the interior bents (Figure 9.22). In addition,
the approach road from the north observed significant ground movement and distress leading to the bridge
(Figure 9.23).
Figure 9.16. Plan view of the La Mochita bridge in south Concepción describing observed damage (S36.846841°
W73.055496°).
160Figure 9.17. Ground failure at the La Mochita bridge, (a) looking north at bent #3 (S36.847389°, W73.055219°;
1831 hrs on 3/15/2010) and (b) looking north at bent #2 (S36.847495°, W73.055027°; 1835 hrs on 3/15/2010)
(a) (b)
Figure 9.18. La Mochita bridge: (a) Sand boils observed below the bridge (S36.847456°, W73.055129°; 1830 hrs on
3/15/2010), and (b)View looking north (S36.847453° W73.055225°; 1830 hrs on 3/15/2010)
Figure 9.19. La Mochita bridge: (a) Rotation of bent #3 and surrounding ground failure at La Mochita bridge. View
looking south (S36.847302°, W73.055151°; 1835hrs on 3/15/2010), and (b) Transverse shift of deck relative to bent
#1. (the tilt of bent #1 could not be measured at the time of site visit). Ground failure surrounding bent #1 was not
observed from this vantage point. View looking north (S36.847049°, W73.055443°; 1835 hrs on 3/15/2010).
161Figure 9.20. Transverse shift of deck relative to south abutment at the La Mochita bridge (S36.847547°,
W73.054876°; 1834 hrs on 3/15/2010).
Figure 9.21. Mataquito bridge (a)Transverse gap developed between deck and south abutment. View looking north.
(-36.847798°, -73.054797°; 1856 hrs on 3/15/2010), (b) Damage at the south abutment-road-deck interface due to
transverse shift of the deck. View looking north. (S36.847761°, W73.054777°; 1856 hrs on 3/15/2010).
Figure 9.22. Damage to transverse shear keys at bent #3 due to movement of the La Mochita bridge (S36.847405°,
W73.055084°; 1830 hrs on 3/15/2010).
162Figure 9.23. Damage to the approach road north of the La Mochita Bridge (S36.846473°, W73.055881° on
3/15/2010). View looking north. The Bio Bio river is shown on the left (west) of the view.
9.5 Puente Bio Bio (Puente Viejo) in Concepción
The Bio-Bio bridge, also known as Puente Viejo (Old Bridge), was built in the 1930s and inaugurated in
1937. The bridge connected the cities of Concepción and San Pedro the la Paz and had a length of 1,419
m. For many years it was the only vehicular bridge connecting the two cities. Due to its precarious
structural condition the bridge was closed in May 2002 and used only for pedestrian transit. During the
2010 Chile earthquake the bridge suffered severe damaged with many slab sections collapsing (Figure
9.24a). Several bridge bents also collapsed during the seismic event (Figure 9.25). Evidence of
liquefaction was observed at the East bridge abutment with visible lateral deformations and vertical
settlements.
Figure 9.24. Puente Bio-Bio: (a) Collapsed slabs (S36.836789° W73.062203° on 3/15/2010), (b) Evidence of lateral
spreading near East bridge approach (S36.837311° -73.061831°; 1753 hrs on 3/15/2010).
163Figure 9.25. Puente Bi-Bio’s collapsed slab sections and bridge bents (S36.837968° W73.062896° on 3/15/2010).
9.6 River Crossings in Talca
The City of Talca suffered significant damage to many buildings due to earthquake shaking. The damage
was predominantly associated with low-rise adobe and unreinforced masonry construction (Figure 9.26).
Taller, well-designed structures performed relatively well, with the exception of damage to exterior
cladding and contents in the upper floors (RMS, 2010). The GEER team did not conduct an extensive
survey of building damage within the city; rather the team focused on regions near the Rio Clara, which
runs along the west edge of the city, extending north-south parallel with Route 5 (Figure 9.27). In
addition, the team inspected areas along a branch of the river running east-west towards the southern edge
of the city.
Bridges crossing the east-west branch of the river were primarily short span (less than 50 m long) slab
bridges (Figure 9.28). Of the bridges inspected along the branch of the Rio Clara, no visible damage to
the structure or surrounding ground was observed. Two long span bridges that cross the Rio Clara), one a
vehicular bridge, the other a pedestrian bridge (Puente Rio Claro Nuevo and Puente Rio Claro Viejo)
(Figure 9.29) were also of interest. Both structures are constructed of reinforced concrete, and of a girder-
slab type configuration with the vehicular bridge bents supported on pier walls and the pedestrian bridge
bents supported on angled multi-column subassemblies integral with a pier cap at both base and column
head.
Local ground failure was observed approximately 50 m north of the Puente Rio Clara Nuevo (vehicular
bridge) (Figure 9.30 and Figure 9.31). Two distinct regions were observed, a smaller lateral spread near
shore (Figure 9.31), and a larger ground failure more characteristic of a soft clay failure confined within a
park area (Figure 9.30). Soils near the shore area were predominantly gravely materials, likely with
pockets of sand (one sand boil was observed at the near shore failure), whereas the park area was a soft
clayey material. The ground failure extended approximately 90 m by 33 m north-south, however, it had
no impact on the vehicular bridge, as it was open to traffic with no visible distress noted from the team’s
inspection on the east shore area. In contrast, the Puente Rio Claro Viejo (pedestrian bridge) suffered
unseating of the longitudinally spanning girders and subsequent shear failure of the southern-most girder
at a vista point near the mid-span of the bridge (Figure 9.32). From the team’s limited access to the bridge
it was not clear if the deck unseating was due to movement of the bent due to ground failure or excessive
structural deformation at the bent.
164Figure 9.26. Typical construction type and observed damage within the city of Talca
(S36.832375,W73.055439; 2016 hrs on 3/17/2010).
Figure 9.27. Plan view of city of Talca locating the Rio Clara and Rio Clara branch inspected by GEER team
(S35.440800° W71.647233°).
Figure 9.28. (a)Typical short span bridge construction on the branch of the Rio Clara, city of Talca (S35.428011°
W71.670269°; 1302 hrs on 3/18/2010). (b) Bridges were observed to remain undamaged (S35.428086°
W71.669894°; 1303 hrs on 3/18/2010).
165Figure 9.29. Plan view of the Puente Rio Claro Nuevo and Puente Rio Claro Viejo, locating the observed ground
failure area to the north (S35.420772° W71.682932°).
Figure 9.30. Ground failure in a park area near the shore of the Rio Claro in Talca (S35.419919°, W71.682289°;
1408 hrs on 3/18/2010), views looking north and south, for left and right images, respectively.
Figure 9.31. Near shore lateral spread on the western shore of the Rio Clara in Talca, view looking south.
(S35.419682°, W71.682359° on 3/18/2010). Both the pedestrian and vehicular crossing bridges are shown in the
background.
166Figure 9.32. Deck unseating and shear failure of longitudinal spanning girders of the Talca pedestrian bridge at the
vista area (S35.421044, W71.683197; 1354 hrs on 3/18/2010)
9.7 Undercrossings and Connectors for Autopista Vespucio Norte Express in Quilicura
Several transportation structures along the Autopista Vespucio Norte Express (i.e., Vespucio Norte
Expressway) were damaged in the Quilicura area of North West Santiago (Figure 9.33). There was at
least one collapse and several spans were unseated requiring temporary support (Figure 9.34). Both older
and newer structures were damaged, and the damage appeared to be the result of strong shaking. Since the
damage appeared localized only as the Vespucio Norte Expressway came through the Quilicura area, it is
suspected that local site effects, resulting from either soil conditions or subsurface topography contributed
to the strong shaking. Retaining walls and mechanically stabilized embankment (MSE) walls appeared to
perform well in the area (Figure 9.35). No other signs of geotechnical conditions influencing the
performance, such as liquefaction or slope movements, were observed.
Figure 9.33. (a) Damaged shear key is an example of typical performance on bridges along this section of Vespucio
Norte Expressway in Quilicura (S33.365585, W70.688657; 814 hrs on 3/19/2010), (b) Close up of damaged shear
key along Vespucio Norte Expressway (S33.365893, W70.688584; 817 hrs on 3/19/2010).
167Figure 9.34 (a). Example of one of the newer under crossings that suffered damage along the Vespucio Norte
Expressway. The right span became unseated due to excessive transverse movement (S33.36245, W70.688865; 829
hrs on 3/19/2010) (b) Close-up of shear key area on bent cap, with metal shear key or keeper bar hanging on right
side of bent cap. Note complete unseating of I-girder on right side of bent cap (S33.366638, W70.689301; 837 hrs
on 3/19/2010).
Figure 9.35. Retaining walls and mechanically-stabilized-embankment (MSE) walls appeared to perform well in the
Quilicuro area of Santiago (S33.366137, W70.688913; 824 hrs on 3/19/2010)
1689.8 Mataquito Bridge
Built in 2008, the Mataquito Bridge is a two-lane 280 m-long reinforced concrete bridge, which runs in
the north-south direction over the Mataquito River. Despite evidence of liquefaction at both abutments of
this bridge, its overall seismic performance was good. No signs of structural damage due to lateral
spreading were observed. Vertical settlement of about 50 cm was observed at the north approach fill,
probably induced by liquefaction.
Figure 9.36. Mataquito bridge-(a)Settlement of approach fill at North end (b) Ground cracks at the South abutment
due to lateral spreading (S35.051961, W72.163217, 1419 hrs on 3/08/2010)
Figure 9.37. Mataquito bridge-(a) Blocks of soil crust against piers at the south end, (b) Sand boils at the north end
of the bridge (S35.051961, W72.163217; 1450 hrs on 3/08/2010)
1699.9 Pulen and Patagual bridges near Hualqui
There was moderate damage of these bridges due to liquefaction and lateral spreading. These two-lane
single-span old reinforced concrete bridges were close to each other. In these bridges the longitudinal
movement due to lateral spreading of both abutments seemed to have compressed the bridges causing
geometric distortion and moderate damage. The originally horizontal decks of the bridges ended up with a
concave-down shape. Some transverse cracks were observed on the bridge deck due to this effect.
Information provided by local authorities indicates that most of these bridges, if not all, have been
recently surveyed as a part of a broad bridge assessment and improvement program, so there may be
accurate survey points that could be used for future detailed analysis of the deformations.
Figure 9.38. Pulen Bridge-(a)Evidence of lateral spreading at the north abutment (b) Loss of longitudinal alignment
of steel I-beam (S37.112036, W72.986902, 1225 hrs on 3/10/2010)
Figure 9.39. Patagual Bridge-(a) Ground movement at the abutment (b) Sidewalk crack in the transverse direction
on the top of the bridge deck(S37.111325, W72.987583, 1257 hrs on 3/10/2010).
1709.10 Laraquete Bridge
Two bridges were inspected in the Town of Laraquete, which is 50 km south of Concepción: A pedestrian
two span bridge and an adjacent vehicular three span reinforced concrete bridge. The pedestrian bridge
experienced damage due to foundation settlement of the middle bent with an estimated 0.50 m vertical
deformation. Figure 9.41 shows the deformed bridge with noticeable inclination of the bridge deck. The
adjacent reinforced concrete bridge, shown in Figure 9.40, suffered minor damage near the approaches
due to pounding with the concrete structure and settlement due to poorly compacted fill. This bridge did
not show evidence of foundation settlement.
Figure 9.40. Laraquete bridge (a) Aerial view (S37.166788° W73.184486°), (b)Bridge approach (S37.166804°
W73.184760°; 1430 hrs on 3/10/2010)
Figure 9.41. Pedestrian Laraquete Bridge showing large settlement of middle pier (S37.166742° W73.184384°;
1437 hrs on 3/10/2010).
1719.11 Lebu Bridge (Puente Antiguo)
This bridge was operational by the time the GEER team got to Lebu. No major approach fill settlement
could be observed. Good overall performance of the bridge in an area where evidence of ground uplift of
1.8 m to 2 m was found.
Figure 9.42. Lebu bridge: (a) Crossing Lebu bridge fully functional, and (b) Lebu bridge from the distance
(S37.606344, W73.649496, 1818 hrs on 3/10/2010)
9.12 Nebuco Bridge along Route 5
The EERI LFE Bridge Team observed this pair of bridges crossing the Rio Nebuco just South of Chillan
along Route 5. The northbound bridge had a single dropped span, which had already been removed. The
newer southbound bridge suffered only minor damage and was still in service handling both northbound
and southbound traffic. The collapse was apparently a result of strong shaking. No apparent signs of
liquefaction or lateral spreading and slope movement were observed.
Figure 9.43. This pair of bridges crosses the Rio Nebuco along Route 5 (S36.641846° W72.211264°; 1843 hrs on
3/17/2010).
1729.13 Damage to Bridge and Roadway near Tupul
A roadway and bridge near the small town of Tupul were damaged due to ground failure. The layout of
the bridge and roadway is shown in Figure 9.44. The roadway is about 0.33 km long and single span
bridges cross the river on the east and west ends. Damage to the roadway and the bridge on the east end
closed the road to traffic following the earthquake. The two lane roadway, with an embankment height of
about 2 m, traverses a swampy, low-lying area adjacent to a small river which flows northward into the
Pacific Ocean. Therefore, soils in this area are likely to be soft and saturated. The eastern bridge, which
is about 50 m long, is supported by steel beams which rest on a seat type abutment.
Figure 9.44. Damage to roadway and bridge due to ground failure near town of Tupul, Chile (S37.254345º,
W73.437021º).
Lateral spreading toward the river produced ground displacement of about 0.6 m to 0.7 m at the west
abutment. The bridge beams appear to have acted as a strut to limit displacement at the top of the
abutment. This led to an offset of about 0.30 m to 0.35 m between the bridge abutment and a retaining
wall adjacent to the abutment as shown in Figure 9.45(c). The displacement and rotation of abutment was
still sufficient to deform the vertical restraining bars connecting the base of the abutment and the bridge
beams by about 0.35 m as shown in the photo in Figure 9.45(b). Displacement of the abutment relative to
the beams also led to shearing of the outer edge of the abutment wall as it impacted the bridge beam as
shown in Figure 9.45(a).
On both sides of the roadway, slumps developed along nearly the entire length of the roadway leaving
vertical scarps 1.0 to 2.0 m in height as shown in Figure 9.46. The slopes on both sides of the roadway
appear to have rotated downward causing an upward heave and rotation of the outer edge of the failure
surface similar to a bearing capacity failure surface. In addition to the slumping along the sides of the
road, the middle section of the road experienced lateral displacement towards the north as evidenced by
the bow in the centerline of the road evident in Figure 9.46(a).
173Figure 9.45. Damage to bridge abutment due to lateral spreading of soil around bridge abutment. (a) abutment wall
movement relative to beams, (b) deformation of vertical restraining bar due to abutment movement relative to
beams, (c) movement of retaining wall relative to abutment. (S37.254345º, W73.437021º; 1911 hrs on 3/17/2010)
Figure 9.46. Photos showing scarps along both sides of the roadway due to bearing capacity failure in soil
underlying the fill. Note lateral spreading in upper photo (S37.254161º, W73.437577º on 3/17/2010)
1749.14 Road and Railroad Embankment Failures North of Lota
Several large ground failure areas were observed north of Lota along Route 160. Two failures resulted in
damage to a roadway embankment section (denoted herein as the “south bound failure” and “north bound
failure”; Figure 9.49), while a third failure resulted in damage to an elevated railroad section (denoted as
“railroad failure”; Figure 9.47 and Figure 9.50). Minor side road spreading-like failures were also noted
near the approach abutments to two short span overpass bridges, north of the embankment failures, as
well as just north of the short span bridges. The area east of Route 160 is largely marshy with low lying
organic material (Figure 9.47). South of the north bound failure and east of the south bound failure of the
elevated roadway sections is a small housing development.
The north bound ground failure appeared to be deeply seated, perhaps due to softening of the foundation
materials. It was not clear whether the south bound failure was due to a deep seated foundation failure or
due to poorly compacted earth fill in the embankment section. A gray sandy fill overlaid by compacted
clay fill was used in the elevated road embankment. The roadway elevation was approximately 10–15m
above the valley area (10 m nearest to the overcrossing bridges, with high point above the housing
development area). The bridge overcrossings, and therefore the road embankments, each of the north and
south bound sections may have been constructed at different times, as evident in the differences in
construction type of the bridges (Figure 9.50(a)). The neighboring elevated railroad failure is
characterized by a slumping and spreading of the elevated section, which is likely due to movement of the
compacted fill (Figure 9.50(b)). The railroad was approximately 5-7 m above the low lying marshy area
along its failure zone.
Figure 9.47. Plan view of approximate affected area (Google Earth image at S37.0734°, W73.1469°).
175Figure 9.48. View looking north on route 160 showing south bound and north bound failure areas (S37.0744°,
W73.1480°; 1220 hrs on 3/16/2010).
Figure 9.49. Lota (a)View looking south on route 160 showing north bound failure area (S37.0730°,W73.1475°;
1145 hrs on 3/16/2010) (b)View looking north on route 160 showing south bound failure area (S37.0746°,
W73.1479°; 1215 hrs on 3/16/2010).
Figure 9.50. Lota (a)Slab and girder-type overpasses at northern end of road embankment failure area, showing
railroad and supporting ground settlement. View looking west. (S37.0729°, W73.1469°; 1150 hrs on 3/16/2010), (b)
Ground failure below elevated railroad east of road embankment failure. (image looking east; S37.0727°,
W73.1471°; 1150 hrs on 3/16/2010)
1769.15 Collapsed of Embankment Fills near Copihue and Parral
Two collapsed embankment fills were identified near Copihue and Parral. The first, shown in Figure 9.51,
occurred on a straight section of Ruta 5 located ~ 8 km North of Parral (S36.0796 W71.7881). The
Southbound lanes collapsed to the West and appeared to involve a shallow translational slide in near
surface foundation soils as evidenced by the location of the failed soil mass including a mound of soil
pushed up at West toe of the embankment (Figure 9.51a). The embankment failed along a length of
approximately 150 m at a location where a low lying softer soil area was located at the toe.
Figure 9.51. This embankment fill collapsed together with an overhead near Copihue, north of Parral, closing the
South bound of Route 5 (a) View from the South, (b) View from the North (S36.087891, W71.791513, 1325 hrs on
3/11/2010)
The second failure, shown in Figure 9.52, occurred on an overpass of Ruta 5 located ~ 13 km North of
Parral. (S36.0347 , W71.7558). The overpass embankment was curved and the embankment failed over a
length of about 80 m towards the outside of the curved section. Again, the failure appeared to involve a
shallow translational slide in the near surface foundation soils as evidenced by the intact failed soil mass
and the mound of soil pushed up at the toe (Figure 9.52a). Foundation soils in the region appeared to be
relatively competent (unlike the above case) suggesting possible elevated pore pressures in the foundation
soils played a role in the observed failure with 3-D effects leading to failure to the outside of the curved
embankment section as opposed to the inside of the embankment. The outside section of the slide mass
remained completely intact as evidenced in Figure 9.52b.
Figure 9.52. Curved overpass embankment failure 13 km North of Parral (a) Translational 3-D slide failure,
(S36.0343 W71.7568; 1405 hrs on 3/11/2010) and (b) Failed outside of the curved embankment (S36.0347
W71.7558; 1409 hrs on 3/11/2010)
1779.16 Ground Failure along Highway 5 near Paine
Abutment and embankment failures were common along Route 5. Figure 9.53 and Figure 9.54 show
typical highway failures due to poor compaction of the embankment fill and abutments near Paine 62 km
South of Santiago. The same scenario repeated at multiple sites. In contrast, mechanically stabilized
retaining structures performed exceptionally well. Figure 9.53 shows the failure of an overpass bridge.
The figure shows cracks on the sloping ground that propagated away from the abutment, and reduced in
size away from the bridge. It seems cracks succeeded the abutment failure. The structural damage of the
overpass was caused by differential settlement of the supports. Figure 9.54 shows the failure of the
highway shoulder and pavement due to poor compaction of the fill material.
Figure 9.53. Highway 5 crossing near Paine; (a)View of bridge approach from East (S33.854592° W70.747687°;
1118 hrs on 3/16/2010); (b) View of damaged bridge abutment (S33.854211° W70.747784°; 1120 hrs on
3/16/2010)
Figure 9.54. Highway 5 failure near Paine; (a)shoulder settlement due to poorly compacted soil (S33.864897°
W70.742222° 1203 hrs on 3/16/2010), and (b) road failure due to poorly compacted soil (S33.864897°
W70.742222°; 1204 hrs on 03/16/2010)
1789.17 Railroad Bridge over the Bio-Bio River
The Bio Bio river railroad bridge is one of the oldest crossings of the Bio Bio river. Originally built in
1889 m, it was completely retrofitted in 2005. This railroad structure is composed of parallel top and
bottom chords separated by diagonal and vertical members in a Warren truss arrangement. Three hundred
and seventy pillars support the structure covering a length of 1889 m. The bridge was damaged during the
2010 Chile earthquake due to strong shaking and possibly lateral spreading of the river banks. Of the 370
pillars of the bridge, 19 were damage during the earthquake and several portions of the rail were bended
or miss-aligned (Figure 9.56) .Visual inspection of pillars near the West abutment seems to indicate
several piles moved in the lateral direction and rotated (Figure 9.55). The rail lines were moved out of
alignment as shown in Figure 9.53.
Figure 9.55. Bio Bio Railroad crossing (a) Pillars move and rotated during earthquake (b) Detail of broken crossbar,
(S36.836075° W73.086969°; 1717 hrs on 3/17/2010)
Figure 9.56. Bio Bio Railroad crossing (a) rails aligned before earthquake, (b) rails bended after earthquake
(S36.836097° W73.087094° on 3/17/2010)
179You can also read