Incorporation of Collagen and Hyaluronic Acid to Enhance the Bioactivity of Fibrin-Based Hydrogels for Nucleus Pulposus Regeneration - MDPI
←
→
Page content transcription
If your browser does not render page correctly, please read the page content below
Journal of
           Functional
           Biomaterials

Article
Incorporation of Collagen and Hyaluronic Acid to
Enhance the Bioactivity of Fibrin-Based Hydrogels for
Nucleus Pulposus Regeneration
Jennifer Gansau 1,2 and Conor Timothy Buckley 1,2,3, *         ID

 1    Trinity Centre for Bioengineering, Trinity Biomedical Sciences Institute, Trinity College Dublin, 2 Dublin,
      Ireland; jgansau@tcd.ie
 2    School of Engineering, Trinity College Dublin, 2 Dublin, Ireland
 3    Advanced Materials and Bioengineering Research (AMBER) Centre, Royal College of Surgeons in Ireland &
      Trinity College Dublin, 2 Dublin, Ireland
 *    Correspondence: conor.buckley@tcd.ie; Tel.: +353-1-896-2061

 Received: 30 May 2018; Accepted: 4 July 2018; Published: 10 July 2018

 Abstract: Hydrogels, such as fibrin, offer a promising delivery vehicle to introduce cells into the
 intervertebral disc (IVD) to regenerate damaged disc tissue as a potential treatment for low back
 pain. However, fibrin lacks key extracellular matrix (ECM) components, such as collagen (Col)
 and hyaluronan (HA), normally found in native nucleus pulposus (NP) tissue. The overall aim of
 this work was to create a fibrin-based hydrogel, by incorporating Col and HA into the matrix to
 enhance NP-like matrix accumulation using articular chondrocytes (CC). Firstly, we assessed the
 effect of fibrin concentrations on hydrogel stability, and the viability and proliferation kinetics of
 articular chondrocytes. Secondly, we investigated the effect of incorporating Col and HA to enhance
 NP-like matrix accumulation, and finally, examined the influence of various HA concentrations.
 Results showed that increasing fibrin concentration enhanced cell viability and proliferation.
 Interestingly, incorporation of HA promoted sGAG accumulation and tended to suppress collagen
 formation at higher concentrations. Taken together, these results suggest that incorporation of ECM
 components can enhance the bioactivity of fibrin-based hydrogels, which may help advance the
 clinical potential of commercial cell and biomaterial ventures in the treatment of IVD regeneration.

 Keywords: fibrin; hydrogel; collagen; hyaluronan; intervertebral disc; nucleus pulposus; chondrocytes

1. Introduction
     Low back pain (LBP) is one of the most prevalent pathologies worldwide [1], placing a substantial
burden on healthcare resources. It occurs naturally with age, and is considered to be associated with
degeneration of the intervertebral disc (IVD), which is characterised by increased cell death [2] and
decreased accumulation of extracellular matrix (ECM) components, such as collagen and proteoglycans.
These are the main constituents of nucleus pulposus (NP) tissue, providing its unique biomechanical
properties. Early stage degeneration begins with a loss of proteoglycans and water content from
the central part of the NP, with the consequential loss of the ability to absorb compressive loads.
There has been significant interest in developing injectable cell-based therapies for the treatment of
degenerated disc disease (DDD), with the specific aim to repopulate the NP and augment tissue repair.
One such technique, known as autologous disc cell transplantation (ADCT) has been in clinical use
for the treatment of degenerated IVD, with recent investigations demonstrating that re-implantation
of extracted culture expanded NP cells can retard degenerative changes in humans with herniated
discs [3]. However, there are associated limitations with ADCT, including cell leakage following

J. Funct. Biomater. 2018, 9, 43; doi:10.3390/jfb9030043                                www.mdpi.com/journal/jfb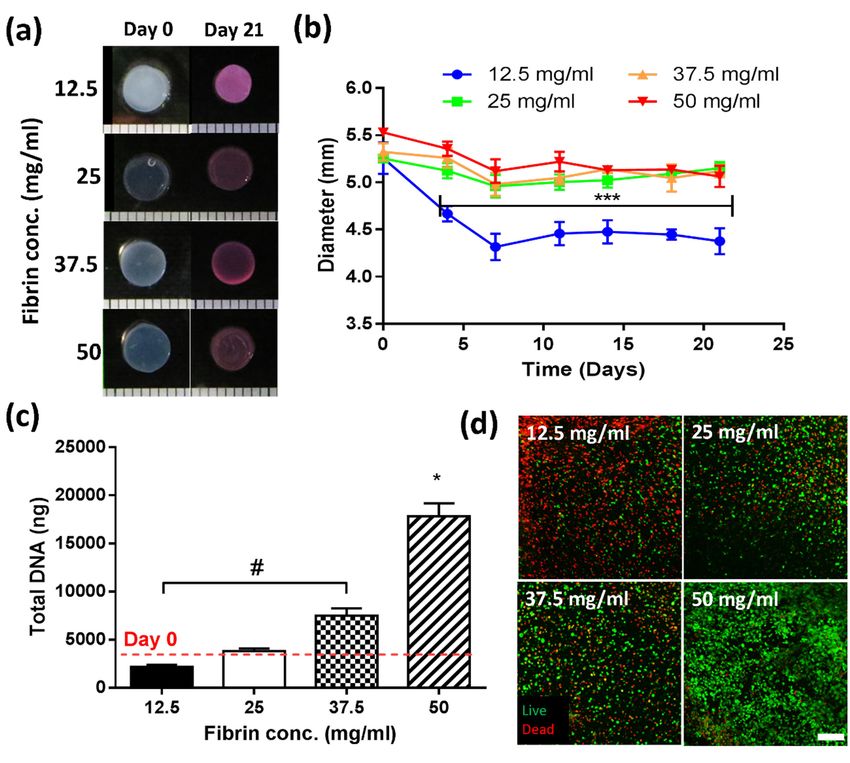
J. Funct. Biomater. 2018, 9, 43                                                                        2 of 19

injection into the disc [4], diminished matrix-forming capacity of culture-expanded NP cells derived
from degenerated tissue [5], and the paucity of nucleus pulposus (NP) cells that can be isolated.
      These challenges have motivated the exploration of various cell types, including chondrocytes [6,7]
and stem cells [8–10], for the regeneration of disc tissues. In particular, articular-derived chondrocytes
have been proposed for intervertebral disc repair, and have been investigated in several clinical trials
for cartilage and disc repair with some success (e.g., IMPACT, co.don® chondrospheres). However,
it has been shown that when cells are directly injected into the target site, cell leakage and increased cell
death due to shear forces may occur, inhibiting treatment success [11–14]. To overcome these issues,
many studies have utilised natural polymer-derived hydrogel systems, such as alginate, collagen,
and fibrin [15–20]. Hydrogels are highly attractive, as they can provide cellular protection during
injection, enhancing cellular retention, and can also be tailored to regulate cellular bioactivity [21–25].
      Fibrin is perhaps one of the most clinically used hydrogels, and has received particular attention
as a sealant and adhesive in surgery [26–28]. Fibrin is a viscoelastic polymer which crosslinks after
an enzymatic reaction between fibrinogen and thrombin, facilitating in situ gelation. Previous work
has demonstrated successful encapsulation of cells into fibrin hydrogels with cells, exhibiting good
viability and proliferation [7,19,20,29,30]. The primary components of fibrin, such as fibrinogen and
thrombin, have been shown to modulate cell attachment, migration, and proliferation of stem cells
and chondrocytes [29,31,32]. Chondrocytes have been shown to retain their rounded morphology in
fibrin hydrogels, inhibiting dedifferentiation and promoting matrix production [33]. Also, the effect of
different parameters, such as pH, fibrinogen, and salt concentration, have been shown to influence
long term fibrin gel stability [19].
      In addition, incorporation of extracellular matrix (ECM) constituents into fibrin gels, such as collagen
and hyaluronic acid (HA), have been shown to enhance matrix deposition by chondrocytes [20,34].
Collagen is the most abundant protein in mammalian ECM, and supports tissue stability and structure.
Hyaluronic acid is a non-sulphated GAG, and is highly abundant in NP tissue, where its function is
to maintain tissue hydration. Both materials have been used separately in various studies [35–38],
with HA demonstrating a beneficial effect on matrix synthesis and proliferation. However, the benefits
of incorporating collagen appear to be dependent on cell type. For example, Colombini et al. showed
that collagen-enriched fibrin hydrogels were suitable for culturing of annulus fibrosus (AF) cells,
but not NP cells [20].
      In the present study, we investigated fibrin hydrogels of different compositions in an attempt
to identify a suitable composition to promote NP-like extracellular matrix accumulation that may be
compatible with commercial ventures. The first objective explored the effects of fibrin concentration
(12.5, 25, 37.5, and 50 mg/mL) on hydrogel stability and the viability and proliferation kinetics
of articular chondrocytes. We next sought to enhance the bioactivity of fibrin-based hydrogels by
incorporating key matrix components (Col and HA), and further investigated the effect on matrix
formation by articular chondrocytes. Finally, we examined the influence of incorporating different HA
concentrations (2.5 and 5 mg/mL) into fibrin-based hydrogels.

2. Results

2.1. Stage 1—Effect of Increasing Fibrinogen Concentration

2.1.1. A Minimum Concentration of 25 mg/mL Fibrinogen Is Required to Maintain Construct Stability
over 21 Days in Culture
     At the initiation of culture, all constructs possessed an average diameter of 5.46 mm (±0.19)
(Figure 1a,b). After four days in culture, constructs with the lowest fibrinogen concentration
(12.5 mg/mL) underwent contraction (~27%, 3.99 mm ± 0.14), whereas all other groups appeared to
remain relatively stable. By day 21, the lowest concentration (12.5 mg/mL) had contracted by ~35%,
with all other groups (25, 37.5, 50 mg/mL) exhibiting ~8% contraction relative to day 0.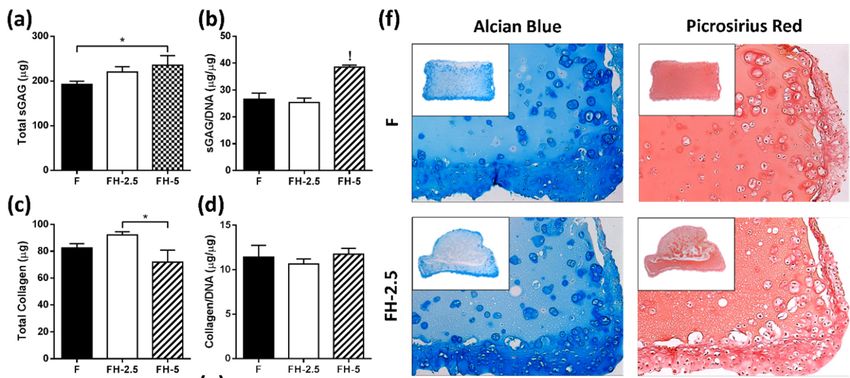
J. Funct. Biomater. 2018, 9, 43                                                                                                3 of 19

J. Funct. Biomater. 2018, 9, x FOR PEER REVIEW                                                                                3 of 19
2.1.2. Increasing Fibrinogen Concentration Enhances Cell Proliferation
2.1.2. Increasing Fibrinogen Concentration Enhances Cell Proliferation
      Fibrinogen concentration was observed to significantly influence cell proliferation (Figure 1c,d).
      Fibrinogen
For 12.5   mg/mL   concentration   was observed
                     gels, DNA content             to significantly
                                            was observed             influence
                                                             to decrease        cell proliferation
                                                                           relative   to day 0. At(Figure    1c,d).
                                                                                                      25 mg/mL,
For  12.5 mg/mL     gels, DNA   content    was  observed   to  decrease  relative  to  day
no significant change was observed with time. However, for 37.5 mg/mL, a two-fold increase  0. At  25  mg/mL,    no
significant change    was  observed   with  time.  However,    for  37.5 mg/mL,   a  two-fold
in DNA content was observed, which was enhanced further in 50 mg/mL gels (5-fold increase).     increase  in DNA
content  was observed,
Biochemical     data was which   was enhanced
                           confirmed               further in 50
                                        through live/dead          mg/mL(Figure
                                                                staining   gels (5-fold
                                                                                    1d), increase).
                                                                                          where dead  Biochemical
                                                                                                          cells are
data  was  confirmed   through  live/dead    staining  (Figure  1d), where  dead   cells are represented
represented in red, and viable cells in green. Significant cell death occurred at the lowest (12.5 mg/mL)   in red,
and  viable cells in green. Significant  cell death occurred   at the  lowest (12.5  mg/mL)    concentration
concentration (top left image), with some cell death also observed for the two middle concentrations           (top
left
(25 image),
     and 37.5with  some cell
               mg/mL).     Bydeath  also observed
                              contrast,             for thegels,
                                          for 50 mg/mL      two middle
                                                                  a high concentrations
                                                                          number of viable (25 and
                                                                                                cells37.5
                                                                                                      weremg/mL).
                                                                                                             noted
By  contrast, for 50
(bottom right image).mg/mL   gels, a high  number   of  viable cells were noted  (bottom   right  image).

      Figure 1.1.Effect
      Figure       Effectof fibrinogen  concentration
                            of fibrinogen                on construct
                                              concentration              stability stability
                                                                on construct       and cell proliferation   (a) Macroscopic
                                                                                               and cell proliferation        (a)
      Macroscopic images before culture (“Day 0”, left) and after three weeks in cell culture 21”,
      images    before   culture   (“Day   0”,  left)  and  after   three    weeks    in  cell culture   (“Day    (“Dayright);
                                                                                                                           21”,
      (b) Contraction
      right);             kinetics
              (b) Contraction       of constructs
                                 kinetics           overover
                                          of constructs   timetimeup toup21   days.
                                                                           to 21  days.Low
                                                                                         Lowconcentration
                                                                                               concentration(12.5
                                                                                                               (12.5 mg/mL,
                                                                                                                      mg/mL,
      blue) hydrogels
      blue)   hydrogels contracted
                          contractedsignificantly
                                        significantlyover
                                                        overthe
                                                              the   first
                                                                 first     7 days.
                                                                       7 days.       *** indicates
                                                                                 *** indicates       significant
                                                                                                 significant        difference
                                                                                                             difference     (p <
      (p < 0.001); (c) Biochemical    analysis   of DNA    content    in  constructs.   #  indicates  significant
      0.001); (c) Biochemical analysis of DNA content in constructs. # indicates significant difference             difference
      between 12.5
      between    12.5and
                       and37.5
                             37.5mg/mL
                                  mg/mL   (p (p < 0.01)
                                             < 0.01)  andand   * indicates
                                                          * indicates          a significant
                                                                         a significant         difference
                                                                                         difference        compared
                                                                                                     compared             to all
                                                                                                                  to all other
      other  groups   (p <  0.001); (d) Live/dead     analysis  showing      a  high  degree   of cell
      groups (p < 0.001); (d) Live/dead analysis showing a high degree of cell death for the lowest    death  for  the  lowest
      concentration (12.5
      concentration    (12.5 mg/mL)
                              mg/mL)and  and increased
                                              increased cell
                                                          cell viability
                                                               viability in in the
                                                                               the highest
                                                                                    highest concentrations
                                                                                              concentrations (50(50 mg/mL).
                                                                                                                     mg/mL).
      Scale bar  = 200  µm.
      Scale bar = 200 μm.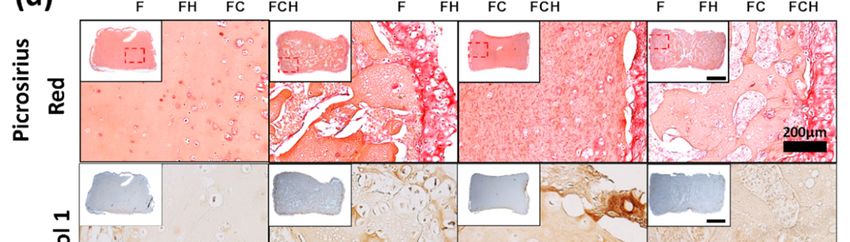
J. Funct.
J. Funct. Biomater.
Biomater. 2018, 9, x
2018, 9, 43FOR PEER REVIEW 44 of
of 19
19
2.2. Stage 2—Incorporation of ECM into Fibrin-Based Hydrogels
2.2. Stage 2—Incorporation of ECM into Fibrin-Based Hydrogels
2.2.1.
2.2.1. Fibrin-ECM
Fibrin-ECM Acellular
Acellular Hydrogels
Hydrogels Remain
Remain Stable
Stable in Culture over
in Culture over 21
21 Days
Days
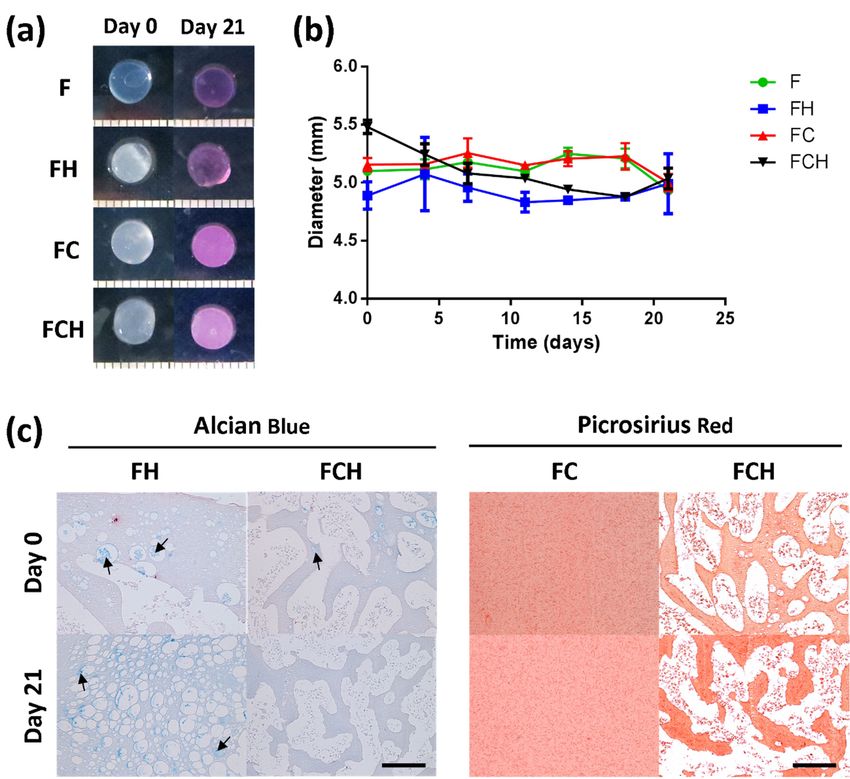
To assess whether
To assess whether incorporation
incorporation of of ECM
ECM components
components was was retained
retained after
after encapsulation,
encapsulation, acellular
acellular
hydrogels were evaluated over 21 days. All hydrogel formulations
hydrogels were evaluated over 21 days. All hydrogel formulations maintained their maintained their shape
shape (Figure
(Figure 2a)
2a)
and initial size of 5 mm (± 0.2) (Figure 2b). Histological assessment for hyaluronic acid (using
and initial size of 5 mm (± 0.2) (Figure 2b). Histological assessment for hyaluronic acid (using
Alcian
Alcian blue
blue at
at pH 2.5) and
pH 2.5) and collagen
collagen in different gel
in different gel formulations
formulations revealed
revealed aa stable
stable amount
amount of of HA
HA in in
Fibrin-hyaluronic acid (FH) groups after 21 days (arrows indicating pockets of HA).
Fibrin-hyaluronic acid (FH) groups after 21 days (arrows indicating pockets of HA). However, no HA However, no
HA
was was detected
detected in fibrin–collagen–hyaluronic
in fibrin–collagen–hyaluronic acidacid
(FCH)(FCH)
afterafter 21 days
21 days (Figure
(Figure 2c left).
2c left). Picrosirius
Picrosirius red
red staining
staining of fibrin–collagen
of fibrin–collagen (FC)(FC)
and andFCHFCH gelsconfirmed
gels confirmedthe theincorporation
incorporationand and maintenance
maintenance of of
collagen
collagen inside
inside the
the gel
gel over
over the entire culture
the entire culture period.
period. Small
Small fibres
fibres of
of collagen
collagen were
were observed
observed to to be
be
homogeneously
homogeneously distributed
distributed within
within FC FC gels
gels and
and inin between
between HAHA pockets
pockets in
in FCH
FCH gels
gels (Figure
(Figure 2c2c right).
right).
Figure 2. Assessment of geometry and composition stability for fibrin (F, with cF = 50 mg/mL), fibrin–
Figure 2. Assessment of geometry and composition stability for fibrin (F, with cF = 50 mg/mL),
hyaluronic acid (FH with cF = 50 mg/mL and cH = 1.5 mg/mL), fibrin–collagen (FC with cF = mg/mL
fibrin–hyaluronic acid (FH with cF = 50 mg/mL and cH = 1.5 mg/mL), fibrin–collagen (FC with
and cC = 1.33 mg/mL), and fibrin–collagen–hyaluronic acid (FCH with cF = 50 mg/mL, cC = 1.33 mg/mL
cF = mg/mL and cC = 1.33 mg/mL), and fibrin–collagen–hyaluronic acid (FCH with cF = 50 mg/mL,
and cH = 1.5 mg/mL) acellular hydrogels over 21 days. (a) Macroscopic images of different gel
cC = 1.33 mg/mL and cH = 1.5 mg/mL) acellular hydrogels over 21 days. (a) Macroscopic images of
formulations at day 0 and
different gel formulations day0 21;
at day and (b)
dayDetermination of diameter
21; (b) Determination of hydrogel
of diameter constructs;
of hydrogel (c)
constructs;
Histological assessment of incorporated extracellular matrix (ECM) components of hyaluronic acid
(c) Histological assessment of incorporated extracellular matrix (ECM) components of hyaluronic acid
(Left)
(Left) and
and collagen (Right). Scale
collagen (Right). Scale bar
bar == 200
200 μm.
µm.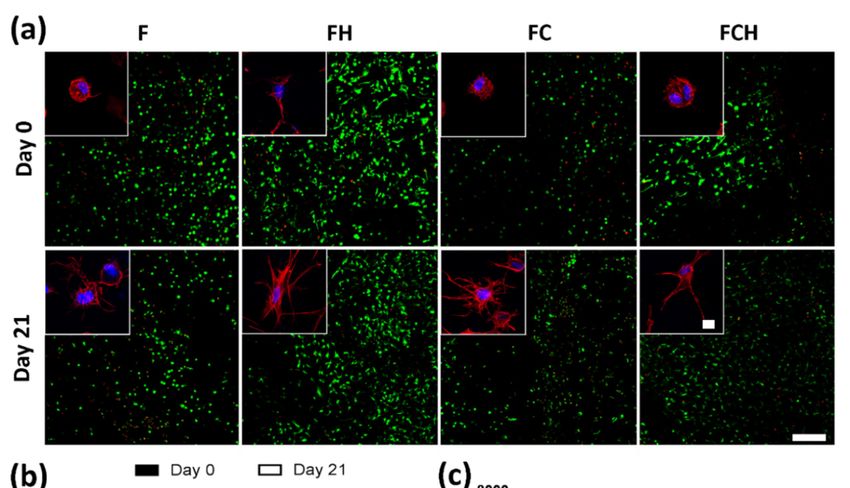
J. Funct. Biomater. 2018, 9, 43 5 of 19
2.2.2. J.Fibrin-Based
Funct. Biomater. 2018, 9, x FOR PEER REVIEW 5 of 19
Hydrogels Incorporating Hyaluronic Acid Promote Chondrocyte Proliferation with
Enhanced Cell Viability and Increased Cell Spreading
2.2.2. Fibrin-Based Hydrogels Incorporating Hyaluronic Acid Promote Chondrocyte Proliferation
Cell
withviability
Enhanced andCellproliferation
Viability andwas investigated
Increased using a combination of semi-quantitative confocal
Cell Spreading
image analysis
Cell viability and proliferation was investigated content.
and biochemical quantification of DNA From confocal
using a combination images of live/dead
of semi-quantitative
staining (Figure 3a), cell viability was determined to be 88.3% ( ± 4.6)
confocal image analysis and biochemical quantification of DNA content. From confocal imageswith no significant difference
of
between hydrogel
live/dead formulations
staining (Figure
(Figure 3a), 3b). However,
cell viability after 21 days
was determined to beof cell culture,
88.3% reduced
(±4.6) with cell viability
no significant
was observed
differencein F and hydrogel
between FC hydrogels compared
formulations to 3b).
(Figure groups whichafter
However, contained
21 days ofhyaluronic
cell culture,acid (FH and
reduced
cell viability was observed in F and FC hydrogels compared to groups which
FCH). DNA content increased from day 0 levels for all hydrogel formulations, with a four-fold increase contained hyaluronic
acid (FH
observed and FCH). DNA
for fibrin-only contentand
hydrogels increased from day
a five-fold 0 levels
increase in for all hydrogel
hydrogels formulations,
containing with a acid
hyaluronic
four-fold
(Figure 3c). increase observed for fibrin-only hydrogels and a five-fold increase in hydrogels containing
hyaluronic acid (Figure 3c).
Cell morphology was investigated using fluorescence staining of actin with phalloidin and nuclei
Cell morphology was investigated using fluorescence staining of actin with phalloidin and
staining with DAPI. Results revealed that incorporating hyaluronic acid promoted cell spreading
nuclei staining with DAPI. Results revealed that incorporating hyaluronic acid promoted cell
immediately
spreadingafter cell encapsulation
immediately into the material
after cell encapsulation into the(Figure
material3a—top). However,
(Figure 3a—top). when combined
However, when
with collagen,
combined cells did not spread
with collagen, cells didasnot rapidly,
spread and their appearance
as rapidly, more closely
and their appearance resembled
more closely hydrogels
resembled
without hyaluronic
hydrogels without acid incorporation.
hyaluronic After 21 days,
acid incorporation. cells
After in allcells
21 days, hydrogel formulations
in all hydrogel exhibited a
formulations
spread morphology (Figure 3a—bottom) with the least degree of spreading observed in fibrin-only
exhibited a spread morphology (Figure 3a—bottom) with the least degree of spreading observed in (F)
fibrin-only (F) hydrogels compared to all other groups containing
hydrogels compared to all other groups containing ECM components (FH, FC, FCH). ECM components (FH, FC, FCH).
Figure 3. 3.
Figure Cell
Cellviability, morphologyand
viability, morphology and proliferation
proliferation in fibrin
in fibrin (F, with(F,cF with cF = 50fibrin–
= 50 mg/mL), mg/mL),
fibrin–hyaluronic
hyaluronic acidacid
(FH(FH
withwith
cF = 50cFmg/mL
= 50 mg/mL andmg/mL),
and cH = 1.5 cH = 1.5 mg/mL), fibrin–collagen
fibrin–collagen (FC with cF = mg/mL (FC with
cF = mg/mL andmg/mL),
and cC = 1.33 cC = 1.33andmg/mL), and fibrin–collagen–hyaluronic
fibrin–collagen–hyaluronic acid (FCH with cacidF = 50 (FCH with
mg/mL, cC =c1.33
F = 50 mg/mL,
mg/mL
and cmg/mL
cC = 1.33 H = 1.5 mg/mL)
and cHhydrogels
= 1.5 mg/mL)over 21 hydrogels
days. (a) Live/dead
over 21imaging
days. (a) of Live/dead
different groups
imagingat dayof0 different
(top
groupsrow)
at and
day day 21 (bottom
0 (top row) and row).
dayScale bar = 200 row).
21 (bottom μm with cell bar
Scale morphology
= 200 µm (inset)
withfor different
cell hydrogel
morphology (inset)
for different hydrogel compositions; Scale bar = 10 µm; (b) Semi-quantitative analysis of cell# viability
compositions; Scale bar = 10 μm; (b) Semi-quantitative analysis of cell viability (%). * (p < 0.01), (p <
0.0001); & (p < 0.001) indicates statistical significance to day 21 values of FH and FCH; (c) Total DNA
(%). * (p < 0.01), # (p < 0.0001); & (p < 0.001) indicates statistical significance to day 21 values of FH and
content (ng). Dashed line indicates day 0 levels.
FCH; (c) Total DNA content (ng). Dashed line indicates day 0 levels.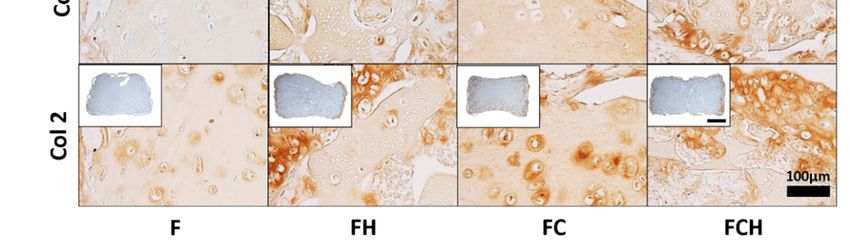
J. Funct. Biomater. 2018, 9, 43                                                                                                 6 of 19
 J. Funct. Biomater. 2018, 9, x FOR PEER REVIEW                                                                                 6 of 19

2.2.3.
2.2.3. Hyaluronic
       Hyaluronic Acid
                  Acid Enhances
                       Enhances sGAG
                                sGAG Accumulation
                                     Accumulationand
                                                  andIncreases
                                                      IncreasessGAG/Collagen
                                                                sGAG/Collagen Ratio
      Matrix
      Matrixdeposition
               depositionwaswasanalysed  through
                                  analysed         biochemical
                                             through            analysis
                                                       biochemical         and histological
                                                                      analysis                staining
                                                                                  and histological      for sGAG
                                                                                                     staining    for
and  collagen.   Total sGAG   accumulation    was  higher  in both  FH   (250.2  µg ±  23.5)
sGAG and collagen. Total sGAG accumulation was higher in both FH (250.2 μg ± 23.5) and FCH   and  FCH   (233.8   µg
±  45.6)μg
(233.8   hydrogels   compared compared
            ± 45.6) hydrogels    to materials
                                            towithout   HA
                                                materials    incorporation
                                                           without            (169.9 µg ±(169.9
                                                                     HA incorporation       12.7 inμg
                                                                                                    F group
                                                                                                       ± 12.7 and
                                                                                                               in F
182.4
groupµgand± 19.4
             182.4inμg
                     FC±group),
                          19.4 in (Figure 4a). (Figure
                                  FC group),   On a per4a).
                                                         cellOn
                                                              basis,
                                                                a perthis trend
                                                                        cell      was
                                                                             basis,   maintained,
                                                                                    this trend was although
                                                                                                     maintained, no
statistical difference  was  observed  (Figure  4b). More   intense  staining   for sGAG   was
although no statistical difference was observed (Figure 4b). More intense staining for sGAG was  observed   in  the
periphery
observed in of the
                constructs containing
                    periphery           hyaluronic
                               of constructs         acid, hyaluronic
                                              containing   while both acid,
                                                                         F andwhile
                                                                                 FC hydrogels
                                                                                      both F and exhibited   more
                                                                                                   FC hydrogels
homogenous
exhibited more  staining (Figure staining
                   homogenous     4c).     (Figure 4c).

     Figure 4.4. sGAG
     Figure      sGAG accumulation
                        accumulation in in fibrin
                                           fibrin (F,
                                                    (F, with
                                                        with ccFF =
                                                                  = 50  mg/mL), fibrin–hyaluronic
                                                                    50 mg/mL),       fibrin–hyaluronicacid   acid(FH
                                                                                                                  (FHwith
                                                                                                                        withccF F=
     50 mg/mL     and c  = 1.5 mg/mL),   fibrin–collagen     (FC   with  c   = mg/mL    and
     = 50 mg/mL and cH = 1.5 mg/mL), fibrin–collagen (FC with cF = mg/mL and cC = 1.33 mg/mL),
                       H                                                   F                  c C =  1.33 mg/mL),   and  fibrin–
     collagen–hyaluronic     acid  (FCH  with   c   = 50 mg/mL,     c   = 1.33   mg/mL    and
     and fibrin–collagen–hyaluronic acid (FCH with cF = 50 mg/mL, cC = 1.33 mg/mL and cH = 1.5
                                                  F                   C                          c H  = 1.5 mg/mL)   hydrogels
     over 21 days.
     mg/mL)         (a) Total
                hydrogels  oversGAG   (μg);(a)
                                  21 days.  * indicates
                                               Total sGAG statistical
                                                                (µg); *significance    (p < 0.01);significance
                                                                        indicates statistical        (b) sGAG/DNA      (μg/μg);
                                                                                                                 (p < 0.01); (b)
     (c) Histological
     sGAG/DNA          staining
                    (µg/µg);   (c)using alcian blue
                                   Histological        for sGAG.
                                                  staining   using Scale
                                                                     alcianbar   = 200
                                                                               blue for μm,
                                                                                        sGAG. inset    scale
                                                                                                   Scale     bar
                                                                                                           bar   = 1 mm.
                                                                                                               = 200 µm, inset
     scale bar = 1 mm.
      The highest amount of collagen was accumulated by cells encapsulated in an FC double matrix,
 and found   to be higher
      The highest  amount compared   to the
                            of collagen wasFCH   triple matrix
                                             accumulated        (initial
                                                            by cells     amount of collagen
                                                                     encapsulated  in an FC was subtracted
                                                                                            double  matrix,
 from  day  21 values) (Figure  5a). On  a per cell basis, a similar  result was observed  (Figure
and found to be higher compared to the FCH triple matrix (initial amount of collagen was subtracted5b). The
 highest sGAG/collagen ratio was found in FH hydrogels (Figure 5c), which was calculated based on
from day 21 values) (Figure 5a). On a per cell basis, a similar result was observed (Figure 5b).
 the total collagen (including baseline addition) contained in hydrogel constructs. From histological
The highest sGAG/collagen ratio was found in FH hydrogels (Figure 5c), which was calculated based
 analysis, collagen deposition in F hydrogels was more homogenous, with higher peripheral collagen
on the total collagen (including baseline addition) contained in hydrogel constructs. From histological
 matrix observed in FH, FC, and FCH constructs (Figure 5d). Immunohistochemical staining revealed
analysis, collagen deposition in F hydrogels was more homogenous, with higher peripheral collagen
 elevated amounts of collagen type I (Col1) in the periphery of FC hydrogels, whereas collagen type
matrix observed in FH, FC, and FCH constructs (Figure 5d). Immunohistochemical staining revealed
 II (Col2) was found in the periphery of constructs containing HA and in the pericellular matrix of
elevated amounts of collagen type I (Col1) in the periphery of FC hydrogels, whereas collagen type
 chondrocytes within FC hydrogels (Figure 5d).
II (Col2) was found in the periphery of constructs containing HA and in the pericellular matrix of
chondrocytes within FC hydrogels (Figure 5d).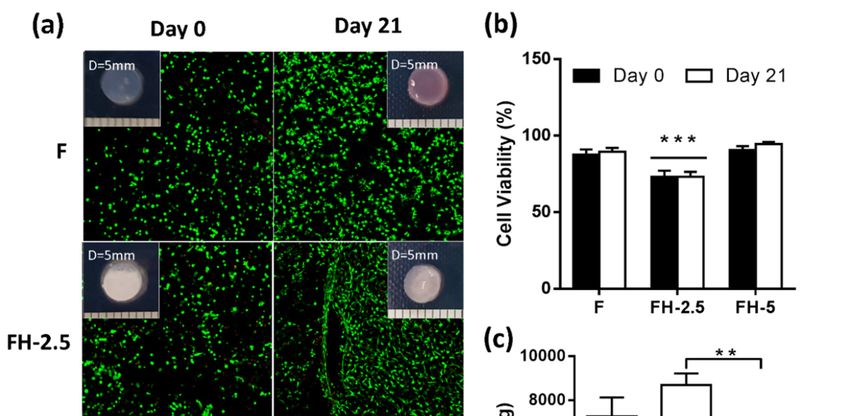
J. Funct. Biomater. 2018, 9, 43                                                                                                      7 of 19
  J. Funct. Biomater. 2018, 9, x FOR PEER REVIEW                                                                                    7 of 19

      Figure5.5.Collagen
     Figure      Collagenaccumulation
                             accumulation in   in fibrin
                                                   fibrin (F,   with ccFF==50
                                                            (F, with         50mg/mL),
                                                                                  mg/mL),  fibrin–hyaluronic
                                                                                              fibrin–hyaluronic    acid (FH(FH
                                                                                                                      acid   with  cF
                                                                                                                                 with
      =  50 mg/mL     and  cH = 1.5 mg/mL), fibrin–collagen (FC with cF = mg/mL and cC = 1.33 mg/mL), and
     cF = 50 mg/mL and cH = 1.5 mg/mL), fibrin–collagen (FC with cF = mg/mL and cC = 1.33 mg/mL),
      fibrin–collagen–hyaluronic
     and  fibrin–collagen–hyaluronic     acid  (FCH
                                            acid  (FCH  with
                                                           withcFcF= =5050mg/mL,
                                                                           mg/mL,cCcC= =1.331.33mg/mL
                                                                                                  mg/mLand    andccHH==1.5
                                                                                                                         1.5mg/mL)
                                                                                                                             mg/mL)
     hydrogels over 21 days. (a) Total (net) Collagen (µg); * indicates significant difference< (p
      hydrogels    over  21  days.  (a)  Total  (net)   Collagen     (μg); *  indicates   significant    difference   (p   0.05); (b)
                                                                                                                              < 0.05);
      Total
     (b)     (net)
         Total (net)collagen/DNA
                     collagen/DNA      (μg/μg),
                                         (µg/µg), ! indicates
                                                      ! indicatessignificant
                                                                    significant  difference
                                                                                   difference(p(p<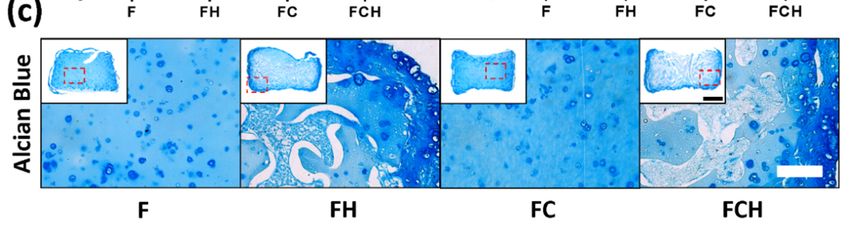
J. Funct. Biomater. 2018, 9, 43                                                                                          8 of 19

0 levels, with a significant difference between FH-2.5 and FH-5, showing a negative effect on cell
   J. Funct. Biomater.
proliferation    with2018, 9, x FOR PEER
                       increasing        REVIEW
                                    HA concentration (Figure 6c).                              8 of 19

         Figure 6. Effect of increasing concentration of hyaluronic acid (0, 2.5, and 5 mg/mL) on cell viability
      Figure 6. Effect of increasing concentration of hyaluronic acid (0, 2.5, and 5 mg/mL) on cell
         and proliferation in fibrin-based hydrogels over 21 days (a) Live/dead imaging at day 0 (left) and day
      viability and proliferation in fibrin-based hydrogels over 21 days (a) Live/dead imaging at day
         21 (right). Increased cell number was observed in groups with 5 mg/mL HA concentration. Scale bar
      0 (left) and day 21 (right). Increased cell number was observed in groups with 5 mg/mL HA
         = 200 μm; (b)Scale
      concentration.      Semi-quantitative
                               bar = 200 µm;analysis   of cell viabilityanalysis
                                               (b) Semi-quantitative     (%). *** indicates  statistical
                                                                                   of cell viability (%).significance  to all
                                                                                                           *** indicates
         other  groups   (p < 0.0001); (c) Total DNA  content   (ng). ** indicates  statistical significance  (p < 0.01).
      statistical significance to all other groups (p < 0.0001); (c) Total DNA content (ng). ** indicates statistical
      significance (p < 0.01).
   2.3.2. Hyaluronic Acid Enhances sGAG and Collagen Deposition in the Periphery of Constructs
2.3.2. Hyaluronic
        There was Acid   Enhances
                    an increase     sGAG
                                in total   andwhen
                                         sGAG  Collagen  Deposition
                                                     increasing       in the Periphery
                                                                the concentration        of Constructs
                                                                                    of incorporated  HA with
   significantly higher levels of sGAG on a per cell basis with the highest amount of HA (FH-5),
      There was an increase in total sGAG when increasing the concentration of incorporated HA
   compared to all other groups (p < 0.001) (Figure 7a,b). In addition, a significant difference was
with significantly higher levels of sGAG on a per cell basis with the highest amount of HA (FH-5),
   observed for total collagen between FH-2.5 and FH-5 (p < 0.05). However, no significant differences
compared to all other groups (p < 0.001) (Figure 7a,b). In addition, a significant difference was observed
   were detected between groups on a per cell basis when normalising the total collagen to DNA content
for total collagen between FH-2.5 and FH-5 (p < 0.05). However, no significant differences were detected
   (Figure 7c,d). The highest ratio of sGAG/collagen was found for the highest FH matrix (3.3 ± 0.1)
between groups on a per cell basis when normalising the total collagen to DNA content (Figure 7c,d).
   compared to all other groups (p < 0.001) (Figure 7e).
The highest ratio of sGAG/collagen was found for the highest FH matrix (3.3 ± 0.1) compared to all
        Histology revealed higher sGAG content in the periphery of constructs containing hyaluronic
other groups (p < 0.001) (Figure 7e).
   acid (Figure 7f—left). Of note, the staining in FH-5 hydrogels appears more homogeneously
      Histology revealed higher sGAG content in the periphery of constructs containing hyaluronic
   distributed, perhaps due to the contraction of constructs. On evaluation of picrosirius red staining,
acid (Figure 7f—left). Of note, the staining in FH-5 hydrogels appears more homogeneously
   revealing collagen content, more profound staining was observed at the periphery of constructs after
distributed, perhaps due to the contraction of constructs. On evaluation of picrosirius red staining,
   21 days in all groups, similar to alcian blue staining (Figure 7f).
revealing collagen content, more profound staining was observed at the periphery of constructs after
21 days in all groups, similar to alcian blue staining (Figure 7f).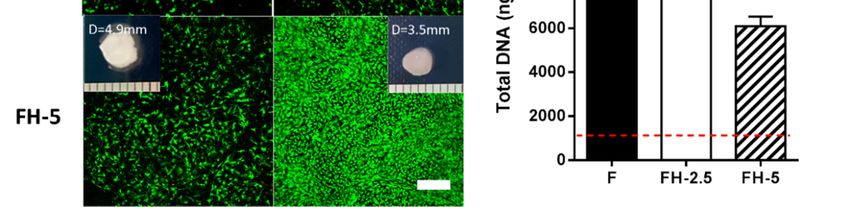
J. Funct. Biomater. 2018, 9, 43                                                                                           9 of 19
J. Funct. Biomater. 2018, 9, x FOR PEER REVIEW                                                                             9 of 19

     Figure 7.
     Figure       Effect of
              7. Effect    of increasing
                               increasing concentration
                                           concentration of  of hyaluronic
                                                                 hyaluronic acid
                                                                               acid (0,
                                                                                     (0, 2.5,
                                                                                         2.5, and
                                                                                              and 55 mg/mL)
                                                                                                      mg/mL) on  on matrix
                                                                                                                      matrix
     accumulation       of chondrocytes    after  21 days    of culture.   (a) Total  sGAG     (µg) * indicates
     accumulation of chondrocytes after 21 days of culture. (a) Total sGAG (μg) * indicates statistical           statistical
     difference (p
     difference   (p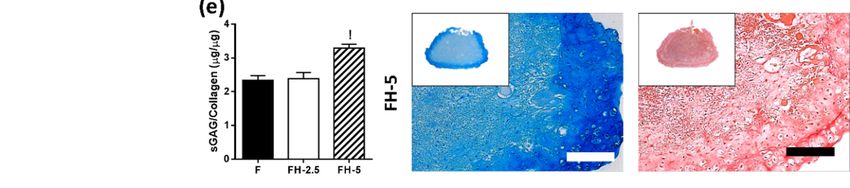
J. Funct. Biomater. 2018, 9, 43                                                                     10 of 19

used fluorescently labelled fibrin gels to analyse pore size, and found smaller pore sizes for higher
concentrations of fibrin [45]. Another study by Chiu et al. also found a correlation between smaller
pore size in higher fibrinogen concentration gels with reduced diffusion and permeability through
these gels [47]. These observations correlate with the findings of this work, and perhaps explain the
lack of contraction with higher concentrations of fibrinogen, due to the presence of smaller pore sizes
between the fibres which are more stable over time.

3.2. Higher Fibrin Concentrations Enhance Proliferation
      Cell proliferation was found to be enhanced for increasing fibrinogen concentrations. Previous work
has reported reduced permeability with increasing concentration, which would be indicative
of a diminished nutrient supply for encapsulated cells [47], and may limit cell proliferation.
For MSCs, Ho et al. observed increased proliferation with decreasing fibrinogen concentration [40,47].
These differences in proliferation kinetics could be due to the specific cell types utilised. Chondrocytes
and MSCs are derived from different niches, and have specific requirements in terms of nutrients such
as glucose and oxygen. The microenvironmental niche of chondrocytes comprises of low oxygen and
low nutrient supply, due to it being an avascular tissue.
      For lower fibrin concentrations, increased cell death was observed, which could be a result
of the increased contraction due to lower fibre density [45]. Being softer gels, with larger pores,
facilitates cells to exert a force on their surrounding matrix, resulting in contraction of hydrogels and
smaller effective pore sizes. These smaller pores, and a higher cell density, may impact on nutrient
availability, causing deprivation in the centre, where more cell death occurs.

3.3. Hyaluronic Acid Supports Cell Spreading, Proliferation, and the Accumulation of
Proteoglycan-Rich Matrix
     The enhanced proliferation of chondrocytes in fibrin gels may also be due to increased cell–matrix
interaction of fibrin with CD44 surface receptors [48,49]. Cell–matrix interaction occurs through
different surface proteins, and it is widely accepted that HA has a high affinity to the cell surface
receptor CD44, which is present on different cell types such as chondrocytes, MSCs, and hemopoietic
stem cells [50–54]. Once CD44 is activated, an upregulation of the receptor occurs, resulting in
reorganisation of the cytoskeleton proteins, clustering of CD44, covalent dimerisation, and binding of
HA [55]. High molecular weight (HMW) HAs are long molecules, which can bind to several CD44
receptors at a time, resulting in increased affinity. This binding can affect alignment of intracellular
actin filaments, and thus influence the cell shape of chondrocytes [56–58], as observed in this work. It is
also known that HA mediates both cell–cell and cell–matrix interactions [50,51]. Chondrocytes have
been shown to maintain their phenotype when cultured on hyaluronic acid compared to collagen
type I hydrogels, with enhanced proliferation and higher expression of chondrogenic markers such
as Col2 and aggrecan [59], illustrating the important role of ECM-derived molecules in regulating
cellular phenotype. This is in agreement with our findings, whereby enhanced cell proliferation, sGAG,
and collagen type II accumulation was observed when hyaluronic acid was incorporated into the
fibrin matrix.

3.4. Collagen Accumulation Is Enhanced in Fibrin–Collagen Hydrogels
      Incorporation of collagen into fibrin-based hydrogels enhanced total collagen accumulation
after three weeks in culture, compared to all other groups. Specifically, we observed enhanced col1
deposition at the periphery of hydrogels and enhanced levels of collagen type II within the pericellular
matrix (PCM) of chondrocytes. It has been shown that fibrin can interact with CD44 and the integrin
αvβ3. αvβ3 is an integrin which has no intracellular effect on chondrocytes when present or knocked
out, indicating no major role when attachment of chondrocytes occurs [60]. The affinity to the integrin
and the cell–matrix attachment using the RGD motifs of fibrin may be higher than the interaction
with CD44, which explains the limited effect of fibrin gel on chondrocytes. Fibrin provides binding
J. Funct. Biomater. 2018, 9, 43 11 of 19
sites, which do not affect chondrocytes further through intracellular signalling. Previous work has
shown higher levels of col2 expression of NP cells in fibrin–collagen hydrogels both in vitro and
in vivo [20]. It has also been shown that collagen type I can specifically bind to fibrin, using the
integrin αvβ3 connection as a functional interface matrix which could activate different intracellular
pathways [61]. Further, it has been shown that the combination of collagen and fibrin alters the
mechanical properties [62,63], which could also be responsible for phenotypic changes.
3.5. Hyaluronic Acid Appears to Supress Collagen ECM Accumulation
Incorporation of hyaluronic acid into fibrin–collagen matrices appeared to suppress levels
of total collagen and increased levels of sGAG, possibly due to the activation of CD44 receptors.
Collagen–cell interactions mainly activate pathways involved with cell adhesion, cell migration,
and stress fibre assembly in AF and NP cells, which are not primarily involved in matrix deposition [64].
Mahapatra et al., examined the behaviour of chondrocytes in a triple matrix consisting of alginate,
collagen, and HA (Alg–Col–HA), compared to a double matrix of alginate and HA only (Alg–HA) [65].
The authors found that the triple matrix supported proliferation significantly more than the double
matrix after 21 days, with enhanced expression of chondrogenic markers. This contrasts with our
findings, where the double matrix with hyaluronic acid and the triple matrix appear to have similar
chondrogenic capacities. However, it should be noted that Mahapatra et al. utilised alginate as the
supporting gel, which does not provide binding sites, and may explain the different results observed.
3.6. Incorporation of 5 mg/mL HMW Hyaluronic Acid into Fibrin Matrices Enhances sGAG/Collagen Ratio
In the final stage of this study, the effect of different amounts of hyaluronic incorporated into the
fibrin matrix was investigated. Previous work has investigated the effect of different concentrations of
HA (0.1–3.0 mg/mL) on chondrocytes in alginate hydrogels [66]. The authors observed a trend towards
higher levels of DNA, sGAG, and collagen after 14 days with lower concentrations (0.1–1 mg/mL)
of HA. However, at higher concentrations, diminished DNA and collagen contents were observed,
similar to the present study. It has been shown HMW HA, as used in this work, can bind to several
CD44 surface markers at a time [57,58], indicating that saturation of CD44–HA interaction can occur
even with a lower concentration of HMW HA molecules. This suggests a threshold exists beyond
which increasing HA concentration will have no additional benefit.
Another possible explanation for the observed enhancement of sGAG with higher concentrations
of HA is due to a physical change in hydrogel network, rather than a cellular activation alone. HA is
inherently difficult to retain in hydrogel systems, and easily diffuses into the surrounding media [67],
which was also evidenced in acellular hydrogel studies in the present work. Therefore, it is difficult
to determine for what period lower HA concentrations are effective to elicit a beneficial response.
At the highest HA concentration (FH-5), shrinkage of constructs was observed, which may have led to
entrapment of HA within the fibrin matrix network, resulting in a higher degree of cell–cell contact and
cellular condensation, thereby promoting chondrogenesis. Whether the beneficial effect of the highest
concentration of HA is due to the binding of HA or due to the initiated condensation of the construct
remains unclear, and warrants further investigation. Overall, these findings suggest, despite increased
contraction, a concentration of 5 mg/mL HA to be suitable for disc repair, due to the enhanced NP-like
matrix accumulation of articular chondrocytes within this network.
4. Materials and Methods
4.1. Study Design
This study consisted of three different stages (Figure 8). In all stages, articular chondrocytes
were isolated and expanded in monolayer from porcine knee joints until passage 1 or 2. In stage 1,
different final fibrin concentrations (12.5, 25, 37.5, and 50 mg/mL) were investigated. Stage 2 involvedJ. Funct. Biomater. 2018, 9, 43 12 of 19
incorporation of collagen and hyaluronic acid into fibrin. Stage 3 examined the influence of increasing
HA concentration
J. Funct. Biomater. 2018,on
9, xpromoting matrix accumulation by articular-derived chondrocytes.
FOR PEER REVIEW 12 of 19
Figure 8.
Figure 8. Schematic
Schematic ofof experimental
experimental design
design of
of the fibrin study.
the fibrin study. In
In stage
stage 1,
1, different final fibrin
different final fibrin
concentrations (12.5,
concentrations (12.5, 25,
25, 37.5,
37.5, and
and 5050 mg/mL)
mg/mL) were
were investigated.
investigated. Stage
Stage 22 involved
involved incorporation
incorporation of
of
collagen and
collagen andhyaluronic
hyaluronicacidacid into fibrin.
into fibrin. Stage 3Stage 3 examined
examined theofinfluence
the influence increasing of
HAincreasing HA
concentrations
concentrations
(2.5, 5 mg/mL) (2.5, 5 mg/mL) matrix
on promoting on promoting matrixby
accumulation accumulation by articular-derived
articular-derived chondrocytes. chondrocytes.
4.2. Hydrogel
4.2. Hydrogel Fabrication
Fabrication
The following
The following components
components were were used
used for
for the
the fabrication
fabrication ofof different
different hydrogel
hydrogel compositions:
compositions:
fibrinogen type
fibrinogen type I-S
I-S (60–85%
(60–85% protein,
protein, ~10%
~10% sodium
sodium citrate,
citrate, and
and ~15%
~15% sodium
sodium chloride, Sigma-Aldrich
chloride, Sigma-Aldrich
F8630, Arklow, Ireland), thrombin from bovine plasma (Sigma-Aldrich, T4648, Arklow, Ireland),
F8630, Arklow, Ireland), thrombin from bovine plasma (Sigma-Aldrich, T4648, Arklow, Ireland),
hyaluronic acid
hyaluronic acid sodium
sodium salt
salt from
fromStreptococcus
Streptococcusequiequi(MW
(MW==1.5 1.5−− 1.8
1.8 ×× 10
106 Da,
6
Da, Sigma-Aldrich
Sigma-Aldrich 53747,
53747,
Arklow, Ireland), and collagen type I, rat tail high concentration (Corning™ 354249,
Arklow, Ireland), and collagen type I, rat tail high concentration (Corning™ 354249, Corning, NY, USA). Corning, NY,
USA).
4.2.1. Preparation of Fibrin Hydrogels with Various Concentrations of Fibrinogen
4.2.1. Preparation of Fibrin Hydrogels with Various Concentrations of Fibrinogen
Fibrin hydrogels were produced by solubilising desired concentrations of fibrinogen type I-S
Fibrin
(60–85% hydrogels
protein, ~10% were
sodiumproduced by solubilising
citrate, and ~15% sodium desired concentrations
chloride, Sigma-Aldrich, of fibrinogen type I-S
Arklow, Ireland) in
(60–85%
10,000 protein,
KIU/mL ~10% sodium
aprotinin solution citrate,
(NordicandPharma,
~15% sodium
Limhamn,chloride,
Sweden)Sigma-Aldrich,
containing 19Arklow,
mg/mL Ireland)
sodium
in 10,000atKIU/mL
chloride 37 ◦ C, andaprotinin solution
crosslinked using(Nordic Pharma,thrombin
a pre-warmed Limhamn, Sweden)
solution containing
(5 U/mL 19 mg/mL
in 40 mM CaCl2 ,
sodium chloride at 37 °C, and crosslinked using a pre-warmed thrombin solution
pH 7) and allowed to gel (see Table 1). To allow gelation to proceed, hydrogels were incubated (5 U/mL in 40 mM
for 30
CaClat
min 2, pH
37 7)
◦ C and allowed to gel
in a humidified (see Table 1). To allow gelation to proceed, hydrogels were incubated
atmosphere.
for 30 min at 37 °C in a humidified atmosphere.
Table 1. Preparation of fibrin hydrogels with various concentrations (12.5, 25, 37.5, and 50 mg/mL).
Fibrinogen Concentration (mg/mL) Fibrinogen: Thrombin Ratio Final Fibrinogen Concentration (mg/mL)
25 1:1 12.5
50 1:1 25
75 1:1 37.5
100 1:1 50J. Funct. Biomater. 2018, 9, 43 13 of 19
Table 1. Preparation of fibrin hydrogels with various concentrations (12.5, 25, 37.5, and 50 mg/mL).
Fibrinogen Concentration (mg/mL) Fibrinogen: Thrombin Ratio Final Fibrinogen Concentration (mg/mL)
25 1:1 12.5
50 1:1 25
75 1:1 37.5
100 1:1 50
4.2.2. Fibrin Hydrogels Containing ECM Components (Collagen, Hyaluronic Acid)
Specific fibrin-based hydrogels (fibrin only, fibrin–hyaluronic acid, fibrin–collagen, and fibrin–
collagen–hyaluronic acid) were fabricated at 37 ◦ C, and allowed to crosslink for 60 min in a
humidified atmosphere inside a 3% agarose mould (see Table 2). To create fibrin–hyaluronic acid
hydrogels, hyaluronic acid (3 mg/mL) was dissolved in thrombin and combined with fibrinogen
to yield a final concentration containing 1.5 mg/mL hyaluronic acid. To create fibrin–collagen gels,
collagen type I (Corning, Corning, NY, USA) was incorporated at a final concentration of 1.33 mg/mL
into a fibrinogen/thrombin mixture as follows: soluble collagen with an initial concentration
of 6 mg/mL in 0.02 M acetic acid was neutralised using a buffer containing NaOH, NaHCO3 ,
HEPES, and 10× RPMI media, and combined with low-glucose Dulbecco’s modified Eagle’s medium
(1000 mg/mL D-glucose, Sigma, Arklow, Ireland). Thrombin (5 U/mL) was added and crosslinked
using pre-warmed fibrinogen at a specified concentration to obtain a final concentration of 50 mg/mL
fibrinogen. For fibrin–collagen–hyaluronic hydrogels, a thrombin–hyaluronic acid mix (5.2 mg/mL
initial HA) was combined with neutralised collagen in a similar fashion as described for fibrin–collagen
hydrogels, and crosslinked using pre-warmed fibrinogen.
Table 2. Different materials investigated and their final concentrations.
Abbreviation Final Fibrin Conc. (mg/mL) Col Conc. (mg/mL) Hyaluronic Acid Conc. (mg/mL)
Fibrin F 50
Fibrin–HA FH 50 1.5
Fibrin–COL FC 50 1.33
Fibrin–Col–HA FCH 50 1.33 1.5
4.2.3. Fibrin-Based Hydrogels with Increasing Hyaluronic Acid Concentrations
Fibrin–hyaluronic acid hydrogels were created as described in the previous Section 4.2.2 using an
initial HA concentration of 5 mg/mL in thrombin (5 U/mL). Thrombin–HA solution was combined
with fibrinogen (100 mg/mL) with and without the addition of 5 mg/mL HA at a ratio of 1:1 to obtain
the desired final concentrations of 2.5 mg/mL or 5 mg/mL, respectively. Cells were combined with
the fibrinogen solution prior to incorporation of thrombin. To ensure crosslinking, all hydrogels were
incubated for 60 min at 37 ◦ C in a humidified atmosphere.
4.3. Chondrocyte Isolation and Monolayer Expansion
Juvenile porcine chondrocytes (pCC) were isolated from articular cartilage of 4-month-old
female porcine donors (~50 kg). Tissue was finely minced and digested in collagenase for 12 h
at 37 ◦ C. Digested tissue/cell suspensions were passed through a 40 µm cell strainer to remove
tissue debris, and washed three times by repeated centrifugation at 650 g for 5 min. Cell viability
was determined with a haemocytometer and trypan blue exclusion. Cells were seeded at an
initial density of 5 × 10³ cells/cm2 in media consisting of low-glucose Dulbecco’s modified Eagle’s
medium (LG-DMEM; 1 mg/mL D-glucose, Sigma) supplemented with 10% foetal bovine serum
(FBS), penicillin (100 U/mL)–streptomycin (100 µg/mL) (all GIBCO, Invitrogen, Dublin, Ireland),
and amphotericin B (0.25 µg/mL, Sigma-Aldrich, Arklow, Ireland) at 37 ◦ C and 5% CO2 , and cultured
until passage 1 or 2.J. Funct. Biomater. 2018, 9, 43 14 of 19
4.4. Cell Encapsulation
4.4.1. Varied Fibrin Concentration Hydrogels
For fibrin encapsulation, pCCs were suspended in fibrinogen solutions (Table 1) at a cell density
of 8 × 10⁶ cells/mL. This was combined with thrombin solution (1:1 ratio) and allowed to gel in an
3% agarose mould, pre-soaked in cell culture media to ensure nutrient supply for cells for 30 min at
37 ◦ C to produce cylindrical constructs (Ø5 mm × 3 mm thickness), and a final cell seeding density of
4 × 10⁶ cells/mL.
4.4.2. Fibrin–Collagen and Fibrin–Hyaluronic Acid–Collagen Hydrogels
For encapsulation, pCCs were suspended in pre-warmed fibrinogen solution and combined with
collagen–thrombin or collagen–HA–thrombin solution, respectively, to obtain a final cell seeding
density of 4 × 10⁶ cells/mL at matrix concentrations, described in Table 2 Gelling took place
in 3% agarose moulds soaked in media for 60 min at 37 ◦ C, producing cylindrical constructs
(Ø5 mm × 3 mm thickness).
4.4.3. Fibrin–Hyaluronic Acid Hydrogels
For encapsulation of pCCs into different concentrations of fibrin–hyaluronic acid hydrogels,
cells were suspended in fibrinogen solution (100 mg/mL) with or without incorporation of 5 mg/mL
HA. This was combined at a ratio of 1:1 with 5 U/mL thrombin–HA solution, to obtain a final cell
seeding density of 4 × 10⁶ cells/mL, and allowed to gel in a 3% agarose mould pre-soaked in media
for 60 min at 37 ◦ C to produce cylindrical constructs (Ø5 mm × 3 mm thickness). All samples were
allowed to equilibrate overnight before initiation of experiments.
4.5. Culture of Chondrocyte Laden Fibrin-Based Constructs
All constructs were maintained at 37 ◦ C and 5% oxygen conditions in 2 mL of chemically defined
medium (CDM) consisting of lgDMEM supplemented with penicillin (100 U/mL)–streptomycin
(100 µg/mL) (both GIBCO, Biosciences, Ireland), 40 µg/mL L-proline, 50 µg/mL L-ascorbic
acid-2-phosphate, 1.5 mg/mL BSA, 1× insulin–transferrin–selenium, 100 nM dexamethasone (all from
Sigma–Aldrich, Ireland), and 5% FBS. Medium was exchanged twice weekly and sampled for
biochemical analysis for a total duration of 21 days.
4.6. Determination of Hydrogel Contraction
Hydrogel contraction kinetics were determined via image analysis using a digital camera
(Canon Powershot SX240HS) at each feeding period (twice weekly). The average diameter of three
constructs was determined using image analysis software (ImageJ, National Institutes of Health,
and Bethesda, Maryland).
4.7. Live/Dead Analysis
Cell viability was assessed using a LIVE/DEAD® Viability/Cytotoxicity Assay Kit (Invitrogen).
Briefly, hydrogels were cut in half and washed in phosphate buffered saline (PBS, Sigma, Arklow,
Ireland), followed by incubation in PBS containing 2 µM calcein AM (live cell membrane,
abs/em = 494/517 nm) and 4 µM ethidium homodimer-1 (dead cell DNA, ex/em = 528/617 nm;
both from Cambridge Bioscience, Cambridge, UK). Hydrogels were again washed in PBS, imaged with
a Leica SP8 scanning confocal microscope at 515 and 615 nm and assessed using Leica Application Suit
X (LAS X) Software.J. Funct. Biomater. 2018, 9, 43 15 of 19
4.8. Cell Shape Analysis
Cell shape was analysed on fixed samples (4% PFA, Sigma-Aldrich, Arklow, Ireland).
After fixation, samples were thoroughly washed in PBS and permeabilised using 0.5% Triton-X.
Fluorescent stains were diluted in 1.5% BSA solution (for rhodamine phalloidin (ex/em = 540/565 nm)
at 1:40, and for DAPI (ex/em = 364/454 nm), a 1:1000 dilution was used). Stains were incubated
for 1 h (rhodamine phalloidin) and 10 min (DAPI) at room temperature, avoiding artificial light,
imaged with a Leica SP8 scanning confocal at 358/524 and 540/565 nm channels, and assessed using
Leica Application Suit X (LAS X) Software.
4.9. Quantitative Biochemical Analysis
To quantify the accumulation of biochemical constituents, samples were digested with 125 µg/mL
papain in 0.1 M sodium acetate, 5 mM L-cysteine-HCl, 0.05 M EDTA, pH 6.0 (all from Sigma-Aldrich)
at 60 ◦ C under constant rotation for 18 h (n = 3 for each group). DNA content of each sample was
quantified using the Hoechst bisbenzimide 33258 dye assay, with a calf thymus DNA standard.
sGAG content was quantified using the dimethylmethylene blue dye-binding assay (Blyscan,
Biocolor Ltd., Carrick Fergus, Northern Ireland), with a chondroitin sulphate standard. Total collagen
content was determined by measuring the hydroxyproline content. Samples were hydrolysed at 110 ◦ C
for 18 h in 38% HCl, and assayed using a chloramine-T assay [68] with a hydroxyproline/collagen
ratio of 1:7.69 [69]. Each biochemical constituent was normalised to DNA content.
4.10. Histology
At each time point, samples were fixed in 4% paraformaldehyde overnight at 4 ◦ C, followed by
repeated washings in PBS. Fixed samples were dehydrated in a graded series of ethanol (70% to 100%),
embedded in paraffin wax, sectioned at 7 µm, and affixed to microscope slides. Sections were
stained with 1% alcian blue 8GX in 0.1 M HCL to assess sGAG content and picrosirius red to
assess collagen distribution (all from Sigma-Aldrich). Collagen types 1 and 2 were evaluated using a
standard immunohistochemical technique. Briefly, sections were treated with peroxidase, followed by
treatment with chondroitinase ABC (Sigma-Aldrich) in a humidified environment at 37 ◦ C to enhance
permeability of the extracellular matrix. Sections were incubated with goat serum to block non-specific
sites and collagen type I (abcam 90395, 1:400), collagen type II (abcam 3092, 1:100) primary antibodies
(mouse monoclonal, IgG, Cambridge, UK) were applied overnight at 4 ◦ C. Next, the secondary antibody
(anti-mouse IgG biotin conjugate, 1.5:200) (Sigma-Aldrich B7151) was added for 1 h, followed by
incubation with ABC reagent (Vectastain PK-400, Vector Labs, Peterborough, UK) for 45 min. Finally,
sections were developed with DAB peroxidase (Vector Labs) for 5 min. Positive and negative controls
were included in the immunohistochemistry staining protocol for each batch.
4.11. Statistical Analysis
Statistical analyses were performed using GraphPad Prism (version 6, GraphPad Software,
La Jolla, CA, USA) software with 3–4 samples analysed for each experimental group.
The sGAG/collagen ratio was determined by dividing sGAG (µg) by collagen (µg). One-way ANOVA
was used for analysis of variance with Tukey’s multiple comparisons test to compare between groups.
Results are displayed as mean ± standard deviation, with significance accepted at a level of p < 0.05.
5. Conclusions
In this work, we explored the incorporation of ECM molecules into fibrin-based hydrogels
in order to develop a suitable injectable system to facilitate cellular delivery. Significant hydrogel
contraction was observed using low (12.5 mg/mL) fibrin concentrations, with limited contraction for
concentrations at or above 25 mg/mL. With the incorporation of ECM components, cell viability was
seen to be maintained when HA was incorporated. HA also enhanced sGAG accumulation and tendedJ. Funct. Biomater. 2018, 9, 43 16 of 19
to suppress collagen formation at higher concentrations. There did not appear to be any significant
benefit of incorporating collagen in the fibrin matrix. Lastly, we showed that there is an overall increase
in the sGAG to collagen ratio when increasing HA concentration in the fibrin matrix to 5 mg/mL.
Taken together, these results suggest that incorporation HA can enhance the bioactivity of fibrin-based
hydrogels, which may help advance the clinical potential of commercial cell and biomaterial ventures
in the treatment of IVD regeneration.
Author Contributions: Conceptualization, C.T.B.; Data curation, J.G.; Formal analysis, J.G.; Funding acquisition,
C.T.B.; Investigation, J.G.; Supervision, C.T.B.; Validation, J.G.; Visualization, J.G.; Writing—original draft, J.G.;
Writing—review & editing, J.G. and C.T.B.
Funding: This work was supported by Irish Research Council Postgraduate Scholarship (2014–2018), Grant No:
202860/13027 and Science Foundation Ireland Career Development Award (15/CDA/3476).
Conflicts of Interest: The authors declare no conflict of interest.
References
1. Hoy, D.; Brooks, P.; Blyth, F.; Buchbinder, R. The epidemiology of low back pain. Best Pract. Res.
Clin. Rheumatol. 2010, 24, 769–781. [CrossRef] [PubMed]
2. Deyo, R.A.; Weinstein, J.N. Low back pain. N. Engl. J. Med. 2001, 344, 363–370. [CrossRef] [PubMed]
3. Meisel, H.J.; Siodla, V.; Ganey, T.; Minkus, Y.; Hutton, W.C.; Alasevic, O.J. Clinical experience in cell-based
therapeutics: Disc chondrocyte transplantation a treatment for degenerated or damaged intervertebral disc.
Biomol. Eng. 2007, 24, 5–21. [CrossRef] [PubMed]
4. Hegewald, A.A.; Endres, M.; Abbushi, A.; Cabraja, M.; Woiciechowsky, C.; Schmieder, K.; Kaps, C.; Thome, C.
Adequacy of herniated disc tissue as a cell source for nucleus pulposus regeneration. J. Neurosurg. Spine
2011, 14, 273–280. [CrossRef] [PubMed]
5. Masuda, K. Biological repair of the degenerated intervertebral disc by the injection of growth factors.
Eur. Spine J. 2008, 17 (Suppl. 4), 441–451. [CrossRef] [PubMed]
6. Coric, D.; Kim, P.K.; Clemente, J.D.; Boltes, M.O.; Nussbaum, M.; James, S. Prospective randomized study of
cervical arthroplasty and anterior cervical discectomy and fusion with long-term follow-up: Results in 74
patients from a single site. J. Neurosurg. Spine 2013, 18, 36–42. [CrossRef] [PubMed]
7. Acosta, F.L., Jr.; Metz, L.; Adkisson, H.D.; Liu, J.; Carruthers-Liebenberg, E.; Milliman, C.; Maloney, M.;
Lotz, J.C. Porcine intervertebral disc repair using allogeneic juvenile articular chondrocytes or mesenchymal
stem cells. Tissue Eng. Part A 2011, 17, 3045–3055. [CrossRef] [PubMed]
8. Hohaus, C.; Ganey, T.M.; Minkus, Y.; Meisel, H.J. Cell transplantation in lumbar spine disc degeneration
disease. Eur. Spine J. 2008, 17 (Suppl. 4), 492–503. [CrossRef] [PubMed]
9. Allon, A.A.; Butcher, K.; Schneider, R.A.; Lotz, J.C. Structured coculture of mesenchymal stem cells and disc
cells enhances differentiation and proliferation. Cells Tissues Organs 2012, 196, 99–106. [CrossRef] [PubMed]
10. Feng, G.; Zhao, X.; Liu, H.; Zhang, H.; Chen, X.; Shi, R.; Liu, X.; Zhao, X.; Zhang, W.; Wang, B. Transplantation
of mesenchymal stem cells and nucleus pulposus cells in a degenerative disc model in rabbits: A comparison
of 2 cell types as potential candidates for disc regeneration. J. Neurosurg. Spine 2011, 14, 322–329. [CrossRef]
[PubMed]
11. Omlor, G.W.; Bertram, H.; Kleinschmidt, K.; Fischer, J.; Brohm, K.; Guehring, T.; Anton, M.; Richter, W.
Methods to monitor distribution and metabolic activity of mesenchymal stem cells following in vivo injection
into nucleotomized porcine intervertebral discs. Eur. Spine J. 2010, 19, 601–612. [CrossRef] [PubMed]
12. Bertram, H.; Kroeber, M.; Wang, H.; Unglaub, F.; Guehring, T.; Carstens, C.; Richter, W. Matrix-assisted cell
transfer for intervertebral disc cell therapy. Biochem. Biophys. Res. Commun. 2005, 331, 1185–1192. [CrossRef]
[PubMed]
13. Zeng, Y.; Chen, C.; Liu, W.; Fu, Q.; Han, Z.; Li, Y.; Feng, S.; Li, X.; Qi, C.; Wu, J.; et al. Injectable microcryogels
reinforced alginate encapsulation of mesenchymal stromal cells for leak-proof delivery and alleviation of
canine disc degeneration. Biomaterials 2015, 59, 53–65. [CrossRef] [PubMed]
14. Murua, A.; Portero, A.; Orive, G.; Hernandez, R.M.; de Castro, M.; Pedraz, J.L. Cell microencapsulation
technology: Towards clinical application. J. Control. Release 2008, 132, 76–83. [CrossRef] [PubMed]You can also read


