Does Media Concentration Lead to Biased Coverage? Evidence from Movie Reviews
←
→
Page content transcription
If your browser does not render page correctly, please read the page content below
Does Media Concentration Lead to Biased Coverage? Evidence
                    from Movie Reviews∗
                  Stefano DellaVigna                          Johannes Hermle
                UC Berkeley and NBER                         University of Bonn
                 sdellavi@berkeley.edu                  johannes.hermle@uni-bonn.de

                                            October 15, 2014

                                                  Abstract
           Media companies have become increasingly concentrated. But is this consolidation
       without cost for the quality of information? Conglomerates generate a conflict of interest:
       a media outlet can bias its coverage to benefit companies in the same group. We test
       for bias by examining movie reviews by media outlets owned by News Corp.–such as the
       Wall Street Journal–and by Time Warner–such as Time. We use a matching procedure
       to disentangle bias due to conflict of interest from correlated tastes. We find no evidence
       of bias in the reviews for 20th Century Fox movies in the News Corp. outlets, nor for
       the reviews of Warner Bros. movies in the Time Warner outlets. We can reject even
       small effects, such as biasing the review by one extra star (our of four) every 13 movies.
       We test for differential bias when the return to bias is plausibly higher, examine bias by
       media outlet and by journalist, as well as editorial bias. We also consider bias by omission:
       whether the media at conflict of interest are more likely to review highly-rated movies by
       affiliated studios. In none of these dimensions we find systematic evidence of bias. Lastly,
       we document that conflict of interest within a movie aggregator does not lead to bias
       either. We conclude that media reputation in this competitive industry acts as a powerful
       disciplining force.

   ∗
    A previous version of this paper circulated in 2011 with Alec Kennedy as collaborator. Ivan Balbuzanov,
Natalie Cox, Tristan Gagnon-Bartsch, Jordan Ou, and Xiaoyu Xia provided excellent research assistance. We
thank Austan Goolsbee, Marianne Bertrand, Saurabh Bhargava, Lucas Davis, Ignacio Franceschelli, Matthew
Gentzkow, Austan Goolsbee, Jesse Shapiro, Noam Yuchtman, Joel Waldfogel and audiences at Brown University,
Boston University, Chicago Booth, UC Berkeley, and at the 2011 Media Conference in Moscow for very helpful
comments. We also thank Bruce Nash for access to data from the-numbers, as well as helpful clarifications about
the industry.
1    Introduction
On Dec. 13, 2007, News Corp. officially acquired Dow Jones & Company, and hence the Wall
Street Journal, from the Bancroft family. The acquisition was controversial in part because of
concerns about a conflict of interest. Unlike the Bancroft family whose holdings were limited
to Dow Jones & Company, Murdoch’s business holdings through News Corp. include a movie
production studio (20th Century Fox), cable channels such as Fox Sports and Fox News, and
satellite televisions in the Sky group, among others. The Wall Street Journal coverage of
businesses in these sectors may be biased to benefit the parent company, News Corp.
    The Wall Street Journal case is hardly unique. Media outlets are increasingly controlled by
large corporations, such as Comcast, which owns NBC and Telemundo, the Hearst Corporation,
which owns a network of newspapers and ESPN, and Time Warner, which owns HBO, CNN,
and other media holdings. Indeed, in the highly competitive media industry, consolidation
with the ensuing economies of scale is widely seen as a necessary condition for survival.
    But is this consolidation without cost for the quality of coverage given the induced conflict
of interest? Addressing this question is important, since potential biases in coverage can
translate into a policy concern in the presence of sizeable persuasion effects from the media
(e.g., DellaVigna and Kaplan, 2007; Enikolopov, Petrova, and Zhuravskaya, 2011).
   Yet should we expect coverage to be biased due to consolidation? If consumers can detect
the bias in coverage due to cross-holdings and if media reputation is paramount, no bias should
occur. If consumers, instead, do not detect the bias perhaps because they are unaware of the
cross-holding, coverage in the conglomerate is likely to be biased.
    Despite the importance of this question, there is little systematic evidence on distortions in
coverage induced by cross-holdings. In this paper, we study two conglomerates–News Corp.
and Time-Warner–and measure how media outlets in these groups review movies distributed
by an affiliate in the group–such as 20th Century Fox and Warner Bros. Pictures, respectively.
The advantage of focusing on movie reviews is that they are frequent, quantifiable, and are
believed to influence ticket sales (Reinstein and Snyder, 2005), with monetary benefits to the
studio distributing the movie. As such, they are a potential target of distortion by the media
conglomerate.
   To identify the bias, we adopt a difference-in-difference strategy. We compare the review
of movies distributed by 20th Century Fox by, say, the Wall Street Journal to the reviews by
outlets not owned by News Corp. Since the Wall Street Journal may have a different evaluation
scale from other reviewers, we use as a further control group the reviews of movies distributed
by different studios, such as Paramount. If the Wall Street Journal provides systematically
more positive reviews for 20th Century Fox movies, but not for Paramount movies, we infer
that conflict of interest induces bias.
    Still, a legitimate worry is that this comparison may capture correlation in taste, rather

                                                1
than bias. The Wall Street Journal may provide more positive reviews to, say, action movies of
the type produced by 20th Century Fox because this reflects the tastes of its audience or of its
journalists, not because of conflict of interest. In general, correlation in tastes is a complicated
confound because of the difficulty in identifying the comparison group. One would like to know
which Paramount movies are similar to the 20th Century Fox and Warner Bros. movies.
   For this reason, we use the extensive Netflix, Flixster, and MovieLens data sets of user
movie ratings to find for each 20th Century Fox and Warner Bros. movie the ten movies with
the closest user ratings. We document that this matching procedure identifies similar movies:
matching movies are likely to share the genre, the MPAA rating, and the average rating by
movie reviewers, among other characteristics. We thus use the reviews of these matching
movies as comparison group.
    We start from a data set of over half a million reviews for movies released from 1985 (year
in which News Corp. acquired 20th Century Fox) until 2010 (year in which the user ratings
data ends). The data sources are two online aggregators, Metacritic and Rotten Tomatoes.
We compare the reviews by 336 outlets with no conflict of interest (known to us) to the reviews
issued by 12 media outlets with cross-holdings. Eight media outlets are owned by News Corp.
during at least part of the sample–the U.S. newspapers Chicago Sun-Times (owned until
1986), New York Post (owned until 1988 and after 1993), and Wall Street Journal (owned
from 2008), the U.K. newspapers News of the World, Times and Sunday Times, the weekly
TV Guide (owned from 1988 until 1999) and the website Beliefnet (from 2007 to 2010). Four
media outlets are owned by Time Warner–the weekly magazines Entertainment Weekly and
Time as well as CNN and the online service Cinematical (owned from 2004 until 2009).
    We provide six pieces of evidence on the extent, type, and channel of bias. In the first test,
we compare the reviews of movies produced by the studios at conflict of interest to the reviews
of the ten matching movies. In a validation of the matching procedure, the average ratings for
the two groups of movies are nearly identical when reviewed by media outlets not at conflict
of interest. We thus estimate the extent of bias in outlets at conflict of interest, such as the
Wall Street Journal and Time magazine.
    We find no evidence of bias for either the News Corp. or Time Warner outlets. In the
benchmark specification we estimate an average bias of -0.2 points out of 100 for News Corp.
and of 0 points for Time Warner. The richness of the data ensures quite tight confidence
intervals for the finding of no bias. We can reject at the 95% level a bias of 1.9 points for News
Corp. and of 1.7 points for Time Warner, corresponding to a one-star higher review score (on
a zero-to-four scale) for one out of 13 movies. We find similar results on the binary ‘freshness’
indicator employed by Rotten Tomatoes.
   We underscore the importance of the matching procedure for the estimates of bias: cross-
sectional regressions yield statistical evidence of bias for one of the conglomerates. This seeming
bias depends on the inclusion in the control group of movies that are not comparable to the

                                                 2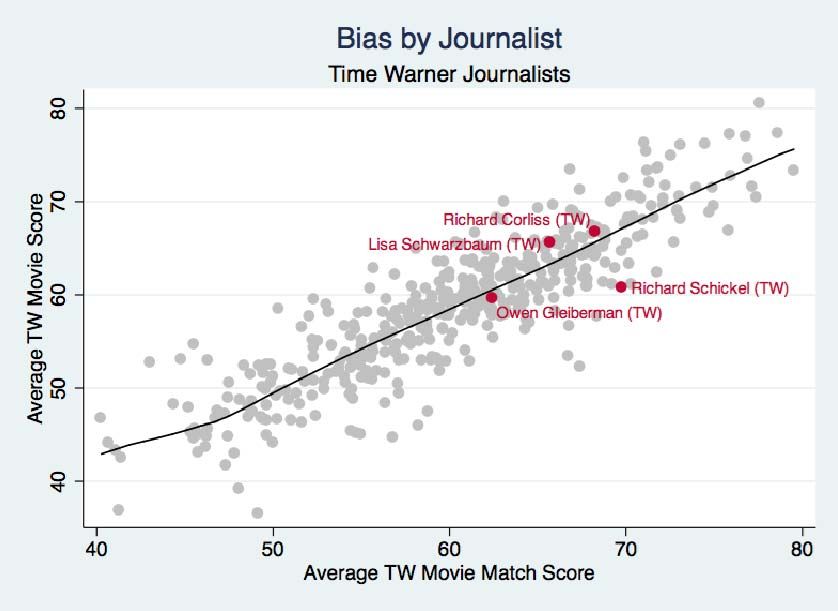
movies at conflict of interest, thus biasing the estimates.
    Second, while there appears to be no bias overall, a bias may be detectable for movies where
the return to bias is plausibly larger, holding constant the reputational cost of bias to the media
outlets. While we do not have measures of the return to bias, we consider dimensions which
are likely to correlate with it. We expect that movies with generally higher review scores are
likely to have higher return to bias, as an extra star is likely to matter more if it is the 4th star
out of 4, as compared to the second star. Also, movies distributed by the mainstream studios,
movies with larger budgets or larger box office sales are likely to have higher returns to bias.
We find no systematic pattern of differential bias in this respect.
    Third, the overall result of no bias may mask heterogeneity in bias by the individual outlets.
We find no overall statistical evidence in the twelve outlets, with more precise null effects for
the New York Post and TV Guide (News Corp.) as well as for Entertainment Weekly and
Time (Time Warner). Given that each outlet employs a small number of reviewers, we go
further and test for bias by journalist, and again do not find any systematic evidence of bias.
    Fourth, we test for bias at the editorial level by examining the assignment of movies to
reviewers. Since reviewers differ in the average generosity of their reviews, even in the absence
of bias at the journalist level, assignment of movies to more generous reviewers would generate
some bias. We find no evidence that affiliated movies are more likely to be assigned to reviewers
who are on average more positive, confirming the previous results.
    So far we tested for bias by commission: writing more positive reviews for movies at conflict
of interest. In our fifth piece of evidence, we examine bias by omission. A reviewer that intends
to benefit an affiliated studio may selectively review only above-average movies by this studio,
while not granting the same benefit to movies by other studios. This type of bias would not
appear in the previous analysis, which examines bias conditional on review. Bias by omission
is generally hard to test for, since one needs to know the universe of potential news items.
Movie reviews is a rare setting where this is the case, and thus allows us to test for this form
of bias which plays a role in models of media bias (e.g., Anderson and McLaren, 2012).
    We thus examine the probability of reviewing a movie as a function of the average review
the movie obtained in control outlets. The media outlets differ in their baseline probability of
review: Time tends to review only high-quality movies, while the New York Post reviews nearly
all movies. Importantly, these reviewing patterns do not differ for movies at conflict of interest
versus the matching movies of other studios, thus providing no evidence of omission bias. We
show how apparent evidence of omission bias for Time magazine reflects a spurious pattern,
since it appears also in a period when Time is not yet part of the Time Warner conglomerate.
    The sixth and final piece of evidence on bias examines conflict of interest at a higher
level: bias due to cross-holdings for the movie aggregator. Rotten Tomatoes, one of the
aggregators we use, was independent when launched in 1998, was then acquired by News Corp.
in September 2005, only to be divested in January of 2010. This ownership structure generates

                                                 3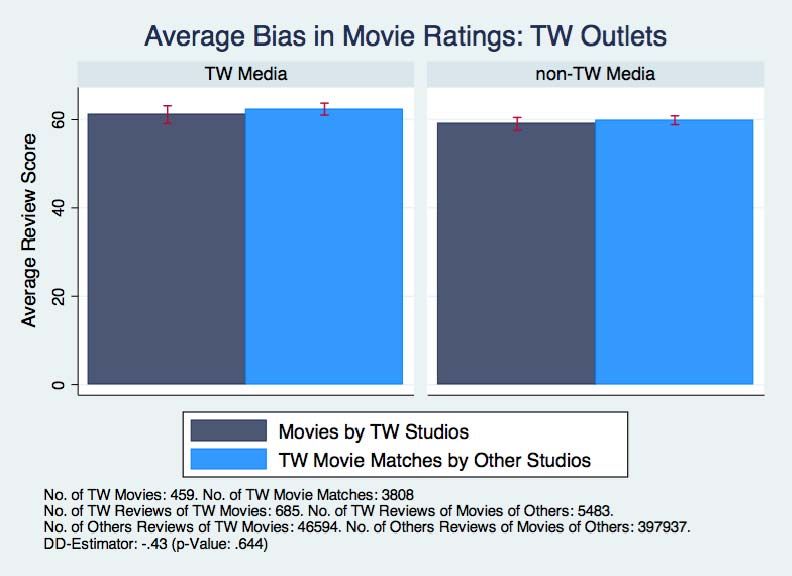
an incentive for Rotten Tomatoes to assign more positive reviews (its ‘freshness’ indicator) to
20th Century Fox movies during the period of News Corp. ownership. This test of bias is
particularly powerful statistically: bias is identified within a media outlet and by comparison
of the Rotten Tomatoes review versus the Metacritic score for the same movie review. Once
again, we find no evidence of bias in presence of conflict of interest. Most tellingly, we find
no bias even when bias would be hardest to detect (and hence presumably most likely), for
unscored reviews which are evaluated qualitatively by the Rotten Tomatoes staff.
   Overall, reputation-based incentives appear to be effective at limiting the occurrence of
bias: we find no evidence of bias by commission, no evidence of editorial bias, no systematic
evidence of bias by omission, and no evidence of bias among the aggregators.
    Using these results, we compute a back-of-the-envelope bound for the value of reputation.
Assume that an extra star (our of 4) persuades 1 percent of readers to watch a movie, an
effect in the lower range of estimates of persuasion rates (DellaVigna and Gentzkow, 2010)
and significantly smaller than the estimated impact of media reviews of Reinstein and Snyder
(2005), though admittedly we have no direct evidence. Under this assumption, an extra star
in a single movie review for a 20th Century Fox movie in a newspaper like the New York Post
with a circulation of about 500,000 readers would add approximately $40,000 in profits for
News Corp. If the New York Post had biased by one star all reviews for the 448 20th Century
Fox movies released since 1993, the profit could have been nearly $20m. The fact that such
systematic bias did not take place indicates a higher value or reputation.
   This paper relates to a vast literature on conflict of interest and most specifically in the
media (e.g., Hamilton, 2003; Ellman and Germano, 2009). Reuter and Zitzewitz (2006) and Di
Tella and Franceschelli (2011) find that media outlets bias their coverage to earn advertising
revenue. While the conflict of interest with advertisers is unavoidable for media outlets, we
investigate the additional conflict of interest induced by cross-holdings. We compare our results
with the ones in the advertising literature in the conclusion.
    A small number of papers considers media bias due to consolidation, as we do. Gilens and
Hertzman (2008) provide some evidence that the coverage of the debate on TV deregulation
is biased by conflict of interest. Goolsbee (2007) and Chipty (2001) examine the extent to
which vertical integration in the entertainment industry affect network programming and cable
offering. Dobrescu, Luca, and Motta (2013) estimate the bias in 1,400 book reviews due to
affiliation with the outlet reviewing the book; consistent with our findings, their evidence of
apparent bias is most consistent with correlated tastes, not conflict of interest. Rossman (2003)
and Ravid, Wald, and Basuroy (2006) examine the extent of bias in movie reviews, including
due to conflict of interest. Both papers use a small sample of reviews–about 1,000 reviews
for Rossman (2003) and about 5,000 reviews for Ravid et al. (2006). Relative to these papers,
the granularity of information embedded in half a million reviews and the matching procedure
allow us to obtain more precise measures and study the bias in a number of novel directions,

                                               4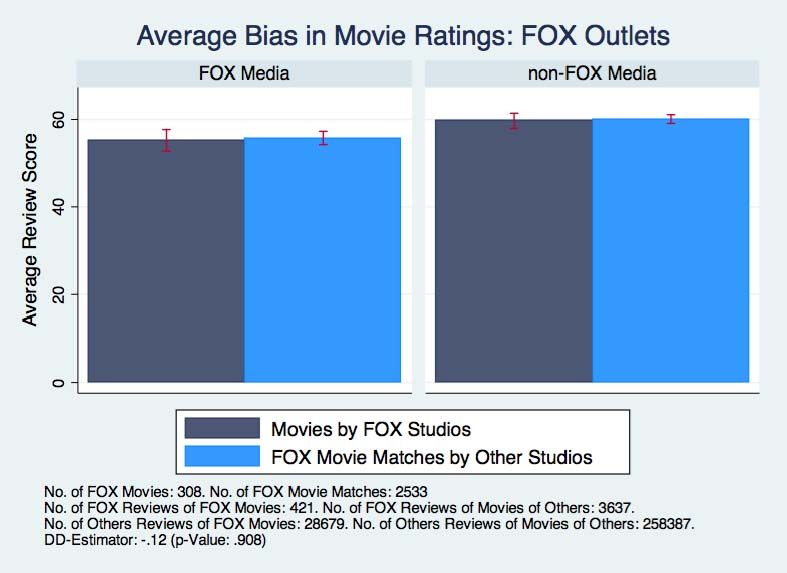
such as editorial bias and bias by omission. Camara and Dupuis (2014) estimate a cheap talk
game using movie reviews, including in the estimates a parameter for conflict of interest.
    This paper also relates to the economics of the media (Strömberg 2004; George and Wald-
fogel, 2006; DellaVigna and Kaplan, 2007; Mullainathan, Schwartzstein, and Shleifer, 2008;
Snyder and Strömberg 2010; Knight and Chiang 2011; Enikolopov, Petrova, and Zhuravskaya
2011; Dougal et al., 2012), and in particular to papers on media bias (Groseclose and Milyo,
2005; Gentzkow and Shapiro, 2010; Larcinese, Puglisi and Snyder, 2011; Durante and Knight
2012). Within the context of movie reviews we address questions that have arisen in this
literature–such as whether bias occurs by omission or commission and the role of journalists
versus that of editors–about which there is little evidence.
   Finally, the paper relates to the literature on disclosure, such as reviewed in Dranove and
Jin (2010). In our settings, media outlets do not withhold reviews for low-quality affiliated
movies, consistent with the Milgrom and Roberts (1986) unraveling result. Brown, Camerer,
and Lovallo (2012) provide evidence instead of strategic movie releases by studios with cold
openings for low-quality movies.
   The remainder of the paper is as follows. In Section 2 we introduce the data, in Section 3
we present the results of the conflict of interest test, and in Section 4 we conclude.

2     Data
2.1   Movie Reviews
Media Review Aggregators. The data used in this paper comes from two aggregators,
metacritic.com and rottentomatoes.com. Both sites collect reviews from a variety of media and
publish snippets of those reviews, but they differ in how they summarize them. Metacritic
assigns a score from 0 to 100 for each review, and then averages such scores across all reviews
of a movie to generate an overall score. For reviews with a numeric evaluation, such as for the
New York Post (0-4 stars), the score is a straightforward normalization on a 0-100 scale. For
reviews without a numerical score, such as primarily for Time magazine, Metacritic staffers
evaluate the review and assign a score on the same 0-100 scale (typically in increments of 10).
    Rotten Tomatoes does not use a 0-100 score, though it reports the underlying rating for
reviews with a score. It instead classifies each movie as ‘fresh’ or ‘rotten’, and then computes
a score for each movie — the tomatometer — as the percent of reviews which are ‘fresh’. For
quantitative reviews, the ‘freshness’ indicator is a straightforward function of the rating: for
example, movies with 2 stars or fewer (out of 4) are ‘rotten’, movies with 3 or more stars are
‘fresh’, and movies with 2.5 stars are split based on a subjective judgment. For reviews with
no quantitative score, the movie is rated as ‘fresh’ or ‘rotten’ by the staff.
    The two data sets have different advantages for our purposes. Metacritic contains more

                                               5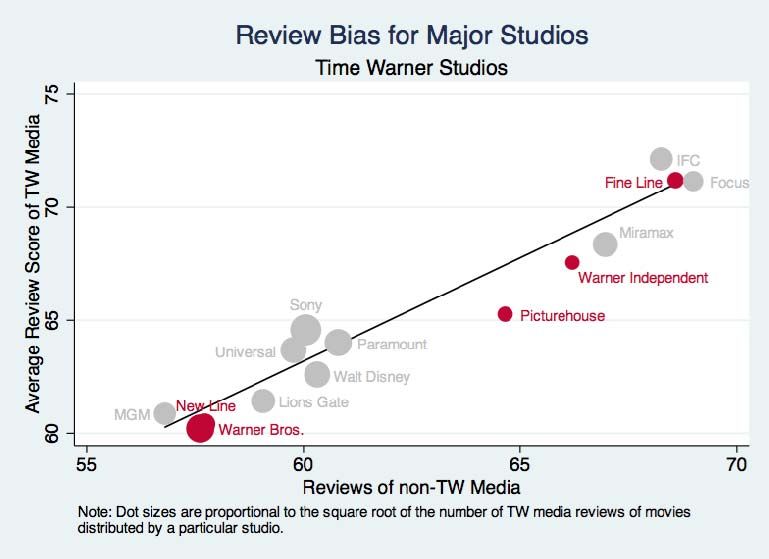
information per review, since a review is coded on a 0-100 scale, rather than with a 0 or 1
score. Rotten Tomatoes, however, contains about five times as many reviews as Metacritic,
due to coverage of more media (over 500 compared to less than 100) and a longer time span.
We take advantage of both data sets and combine all reviews in the two data sets for movies
produced since 1985 and reviewed up until July 2011 in the Metacritic website and until March
2011 on the Rotten Tomatoes website. We eliminate earlier reviews because the review data
for earlier years is sparse, and before 1985 there is no conflict of interest: Newscorp. acquired
20th Century Fox in 1985 and the conglomerate Time Warner was created in 1989.
    We merge the reviews in the two data sets in two steps. First, we match the movies by
title, year and studio with an approximate string matching procedure, checking manually the
imperfect matches. Then, we match reviews of a given movie by media and name of the
reviewer.1 We then exclude movies with fewer than 5 reviews and media with fewer than 400
reviews, for a final sample of 540,799 movie reviews.
   To make the two data sets compatible, we then apply the Metacritic conversion into a 0-100
scale also to the Rotten Tomatoes reviews which report an underlying quantitative score. To
do so, we use the reviews present in both data sets and assign to each Rotten Tomatoes score
the corresponding median 0-100 score in the Metacritic data, provided that there are at least
10 reviews present in both samples with that score. For a small number of other scores which
are common in Rotten Tomatoes but not in Metacritic we assign the score ourselves following
the procedure of the Metacritic scoring rules (e.g., a score of 25 to a movie rated ‘2/8’).
   Media Outlets. The data set includes eight media outlets within the News Corp. con-
glomerate: the American newspapers Chicago Sun-Times (owned by News Corp. only up until
1986), New York Post (owned until 1988 and after 1992), and Wall Street Journal (owned
from 2008), the British newspapers News of the World, Times and Sunday Times (all owned
throughout the period), the magazine TV Guide (owned from 1988 until 1999) and the website
Beliefnet (owned from 2007 to 2010). The number of reviews and the data source differ across
these outlets. The British newspapers are represented only in Rotten Tomatoes and have less
than 1,000 reviews each. The New York Post is represented in both data sets and has the most
reviews (5,657). TV Guide and Wall Street Journal have a relatively high number of reviews,
but only a minority while owned by News Corp. All but one of these eight media (the Wall
Street Journal) have quantitative scores in the reviews. These media employ as reviewers a
small number of journalists who stay on for several years, and often for the whole time period.
Therefore, within each media the two most common reviewers (three for the New York Post)
cover the large majority of the reviews, with two media using essentially only one reviewer:
Chicago Sun-Times (Roger Ebert) and the Wall Street Journal (Joe Morgenstern).
   The second media conglomerate, Time Warner, includes four media: the weekly magazines
Time and Entertainment Weekly (both owned by Time Warner from 1990 on), CNN (owned
  1
      We allow for the year of the movies in the two data sets to differ by one year.

                                                        6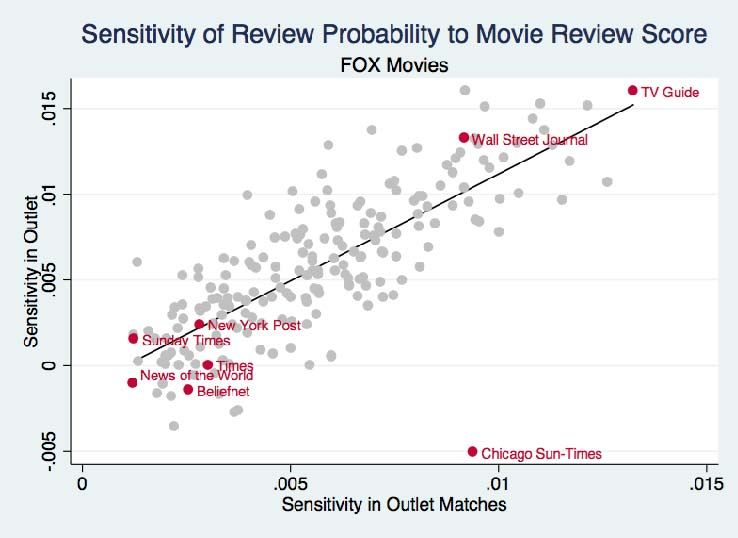
from 1996) and the web service Cinematical (owned between 2007 and 2010). The reviews in
these media are at conflict of interest with Warner Bros. movies, since the studio was acquired
in 1989 by Time, Inc. Two of the four outlets — CNN and Time — use only qualitative reviews;
since the reviews from CNN are only in the Rotten Tomatoes data set, there is almost no
0-100 score for these reviews, but only a freshness rating. Most of the observations are from
Entertainment Weekly, with more than 4,000 reviews. These outlets, like the News Corp.
outlets, employ only one or two major reviewers.
    Studios. Dozens of different studios distribute the 11,832 movies reviewed in our data
set, including the 6 majors 20th Century Fox, Columbia, Disney, Paramount, Universal, and
Warner Bros. Among the distributors owned by News Corp., 20th Century Fox movies are the
largest group (426 movies), followed by Fox Searchlight which distributes movies in the ‘indie’
category. Among the studios owned by Time Warner, the largest distributor is Warner Bros.,
followed by a number of distributors of ‘indie’ movies: Fine Line, New Line, Picturehouse, and
Warner Independent. In most of the following analysis, we group all the studios into those
owned by News Corp., which we call for brevity 20th Century Fox, and those owned by Times
Warner, which we call Warner Bros.
   Additional Movie Information. We also merge this data set to additional information
on movies from the-numbers.com, including the genre and the MPAA rating.

2.2   Matching Procedure
User Ratings. We employ user-generated movie ratings from Netflix, Flixster, and MovieLens
to find the most similar movies to a 20th Century Fox or Warner Bros. movie.
    Netflix is an online movie streaming service. Users rate movies on a scale from 1 to 5 with
1-point increments, typically right after watching a movie. Netflix made public a large data set
of (anonymized) reviews as part of its Netflix prize competition. This dataset contains roughly
100 million ratings from 480,000 users of 17,700 movies released up to 2005.
    Flixster is a social network for users interested in the film industry. Besides other services,
Flixster offers movie recommendations based on user ratings. We use a subset of this data
which is available at http://www.cs.ubc.ca/˜jamalim/datasets/. The rating scale ranges from
.5 to 5 in .5 steps. The dataset contains about 8 million ratings from almost 150,000 users
regarding 48,000 movies released up to 2010.
    MovieLens is an online movie recommendation service launched by GroupLens Research at
the University of Minnesota. The service provides users with recommendations once a sufficient
number of ratings has been entered (using the same .5 to 5 scale as in Flixster). The dataset,
which can be downloaded at http://www.grouplens.org/datasets/movielens/, was designed for
research purposes. It provides 7 million ratings from roughly 70,000 users about more than
5,000 movies released up to 2004.

                                                7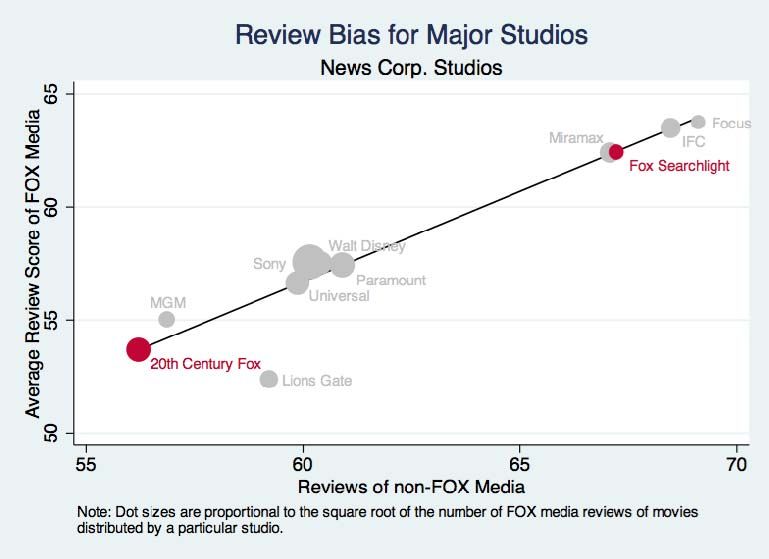
Online Appendix Table 1 summarizes the key features of the three samples. Netflix has
the most comprehensive data set of reviews but, like MovieLens, it does not cover more recent
movies. Flixster covers the most recent years but it is a smaller data set and has a small
number of ratings per user. We use all three data sets, and perform the matches separately
before aggregating the results.2
To determine the movie matches for a particular 20th Century Fox or Time Warner movie
based on the user-generated reviews, we use the following procedure. Given movie by 20th
Century Fox, we narrow down the set of potential matching movies according to four criteria:
(i) the distributing studio of a movie ∈ is not part of the same conglomerate as in order
to provide a conflict-of-interest-free comparison; (ii) at least 40 users reviewed both movie
and movie so as to guarantee enough precision in the similarity measure; (iii) movie is
represented in either the Metacritic or Rotten Tomatoes data set; (iv) movies and are close
on two variables: the difference in release years does not exceed 3 years, and the absolute
log-difference of the number of individual user ratings is not larger than .5.
Among the remaining potential matches ∈ for movie , we compute the mean absolute
P
difference in individual ratings between movie and a movie as = 1 | − |, where
we aggregate over all users who reviewed both movies (hence the requirement ≥ 40). We
then keep the 10 movies with the lowest distance measure .
To determine the overall best ten matches for movie , we pool the matching movies across
the three data sets. If movie is present in only one data set, say because it was released after
2006 and thus is only in Flixster, we take the ten matches from that data set. If movie is
present in multiple data sets, we take the top match in each data set, then move to the second
best match in each data set, and so on until reaching ten unique matches.3 We denote as a
movie group the set of 11 movies consisting of movie and its ten closest matches. Later, we
examine the robustness of the results to alternative matching procedures.
Main Sample. We illustrate the sample construction with an example in Table 1. For
the 20th Century Fox movie Black Knight, the movie group includes movies of similar genre
like Down To Earth and Snow Dogs. We combine the movie-group information with the
review information from MetaCritic and Rotten Tomatoes. We thus form movie-media groups
consisting of reviews in a given media outlet of any of the 11 movies in the movie group. The
first movie-media group in Table 1 consists of reviews by the New York Post of Black Knight
and its 10 matches. The difference within this group between the review of Black Knight and
the review of the matching movies contributes to identify the effect of conflict of interest. The
2
Within each of the three data sets, we match the movies to the movies in the Metacritic/Rotten Tomatoes
data set using a parallel procedure to the one used when merging the Metacritic and Rotten Tomatoes data.
This allows us also to import the information on the year of release of the movie, used below.
3
We take matches from Netflix first, then MovieLens, then Flixster. Notice that to identify the top 10
matches overall, one may need to go down to, say, the top 5 matches or lower even with three data sets, given
that the different data sets may yield the same matching movie .
8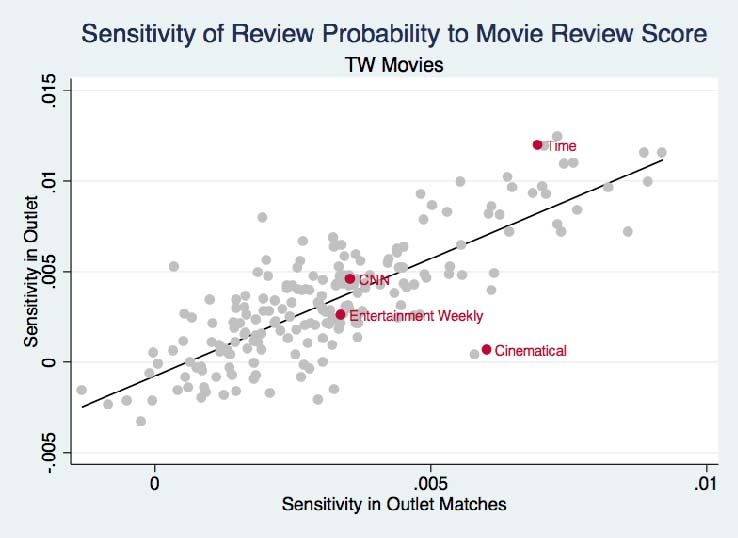
next movie-media group consists of reviews by Entertainment Weekly magazine of the same 11
movies. These reviews by a ‘control’ media outlet contribute to identify the average differential
quality of a 20th Century Fox movie. In the specifications we include movie-media group fixed
effects, thus making comparisons within a movie group for a particular media outlet.
    Note two features of the procedure. First, each media typically reviews only a subsample
of the 11 movies and thus a movie-media group can consist of fewer than 11 observations.
Second, a movie can be a match to multiple 20th Century Fox or Warner Bros. movies and as
such will appear in the data set multiple times. In Table 1, this is the case for 102 Dalmatians
which is a match for both Black Knight and Scooby-Doo. In the empirical specifications, we
address this repetition by clustering the standard errors at the movie level.
    The initial sample for the test of conflict of interest in the News Corp. conglomerate includes
all movie-media groups covering movies distributed by Fox studios and all media outlets in the
sample. We then drop matching movies which were not reviewed by at least one News Corp.
media outlet. A movie group has to fulfill two conditions to remain in the final sample: (i)
there has to be at least one review with conflict of interest (i.e. one review of the 20th Century
Fox movie by an outlet owned by News Corp.) and (ii) the movie group has to contain at least
one movie match (which was reviewed by a News Corp. outlet).
    Appendix Table 1, Panel A reports summary statistics on the sample for the News Corp.
conglomerate (top panel) and for the Time Warner conglomerate (bottom panel). The data
set covers reviews from 335 different media outlets. Appendix Table 1, Panel B presents
information on the studios belonging to News Corp. and to Time Warner.

3     Bias in Movie Reviews
3.1   Movie Matches
In the analysis of potential bias due to conflict of interest, we compare the reviews of movies
by 20th Century Fox (and by Warner Bros.) to the reviews of the ten most comparable
movies produced by other studios, according to the matching procedure discussed above. This
procedure is designed to address the concern that movies produced by, say, 20th Century Fox
may have special features that not all movies have.
    Does the matching procedure work? Figures 1a-f document the similarity between the
movies distributed by 20th Century Fox and Warner Bros. and the ten matching movies by
other studios with respect to three characteristics: movie genre, MPAA rating, and number
of theaters at opening. Since the match procedure did not use any of these features, we can
interpret the similarity, or lack thereof, as a validation of the approach. Furthermore, we
choose features that are pre-assigned and thus cannot be affected by the reviews themselves.
    Figure 1a shows that Fox movies are most likely to be action, comedy, and drama, and

                                                9
unlikely to be documentaries. The matching movies display a similar pattern, while the movies
that are never a match to a 20th Century Fox movie are more likely to be documentaries.
Figure 1b displays parallel findings for the Warner Bros. movies. Turning to the MPAA rating
(Figures 1c-d), the 20th Century Fox and Warner Bros. movies and their respective matches
are very similar, while the non-matching movies are more likely to be rated R and less likely
to be rated PG-13. Figures 1e-f display a third feature, the number of theaters on the opening
weekend, sorted in quintiles in 5-year bins. The 20th Century Fox and Warner Bros. movies
are close to their matches, while the non-matching movies follow an opposite pattern.
In the online appendix we provide further evidence on the quality of the match. We
document that the same match pattern holds for a micro level comparison, namely matching
movies are disproportionately likely to share the genre, rating, and theaters at opening of the
movie they are matched to, compared to the general population of movies (Online Appendix
Figure 1a-f). We also document that matching movies resemble the movies at conflict of
interest with respect to two key outcomes of interest, the average 0-100 review score (Online
Appendix Figure 2a-d) and the probability of review (Online Appendix Figures 3a-d). Hence,
the matching procedure appears to be successful in identifying broadly comparable movies.
Building on this evidence, we now turn to the comparison outlined above.
3.2 Overall Bias
Graphical Evidence. We examine whether the conflict of interest induces a bias on average,
starting with the 20th Century Fox movies. The bars on the right of Figure 2a indicate the
average review score for media not owned by News Corp. (the ‘placebo’ group). In this group,
the average review score for the 20th Century Fox movies (dark blue bar) and for the matching
movies distributed by other studios (light blue bar) is indistinguishable. The matching movies
appear to provide a good counterfactual: in the absence of conflict of interest, their average
score is essentially identical to the one of the Fox movies.
The left bars in Figure 2a present the average score for reviews in News Corp. media
outlets, like the Wall Street Journal. The score for the matching movies (light blue bar) is
somewhat lower than in the non-News Corp. media, indicating that the Fox media outlets
are on average somewhat harsher in their reviews. The key question is whether this pattern
is the same for the movies produced by 20th Century Fox, or whether those movies receive a
more generous treatment. The leftmost bar provides no evidence of bias: the average score
for the 20th Century Fox movies is essentially identical to the one for the matching movies by
other studios, with tight confidence intervals. A difference-in-difference estimator indicates a
difference of -0.12 points (out of 100, with p-value of .908 of the test of equality to zero).
Figure 2b presents the evidence for Time Warner. Once again, the reviews in non-Time
Warner media outlets are scored about in the same way for Warner Bros. movies and for
10matching movies (right panel). Turning to the reviews in the Time Warner outlets (left panel),
the score is also essentially the same for the Warner Bros. movies and for the matching movies.
In this second conglomerate we also find no evidence of bias due to conflict of interest.
Regressions. To present a formal test and to examine the impact of control variables, we
estimate a regression-based specification. For the 20th Century Fox movies we estimate the
difference-in-difference OLS regression:
= + + + + () + (1)
Each observation is a review for movie by outlet . The dependent variable is a 0 to
100 score, or an indicator for ‘freshness’. The coefficient captures the average difference
in reviews for movies distributed by 20th Century Fox, compared to the matching movies
distributed by other studios. The coefficient captures the average difference in reviews for
outlets owned by News Corp. at the time of the movie release, compared to the other outlets.
The key coefficient, , indicates the estimated impact of the conflict of interest, that is, the
average rating difference for a 20th Century Fox movie when reviewed by a media owned by
a News Corp. outlet, compared to the counterfactual. We include a fixed effect for each
movie-media group, where we denote with () the 11 movies in the group for movie
The standard errors are clustered at the movie level to allow for correlation of errors across
multiple reviews of a movie.4 We run a parallel specification for the Time Warner group.
Panel A of Table 2 reports the results for the score variable. Considering first the 20th
Century Fox movies (Columns 1-2), we present the results first with no controls and then with
fixed effects for each movie-media group (see Table 1). In this second specification, regression
(1) is a matching estimator, comparing reviews for a 20th Century Fox movie to reviews for
the 10 matched movies. The result is similar in the two specifications, so we mostly discuss the
estimates with fixed effects (Column 2). The estimated coefficient on Fox movies in Column 2,
̂ = −075, is close to zero indicating, consistent with Figure 2a, that the Fox movies and
the matched movies are comparable in quality. The estimated coefficient on the News Corp.
outlets in Column 1, ̂ = −434 is negative, again consistent with Figure 2a.5 The key
coefficient, ̂ = −019 indicates a null effect of the conflict of interest for News Corp. outlets:
20th Century Fox movies receive slightly less positive reviews by News Corp. outlets by 0.2
points out of 100. The small standard errors imply that we can reject at the 95% confidence
level an effect of bias of 1.92 points out of 100, equivalent to an increase of one star (on a
zero-to-four scale) for one out of 13 movies reviewed.
In Columns 3 and 4 we estimate the impact of conflict of interest on the Warner Bros.
movies. The results are parallel to the ones for the News Corp. conglomerate: we find no
evidence of an impact of conflict of interest: ̂ = −002. Given the larger sample of Warner
4
In Table 3 we show that alternative forms of clustering lead to comparable or lower standard errors.
5
In Column 2 this coefficient is identified off of media outlets that change ownership within our sample.
11Bros. movies, we can reject even smaller effects, corresponding to 1.72 points out of 100,
equivalent to an increase of one star (out of 4) for one out of 14.5 reviews.
In Panel B of Table 2 we present parallel specifications with the ‘freshness’ indicator as
dependent variable. The results for the ‘freshness’ variable are parallel to the results for the
score variable: we find no evidence of bias for either of the two conglomerates. For the rest
of the paper we focus on the 0-100 score variable given the higher statistical power given by a
continuous variable, the results are parallel with the freshness indicator.
Robustness. In Table 3 we present alternative specifications of the benchmark results
(Columns 2 and 4 of Table 2), reporting only the conflict-of-interest coefficient. We examine
alternatives for: (i) standard errors, (ii) additional controls, (iii) the underlying data source,
(iv) the matching procedure. Clustering the standard errors by studio and by media outlet lead
to lower standard errors (Columns 2 and 3, compared to the benchmark clustering reproduced
in Column 1). Adding movie fixed effects has a small impact on the estimates (Column 4).
Estimating the effect separately for the Metacritic database (Column 5) and in the Rotten
Tomatoes database (Column 6) yields similar results. (Movie reviews which are in both data
sets are present in both samples).
We also investigate the robustness of the matching procedure. Restricting the match to
only the best 3 movie matches (rather than 10) does not change the estimate appreciably
but, predictably, lowers the precision somewhat (Column 7). Changing the closeness measure
to maximizing the correlation in reviews yields similar results (Column 8). Not using any
observable variable (year of release and number of reviews) in the match procedure also has
little impact (Column 9). In Online Appendix Table 2 we show that the results are robust to
computing matches using only one of the user reviews data sets, and using as a criterion for
closeness the ratio of the number of users rating a movie.
Cross-Sectional Estimates. In Table 4 we compare the matching estimates to cross-
sectional estimates for specification (1) using all reviews in the MetaCritic and Rotten Toma-
toes data, making no use of the matching procedure. The estimates of the effect of conflict of
interest for Time Warner are close to zero and insignificant as in the main specification (Table
2). Instead, the estimate of the conflict of interest effect for the News Corp. outlets indicate
a statistically significant, if quite small, 2.04 points of bias in the specification with movie and
media fixed effects (Column 2).6 The next columns reconcile this estimate with the matching
estimate. The difference is not due to excluding movies that are not reviewed by outlets at
conflict of interest (Column 3) or to the fact that some of the 20th Century Fox and Warner
Bros. movies are not present in the Flixster/Netflix/MovieLens data set (Column 4), and thus
dropped from our matching analysis. Instead, the main difference is the inclusion of control
movies that are not matches to a Fox or Warner Bros. movie. When we drop these movies
6
A previous working paper version of this paper estimated a bias of similar magnitudes using this specification.
12(Column 5), the estimate is very similar to the benchmark estimate.7 Given the evidence that
non-matching movies differ from matching movies in several dimensions like genre, rating,
and opening weekend (Figures 1a-f), this suggests that reviewers in the News Corp. outlets
have genre-specific tastes that it is important to control for in the analysis. We thus use the
matching estimator in the rest of the paper.
3.3 Bias by Movie Quality and Type
So far, we presented evidence on bias for the average movie. Yet, as a simple model in the
Online Appendix illustrates, bias should be larger for movies with a higher return to bias,
holding constant the reputational cost. While we do not have direct measures of the return to
bias, we consider two dimension which are likely to correlate with it. We expect that movies
with generally higher review scores are likely to have higher return to bias, as an extra star is
likely to matter more if it is the 4th star out of 4, as compared to the first star. We also assume
that high-profile movies are likely to have higher returns given the larger potential audience
(holding constant the persuasive impact of a review).
Bias by Movie Quality. In Figures 3a we present evidence on potential bias as function
of movie quality for the 20th Century Fox movies. We assign to each movie the average review
score computed excluding the reviews in media at potential conflict of interest. We then
display a polynomial plot of the review score in the News Corp.-owned media outlets for the
movies produced by 20th Century Fox (dark blue line) and for the matching movies produced
by other studios (light blue line).8 The plot for the matching movies indicates that the News
Corp. outlets largely follow the other outlets in their review. The plot for the movies at conflict
of interest hovers around the one for the matching movies, with no evidence of deviation for
movies of higher, or lower, quality. For Time Warner as well (Figure 3b), the average score for
affiliated movies tracks very closely the score for the non-affiliated movies, with no systematic
deviation for higher-quality movies. Thus we do not find evidence of differential bias.
Bias by Movie Profile. In addition to the mainstream studios 20th Century Fox and
Warner Bros., the News Corp. and Time Warner conglomerates include indie studios like Fox
Searchlight, Fine Line, and New Line (see Appendix Table 1B). Figures 4a and 4b plot, for
each studio, the average review score in media outlets at conflict of interest (y axis) and in
other outlets (x axis). To make the comparison clear, we plot the same measure for the other
7
Notice that this last specification still differs from the matching one because (i) the set of fixed effect differs
and (ii) in the benchmark specification reviews for a matching movie appear multiple times if the movie is a
match to multiple, say, 20th Century Fox movies; instead, in the cross-sectional specification each movie review
appears only once. Column (5) shows that this difference is immaterial to the results. Furthermore, the estimate
in Column (5) is similar to the estimate in Column (4) in Table 3 where movie fixed effects are included as
additional controls.
8
We use an Epanechnikov kernel and a 1st degree polynomial, with a kernel of 2 rating points. We truncate
movies with average movie score below 30 or above 80, since such movies are rare.
139 major studios.9 There is no evidence of differential bias, which consists of points lying above
the 45 degree line, for the mainstream studio compared to the indie studios.
In Online Appendix Table 3 we presents additional evidence. We re-estimate specification
(1) allowing for a differential effect of conflict of interest for four proxies of return to bias: (i)
distribution by a mainstream studio, (ii) production budget, (iii) number of theaters at opening
and (iv) domestic box office.10 We find no statistically significant evidence of differential bias
by the four proxies, even though directionally the sign of the effects is as expected for the 20th
Century Fox movies. Overall, there is no clear evidence of differential bias for movies with
plausibly higher return to bias.
3.4 Bias by Media and Journalist
The previous evidence indicates the apparent lack of bias due to conflict of interest, even when
considering separately movies with plausibly higher incentives for bias. These results reject
the scenario of widespread bias across all outlets within a conglomerate. Still, it is possible
that some media outlets, or some journalists, bias their reviews, but this is balanced by the
lack of bias in other outlets in the same conglomerate, or perhaps even by negative bias (to
avoid criticism). We thus examine the occurrence of bias by media and by journalist.
Bias By Media. The scatter plot in Figure 5a reports for each media outlet the average
review for the 20th Century Fox movies and the average review for the matching movies by
other studios. To provide a counterfactual, we also plot these measures for the 200 largest
media outlets not owned by News Corp.11 No News Corp. media outlet deviates substantially
on the positive side of the trend line, the indication for bias.12 In a regression framework
parallel to specification (1), except from running one outlet at a time, we find no significant
evidence of bias for any of the outlets (Online Appendix Table 4).
Figure 5b provides parallel evidence for the Time Warner conglomerate, with Entertainment
Weekly, Time magazine and Cinematical right on the regression line indicating no bias, a
finding that is replicated regression format in Online Appendix Table 4. Thus, the pattern for
the individual outlets is similar to the overall pattern of no bias.
Bias By Journalist. We further take advantage of the fact that most media have only
a small number of movie reviewers, and these journalists typically stay on for years, if not
decades. This long tenure allows us to estimate journalist-specific patterns which, as far as
9
Dot Sizes are proportional to the square root of the number of reviews by News Corp. or Time Warner
outlets. We do not use the matching procedure in order to ensure a larger sample of movies by other studios.
10
For the last three proxies, we use deciles, formed within 5-year periods, of the variable to adjust for changes
over time and skewness.
11
We only include outlets with at least 15 reviews of 20th Century Fox movies while owned by News Corp.
12
The Sunday Times and Wall Street Journal are outliers below the line, but the estimate of bias is imprecise
for these outlets given the small number of reviews at conflict of interest.
14we know, is a rare feature within the media economics literature (Dougal et al., 2012). In
Appendix Figures 1a-b we provide parallel plots to Figures 5a-b, but by journalist. In addition
to the journalists working in the two conglomerates, we include the 500 other journalists with
the most reviews. Only one journalist stands out, Maitland McDonagh (at TV Guide), with a
statistically significant estimate of bias (Online Appendix Table 5). Yet, given that the pattern
appears for only one out of 12 journalists, it is plausible that this pattern is due to chance.
3.5 Editorial Bias
In the previous section we tested for bias in the presence of conflict of interest, focusing on the
role of journalists. Conversely, we now examine the role of editors. An editor who intends to
bias the review process can do so in at least two ways, by putting pressure on the journalists, or
by assigning the affiliated movies to journalists who on average assign higher review scores.13
While the former editorial choice is indistinguishable from independent journalistic bias, the
latter evidence would point to editorial influence.
We provide graphical evidence on this test for the reviewers in News Corp. media outlets
in Figure 6a. We plot for each reviewer the average generosity in review score (relative to the
media outlet average) (x axis) and the share of their reviews which are about 20th Century
Fox movies (y axis).14 As the scatter shows, movie reviewers differ sizably in generosity within
a given outlet. Yet, there is no evidence that the more generous reviewers are more likely
to review 20th Century Fox movies. Indeed, the regression line points to a slight negative
relationship between generosity and review probability.
In Figure 6b we report the parallel evidence for the Time Warner outlets. As for the News
Corp. outlets, we find no evidence of a systematic pattern of assignment of movies to reviewers
in order to benefit the affiliated studio.
3.6 Bias by Omission
The previous evidence rules out sizable bias in the movie quality assessed in reviews, whether
due to editorial or journalistic decisions. But this evidence does not cast light on a potentially
more insidious form of bias: bias by omission. The media can selectively display items of
information, as in Anderson and McLaren (2012). In our setting, an outlet may decide to not
review a below-average movie by an affiliated studio, but make sure to review an above-average
13
A third form of editorial influence is the hiring of more favorable journalists and firing of less favorable ones.
We observe no evidence of elevated turn-over for the outlets after a change in ownership.
14
To compute the average generosity, we only take into account score reviews (on a 0-100 scale) and generate for
each review an idiosyncratic review score defined as the score minus the average review score of the corresponding
movie. We then compute the average of this variable for all journalists and their affiliated outlets. The measure
of the average generosity of a journalist (relative to the affiliated outlet) is calculated as the difference between
the two means. Here, we do not use the matching procedure in order to preserve a larger sample of movies.
15movie by the same studio. A media outlet following this strategy would not display any bias
conditional on review; hence, bias by omission would not be detected by the previous analysis.
In Figure 7a we present evidence on omission bias for the News Corp. media. We test
whether News Corp. outlets are more likely to review 20th Century Fox movies with high
predicted review (as proxied by high average rating by other reviewers), compared to their
reviewing patterns for non-20th Century Fox movies. We display a polynomial smoother of
the review probability as a function of the average review score of a movie (in the range between
30 and 80).15 The average probability of review by News Corp. media outlets of 20th Century
Fox movies is barely increasing in the review score (darker continuous line). By comparison,
the probability of review of the matching movies by other studios (lighter continuous line) is
more clearly increasing in the movie review, suggesting if anything a negative bias by omission.
To strengthen the inference, we also compare these patterns to the probability of review
by other media outlets not owned by News Corp. In doing so, we need to take into account
that media outlets differ in their reviewing propensity. Thus, for each media outlet owned by
News Corp. we choose the ten media outlets which display the closest pattern in the review
probability of non-20th Century Fox movies.16 The dotted lines in Figure 7a display the
probability of review by these matched media of 20th Century Fox movies (dotted darker line)
and of the matching movies (dotted lighter line). The dotted lines track remarkably well the
continuous lines for the matching movies, suggesting that the matching media provide a good
counterfactual to the News Corp. media. Overall, Figure 7a suggests no evidence of omission
bias. Online Appendix Figures 4a-d show that the same pattern holds when considering the
News Corp. media outlets individually.
The corresponding figure for the Time Warner outlets (Figure 7b) instead provides some
evidence consistent with omission bias. The probability of review of Warner Bros. movies
in Time Warner outlets is increasing in the measured quality of the movie, more so than in
the matched media. Yet, this increasing pattern is similar for matching movies in the Time
Warner media (lighter continuous line), suggesting that the pattern may be due to a reviewing
15
The sample for the omission bias test in this Section is determined as follows. For each of the 8 News
Corp. outlets, like the New York Post, we determine all 20th Century Fox movies and their movie matches
which were released during News Corp. ownership of the respective outlet. For each movie in this subsample
and outlet-either the News Corp. or one of the control outlets (see below)-we generate a dummy of whether it
was reviewed (0-100 score or ‘freshness’ indicator). Thus, there is only one observation per movie and media
outlet. We use this data set when testing for omision bias for that particular outlet. To obtain the sample for
the overall test pooling across all 8 outlets, we repeat this procedure for all 8 News Corp. outlets and append
the data sets. We follow a parallel procedure for the Time Warner test.
16
The matching outlets are determined as the ten outlets with the smallest distance in the probability of
review of non-20th Century Fox movies. For this purpose, we form bins with a width of 5 points of the average
review score and determine the average distance between two media outlets in the review probabilities within
each bin. The overall distance is computed averaging the distance measure across the bins, weighting by the
number of movies in a bin.
16strategy in the Time Warner media outlets, rather than to bias.
To provide more evidence, in Online Appendix Figures 5a-d we disaggregate the effect
by the four Time Warner media outlets. The evidence suggestive of omission bias is almost
entirely due to Time magazine. To ascertain whether the pattern in the data is due to intended
omission bias or an idiosyncratic reviewing strategy by Time, we exploit two placebos. First,
we take advantage of the fact that in years 1985-89 Time magazine was not yet part of the
Time Warner conglomerate. Second, we exploit the fact that 20th Century Fox movies share
some characteristics with Warner Bros. movies (see Figures 1a-f), but there is no conflict of
interest in place with those movies at Time magazine. As Online Appendix Figures 6b and 6c
show, these two placebos show a similar reviewing pattern to the one in the main sample. This
suggests that the patterns at Time magazine should not be interpreted as bias by omission.
To further put these findings in context, we compare the extent of selective reporting in
the media at conflict of interest with the same phenomena for the largest 200 other outlets.
Figures 8a-b display for each media outlet the estimated sensitivity of the review probability
to the average score for the movies at conflict of interest (y axis) versus the same movies in
the matching outlet (x axis). The two sensitivity coefficients are just the slope coefficient
of separate linear regressions of the review probability on the average review score. Bias by
omission would manifest itself as an outlier above the regression line: an outlet is more sensitive
to quality when reviewing a movie at conflict of interest. The patterns confirm the findings
above. None of the News Corp. outlets stand out for omission bias, while among the Time
Warner outlets, only Time magazine stands out, a case we discussed above.
To provide a statistical test of omission bias, we estimate a linear probability model in
Table 5, which we illustrate for the case of media owned by News Corp.:
= + + Γ ̄ + + (2)
̄ + + ̄ + ̄ + () +
An observation is a possible review of a 20th Century Fox movie or of a matching movie by
one of the News Corp. or matching outlets with similar probability of review. The dependent
variable is the indicator which equals 1 if media outlet reviews movie The key
coefficient is Γ on the interaction of the conflict of interest variable with the mean rating
score ̄ . This coefficient indicates how the probability of a review varies with the average
review score, in the presence versus absence of a conflict of interest. The regression includes
movie-media group fixed effects. A key assumption made in equation (2) is that the probability
of movie review is linearly increasing in the average movie score; we adopt this assumption
given the evidence of approximate linearity in Figures 7a-b.
Table 5 provides no evidence of selective review consistent with omission bias for the News
Corp. or for the Warner Bros. media. For News Corp. outlets, we can reject that a one-
standard deviation increase in movie quality (14 points in overall score) for a 20th Century
17Fox movie increases the probability of review (differentially) by more than 1.7 percentage
points. Similarly, for Time Warner we can reject for a similar increase in movie quality an
increase in review probability of more than 2.2 percentage points. In Online Appendix Table
6 we present the results separately for each media outlet. The relevant coefficient on the
interaction between conflict of interest and average review score is significantly positive only
for Time Magazine, a special case we discussed above. Overall, we conclude that it is unlikely
that any of the outlets is explicitly adopting a strategy of bias by omission.17
3.7 Bias in Movie Aggregator
So far we have focused on the conflict of interest induced by the consolidation of studios like
20th Century Fox and Warner Bros. into media conglomerates which employ movie reviewers.
But consolidation affects the review aggregators themselves. Rotten Tomatoes, independent
when launched in 1998, was acquired by IGN Entertainment in June 2004, and IGN itself was
purchased by News Corp. in September 2005. IGN, and hence Rotten Tomatoes, was then
sold in January of 2010 by News Corp. and acquired in April 2011 by Time Warner.
This ownership structure generates an incentive for Rotten Tomatoes to post more positive
reviews of 20th Century Fox movies during the period of News Corp. ownership (2006-2009).
Since the reviews are posted quickly on the Rotten Tomatoes site and then rarely updated18 ,
we use the year of release of the movie to test the hypothesis of conflict of interest. We estimate
= + 2006−09
+ + + + (3)
where is the ‘freshness’ indicator on Rotten Tomatoes for movie in media outlet . The
coefficient of interest, captures how movies distributed by the 20th Century Fox studio
( = 1) are characterized in years 2006-2009, compared with the years before and
after. We allow for a baseline difference in reviews for 20th Century Fox movies (captured by
) and fixed effects for year and for the movie-media group. Most importantly, we control
for the MetaCritic scoring for the same movie review19 .
Column 1 in Table 6 shows that the effect of conflict of interest is a precisely estimated zero
(̂
= 00031), a result that replicates when using all reviews, rather than just the matched
17
We also examined a form of partial omission: whether media at conflict of interest are more likely to
display delayed reviews and shorter reviews for low-quality affiliated movies. Using a smaller data set (since
the information on date of review and length of review is not in Metacritic or Rotten Tomatoes) we do not find
evidence of such bias.
18
Consistent with this, two separate scrapes of the site at 3 month distance yielded no change in the reviews
for older movies.
19
The quantitative scoring is as reported by Rotten Tomatoes, translated into the 0-100 score. If the Rotten
Tomatoes score is missing, for example for qualitative reviews, we use the score in MetaCritic if available. We
confirm that Rotten Tomatoes does not bias this quantitative score by regressing it on the corresponding score
for the same review in MetaCritic, when both are available.
18You can also read