Cisco Global Cloud Index: Forecast and Methodology, 2016-2021
←
→
Page content transcription
If your browser does not render page correctly, please read the page content below
White Paper

                             Cisco Global Cloud Index:
                             Forecast and Methodology,
                                    2016–2021

© 2018 Cisco and/or its affiliates. All rights reserved. This document is Cisco Public Information.      Page 1 of 46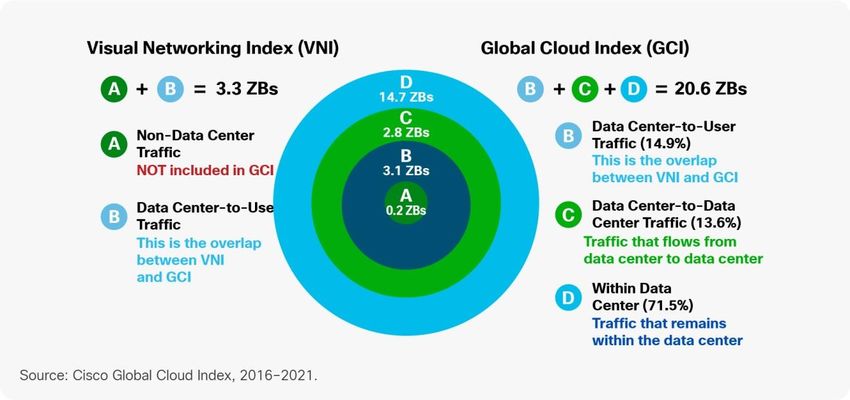
Contents
                        What you will learn .................................................................................................................................................. 3
                        Forecast overview ................................................................................................................................................... 3
                        Regional cloud readiness ....................................................................................................................................... 5
                        Top seven data center and cloud networking trends ........................................................................................... 5
                        Trend 1: Growth of global data center relevance and traffic ............................................................................... 6
                        Trend 2: Continued global data center virtualization ......................................................................................... 14
                        Trend 3: Cloud service trends .............................................................................................................................. 17
                        Trend 4: Workloads and compute instances by application .............................................................................. 19
                        Trend 5: Data center and cloud storage: capacity and utilization ..................................................................... 21
                        Trend 6: Global digitization: Effects of IoT and the advent of the yottabyte era .............................................. 23
                        Trend 7: Global cloud readiness .......................................................................................................................... 24
                        Conclusion ............................................................................................................................................................. 38
                        For more information............................................................................................................................................. 38

© 2018 Cisco and/or its affiliates. All rights reserved. This document is Cisco Public Information.                                                                                    Page 2 of 46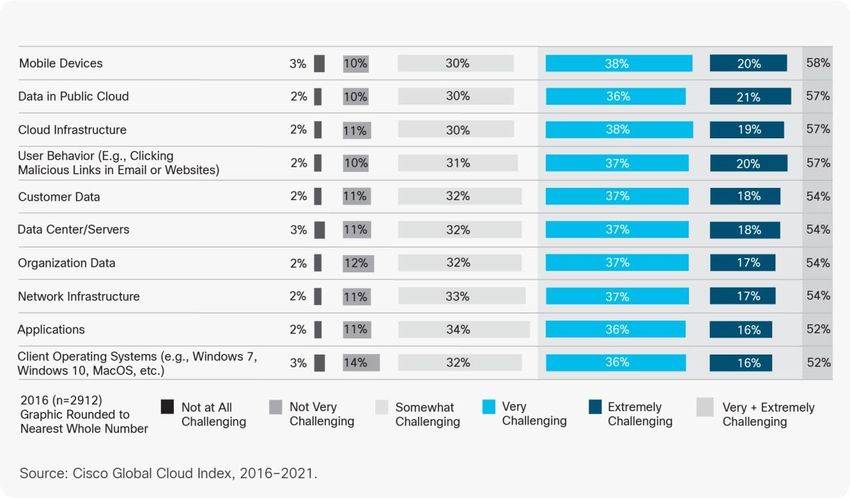
What you will learn
                                     ®
                        The Cisco Global Cloud Index (GCI) is an ongoing effort to forecast the growth of global data center and cloud-
                        based IP traffic. The forecast includes trends associated with data center virtualization and cloud computing. This
                        document presents the details of the study and the methodology behind it.

                        Forecast overview
                        Hyperscale data centers
                              ●   Hyperscale data centers will grow from 338 in number at the end of 2016 to 628 by 2021. They will
                                  represent 53 percent of all installed data center servers by 2021.
                              ●   Traffic within hyperscale data centers will quadruple by 2021. Hyperscale data centers already account for
                                  39 percent of total traffic within all data centers and will account for 55 percent by 2021.

                        Global data center traffic
                              ●   Annual global data center IP traffic will reach 20.6 Zettabytes (ZB) (1.7 ZB per month) by the end of 2021,
                                  up from 6.8 ZB per year (568 exabytes [EB] per month) in 2016.
                              ●   Global data center IP traffic will grow 3-fold over the next 5 years. Overall, data center IP traffic will grow at
                                  a Compound Annual Growth Rate (CAGR) of 25 percent from 2016 to 2021.

                        Data center virtualization and cloud computing growth
                              ●   By 2021, 94 percent of workloads and compute instances will be processed by cloud data centers; 6
                                  percent will be processed by traditional data centers.
                              ●   Overall data center workloads and compute instances will more than double (2.3-fold) from 2016 to 2021;
                                  however, for cloud those will nearly triple (2.7-fold) over the same period.
                              ●   The workload and compute instance density (that is, workloads and compute instances per physical server)
                                  for cloud data centers was 8.8 in 2016 and will grow to 13.2 by 2021. Comparatively, for traditional data
                                  centers, workload and compute instance density was 2.4 in 2016 and will grow to 3.8 by 2021.

                        Public vs. private cloud
                              ●   By 2021, 73 percent of the cloud workloads and compute instances will be in public cloud data centers, up
                                  from 58 percent in 2016 (CAGR of 27.5 percent from 2016 to 2021).
                              ●   By 2021, 27 percent of the cloud workloads and compute instances will be in private cloud data centers,
                                  down from 42 percent in 2016 (CAGR of 11 percent from 2016 to 2021).

                        Global cloud traffic
                              ●   Annual global cloud IP traffic will reach 19.5 ZB (1.6 ZB per month) by the end of 2021, up from 6.0 ZB per
                                  year (499 EB per month) in 2016.
                              ●   Global cloud IP traffic will more than triple (3.3-fold) over the next 5 years. Overall, cloud IP traffic will grow
                                  at a CAGR of 27 percent from 2016 to 2021.
                              ●   Global cloud IP traffic will account for 95 percent of total data center traffic by 2021.

© 2018 Cisco and/or its affiliates. All rights reserved. This document is Cisco Public Information.                                           Page 3 of 46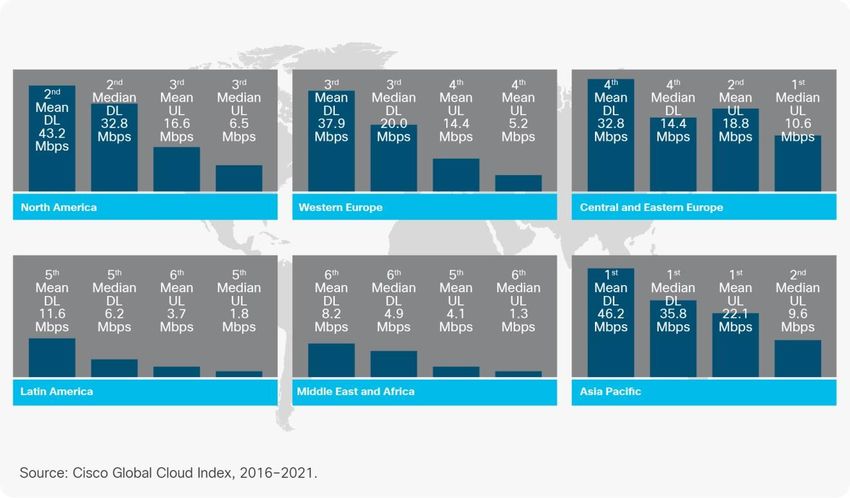
Cloud service delivery models
                              ●   By 2021, 75 percent of the total cloud workloads and compute instances will be Software-as-a- Service
                                  (SaaS), up from 71 percent in 2016.
                              ●   By 2021, 16 percent of the total cloud workloads and compute instances will be Infrastructure-as-a- Service
                                  (IaaS), down from 21 percent in 2016.
                              ●   By 2021, 9 percent of the total cloud workloads and compute instances will be Platform-as-a- Service
                                  (PaaS), up from 8 percent in 2016.

                        Workloads and compute instances by application
                              ●   By 2021, enterprise workloads and compute instances will account for 73 percent of total data center
                                  workloads and compute instances, down from 76 percent in 2016.
                              ●   By 2021, consumer workloads and compute instances will account for 27 percent of total data center
                                  workloads and compute instances, up from 24 percent in 2016.
                              ●   Within the enterprise segment, compute (24 percent of enterprise workloads and compute instances by
                                  2021) and collaboration (23 percent of enterprise workloads and compute instances by 2021) are the two
                                  main contributors.
                              ●   Within the consumer segment, video streaming (34 percent of consumer workloads and compute instances
                                  by 2021) and social networking (25 percent of consumer workloads and compute instances by 2021) are
                                  the two main contributors.
                              ●   Within the enterprise segment, database/analytics and IoT will be the fastest growing applications, with 21
                                  percent CAGR from 2016 to 2021, or 2.6-fold growth.
                              ●   Within the consumer segment, social networking (26% CAGR from 2016 to 2021) and video streaming (24
                                  percent CAGR from 2016 to 2021) will be the fastest growing applications.

                        Data center storage
                              ●   By 2021, data center storage installed capacity will grow to 2.6 ZB, up from 663 EB in 2016, nearly a 4-fold
                                  growth.

                        Data in data centers, big data, and IoT
                              ●   Globally, the data stored in data centers will nearly quintuple by 2021 to reach 1.3 ZB by 2021, up 4.6-fold
                                  (a CAGR of 36%) from 286 EB in 2016.
                              ●   Big data will reach 403 EB by 2021, up almost 8-fold from 25 EB in 2016. Big data alone will represent 30
                                  percent of data stored in data centers by 2021, up from 18 percent in 2016.
                              ●   The amount of data stored on devices will be 4.5 times higher than data stored in data centers, at 5.9 ZB by
                                  2021.
                              ●   Driven by the Internet of Things, the total amount of data created (and not necessarily stored) by any device
                                  will reach 847 ZB per year by 2021, up from 218 ZB per year in 2016. Data created is two orders of
                                  magnitude higher than data stored.

© 2018 Cisco and/or its affiliates. All rights reserved. This document is Cisco Public Information.                                     Page 4 of 46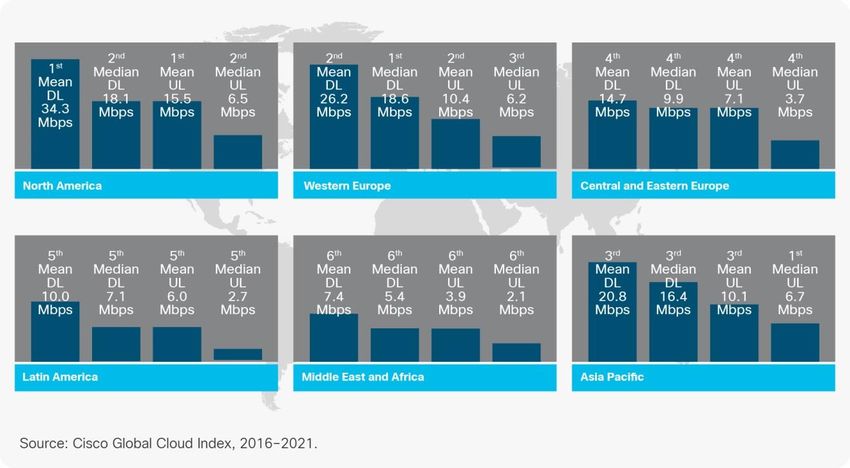
Regional cloud readiness
                        Network speeds and latency
                              ●   Asia Pacific leads all regions with an average fixed download speed of 46.2 Mbps. North America follows
                                  with an average fixed download speed of 43.2 Mbps. Asia Pacific and Central and Eastern Europe lead all
                                  regions in average fixed upload speeds with 22.1 Mbps and 18.8 Mbps, respectively.
                              ●   Asia Pacific leads all regions in average fixed network latency with 21 ms, followed by Western Europe with
                                  27 ms.
                              ●   North America leads all regions with an average mobile download speed of 34.3 Mbps. Western Europe
                                  follows with an average mobile download speed of 26.2 Mbps. North America and Western Europe also
                                  lead all regions in average mobile upload speeds with 15.5 Mbps and 10.4 Mbps, respectively.
                              ●   Western Europe and Central and Eastern Europe lead all regions in average mobile network latency with 46
                                  ms and 49 ms, respectively.

                        Top seven data center and cloud networking trends
                        Over the last few years, the telecommunications industry has seen cloud adoption evolve from an emerging
                        technology to an established networking solution that is gaining widespread acceptance and deployment.
                        Enterprise and government organizations are moving from test environments to placing more of their mission-
                        critical workloads and compute instances into the cloud. For consumers, cloud services offer ubiquitous access to
                        content and services, on multiple devices, delivered to almost anywhere network users are located.

                        The following sections identify seven important trends in data center and cloud networking that are accelerating
                        traffic growth, changing the end-user experience, and placing new requirements and demands on data center and
                        cloud-based infrastructures.

                        1.    Growth of global data center relevance and traffic
                              ●   Growth of hyperscale data centers
                              ●   Global data center ip traffic: three-fold increase by 2021
                              ●   Data center traffic destinations: Most traffic remains within the data center
                              ●   Global data center and cloud ip traffic growth
                              ●   SDN/NFV architecture effects: Wild car
                        2.    Continued global data center virtualization
                              ●   Public vs. Private cloud
                        3.    Cloud service trends
                        4.    Workloads and compute instances by application
                        5.    Data center and cloud storage: Capacity and utilization
                        6.    Global digitization: Impact of IoT
                              ●   Potential effect of IoT on global data centers
                        7.    Global cloud readiness
                              ●   Security: Imperative for cloud growth
                              ●   Network speeds and latency analysis

© 2018 Cisco and/or its affiliates. All rights reserved. This document is Cisco Public Information.                                   Page 5 of 46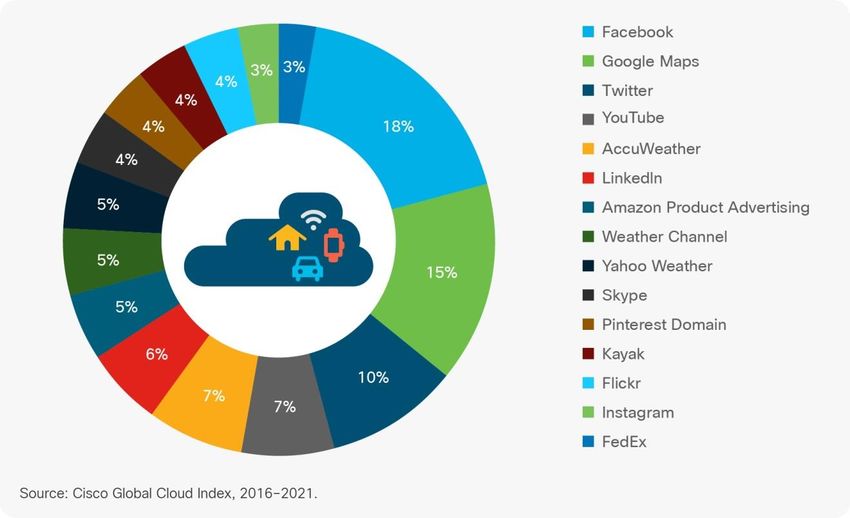
Trend 1: Growth of global data center relevance and traffic
                        From server closets to large hyperscale deployments, data centers are at the crux of delivering IT services and
                        providing storage, communications, and networking to the growing number of networked devices, users, and
                        business processes in general. The growing importance of data analytics—the result of big data coming from
                        ubiquitously networked end-user devices and IoT alike—has added to the value and growth of data centers. They
                        touch nearly every aspect of an enterprise, whether internal/employee-related data, communication or processes,
                        or partner-and customer-facing information and services. The efficient and effective use of data center technology
                        such as virtualization, new software-based architectures, and management tools and use of public vs. private
                        resources and so on can all add to the agility, success, and competitive differentiation of a business.

                        The increased focus on business agility and cost optimization has led to the rise and growth of cloud data centers.
                        Cloud data centers have five essential characteristics of cloud computing as listed by National Institute of
                        Technology (NIST). These five characteristics are on-demand self-service, broad network access, resource
                        pooling, rapid elasticity or expansion, and measured service. For more details, refer to Appendix E. Cloud adoption
                        enables faster delivery of services and data, increased application performance, and improved operational
                        efficiencies.

                        Although security and integration with existing IT environments continue to represent concerns for some potential
                        cloud-based applications, a growing range of consumer and business cloud services are currently available.
                        Today’s cloud services address varying customer requirements (for example, privacy, mobility, and multiple device
                        access) and support near-term opportunities as well as long-term strategic priorities for network operators, both
                        public and private.

                        Hyperscale data center growth
                        The increasing need for data center and cloud resources from both the business and consumer service perspective
                        has led to the development of large-scale public cloud data centers called hyperscale data centers. Hyperscale
                        cloud operators are increasingly dominating the cloud landscape.

                        To be a hyperscale cloud operator, a company must meet the following criteria defined in terms of annual
                        revenues:

                              ●   More than US$1 billion in annual revenue from Infrastructure as a Service (IaaS), Platform as a Service
                                  (PaaS), or infrastructure hosting services (for example, Amazon/AWS, Rackspace, Google)
                              ●   More than US$2 billion in annual revenue from Software as a Service (SaaS) (for example, Salesforce,
                                  ADP, Google)
                              ●   More than US$4 billion in annual revenue from Internet, search, and social networking (for example,
                                  Facebook, Yahoo, Apple)
                              ●   More than US$8 billion in annual revenue from e-commerce/payment processing (for example, Amazon,
                                  Alibaba, eBay)
                        Twenty-four hyperscale operators were identified using the preceding criteria. The data centers operated by these
                        companies are what we consider as hyperscale. The hyperscale operator might own the data center facility, or it
                        might lease it from a colocation/wholesale data center provider.

© 2018 Cisco and/or its affiliates. All rights reserved. This document is Cisco Public Information.                                     Page 6 of 46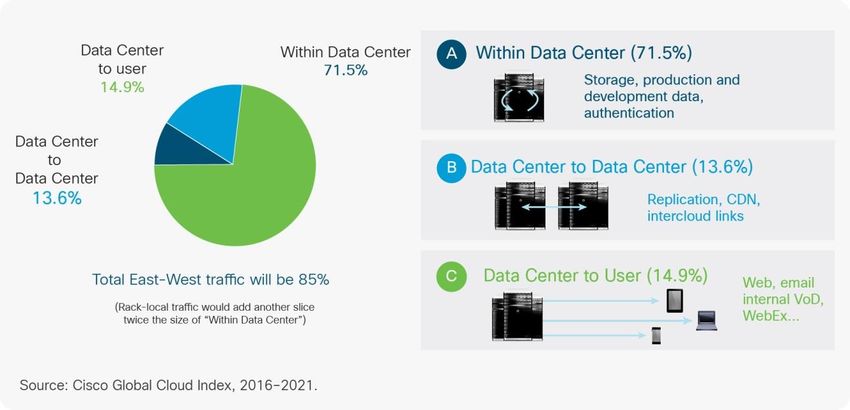
Figure 1.      Global hyperscale data center growth

                        These hyperscale data centers will grow from 338 in number at the end of 2016 to 628 by 2021. They will represent
                        53 percent of all installed data center servers by 2021. In other words, they will account for 85 percent of the public
                        cloud server installed base in 2021 and 87 percent of public cloud workloads and compute instances.

                        While only seven of these 24 companies are headquartered outside of the United States, their data center footprint
                        is much more geographically diverse.

                        Figure 2.      Hyperscale data center growth: Regional view

                        Note:       Percentages within parentheses refer to relative share for 2016 and 2021.

© 2018 Cisco and/or its affiliates. All rights reserved. This document is Cisco Public Information.                                    Page 7 of 46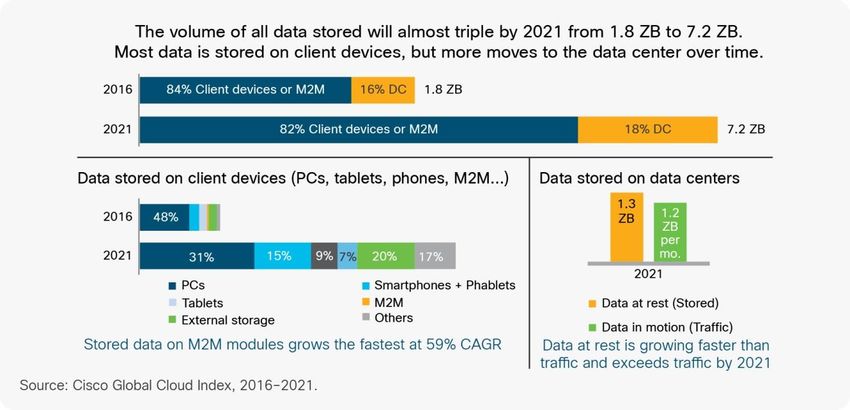
At the end of 2017, these 24 hyperscale operators will in aggregate have 386 data centers, with North America
                        having the largest share, at 46 percent, followed by Asia Pacific, with 30 percent, Western Europe, with 19 percent,
                        and Latin America, with 4 percent.

                        Asia Pacific has been the fastest growing region in terms of hyperscale data center location and will continue to
                        grow more rapidly over the next five years, taking over the lead from North America, accounting for 39 percent of
                        hyperscale data centers by the end of 2021.

                        As with servers, hyperscale data centers represent a large portion of overall data, traffic, and processing power in
                        data centers. Traffic within hyperscale data centers will quadruple by 2021. Hyperscale data centers already
                        account for 39 percent of total traffic within all data centers and will account for 55 percent by 2021. Hyperscale
                        data centers will also represent 65 percent of all data stored in data centers and 69 percent of total data center
                        processing power.

                        Figure 3.      The scale of hyperscale data centers

                        Global data center IP traffic: Threefold increase by 2021
                        Most Internet traffic has originated or terminated in a data center since 2008, when peer-to-peer traffic (which does
                        not originate from a data center but instead is transmitted directly from device to device) ceased to dominate the
                        Internet application mix. Data center traffic will continue to dominate Internet traffic for the foreseeable future, but
                        the nature of data center traffic is undergoing a fundamental transformation brought about by cloud applications,
                        services, and infrastructure. The importance and relevance of the global cloud evolution are highlighted by one of
                        the top-line projections from this updated forecast: by 2021 more than 95 percent of data center traffic will be cloud
                        traffic.

                        The following sections summarize not only the volume and growth of traffic entering and exiting the data center, but
                        also the traffic carried between different functional units within the data center, cloud versus traditional data center
                        segments, and business versus consumer cloud segments.

© 2018 Cisco and/or its affiliates. All rights reserved. This document is Cisco Public Information.                                       Page 8 of 46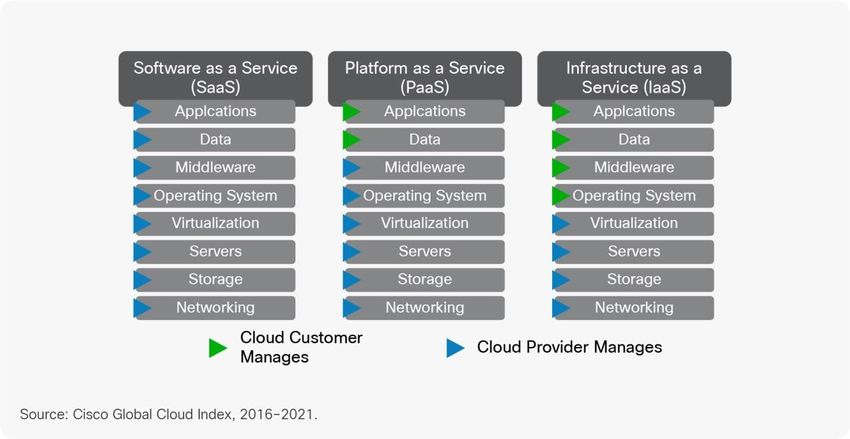
Figure 4 summarizes the forecast for data center IP traffic growth from 2016 to 2021.

                        Figure 4.         Global data center IP traffic growth

                        Although the amount of global traffic crossing the Internet and IP WAN networks is projected to reach 3.3 ZB per
                                             1
                        year by 2021 , the amount of annual global data center traffic in 2016 is already estimated to be 6.8 ZB and by
                        2021 will triple to reach 20.6 ZB per year. This increase represents a 25 percent CAGR. The higher volume of data
                        center traffic is due to the inclusion of traffic inside the data center (typically, definitions of Internet and WAN traffic
                        stop at the boundary of the data center).

                        The global data center traffic forecast, a major component of the Cisco GCI report, covers network data centers
                        worldwide operated by service providers as well as enterprises. Refer to Appendix A for more details about the
                        methodology of the data center and cloud traffic forecasts and Appendix B for the positioning of the GCI Forecast
                        relative to the Cisco VNI Global IP Traffic Forecast.
                        1
                            Refer to Cisco Visual Networking Index: Forecast and Methodology, 2016–2021.

                        Table 1 provides details for global data center traffic growth rates.

                        Table 1.          Global data center traffic, 2016–2021

                            Category or function

                                                 2016          2017               2018                2019     2020     2021          CAGR 2016-
                                                                                                                                      2021

                            By Type (EB per Year)

                            Data center to       998           1,280              1,609               2,017    2,500    3,064         25.2%
                            user

                            Data center to       679           976                1,347               1,746    2,245    2,796         32.7%
                            data
                            Within data          5,143         6,831              8,601               10,362   12,371   14,695        23.4%
                            center

                            By Segment (EB per Year)
                            Consumer             4,501         6,156              8,052               10,054   12,401   15,107        27.4%

                            Business             2,319         2,931              3,505               4,070    4,716    5,449         18.6%

© 2018 Cisco and/or its affiliates. All rights reserved. This document is Cisco Public Information.                                           Page 9 of 46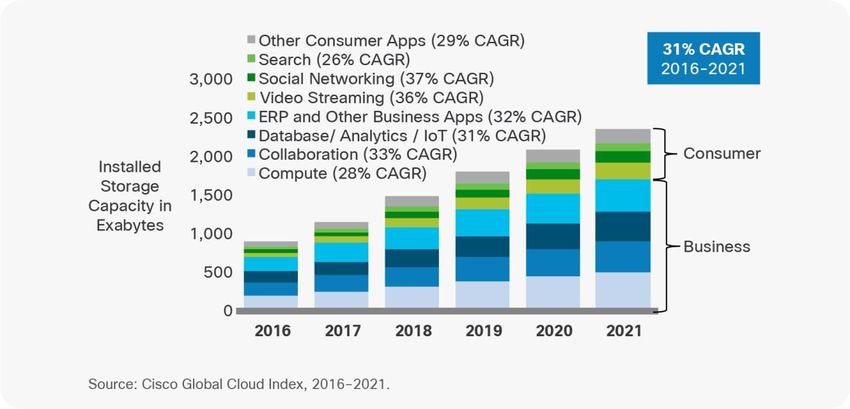
Category or function

                                            2016               2017               2018                2019     2020     2021          CAGR 2016-
                                                                                                                                      2021

                         By Type (EB per Year)

                         Cloud data         5,991              8,190              10,606              13,127   16,086   19,509        26.6%
                         center
                         Traditional        828                897                952                 997      1,030    1,046         4.8%
                         data center

                         Total (EB per Year)
                         Total data         6,819              9,087              11,557              14,124   17,116   20,555        24.7%
                         center

                        Definitions:

                              ●   Data center to user: Traffic that flows from the data center to end users through the Internet or IP WAN
                              ●   Data center to data center: Traffic that flows from data center to data center
                              ●   Within data center: Traffic that remains within the data center, excludes traffic within the rack
                              ●   Consumer: Traffic originating with or destined for consumer end users
                              ●   Business: Traffic originating with or destined for business end users
                              ●   Cloud data center: Traffic associated with cloud data centers
                              ●   Traditional data center: Traffic associated with noncloud data centers
                        Data Center Traffic Destinations: Most Traffic Remains Within the Data Center

                        Consumer and business traffic flowing through data centers can be broadly categorized into three main areas
                        (Figure 5):

                              ●   Traffic that remains within the data center: For example, moving data from a development environment to a
                                  production environment within a data center, or writing data to a storage array
                              ●   Traffic that flows from data center to data center: For example, moving data between clouds, or copying
                                  content to multiple data centers as part of a content distribution network
                              ●   Traffic that flows from the data center to end users through the Internet or IP WAN: For example, streaming
                                  video to a mobile device or PC

© 2018 Cisco and/or its affiliates. All rights reserved. This document is Cisco Public Information.                                           Page 10 of 46
Figure 5. Global data center traffic by destination in 2021
The portion of traffic residing within the data center will decline slightly over the forecast period, accounting for 75.4
percent of data center traffic in 2016 and 71.5 percent by 2021. The totals for within the data center do not include
rack-local traffic (traffic that remains within a given server rack). Rack-local traffic is approximately twice the size of
the ―within data center‖ volumes shown in the forecast. The inclusion of rack-local traffic would change our traffic
distribution to show more than 90 percent of traffic remaining local to the data center.
Big data is a significant driver of traffic within the data center. While much of big data traffic is rack-local, enough
exits the rack that big data will be responsible for 20 percent of all traffic within the data center by 2021, up from 12
percent in 2016. Video does not drive a large volume of traffic within the data center, since minimal processing is
done on the video relative to the large size of the video stream.
Traffic between data centers is growing faster than either traffic to end users or traffic within the data center, and by
2021, traffic between data centers will account for almost 14 percent of total data center traffic, up from 10 percent
at the end of 2016. The high growth of this segment is due to the increasing prevalence of content distribution
networks, the proliferation of cloud services and the need to shuttle data between clouds, and the growing volume
of data that needs to be replicated across data centers.
Overall, east-west traffic (traffic within the data center and traffic between data centers) will represent 85 percent of
total data center by 2021, and north-south traffic (traffic exiting the data center to the Internet or WAN) will be only
15 percent of traffic associated with data centers.
Global data center and cloud IP traffic growth
Data center traffic on a global scale will grow at a 25 percent CAGR (Figure 4), but cloud data center traffic will
grow at a slightly faster rate (27 percent CAGR) or 3.3-fold growth from 2016 to 2021 (Figure 6).
© 2018 Cisco and/or its affiliates. All rights reserved. This document is Cisco Public Information. Page 11 of 46Figure 6. Cloud data center traffic growth
Cloud will represent more than 95 percent of all data center traffic will be based in the cloud. (For regional cloud
traffic trends, refer to Appendix C) Significant promoters of cloud traffic growth include the rapid adoption of and
migration to cloud architectures and the ability of cloud data centers to handle significantly higher traffic loads.
Cloud data centers support increased virtualization, standardization, and automation. These factors lead to better
performance as well as higher capacity and throughput.
The evolution of data center architecture: SDN/NFV
Three technology trends are transforming the data center: leaf-spine architectures (which flatten the tiered
architecture of the data center), software-defined networks (SDNs, which separate the control and forwarding of
data center traffic), and network function virtualization (NFV, which virtualizes a variety of network elements).
Most major hyperscale data centers already employ flat architectures and software-defined network and storage
management, and adoption of SDN/ NFV within large-scale enterprise data centers has been rapid. Over two-
thirds of data centers will adopt SDN either fully or in a partial deployment by 2021 (Figure 7).
© 2018 Cisco and/or its affiliates. All rights reserved. This document is Cisco Public Information. Page 12 of 46Figure 7. Cloud data center traffic growth
As a portion of traffic within the data center, SDN/NFV is already transporting 23 percent, growing to 44 percent by
2021 (Figure 8).
Figure 8. SDN/NFV traffic within the data center
SDN and NFV, along with flat architectures, might streamline traffic flows with the data center such that traffic is
routed more efficiently in the future than it is routed today. In theory, SDN allows for traffic handling policies to
follow virtual machines and containers, so that those elements can be moved within a data center in order to
minimize traffic in response to bandwidth bottlenecks. However, there are also ways in which SDN/NFV can lead to
an increase in both data center traffic and in general Internet traffic:
© 2018 Cisco and/or its affiliates. All rights reserved. This document is Cisco Public Information. Page 13 of 462 3
Big data: Traffic engineering enabled by SDN/ NFV supports ―elephant‖ data flows without compromising ―mouse‖
data flows, making it safe to transport large amounts of data to and from big data clusters.
● Video bitrates: SDN will allow video bitrates to increase, because SDN can seek out highest bandwidth
available even midstream, instead of lowering the bitrate according the available bandwidth for the duration
of the video, as is done today.
● Cloud gaming: SDN can decrease latency within the data center, decreasing delay experiences by end-
users in cloud gaming applications, which might help increase cloud gaming adoption by both content
providers and end users.
Trend 2: Continued global data center virtualization
A server workload and compute instance is defined as a virtual or physical set of computer resources, including
storage, that are assigned to run a specific application or provide computing services for one to many users. A
workload and compute instance is a general measurement used to describe many different applications, from a
small lightweight SaaS application to a large computational private cloud database application. For the purposes of
quantification, we consider each workload and compute instance being equal to a virtual machine or a container. In
fact, containers are one of the factors enabling a steady increase in the number of workloads and compute
instances per server deployed. The Cisco Global Cloud Index forecasts the continued transition of workloads and
compute instances from traditional data centers to cloud data centers. By 2021, 94 percent of all workloads and
compute instances will be processed in cloud data centers (Figure 9). For regional distributions of workloads and
compute instances, refer to Appendix D.
2
Elephant flows have varying definitions in the industry, but refer to flows of traffic that carry a disproportionate amount of traffic
in terms of bytes, usually greater than 1% of total traffic in a time period.
3
Mouse flows generate average or below traffic, but might have strict requirements in terms of latency.
Figure 9. Workload and compute instance distribution: 2016–2021
© 2018 Cisco and/or its affiliates. All rights reserved. This document is Cisco Public Information. Page 14 of 46Cloud workloads and compute instances are expected to nearly triple (grow 2.7-fold) from 2016 to 2021, whereas
traditional data center workloads and compute instances are expected to see a global decline, at a negative 5
percent CAGR from 2016 to 2021. Traditionally, one server carried one workload and compute instance. However,
with increasing server computing capacity and virtualization, multiple workloads and compute instances per
physical server are common in cloud architectures. Cloud economics, including server cost, resiliency, scalability,
and product lifespan, along with enhancements in cloud security, are promoting migration of workloads and
compute instances across servers, both inside the data center and across data centers (even data centers in
different geographic areas). Often an end-user application can be supported by several workloads and compute
instances distributed across servers. Table 2 provides details about the shift of workloads from traditional data
centers to cloud data centers.
Table 2. Workload and compute instance shift from traditional data centers to cloud data centers
Global data center workloads and compute instances in millions
2016 2017 2018 2019 2020 2021 CAGR 2016-2021
Traditional data center 42.1 41.4 40.8 39.1 36.2 32.9 -5%
workloads and compute
instances
Cloud data center 199.4 262.4 331.0 393.3 459.2 533.7 22%
workloads and compute
instances
Total data center 241.5 303.8 371.8 432.4 495.4 566.7 19%
workloads and compute
instances
Cloud workloads and 83% 86% 89% 91% 93% 94% -
compute instances as a
percentage of total data
center workloads and
compute instances
Traditional workloads and 17% 14% 11% 9% 7% 6% -
compute instances as a
percentage of total data
center workloads and
compute instances
One of the main factors prompting the migration of workloads and compute instances from traditional data centers
to cloud data centers is the greater degree of virtualization (Figure 10) in the cloud space, which allows dynamic
deployment of workloads and compute instances in the cloud to meet the dynamic demand of cloud services. This
4
greater degree of virtualization in cloud data centers can be expressed as workload and compute instance density.
Workload and compute instance density measures average number of workloads and compute instances per
physical server. The workload and compute instance density for cloud servers will grow from 8.8 in 2016 to 13.2 by
2021. In comparison, the workload and compute instance density in traditional data center servers will grow from
2.4 in 2016 to 3.8 by 2021.
© 2018 Cisco and/or its affiliates. All rights reserved. This document is Cisco Public Information. Page 15 of 46Figure 10. Increasing cloud virtualization
Public vs. private cloud5
We look into the growth of public cloud vs. private cloud through workload and compute instance analysis. Public
cloud, as indicated by the workloads and compute instances growth, is growing faster than the private cloud. As
the business sensitivity to costs associated with dedicated IT resources grows along with demand for agility, we
can see a greater adoption of public cloud by the businesses, especially with strengthening of public cloud security.
Although many mission-critical workloads and compute instances might continue to be retained in the traditional
data centers or private cloud, the public cloud adoption is increasing along with the gain in trust in public cloud.
Some enterprises might adopt a hybrid approach to cloud. In a hybrid cloud environment, some of the cloud
computing resources are managed in-house by an enterprise and some are provided by an external provider.
Cloud bursting is an example of hybrid cloud where daily computing requirements are handled by a private cloud,
but for sudden spurts of demand the additional traffic demand (bursting) is handled by a public cloud.
While the overall cloud workloads and compute instances are growing at a CAGR of 26 percent from 2016 to 2021
(Figure 11), the public cloud workloads and compute instances are going to grow at 28 percent CAGR from 2016 to
2021, and private cloud workloads and compute instances will grow at a slower pace of 11 percent CAGR from
2016 to 2021. By 2021, there will continue to be more workloads and compute instances (73 percent) in the public
cloud as compared to private cloud (27 percent).
4
Average Workload and Compute Instance Density = (Total Physical Servers*Virtualization Rate (% of Physical servers are
virtualized) *VM density (Average VMs per virtualized physical server))+Non-virtualized Physical Servers)/Total Physical
Servers.
5
For definition of public and private cloud, refer to Appendix E.
Figure 11. Public vs. private cloud growth
© 2018 Cisco and/or its affiliates. All rights reserved. This document is Cisco Public Information. Page 16 of 46This growth of workloads and compute instances in the public cloud space is also reflected in the growth of
virtualization, as shown in Figure 12. The workload and compute instance density in public cloud data centers is
higher than that in private cloud data centers. Private cloud workload and compute instance volume had historically
been much bigger than public cloud because the biggest factor driving workload and compute instance numbers
was the amount of virtualization being assumed. In 2015, however, public cloud workload and compute instance
volume surpassed private cloud workloads and compute instances because of a big increase in public cloud server
installed base and higher workload and compute instance VM densities.
Figure 12. Public cloud virtualization gaining momentum
Trend 3: Cloud service trends
This section reviews the growth of the three different cloud service categories: IaaS, PaaS, and SaaS. Although
6
numerous other service categories have emerged over time, they can be aligned within the IaaS, PaaS, and SaaS
categorization. For example, Business Process as a Service (BPaaS) is considered part of SaaS. For simplicity, we
can think of these three service models as different layers of cloud with infrastructure at the bottom, the platform
next, and finally software at the top.
GCI categorizes a cloud workload and compute instance as IaaS, PaaS, or SaaS based upon how the user
ultimately uses the service, regardless of other cloud services types that might be involved in the final delivery of
the service. As an example, if a cloud service is a SaaS type but it also depends on some aspects of other cloud
services such as PaaS or IaaS, such a workload and compute instance is counted as SaaS only. As another
example, if a PaaS workload and compute instance operates on top of an IaaS service, such a workload and
compute instance is counted as PaaS only.
At the aggregate cloud level, we find that SaaS workloads and compute instances maintain majority share
throughout the forecast years, and by 2021 will have 75 percent share of all cloud workloads, growing at 23
percent CAGR from 2016 to 2021 (Figure 13). PaaS will have the equally fast growth, although it will gain a single
percentage point in the share of total cloud workloads and compute instances from 8 percent in 2016 to 9 percent
by 2021.
© 2018 Cisco and/or its affiliates. All rights reserved. This document is Cisco Public Information. Page 17 of 46Figure 13. SaaS most highly deployed global cloud service from 2016 to 2021
In order to understand the reasons behind this trend, we have to analyze the public and private cloud segments a
bit more deeply. In the private cloud, initial deployments were predominantly IaaS. Test and development types of
cloud services were the first to be used in the enterprise; cloud was a radical change in deploying IT services, and
this use was a safe and practical initial use of private cloud for enterprises. It was limited, and it did not pose a risk
of disrupting the workings of IT resources in the enterprise. As trust in adoption of SaaS or mission-critical
applications builds over time with technology enablement in processing power, storage advancements, memory
advancements, and networking advancements, we foresee the adoption of SaaS type applications to accelerate
over the forecast period (Figure 14), while shares of IaaS and PaaS workloads and compute instances decline.
6
For definitions of IaaS, PaaS, and SaaS, refer to Appendix E.
Figure 14. SaaS gains momentum in private cloud
In the public cloud segment the first cloud services to be deployed were SaaS. SaaS services offered in the public
cloud were often a low-risk and easy-to-adopt proposition, with some clear financial and flexibility benefits to users.
The first users of SaaS were the consumer segment, followed by some small and medium-sized businesses. As
public SaaS solutions become more sophisticated and robust, larger enterprises are adopting these services as
well, beginning with less-critical services. Enterprises, especially large ones, will be carefully weighing the benefits
(scalability, consistency, cost optimization, and so on) of adopting public cloud services against the risks (security,
data integrity, business continuity, and so on) of adopting such services.
As shown in Figure 15, IaaS and PaaS have gone beyond the initial stages of deployment in the public cloud.
Spend on public IaaS and PaaS is still small compared with spend on enterprise data center equipment, data
center facilities, and associated operating expenses. These cloud services will gain momentum over the forecast
© 2018 Cisco and/or its affiliates. All rights reserved. This document is Cisco Public Information. Page 18 of 46period as more competitive offers come to the market and continue to build enterprise trust for outsourcing these
more technical and fundamental services.
Figure 15. IaaS and PaaS gain public cloud share of workloads and compute instances
Trend 4: Workloads and compute instances by application
We estimate that in 2016 enterprises (including SMB, government, and public sector) accounted for 76 percent of
workloads and compute instances and consumers 24 percent. Consumer share of the total will grow to 27 percent
by 2021, while enterprise sector share will decline to 73 percent (Figure 16).
Figure 16. Global data center workloads and compute instances: Consumer vs. enterprise applications
Within enterprise, compute/IaaS and collaboration are the two main contributors to workload and compute instance
totals, while on the consumer side video/media streaming is the biggest contributor. While the percentage mix will
change, those will remain the biggest contributors to workload and compute instance totals over the next five years
(Figure 17). For definitions of the applications, see Appendix F.
© 2018 Cisco and/or its affiliates. All rights reserved. This document is Cisco Public Information. Page 19 of 46Figure 17. Global data center workloads and compute instances by applications
If we look at the application split of workloads and compute instances across traditional, public, and private cloud
data centers, then we find that public cloud data centers have the largest share of consumer application workloads
and compute instances, while traditional and private cloud data centers have a larger share in the
business/enterprise segment (Figure 18).
Figure 18. Global data center workloads and compute instances by applications: Traditional vs. cloud (2016)
However, by 2021, traditional and private cloud data centers will lose share to public clouds across all applications
(Figure 19).
© 2018 Cisco and/or its affiliates. All rights reserved. This document is Cisco Public Information. Page 20 of 46Figure 19. Global data center workloads and compute instances by applications: Traditional vs. cloud (2021)
Trend 5: Data center and cloud storage: capacity and utilization
Global data center storage installed capacity
In this section, we have looked at the installed storage capacity in global data centers. We estimate that total data
center storage capacity will grow nearly 4-fold from 2016 to 2021, growing from 663 EB in 2016 to 2.6 ZB by 2021.
Business application workloads and compute instances will have the highest share of installed storage throughout
the forecast, while social networking and media streaming will have the fastest growth (Figure 20).
Figure 20. Global data center storage capacity
© 2018 Cisco and/or its affiliates. All rights reserved. This document is Cisco Public Information. Page 21 of 46Global data center storage utilization
Storage utilization varies by type of storage and generally ranges from 30 to 70 percent, especially given that
deployments of additional capacity are growing quickly. Globally, the data stored in data centers will grow 4.6-fold
by 2021 to reach 1.3 ZB by 2021, up from 286 EB in 2016 (Figure 21).
Figure 21. Actual data stored in data centers
Big data is a key driver of overall growth in stored data. Big data will reach 403 EB by 2021, up almost 8-fold from
51 EB in 2016. Big data alone will represent 30 percent of data stored in data centers by 2021, up from 18 percent
in 2016 (Figure 22).
Figure 22. Big data volumes
© 2018 Cisco and/or its affiliates. All rights reserved. This document is Cisco Public Information. Page 22 of 46Big data is defined here as data deployed in a distributed processing and storage environment (such as Hadoop).
Generally speaking, distributed processing is chosen as a data architecture when the data is big in volume (more
than 100 terabytes), velocity (coming in or going out at more than 10 gigabytes per second), or variety (combining
data from a dozen or more sources). Big data is sometimes used interchangeably with data analytics or data
science, but data science techniques can be used on data of any size, and the quality of insights achieved with
data science is not related to the size of the underlying data.
As large as the data stored in data centers will be (1.3 zettabyte by 2021), the amount of data stored on devices
will be 4.5 times higher: 5.9 ZB by 2021. Out of the combined 7.2 ZB of stored data in the world, most stored data
will continue to reside in client devices, as it does today. Today, only 16 percent of total stored data is stored in the
data center, but more data will move to the data center over time (Figure 23). In addition to larger volumes of
stored data, the stored data will be coming from a wider range of devices by 2021. Currently, 48 percent of data
stored on client devices resides on PCs. By 2021, stored data on PCs will reduce to 31 percent, with a greater
portion of data on smartphones, tablets, and Machine-to-Machine (M2M) modules. Stored data associated with
M2M grows at a faster rate than any other device category.
Figure 23. Data center storage analysis
Over time, cloud-based services will enable consumers and businesses alike to move more of their stored data to a
central repository that can provide ubiquitous access to content and applications through any device at any
location.
Trend 6: Global digitization: Effects of IoT and the advent of the yottabyte era
Potential effects of IoT on global data centers
Cloud services are accelerated in part by the unprecedented amounts of data being generated by not only people
but also machines and things. Cisco GCI estimates that nearly 850 ZB will be generated by all people, machines,
and things by 2021, up from 220 ZB generated in 2016.
© 2018 Cisco and/or its affiliates. All rights reserved. This document is Cisco Public Information. Page 23 of 46Most of the more than 850 ZB that will be generated by 2021 will be ephemeral in nature and will be neither saved
nor stored. Much of this ephemeral data is not useful to save, but we estimate that approximately 10 percent is
useful, which means that there will be 10 times more useful data being created (85 ZB, 10 percent of the 850 total)
than will be stored or used (7.2 ZB) in 2021. Useful data also exceeds data center traffic (21 ZB per year) by a
factor of four. Edge or fog computing might help bridge this gap (Figure 24).
Figure 24. Smart city: Multiple applications create big data
Trend 7: Global cloud readiness
Broad cloud adoption: Enabled by the growth in applications
When enterprises shift to the cloud, their security perimeter extends into the virtual realm. However, that security
perimeter quickly dissipates with each connected third-party cloud application that employees introduce into the
environment, according to the 2017 Cisco Annual Cybersecurity Report (ACR). The cloud security provider
CloudLock, now part of Cisco, has been tracking the growth of connected third-party cloud applications across a
sample group of 900 organizations representing a range of industries. As Figure 25 shows, there were about
129,000 unique applications observed at the beginning of 2016. By the end of October, that number had grown to
222,000.
© 2018 Cisco and/or its affiliates. All rights reserved. This document is Cisco Public Information. Page 24 of 46Figure 25. Proliferation of connected third-party cloud applications, 2016
Looking deeper into the cloud, a key component of providing cloud services is the web API. An application
programming interface, or API, is an interface for software. APIs are used by software applications in much the
same way that interfaces for apps and other software are used by humans. Since 2005, APIs have grown from a
curiosity to a trend and now to the point where they are core to many businesses. APIs have provided tremendous
value to countless organizations and developers, enabling a richer SaaS environment, which is reflected in their
continued growth.
Figure 26. Web APIs unlock the full potential of the cloud; remarkable growth in number since 2005
The most popular web APIs of all time are all cloud based, as seen in Figure 27.
© 2018 Cisco and/or its affiliates. All rights reserved. This document is Cisco Public Information. Page 25 of 46Figure 27. APIs that most interest developers and users
Source: Programmable Hub, September 2017, Cisco GCI, 2017.
The move to the cloud is imminent. In just the past year, a variety of businesses and organizations have reported
their plans for cloud migration or adoption. For example, Netflix announced plans to shut down the last of its
traditional data centers during 2016, a step that made it one of the first big companies to run all of its IT in the
public cloud. Netflix is also making strides in container-based workloads and compute instances. In December
2015, it launched a few thousand containers per week across a handful of workloads and compute instances. By
April 2017, it had launched more than one million containers. These containers represent hundreds of workloads
and compute instances. This thousandfold increase in container usage happened over a year time frame, and
growth doesn’t look to be slowing down.6 Several additional cloud adoption examples across the industries are
provided in Figure 28.
© 2018 Cisco and/or its affiliates. All rights reserved. This document is Cisco Public Information. Page 26 of 46Figure 28. Examples of broad cloud adoption
6
https://medium.com/netflix-techblog/the-evolution-of-container-usage-at-netflix-3abfc096781b.
Scalability and allocation of resources are the major advantages of virtualization (refer to the section ―Trend 2:
Continued Global Data Center Virtualization‖) and cloud computing. Administrators can bring up Virtual Machines
(VMs) and servers quickly without having the overhead of ordering or provisioning new hardware. Hardware
resources can be reassigned quickly, and extra processing power can be consumed by other services for
maximum efficiency. By taking advantage of all the available processing power and untethering the hardware from
a single server model, cost efficiencies are being realized in both private and public clouds.
Security: Imperative for cloud growth
According to the National Institute of Technology (NIST), cloud computing can be divided into three main service
types (refer to the section ―Trend 3: Cloud Service Trends‖): Infrastructure as a Service (IaaS), Platform as a
Service (PaaS), and Software as a Service (SaaS), and each affects data control and governance a little
differently. With IaaS, the customer might have full control of the actual server configuration, granting them more
risk management control over the environment and data. In PaaS, the provider manages the hardware and
underlying operating system, limiting enterprise risk management capabilities on those components. With SaaS,
both the platform and the infrastructure are fully managed by the cloud provider, meaning if the underlying
operating system or service isn’t configured appropriately the data in the higher layer application might be at risk.
Cybercrime damages will cost the world $6 trillion annually by 2021.7 The cybercrime costs prediction includes
damage and destruction of data, stolen money, lost productivity, theft of intellectual property, theft of personal and
financial data, embezzlement, fraud, postattack disruption to the normal course of business, forensic investigation,
restoration and deletion of hacked data and systems, and reputational harm. Cyberthreats have evolved from
targeting and harming computers, networks, and smartphones to people, cars, railways, planes, power grids, and
anything with a heartbeat or an electronic pulse, all powered by the cloud. The last several years have undoubtedly
been the most eventful period from a cloud security threat perspective, with various instances of massive breaches
and escalating Distributed Denial-of-Service (DDoS) amplification attacks.
© 2018 Cisco and/or its affiliates. All rights reserved. This document is Cisco Public Information. Page 27 of 46The Cisco 2017 Security Capabilities Benchmark Study also found that nearly a quarter of the organizations that
have suffered an attack lost business opportunities. Four in 10 said those losses are substantial. One in five
organizations lost customers due to an attack, and nearly 30 percent lost revenue.
Every 40 seconds, a business falls victim to a ransomware attack. The world’s largest shipping companies reported
losses in the order of $300M each from the NoPetya ransomware attack in June 2017. DDoS attacks are
amplification-based attacks when multiple systems flood the bandwidth or resources of a targeted system, usually
one or more web servers. In October 2017, a DDoS attack crashed the IT system that monitors train locations in
Sweden. It also took down the federal agencies’ email system, website, and road traffic maps. According to
WhiteHat’s 2017 Application Security Statistics Report, 30 percent of reported breaches in 2016 involved attacks
on web/cloud applications.
Users expect their online experiences to be always available and always secure—and their personal and business
assets to be safe. As more data, business processes, and services move to the cloud, organizations are
challenged to protect websites and infrastructure without sacrificing performance for security. To help meet user
expectations, more secure Internet servers are being deployed worldwide. This situation creates a growing
infrastructure footprint that provides more stringent authorization and authentication processes and better serves
end users with secure transactions and communication. The percentage of secure Internet servers that conduct
encrypted transactions over the Internet using a Secure Sockets Layer (SSL) to the total number of web facing
servers is shown in Figure 29. In the past year, North America and Western Europe led with the percentage of
secure Internet servers compared to web-facing Internet servers.
7
https://cybersecurityventures.com/hackerpocalypse-cybercrime-report-2016.
Figure 29. Enabling authentication and secure Internet; percentage of secure Internet servers to all web-facing servers, 2017
© 2018 Cisco and/or its affiliates. All rights reserved. This document is Cisco Public Information. Page 28 of 46One of the most significant data breaches that has affected end users in 2017 has been the successful theft of 143
million customer records from Equifax (a consumer credit reporting agency), a cybercrime with devastating
consequences because of the type of personally identifiable information stolen. Information theft of this type One of
the most significant data breaches that has affected end users in 2017 has been the successful theft of 143 million
customer records from Equifax (a consumer credit reporting agency), a cybercrime with devastating consequences
because of the type of personally identifiable information stolen. Information theft of this type remains the most
expensive consequence of a cybercrime. The massive breach at Equifax illustrates how data thefts often stem from
8
the failure to keep up with software updates .
Although end-user security concerns exist, the time of amateur hackers is long over, and hacking is now an
organized crime or state-sponsored event. DDoS attacks against customers remain a major operational threat to
service providers. Attacks against infrastructure continue to grow in prominence. Phishing and malware threats
occur on a daily basis. According to the Cisco 2017 Annual Security report, security professionals have many
sources of concern in relation to cyberattacks, as seen in Figure 30.
Figure 30. Security professionals’ biggest sources of concern related to cyberattacks, 2016
8
https://blogs.wsj.com/cio/2017/09/18/scourge-of-outdated-software-creates-massive-cyber-risk/?mg=prod/accounts-wsj.
IoT and big data requirements are starting a new wave of security discussions and technology convergence. As
enterprises and service providers move to public and private clouds and modernize data centers with SDN or
consume IT as a Service (ITaaS), security becomes an even more complex concern. Besides hardware
appliances, virtual machines, and server software, innovative services that use SDN and NFV will help to improve
the data integrity and security of cloud infrastructures.
© 2018 Cisco and/or its affiliates. All rights reserved. This document is Cisco Public Information. Page 29 of 46Network speeds and latency analysis
The cloud-readiness study offers a regional view of the requirements for broadband and mobile networks to deliver
next-generation cloud services. The enhancements and reliability of these networks will support the increased
adoption of cloud computing solutions that deliver basic as well as advanced application services. For example,
consumers expect to be able to communicate with friends as well as stream music and videos at any time, any
place. Business users require reliable access to business communications along with mobile solutions for video
conferencing and mission-critical customer and operational management systems.
The study also explores the ability of each global region (Asia Pacific, Central and Eastern Europe, Latin America,
Middle East and Africa, North America, and Western Europe) to support a sample set of basic, intermediate, and
advanced business and consumer cloud applications. Each region’s cloud readiness is assessed with relation to
the sample services based on download and upload fixed and mobile network speeds as well as associated
network latencies (segmented by business and consumer connections). Download and upload speeds as well as
latencies are essential measures to assess network capabilities for cloud readiness. Figure 31 provides the
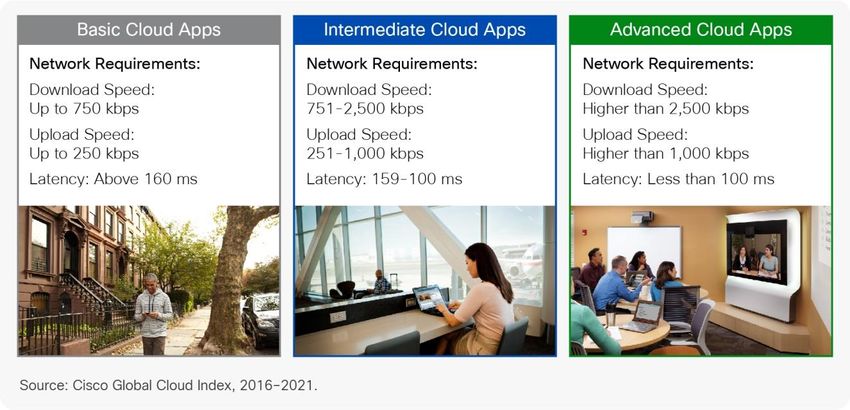
business and consumer cloud service categories and the corresponding network requirements used for this study.
Tables 3 through 5 describe the requirements and define a sample set of applications from each of the readiness
categories. Note that the concurrent use of applications can further influence the user experience and cloud
accessibility.
Figure 31. Sample business and consumer cloud service categories
© 2018 Cisco and/or its affiliates. All rights reserved. This document is Cisco Public Information. Page 30 of 46Table 3. Sample basic applications
Apps Definitions Download Upload Latency
Stream basic video and Deliver sound and video High Low Medium
music without the need to
download files of different
audio or video formats
using computer servers
connected to the Internet to
access information.
Text communications A cross-platform Low Low Medium
(email and instant messaging application that
messaging) allows the exchange of
messages without having
to pay for Short Message
Service (SMS), using an
Internet data plan.
Voice over IP (VoIP) A broad range of services Low Low Medium
(Internet telephony) transmitting voice over the
Internet.
Web browsing Accelerate web Low Low Medium
experiences and searching
through cloud computing
using technology to shift
the workload to the cloud
servers.
Web conferencing A cloud application used to Medium Medium Medium
interact with other
participants and have that
live and in-person feeling
for attendees; it offers
services such as
collaborative web browsing
and application sharing.
Cloud-based learning This app provides the user High High Medium
management system with the flexibility of being
able to access and
collaborate with others in a
centralized environment.
With information housed in
a virtual storage
environment, it allows work
to be completed outside
the boundaries of the
formal learning or work
institutions.
Table 4. Sample intermediate applications
Apps Definitions Download Upload Latency
Enterprise Resource ERP and CRM systems Medium Low Medium
Planning (ERP) and allow businesses to
Customer Relationship manage their business and
Management (CRM) business relationships and
the data and information
associated with them.
High-Definition (HD) Deliver HD video without High Low Low
video streaming the need to download files
of HD video formats using
computer servers
connected to the Internet to
access information.
© 2018 Cisco and/or its affiliates. All rights reserved. This document is Cisco Public Information. Page 31 of 46Apps Definitions Download Upload Latency
Augmented Reality (AR) Augmented Reality (AR) High Medium Low
gaming applications games involve a live direct
or indirect view of a
physical, real-world
environment whose
elements are augmented
(or supplemented) by
computer-generated
sensory input such as
sound, video, graphics, or
GPS data.
Web Electronic Health EHRs are designed to Medium High Low
Records (EHRs) contain and share
information from all
providers involved in a
patient’s care in a
structured format allowing
patient information to be
easily retrieved and
transferred in ways that
can aid patient care.
Voice over LTE (VoLTE) This standardized system Low Low Low
allows for transferring
traffic for VoLTE.
Personal content locker Asynchronous storage High High Low
enables applications that
use compound files to
efficiently render their
content when accessed by
means of existing Internet
protocols, with a single
request to a server
triggering the download of
nested objects contained
within a webpage,
eliminating the need to
separately request each
object.
Table 5. Sample advanced applications
Apps Definitions Download Upload Latency
Telemedicine Telemedicine is the use of Medium Medium Low
medical information
exchanged from one site to
another through electronic
communications to improve
a patient’s clinical health
status and includes using
two-way video, email,
smartphones, wireless
tools, and other forms of
telecommunications
technology.
HD video conferencing Two-way interactive HD High High Low
video communication is
delivered using Internet
technologies that allow
people at different
locations to come together
for a meeting.
Ultra HD video streaming This app delivers Ultra HD High High Low
video without the need to
download files of different
video formats using
computer servers
connected to the Internet to
access information.
© 2018 Cisco and/or its affiliates. All rights reserved. This document is Cisco Public Information. Page 32 of 46You can also read