Wellington Public Transport Spine Study - RAILWAY STATION TO HOSPITAL Engagement Report - Greater Wellington Regional Council
←
→
Page content transcription
If your browser does not render page correctly, please read the page content below

Wellington Public Transport Spine Study
                   Engagement Report
                   19 February 2012

Wellington Public
Transport Spine Study
RAILWAY STATION TO HOSPITAL
Engagement Report
Wellington Public Transport Spine Study
                                                       Engagement Report

Engagement Report

Prepared for
Greater Wellington Regional Council

Prepared by
AECOM New Zealand Limited
Level 10, 135 Victoria Street, Te Aro, Wellington 6011, PO Box 27277, Wellington 6141, New Zealand
T +64 4 382 2999 F +64 4 382 2998 www.aecom.com

19 February 2012

AECOM in Australia and New Zealand is certified to the latest version of ISO9001 and ISO14001.

© AECOM New Zealand Limited (AECOM). All rights reserved.

AECOM has prepared this document for the sole use of the Client and for a specific purpose, each as expressly stated in the document. No other
party should rely on this document without the prior written consent of AECOM. AECOM undertakes no duty, nor accepts any responsibility, to any
third party who may rely upon or use this document. This document has been prepared based on the Client’s description of its requirements and
AECOM’s experience, having regard to assumptions that AECOM can reasonably be expected to make in accordance with sound professional
principles. AECOM may also have relied upon information provided by the Client and other third parties to prepare this document, some of which
may not have been verified. Subject to the above conditions, this document may be transmitted, reproduced or disseminated only in its entirety.

K:\WTTP\WTTP GWRC 001 Wellington PT Spine Study (60222076)\8. Issued Docs\8.1 Reports\Engagement Study\PT Spine
Study Engagement Report Final Milestone 2.docx
Revision - 19 February 2012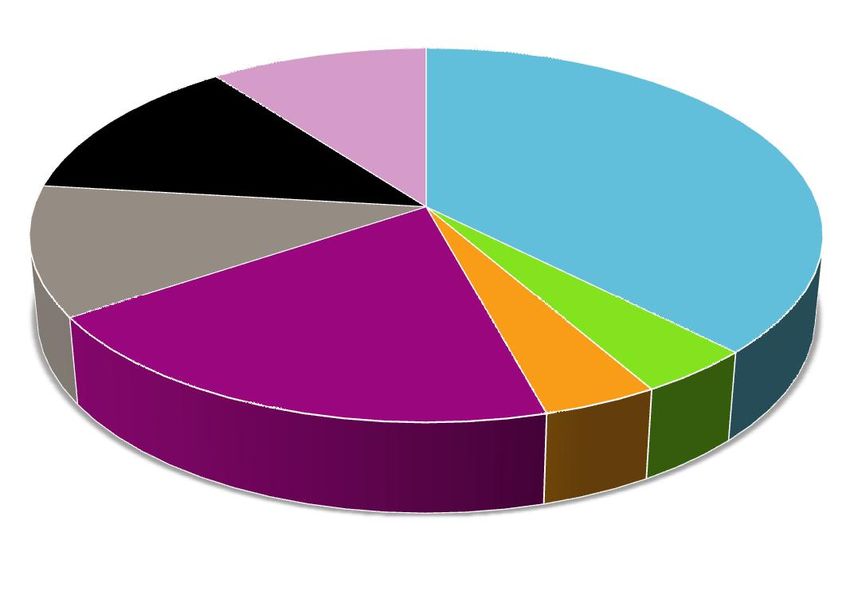
AECOM                                            Wellington Public Transport Spine Study
                                                 Engagement Report

Quality Information
Document           Engagement Report

                   K:\WTTP\WTTP GWRC 001 Wellington PT Spine Study
Ref                (60222076)\8. Issued Docs\8.1 Reports\Engagement Study\PT
                   Spine Study Engagement Report Final Milestone 2.docx

Date               19 February 2012

Prepared by        Andreee KaiFong

Reviewed by        Carol Greensmith, Rob Napier

Revision History

                                                                                             Authorised
               Revision
Revision                         Details
               Date                                                      Name/Position               Signature

Draft A        21-Dec-2011       Draft For client information            Rob Napier, Project
                                                                         Manager
Draft B        19 Feb 2012       Draft For client information            Rob Napier, Project
                                                                         Manager

K:\WTTP\WTTP GWRC 001 Wellington PT Spine Study (60222076)\8. Issued Docs\8.1 Reports\Engagement Study\PT Spine
Study Engagement Report Final Milestone 2.docx
Revision - 19 February 2012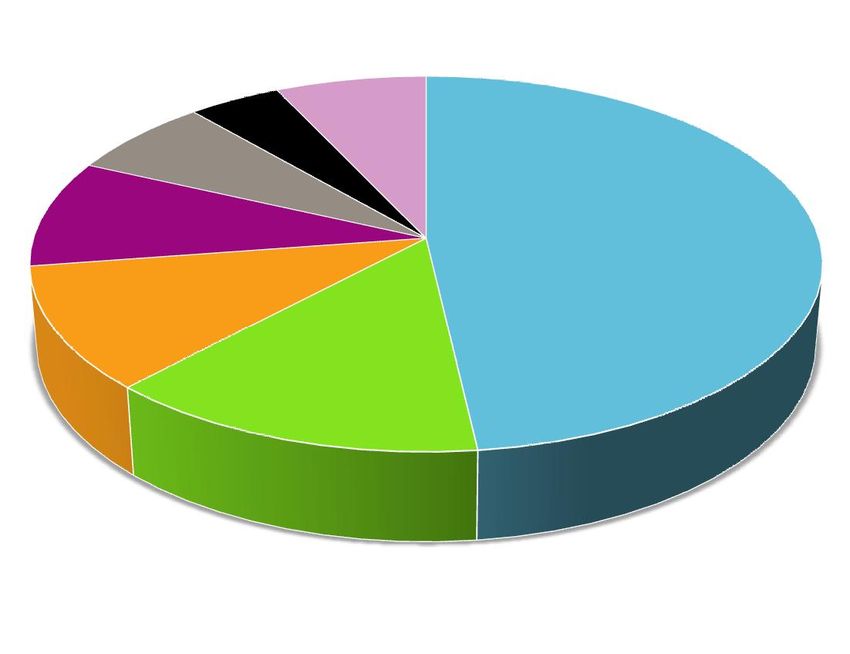
AECOM                                            Wellington Public Transport Spine Study
                                                 Engagement Report

Table of Contents
Executive Summary                                                                                                   i
1.0       Overview of Engagement                                                                                   1
          1.1      Appreciative Inquiries                                                                          1
          1.2      Focus Groups                                                                                    1
          1.3      Online Surveys                                                                                  1
          1.4      Market Research                                                                                 2
          1.5      Other Feedback                                                                                  2
2.0       Engagement Feedback                                                                                      3
          2.1      Appreciative Inquiries                                                                          3
                   2.1.1      Issues                                                                               3
                   2.1.2      Solutions                                                                            3
                   2.1.3      Key Elements of a High Quality System                                                4
                   2.1.4      Frequency                                                                            4
                   2.1.5      High quality PT Systems Elsewhere                                                    4
                   2.1.6      Other Comments                                                                       4
          2.2      Focus Groups                                                                                    4
                   2.2.1      Issues                                                                               4
                   2.2.2      Solutions                                                                            5
                   2.2.3      Key Elements of a High Quality System                                                5
                   2.2.4      Frequency                                                                            6
                   2.2.5      High Quality Systems Elsewhere                                                       6
                   2.2.6      Other Comments                                                                       6
          2.3      Online Survey                                                                                   6
                   2.3.1      Reason for Travel                                                                    6
                   2.3.2      Use of PT                                                                            7
                   2.3.3      Type of PT                                                                           8
                   2.3.4      Frequency of PT                                                                      8
                   2.3.5      Suggestions for Change                                                               9
                   2.3.6      Other PT experience                                                                 10
                   2.3.7      Walking distance to PT services                                                     11
                   2.3.8      Frequency of service                                                                11
                   2.3.9      Demographics                                                                        12
                   2.3.10     Summary                                                                             12
          2.4      Market Research Street Survey                                                                  13
                   2.4.1      Reason for Travel                                                                   13
                   2.4.2      Use of PT                                                                           14
                   2.4.3      Type of PT                                                                          14
                   2.4.4      Frequency of PT                                                                     15
                   2.4.5      Suggestions for Change                                                              15
                   2.4.6      Other PT Experiences                                                                16
                   2.4.7      Walking Distance                                                                    17
                   2.4.8      Frequency of Services                                                               18
                   2.4.9      Demographics                                                                        18
                   2.4.10     Summary                                                                             19
          2.5      Other Feedback                                                                                 19
                   2.5.1      PT Advocates                                                                        19
                   2.5.2      Public                                                                              19
                   2.5.3      NZ Police                                                                           20
                   2.5.4      Property Council New Zealand                                                        20
                   2.5.5      Automobile Association                                                              20
                   2.5.6      NZ Tramways and Public Passenger Transport Employees Union                          20

K:\WTTP\WTTP GWRC 001 Wellington PT Spine Study (60222076)\8. Issued Docs\8.1 Reports\Engagement Study\PT Spine
Study Engagement Report Final Milestone 2.docx
Revision - 19 February 2012
AECOM                                            Wellington Public Transport Spine Study
                                                 Engagement Report

Appendix A
          Online Survey and Market Research Questions                                                             A
Appendix B
         Appreciative Inquiry Agenda                                                                              B
Appendix C
         Focus Group Agenda                                                                                       C
Appendix D
         Residence/Origin of Travel Responses                                                                     D
Appendix E
         Other Feedback                                                                                           E
Appendix F
         Online Survey Other Responses                                                                            F
Appendix G
         Market Research Street Survey Other Responses                                                            G
Appendix H
         CUsers Tramways Union Desktop Spine Study                                                                H

K:\WTTP\WTTP GWRC 001 Wellington PT Spine Study (60222076)\8. Issued Docs\8.1 Reports\Engagement Study\PT Spine
Study Engagement Report Final Milestone 2.docx
Revision - 19 February 2012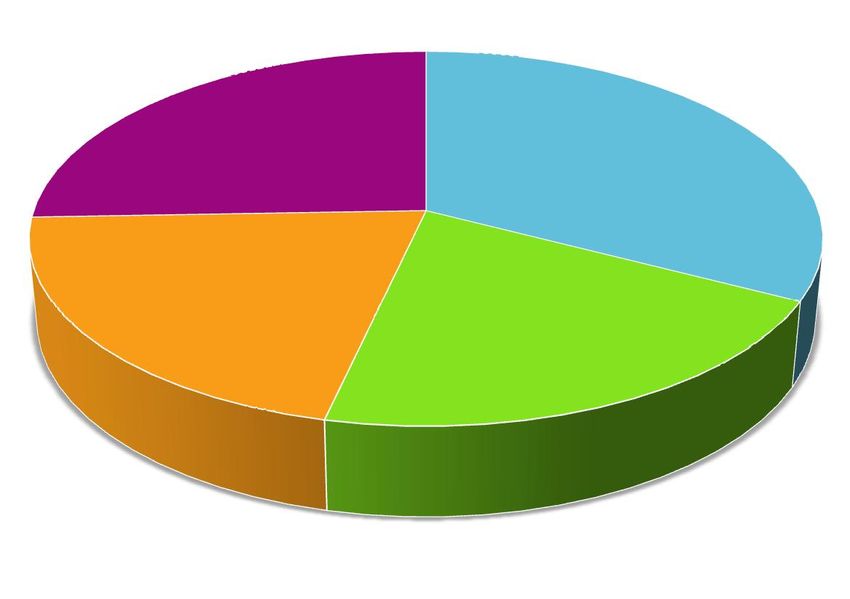
AECOM Wellington Public Transport Spine Study
Engagement Report
Executive Summary
The Greater Wellington Regional Council (GWRC) in partnership with the New Zealand Transport Agency (NZTA)
and Wellington City Council (WCC) contracted AECOM to investigate public transport (PT) options for the central
Wellington area.
The PT Spine Study will assess the feasibility and merits of a range of long-term options for providing a high
quality, high frequency public transport system between Wellington railway station and Wellington’s regional
hospital in Newtown.
It has arisen from a recommendation of the multi-modal Ngauranga to Airport Corridor Plan adopted by GWRC in
2008 and is taking place in the middle of consultation on other transport related improvements. (Refer to the
study’s Communications Strategy)
The study originally had two main phases of stakeholder engagement but this was varied to a study wide
approach over six milestones.
This report details the process and results from the first scoping phase of engagement in October and November,
2011. Other phases of engagement are planned as the study develops and will be focused on providing further
feedback to stakeholders about study progress, but also gaining their views on decision-making for important
deliverables and study milestones. It is scheduled for completion by December 2012 with a final report completed
by the end of February 2013.
The purpose of engagement was to test the understanding of the key factors that make public transport systems
of high quality. To get the widest understanding possible, the views of public transport operators, users and non
users of public transport, students, inner-city residents, public transport advocates, resident association
representatives, disability advocates and region-wide residents, among others, were canvassed.
Five different mechanisms were used to gather feedback in the scoping phase of the study. They were:
1) Appreciative inquiries,
2) Focus Groups,
3) Online surveys,
4) Market research street surveys, and
5) Letters seeking feedback from identified stakeholders.
Overall in excess of 1500 individuals, including eight appreciative inquiry meetings and four focus groups,
participated in the scoping phase of engagement.
Key findings were that high quality public transport was expected to be reliable, frequent, efficient and well priced.
People felt that public transport needed to become more attractive, mainly in terms of cost, but also in terms of
time, than driving a car into town, have integrated ticketing with simple fare structures and further subsidies for
students, along with an extension of the SuperGold card operating hours. Easier access to tickets was also
supported, potentially using the same approach as pay and display carparks. Access was important, specifically
for the elderly and disabled with their representatives, in particular, commenting that they simply wanted to be
able to do what others took for granted – being able to access and use public transport.
Other aspects included the need for timetables to be better coordinated between modes to provide a more
seamless network of public transport while drivers needed to be more polite, friendly, and courteous. There was
interest in separating public transport from private motor vehicles and potentially splitting PT services so express
vehicles went on another route to multi-stop vehicles. Some feedback even suggested prohibiting private motor
vehicles from the central city, making the inner city a PT, walking and cycling-friendly zone.
No particular mode was identified as the solution for a future high quality public transport system; rather a
combination of modes appeared logical by using the best of what was already available and adding in further
elements, ie light rail, monorail, pods, trams, trains or even underground systems such as subways or metros.
While the study area was identified as extending from the current railway station to the hospital in Newtown, many
people wanted to see the “spine” extend as far as Wellington airport.
K:\WTTP\WTTP GWRC 001 Wellington PT Spine Study (60222076)\8. Issued Docs\8.1 Reports\Engagement Study\PT Spine
Study Engagement Report Final Milestone 2.docx
Revision - 19 February 2012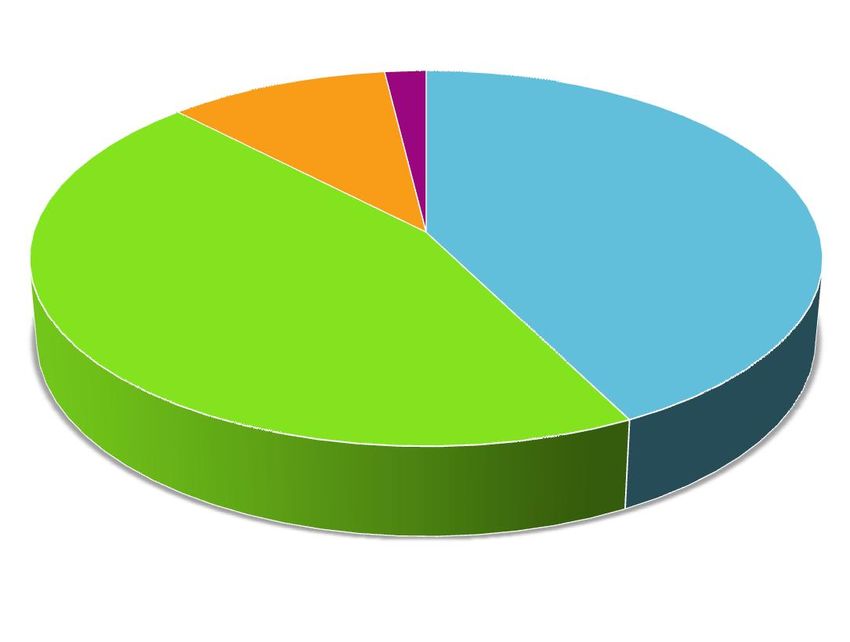
AECOM                                            Wellington Public Transport Spine Study
                                                 Engagement Report

People identified a range of locations from their overseas experience with quality PT systems. They were seen as
having reliable, efficient, frequent and integrated services. Australian systems identified were those in Sydney
and Melbourne, Asian systems supported were those in Hong Kong, Tokyo and Singapore, North America earned
praise for systems in San Francisco and New York and European systems identified included those in London,
Amsterdam, Berlin and Paris.
While there were many suggestions of what could be done to improve the city’s public transport system, there
were those who felt it was doing a pretty good job and was reasonably satisfactory. As long as it was reliable and
reasonably priced, they were happy with what was already available.

K:\WTTP\WTTP GWRC 001 Wellington PT Spine Study (60222076)\8. Issued Docs\8.1 Reports\Engagement Study\PT Spine
Study Engagement Report Final Milestone 2.docx
Revision - 19 February 2012
AECOM                                            Wellington Public Transport Spine Study                          1
                                                 Engagement Report

1.0           Overview of Engagement
Targeted stakeholder engagement was undertaken in October and November 2011 by AECOM to test the
understanding of the key factors that make public transport systems of high quality. This engagement included
formal and informal feedback using an appreciative inquiry process of one on one meetings, invitations to
participate in a focus group with relevant/specialist groups and in the online survey and an invitation to provide
feedback on the study in general. Market research was also carried out by AECOM through a survey of members
of the public. The survey, held over two weeks at the end of October, aimed to get answers to a set of specifically
designed questions. The survey elicited information to inform the optioneering process along with technical data.
Primarily, the purpose of the market research was to gather an understanding of the key factors that the public
believe made up a high quality PT network. Some stakeholders took part in more than one form of engagement.
Themes and issues identified in each engagement area, including analysis of the online survey and market
research will be discussed in further depth in Section 2.

1.1           Appreciative Inquiries
In total, eight meetings were held with representatives from:
-     Greater Wellington Regional Council;
-     Wellington City Council;
-     KiwiRail;
-     Ngati Toa;
-     Wellington Cable Car Company;
-     NZ Bus;
-     Bus and Coach Association; and
-     Taxi Federation.

1.2           Focus Groups
Four focus groups were held with varying attendance.
-     PT Advocates - 11 people;
-     Ethnic/Residents Association, six people;
-     Disability, four people; and
-     Education, three people.

Unfortunately none of the ethnic representatives were able to attend the focus groups. However, we were able to
hold a brief session with eight ethnic representatives preparing for a Pacific Island Forum. The discussion among
the disability and education groups centred on accessibility, information, environmental concerns and student
fares.

1.3           Online Surveys
The online survey, held for one month from October 18, was aimed at capturing public responses to specific
questions and complemented market research. Using GWRC’s website, an online form/survey, consistent with
the direct public surveying along the spine study, was made available. This was proactively publicised in the
media by GWRC via media releases inviting Wellingtonians to participate. The market research team also
promoted the online survey.
In total, 882 surveys were completed online.

K:\WTTP\WTTP GWRC 001 Wellington PT Spine Study (60222076)\8. Issued Docs\8.1 Reports\Engagement Study\PT Spine
Study Engagement Report Final Milestone 2.docx
Revision - 19 February 2012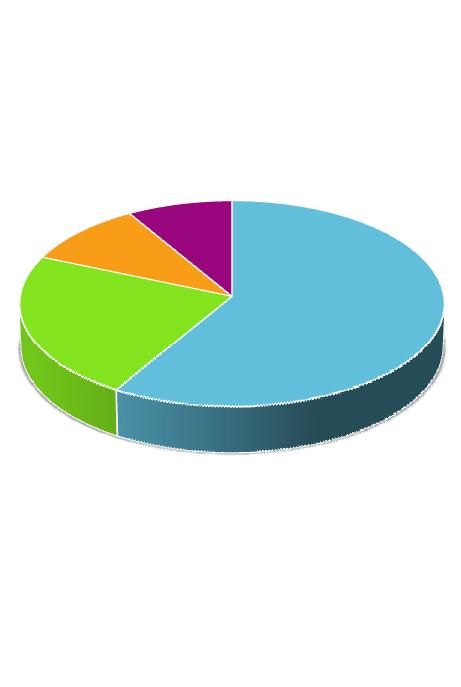
AECOM                                            Wellington Public Transport Spine Study                           2
                                                 Engagement Report

1.4           Market Research
This market research was carried out by a contracted group which was given set parameters of how many people
they needed to aim to survey, what time of day and days of the week to get the greatest snapshot of the travelling
public. They surveyed people at peak commuter travelling hours (morning and evening), others during the
interpeak and on weekends to get the feedback of different groups such as regular commuters, businesspeople,
general shoppers, people out for recreational activities (walking or sightseeing) and students.
Researchers worked in pairs to give a more visible appearance and sense of authenticity, as well as a safety
precaution due to the times of day and the locations they were working in.
It must be noted that the timing of the research was during the Rugby World Cup tournament therefore the views
of both domestic and international visitor may have been captured. International visitors have not been excluded
from the market research as it could help to determine a wider understanding of what high quality PT means to
people.
The surveys were carried out at these locations:
-     Victoria Street (in the vicinity of a carpark building);
-     Kent/Cambridge Terrace;
-     Kilbirnie Shops;
-     Featherston Street;
-     Te Papa;
-     Boulcott Street (near a carpark building);
-     Railway Station;
-     Railway Station carpark vicinity;
-     Lambton Quay;
-     Hataitai Shops;
-     Willis Street;
-     Waterfront (near a carpark i.e., near Bluebridge Ferry);
-     Newtown shops;
-     Cuba Mall;
-     Oriental Bay; and
-     Wellington Hospital (during outpatient clinic).

In total 733 on street surveys were completed.

1.5           Other Feedback
Further feedback was received via email from Peter Skyzinky representing Community and Sustainable
Transport, Brent Efford representing TransAction, Maria van der Meel from The City is Ours, the NZ Police, the
Property Council, the Automobile Association, the Tramways and Public Passenger Transport Employees Union
and a member of the public.

K:\WTTP\WTTP GWRC 001 Wellington PT Spine Study (60222076)\8. Issued Docs\8.1 Reports\Engagement Study\PT Spine
Study Engagement Report Final Milestone 2.docx
Revision - 19 February 2012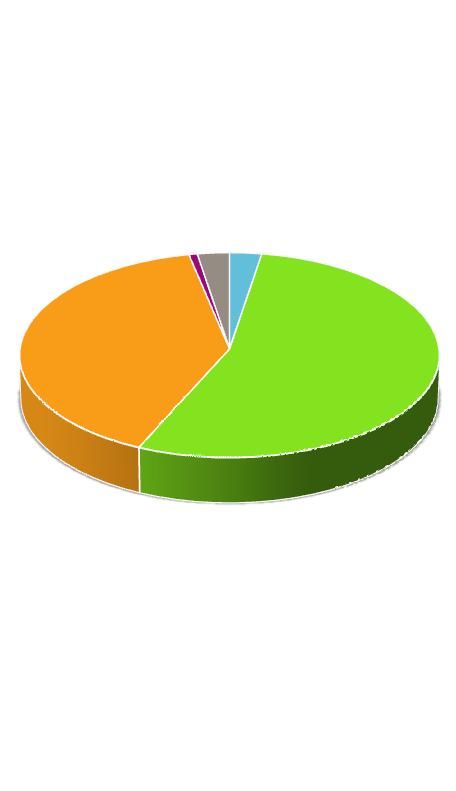
AECOM                                            Wellington Public Transport Spine Study                               3
                                                 Engagement Report

2.0           Engagement Feedback
2.1           Appreciative Inquiries
2.1.1         Issues
Key issues identified were the need to fulfil the Ngauranga to Airport plan, improving the efficiency and speed of
the bus service, improving reliability, frequency and the reach of PT in the city. Ticketing was also seen as an
issue to be addressed to make it simpler and more user-friendly with integrated ticketing. Congestion and
blockages along the network needed to be addressed, including at the Basin Reserve, Adelaide Road and Mt
Victoria Tunnel. Congestion was considered more of an issue in the afternoon as it has a longer peak (3-6pm).
Participants felt there was a lack of clarity about what would happen with the trolley bus service. On the one hand
they were seen as inflexible and problematic and on the other they were identified as providing choice and not
reliant on fossil fuels. A decision was needed to provide certainty to both users and operators.
Concerns were expressed about how parking encroaches on public transport services by either taking space that
could be used to create bus lanes or by encouraging private motor vehicle use in the city centre, thereby making
public transport less attractive.
There was support for using alternative power sources i.e., electricity or other environmentally friendly modes of
power for transport.
There was a call for clarity on the level of investment that will be needed and how much of a priority PT will be to
Wellington. A long-term view was definitely required, backed up by solid support and action.
2.1.2         Solutions
People were generally open to the form of the final solution, but there was a strong wish to see a level of choice or
alternatives available such as a mixture of rail, light rail. It was noted that taxis need to be included in the mix
because they play a part in a PT network – they provide services for people who need point to point journeys,
have disabilities or cannot access public transport for other reasons (not available, not where they live, timing
doesn’t suit, not efficient enough). A future high quality public transport system would not necessarily be met by
simply having more buses or more bus stops. Instead the best solution would depend on finding the right balance
between the number of buses, the location and number of stops to ensure quality of service.
There was strong support for bus priority and/or bus lanes to improve the speed and efficiency of journeys.
Design improvements to the network were also suggested to improve the manoeuvring of vehicles (larger buses
in particular) with the removal of on-street parking spaces if required.
Integrated ticketing was seen as inevitable in order to provide better connections between modes.
It was felt that PT was a vital element in making Wellington a liveable and connected city. People wanted to make
Wellington more pedestrian friendly with PT being predominant and cars skirting the CBD. To achieve this, they
believed the service needed to be frequent, flexible, reliable and well priced so it was a good and easy option to
choose.
Seamless transition between modes and better connectivity of different services was proposed along with a
simple, easy to follow network that did not require a lot of thought or poring over timetables.
Pricing needed to make PT attractive and competitive with bringing private vehicles into town.
Clear decisions about the future of the trolley bus system needed to be made. Improvements could be made to
the infrastructure for trolley buses to run better but the uncertain future and investing in only a 5-10 year period
was not appealing because it did not provide enough time to recoup the investment.
Land use changes that supported further public transport improvements and provided room for growth in the
network/system needed to be considered. There was a need to future proof the city and provide scope for the
future, although it was difficult to understand needs beyond 30-40 years.
More real-time information was supported because it helped address/set expectations about the services it
depicted. It also assisted people with disabilities.
It was felt there needed to be openness about financial constraints, the BCR and economics of future investment
so people could understand the implications of different choices and therefore inform decision making.

K:\WTTP\WTTP GWRC 001 Wellington PT Spine Study (60222076)\8. Issued Docs\8.1 Reports\Engagement Study\PT Spine
Study Engagement Report Final Milestone 2.docx
Revision - 19 February 2012
AECOM Wellington Public Transport Spine Study 4
Engagement Report
2.1.3 Key Elements of a High Quality System
The main element for a high quality system was reliability. Without it, stakeholders believed the system would not
be able to generate use or support. The other key elements were frequency, modern/spacious vehicles, polite
and friendly drivers/staff, cleanliness, comfort, adequate space for people and goods (i.e., shopping/groceries),
efficiency, dedicated/unrestricted passage of service, good information, accessible (goes to the right areas and
allows for everyone to be able to get on/off without difficulty, particularly the elderly and those with disabilities),
reasonably priced and simple ticketing. Overall people felt if the system was easy to use, arrived when it was
supposed to and took people where they needed to be it would meet the high quality test.
2.1.4 Frequency
The desired frequency during the 7am-7pm period was five minutes and 10 minutes at other times. It was
important, therefore to consider at what frequency optimum patronage was achieved and how that fitted with what
the overall network/system was expected to achieve. An easy to understand timetable or frequency where people
didn’t need a timetable to know when the next service would be arriving was preferable. Real-time information
was welcomed and should be extended to other parts of the network.
2.1.5 High quality PT Systems Elsewhere
When asked what PT system was the best in their experience there was a variety of locations cited. They
included Geneva, Paris, Leningrad, Berlin, New York, London, Portland (Oregon, US), Germany, Switzerland,
Zurich and Australia. The consistent comments that related to each of these places was that the transport was
relatively easy to use, was reliable and the centres provided for high patronage numbers and less reliance on
private vehicles. Many provided more than one choice and some of them integrated active modes like walking
and cycling well into the system, which would suit the approach wanted for Wellington. Comments also indicated
the ticketing systems were better as many were cashless. This would address safety concerns for drivers on
night services and could improve the efficiency of a service if drivers do not need to spend time taking fares. The
Snapper card system was considered to be good, but an integrated ticketing system across all modes was
preferred.
2.1.6 Other Comments
Some concern was raised that the debate about future public transport improvements would be limited to
discussions about light rail or an argument about trolley buses being sacred and needing to be retained.
People believed decisions needed to be based on the best modelling and technical information in order to be
robust enough for intense scrutiny. Some commented that they wanted to see a future system be able to pay for
itself within 10 years. Others mused about whether the cost of a system should be the primary driver when
making a decision. They suggested that perhaps a different mindset was required to build a network that could
generate patronage. This would then need to work in tandem with disincentives to using a private vehicle like
removing carparks in the city, limiting private motor vehicle access to the city fringes with a city bypass or
congestion charges and tolls. People acknowledged that this would be a more difficult approach to take, but felt it
could take the city to where it wanted to be in the long-term, achieving both behaviour change and modal shift.
It was understood that the study was asking for a level of crystal ball gazing to consider what life would be like in
20 years or more. Many commented that there could be issues about energy, oil shortages, climate change and
an uncertain economic state. What was clear was that all wanted PT to continue to be a key element of
Wellington’s urban form and infrastructure. The end goal was to have a dynamic central city that is connected
and people centred.
2.2 Focus Groups
2.2.1 Issues
Key issues consistently noted across the four focus groups was the need for reliability, access (in terms of the
reach of a service and also the ability for people to get on/off the service, particularly the elderly and people with
disabilities), convenience, reasonable price, frequency during the day/night/weekends, polite/friendly drivers, more
information (more real-time information, easier to understand network), larger shelters that provided more cover
from poor weather, seamless transitions between services (i.e., bus, rail, cable car), integrated ticketing and an
efficient service. The attitude and behaviour of drivers was commented on. Many drivers were described as rude,
didn’t consider the needs of the disabled (often people had to ask the driver to kneel a bus so they could enter or
K:\WTTP\WTTP GWRC 001 Wellington PT Spine Study (60222076)\8. Issued Docs\8.1 Reports\Engagement Study\PT Spine
Study Engagement Report Final Milestone 2.docx
Revision - 19 February 2012AECOM Wellington Public Transport Spine Study 5
Engagement Report
exit the service) and lurched from bus stops resulting in passengers (particularly the elderly) falling in the aisles
before they were seated.
2.2.2 Solutions
The need for more bus lanes or a dedicated space came across strongly. Each service needed to be one that
people could easily get on/off (particularly for the elderly) with more courteous and friendly drivers.
Parking should be limited or the city bypassed for private vehicles allowing areas like Lambton Quay to be PT,
cycle and walker friendly. Removing parking from roadsides was one suggestion while another was restricting
parking to the city fringes with cycle, walk or PT options from there.
It was felt timetables needed to be better coordinated to improve the transition between services and avoid the
clumping effect of many buses at one time followed by times with no or limited services running through the city.
A public transport loop was suggested along with an express route between the station and hospital. Others felt
the spine needed to extend beyond the hospital to the airport.
An extension of the current bus system, trams, monorail, light rail, heavy rail extended from the station and even
moving walkways were suggested as were subways. A mix providing choice was suggested.
Participants said the network needed to be easy to understand with stops well spaced and provide for hop on/hop
off services. This would be well supported by integrated ticketing and/or ticketing available at stops similar to pay
and display carpark stands, to make boarding more efficient. Ticketing should not be based on length of travel
but on duration (i.e., for a day, week, month). They believed the current ticketing system penalised people who
used more than one mode or travelled more than twice a day. It was felt that frequent users should be
encouraged and discounts provided. Similar discounts were needed for students. Costs in general needed to be
kept competitive so they were more attractive than using a private vehicle.
To assist people with disabilities, more audio announcements (both at stops and on vehicles) would be useful,
better designed vehicles and stops would be helpful. Currently, many stops had rubbish bins and lampposts
which impeded access.
2.2.3 Key Elements of a High Quality System
The main key elements of a high quality system were:
- reliability;
- frequency;
- efficiency;
- well priced;
- good connections between modes;
- a seamless network;
- integrated with cyclists and pedestrian requirements;
- integrated ticketing;
- accessible vehicles;
- good information;
- clear routes (the current route “meanders” through town);
- easily understandable timetabling;
- comfortable and clean vehicles; and
- having bigger sized seats.
It was also mentioned that the system needed to run at all times to cater to different requirements (i.e., people out
socialising, shift workers) and provide service in areas that are growing. Ideally it should be on a dedicated route.
K:\WTTP\WTTP GWRC 001 Wellington PT Spine Study (60222076)\8. Issued Docs\8.1 Reports\Engagement Study\PT Spine
Study Engagement Report Final Milestone 2.docx
Revision - 19 February 2012AECOM Wellington Public Transport Spine Study 6
Engagement Report
Mode was not critical. It could be either better buses, trams, light rail or monorail as long as it was reliable,
efficient and provided access for all (particularly the elderly and disabled) and linked well with other modes.
Choice and alternatives were important.
2.2.4 Frequency
A minimum of 10 minutes per service was noted as the best frequency, particularly for weekdays in the peak. At
other times it was suggested it should be regular enough that a timetable wasn’t required. This could be every
15minutes, half hour or hourly.
2.2.5 High Quality Systems Elsewhere
The best PT system people had used included the Barcelona metro system, Frankfurt, Sydney light rail, streetcars
in Portland, Oregon, Melbourne trains, Zurich, Amsterdam, Melbourne’s trams, Vancouver’s buses, subway or
skytrain, Washington DC, Toronto’s underground metro, Singapore’s metro, Adelaide’s buses and Kiev’s
underground.
The consistent reasons people liked these systems were because they were integrated, provided good
connection, many had dedicated spaces/lanes (i.e., light rail, tram, metro), easily accessible (could wheel on and
on or stations had good lifts/escalators), good city perimeter parking so PT was used in the city itself), vehicles
with fewer than three people were not allowed into the CBD before 9.30am (Washington), made it easy to find
your way around, swift and ran on time.
One person even commented that one overseas location took the attitude that if they built a system/network that
people would come to use it. It had resulted in high patronage. It was felt that Wellington took an approach of
waiting for the demand to be present, which meant the city was always playing catch-up.
2.2.6 Other Comments
Disability representatives stressed the point that they were looking to get what other people took for granted – the
ability to use and access the service. The system also needed to be based on the purpose of the route and the
demographics of the population who use it (i.e., elderly, disabled, children, travellers, grocery shoppers).
Driver behaviour needed to change as well. Participants’ felt that drivers needed to move away from an approach
of “meeting time” to one of courtesy and customer service. Better scheduling could potentially assist with this.
Transport was seen as a means to make the city a more liveable place. It was part of a network with high quality
stops and covered seating while people wait for a service.
People wanted the future service be reliable, frequent, continuous, address the behaviour of the operators,
provide integrated ticketing, and make Wellington’s PT system into one that people wanted to use.
2.3 Online Survey
In total, 12 questions were posed in the online survey, hosted on Greater Wellington Regional Council’s website
for the period of one month. It generated 882 responses. While 882 answered the questions they were entitled to
select more than one reason for their travel into or through the CBD. This means the percentages in some
questions should be seen as ranked preferences rather than a percentage of responses from the total number of
people who participated in the survey.
The following information summarises the responses to survey questions. The questions can be found as
Appendix A.
2.3.1 Reason for Travel
The predominant reason people travelled into or through the CBD was for work. Seven hundred and sixty-two
respondents or 86.4% travelled into or through the central city for this purpose. A total of 402 responses, or
45.6%, indicated they travelled into town for shopping. Recreation and sport generated 261 responses or 29.6%.
K:\WTTP\WTTP GWRC 001 Wellington PT Spine Study (60222076)\8. Issued Docs\8.1 Reports\Engagement Study\PT Spine
Study Engagement Report Final Milestone 2.docx
Revision - 19 February 2012AECOM Wellington Public Transport Spine Study 7
Engagement Report
Reasons for travelling into or through
the central city
Work 86.4%
Education 9.4%
Other 9.4%
Shopping 45.6%
Visiting family/friends 25.9%
Recreation/sport 29.6%
Appointments 23.6%
Of the other reasons people travelled into Wellington the predominant themes were for entertainment, eating out,
meeting friends, travelling home, shopping, going to the airport or beach or travelling through to other destinations
in the city or region. A full list of “other” reasons for travel can be found in Appendix F.
The usual destination of respondents varied but included a range of residence addresses, streets in the central
city and Wellington city suburbs. In particular 130 listed Lambton Quay as their main destination, 95 listed Willis
Street, 79 listed Cuba Mall/Street, 56 listed Manners Street/Mall, 55 Victoria St and 50 noted Courtenay Place.
Some noted more than one main destination, depending on the purpose of their travel (i.e., for work, shopping,
visiting).
A full list of these destinations is available in Appendix F.
2.3.2 Use of PT
The majority of respondents have used public transport to travel into or through the CBD), with 818 of the 882
who participated in the survey using some form of public transport. There were only 64 who did not use PT.
Use of PT
No 7.3%
Yes 92.7%
0 100 200 300 400 500 600 700 800 900
K:\WTTP\WTTP GWRC 001 Wellington PT Spine Study (60222076)\8. Issued Docs\8.1 Reports\Engagement Study\PT Spine
Study Engagement Report Final Milestone 2.docx
Revision - 19 February 2012AECOM Wellington Public Transport Spine Study 8
Engagement Report
2.3.3 Type of PT
When considering those who do use PT the majority used the bus as their main type of public transport.
Type of PT used
Ferry 0.4%
Bus 75.9%
Train 23.7%
0 100 200 300 400 500 600 700
Frequency of PT use
5-7 days a week 36.1%
3-4 days a week 19.1%
1-2 days a week 19.7%
less often 25.1%
2.3.4 Frequency of PT
For those who use PT for their transport the majority used it 5-7 days a week, with more who used it infrequently
than those who used it 1-2 days a week.
The main reasons that people use public transport was because of the cost or lack of available parking, it was
cheaper than driving and parking in town, more environmentally friendly and more convenient. PT also allow
people to do other things such as read, talk to friends, make phone calls, crochet or enjoy the sights of the city.
K:\WTTP\WTTP GWRC 001 Wellington PT Spine Study (60222076)\8. Issued Docs\8.1 Reports\Engagement Study\PT Spine
Study Engagement Report Final Milestone 2.docx
Revision - 19 February 2012AECOM Wellington Public Transport Spine Study 9
Engagement Report
The reasons people didn’t use public transport was because they preferred to, or found it easier to walk, public
transport was too slow, too unreliable, wasn’t convenient enough, the price was prohibitive or because it was
simply not suitable or not available, particularly in the evenings or weekends. Some preferred to cycle or ride a
scooter.
People indicated they would be encouraged to use PT if the fares were cheaper, there were better pricing options
or free and if the service were more reliable, faster and more frequent. People were eager for integrated ticketing,
more bus priority or bus lanes through the city to improve journey time , a tram/train/light rail travelling through
the city, more/better bus stops/shelters, improved signage and real time information, more connectivity between
train and bus services, bike racks on buses, more night services, a travel card that could be topped up online, if
the route system was clearer or services easier to understand, more routes and more services and if staff were
nicer/friendlier.
A full breakdown of the answers to the above questions is available in Appendix F.
2.3.5 Suggestions for Change
What people most wanted to change about public transport now was the reliability of services. The frequency of
services and faster journeys were also considered important.
Main thing to change now
More direct routes 4.1%
Sheltered/comfortable waiting areas 4.8%
Less crowding on vehicles 6.3%
Other 20.7%
Comfortable/modern vehicles 3.9%
Faster journeys 12.5%
Connections between services 6.2%
Frequency of services 19.7%
Reliability of services 21.8%
0 50 100 150 200 250
Issues that fell into the “other” category mainly mirrored what would encourage people to use public transport
more often. This included cheaper fares, student fares, more real time information, top up cards online or on a
bus, more space for groceries/prams/bikes, bike rack, bus lanes, a city loop, night services or shift workers, later
evening/weekend services, integrated ticketing, integrated timetables (train and bus), better drivers (attitude,
driving), better communications, better shelters, better infrastructure, better signage/maps/routes and free WiFi on
PT.
A full breakdown of the other reasons is included in Appendix F.
Frequency of service topped the list of other things that people particularly wanted to change. Reliability of service
and sheltered/comfortable waiting areas also scored highly.
K:\WTTP\WTTP GWRC 001 Wellington PT Spine Study (60222076)\8. Issued Docs\8.1 Reports\Engagement Study\PT Spine
Study Engagement Report Final Milestone 2.docx
Revision - 19 February 2012AECOM Wellington Public Transport Spine Study 10
Engagement Report
Other things to change
Less crowding on vehicles 27.1%
Sheltered/comfortable waiting areas 32%
Other 22.7%
More direct routes 21.8%
Comfortable/modern vehicles 22.7%
Faster journeys 26.3%
Connections between services 41.3%
Frequency of services 41.3%
Reliability of services 40.6%
0 50 100 150 200 250 300 350 400
The other things people would like to change mirrored those already indicated. A full list is included in Appendix
F.
2.3.6 Other PT experience
There was a long list of public transport services/systems that people indicated they had used either in New
Zealand or overseas that they liked the best. In New Zealand the three main centres of Auckland, Wellington and
Christchurch rated highly while in Australia the services in Melbourne, Sydney, Perth, Adelaide, Canberra and
Brisbane were selected.
Beyond Australasia, the services in Asia that were noted were Hong Kong, India, China (Shanghai), Japan
(Tokyo), Singapore, Bangkok and Abu Dhabi. The systems in Europe, specifically those in London, Germany
(Berlin), Zurich, Switzerland, Vienna, Brussels, Copenhagen, Amsterdam, Denmark, France (Paris most notably),
Buenos Aires, Barcelona, Italy and other centres were also singled out.
In North America the systems in Austin (Texas), Boston, New York, San Francisco, Toronto and Vancouver were
identified.
The consistent reasons for people singling out these local and overseas examples were their ease of use,
frequency, reliability, pleasant vehicle, type of vehicle (tram, train or bus), ticketing, efficiency, speed, price and
ease of navigation around the network. Underground systems or rail-based systems were also notable.
A full list of the overseas or domestic experience and reasons they were noted is included in Appendix F.
When asked what two things people most wanted to see happen for the future of public transport in Wellington ,
the major response was for the inclusion of a light rail system either through the CBD or beyond to the airport. As
well as light rail, other similar forms of transport were also suggested such as trams, extending the current rail
network through the city, subways, monorails and driverless ULTra prt systems (the pods introduced at Heathrow
airport). There was a strong interest in separating pedestrians from vehicular traffic (whether buses, motor
vehicles or other forms of travel) for safety, bus lanes or bus priority, cycle lanes/bike racks or more bicycle
friendly integration in the city, a more reliable PT system, cheaper fares, city bypassing of PT, environmentally
friendly/sustainable PT that avoids the reliance on diesel vehicles, integrated ticketing and regular services that
are easy to remember (i.e., services that are every 15 minutes without needing a timetable). A full list of the
preferences is included in Appendix F.
K:\WTTP\WTTP GWRC 001 Wellington PT Spine Study (60222076)\8. Issued Docs\8.1 Reports\Engagement Study\PT Spine
Study Engagement Report Final Milestone 2.docx
Revision - 19 February 2012AECOM Wellington Public Transport Spine Study 11
Engagement Report
2.3.7 Walking distance to PT services
When asked how far they would be prepared to walk to a service/stop within the Wellington CBD/central area for
a future high quality public transport system, people indicated a preference for either less than five minutes or five
to 10 minutes with stops relatively evenly spaced. The majority indicated they would be happy to walk between 5
10 minutes.
How far would you walk to a stop?
Less than 5 minutes 42.5%
5-10 minutes 45.2%
10-15 minutes 10.3%
More than 15 minutes 1.9%
2.3.8 Frequency of service
When considering a future high quality public transport system the majority (475) felt that services should be
every five minutes within the CBD/central area at peak times. The next favoured frequency was 10 minutes (220).
Outside the peak, the majority showed a preference for a 15 minute frequency (425) followed by every 10 minutes
(331).
Frequency of service
At least every 15 minutes
At least every 10 minutes
Other times
Peak period
At least every 5 minutes
At least every 2 minutes
0 100 200 300 400 500
K:\WTTP\WTTP GWRC 001 Wellington PT Spine Study (60222076)\8. Issued Docs\8.1 Reports\Engagement Study\PT Spine
Study Engagement Report Final Milestone 2.docx
Revision - 19 February 2012AECOM Wellington Public Transport Spine Study 12
Engagement Report
2.3.9 Demographics
The demographics of those surveyed show the respondents were mainly 20-39 (477), followed by the 40-64 age
bracket (353). There was a relatively even distribution of male to female responses with only 14 preferring not to
answer.
Age Gender
0-19 2.6%
20-39 54.1% Male 48.6%
40-64 40% Female
49.8%
Prefer not to Prefer not to
answer 0.7% answer 1.6%
Over 65
2.6%
The people who completed the online survey were from a variety of locations; many were from Wellington central
and regional suburbs, but responses were also generated from an overseas visitor from England and three from
Christchurch, Nelson and Auckland who were frequent visitors. Twenty-three residents from the Wairarapa,
including those living in Featherston, Greytown, Carterton, Martinborough and Masterton shared their views
Ninety-nine Lower Hutt residents shared their views, the largest number of people to complete the survey from
beyond the Wellington Council boundary. Twelve came from Upper Hutt, 21 from the Kapiti Coast and 26 from
Porirua. The remainder were all from Wellington suburbs ranging as far north as Tawa or Kaiwharawhara, south
to Miramar and Seatoun and all the suburbs in between.
The alphabetical list of suburbs/locales noted by the 827 who answered the question are in Appendix D.
People had a wide range of responses to the final question asking them if they had any further feedback. There
was repetition of earlier themes, such as bike racks, inclusion or exclusion of light rail, improving the transport
system overall, better pricing and student fares. A full list of this feedback is included in Appendix F.
2.3.10 Summary
In general, the feedback demonstrates that people felt a high quality public transport system should be reliable,
frequent, efficient, environmentally friendly/sustainable, include light rail/trams/trains/pods/monorail or buses, be
separated from pedestrians and other vehicle traffic, either be free or be at a cost that makes it more attractive
than taking a car and parking in town, has better provision for pedestrians/cyclists and includes bicycle parking or
bike racks. Ticketing should be integrated across all modes and services and easily topped up, potentially online.
There is a wish to have larger shelters that shielded people from poor weather better, more modern vehicles and
drivers who are more courteous and friendly so that safety was improved. International and domestic experiences
supported this with a number of people indicating Wellington Auckland and Christchurch had good systems while
systems in Australia (particularly Brisbane, Sydney and Melbourne), Asia, North America and Europe were worth
following (i.e., New York, San Francisco, Bangkok, Shanghai, Tokyo, London, Paris, Amsterdam and Germany).
K:\WTTP\WTTP GWRC 001 Wellington PT Spine Study (60222076)\8. Issued Docs\8.1 Reports\Engagement Study\PT Spine
Study Engagement Report Final Milestone 2.docx
Revision - 19 February 2012AECOM Wellington Public Transport Spine Study 13
Engagement Report
2.4 Market Research Street Survey
In total, 17 questions were posed in the street survey with the purpose of seeking feedback on what key elements
comprised a high quality public transport system. The survey was conducted over the period of a fortnight at a
variety of locations around Wellington’s CBD and other suburbs within the spine study area or close to it (i.e.,
Kilbirnie, Hataitai). There were 733 surveys completed to varying degrees. The bulk of questions were
answered, however, some questions were skipped. This is not uncommon, particularly when trying to catch
people as they are walking through the central city during peak, interpeak and weekend hours. Some areas were
more successful than others in terms of attracting survey participants, however, a good spread of locations and
respondents was achieved and trends/themes captured.
The following information summarises the responses to survey questions. The questions can be found as
Appendix A.
2.4.1 Reason for Travel
The main reason people travelled into or through the Wellington CBD was for work purposes. Of the 844
responses (respondents were able to select more than one reason for their travel) 412 travelled for work purposes
and 118 for education. The next most popular answers were for:
- Shopping (91);
- Visiting friends/family (79);
- Recreation/sport (58);
- Appointments (37); and
- Other (60).
Main reasons for travelling into or
through the central city
Work 48.8%
Education 13.9%
Shopping 10.7%
Visiting friends/family 9.4%
Recreation/sport 6.9%
Appointments 4.4%
Other 7.1%
Other reasons indicated were that they were heading home as they lived in the city, were going out to eat or for
entertainment, were out for a walk or going to the hospital.
The usual destinations noted when travelling into or through the central city included a variety of central city
streets, particularly Lambton Quay, Featherston Street, Willis Street, Cuba Mall, Courtenay Place, Pipitea
University Campus and The Terrace. Of the locations listed many are places of business, shopping precincts,
private residence areas, schools and recreation areas (like gyms). Many were less specific denoting that their
K:\WTTP\WTTP GWRC 001 Wellington PT Spine Study (60222076)\8. Issued Docs\8.1 Reports\Engagement Study\PT Spine
Study Engagement Report Final Milestone 2.docx
Revision - 19 February 2012AECOM Wellington Public Transport Spine Study 14
Engagement Report
usual destination was the city centre itself for a variety of reasons. A full list of the destinations is included in
Appendix G.
2.4.2 Use of PT
The majority of those surveyed indicated they used public transport to travel into or through the CBD with 526
using PT to a varying degree while 201 indicated they did not use PT. Six did not answer this question.
Use of PT
No 27.6%
Yes 72.4%
0 100 200 300 400 500 600
2.4.3 Type of PT
The bus was the main type of public transport that people used for their travel into or through the CBD. Of the
569 responses, 387 took the bus while 179 took the train and three took the ferry. Some indicated they used
more than one mode.
Type of PT used
Ferry 0.5%
Bus 68%
Train 31.5%
0 50 100 150 200 250 300 350 400 450
K:\WTTP\WTTP GWRC 001 Wellington PT Spine Study (60222076)\8. Issued Docs\8.1 Reports\Engagement Study\PT Spine
Study Engagement Report Final Milestone 2.docx
Revision - 19 February 2012AECOM Wellington Public Transport Spine Study 15
Engagement Report
2.4.4 Frequency of PT
Of those who use public transport for their travel more than a third used it 5-7 days a week and a quarter
infrequently.. Just over 20% used PT used it 3-4 days and a similar number used it 1-2 days a week.
Frequency of PT use
5-7 days a week 33%
3-4 days a week 21.2%
1-2 days a week 21.2%
Less often 25.9%
When asking the people why they used PT in the CBD they indicated it was convenient, cheaper than driving or
parking, used it when it rained, they didn’t have a car, they used it to get to work, they had a SuperGold card, they
were lazy or they were simply going out.
People indicated they didn’t use public transport because they lived in town and it was easier or closer to walk, PT
was expensive, they had a car or a scooter which was more convenient, they had a work car or carpark, they
prefer to walk or cycle or it didn’t suit their work/family circumstances.
The main suggestions offered that would encourage them to use PT more often included cheaper fares, better
connections, better and friendlier drivers, extended SuperGold card hours, if it were free, if they came into or went
out of town more, if they didn’t have a car/family/different job, if the weather was worse, if the service was more
reliable and if there were student fares. Others commented that they used it as often as they could.
A full list of the reasons people used, didn’t use or would be encouraged to use, PT is included in Appendix G.
2.4.5 Suggestions for Change
There was a range of suggestions about what people most wanted to change now about public transport. Out of
the 694 responses, 204 suggested other things, primarily relating to fares. Most wanted it to be cheaper and
include student fares. Other suggestions included friendlier or nicer bus drivers, more services going to more
destinations, later services and more real time information. Some indicated they were satisfied with the service as
it was. A full list of the other responses is included in Appendix G.
Of the remaining responses, reliability of services was most important followed by frequency of services. The
remaining items (connections between services, faster journeys, comfortable/modern vehicles, more direct routes,
less crowding, sheltered/comfortable waiting areas) had similar levels of support.
K:\WTTP\WTTP GWRC 001 Wellington PT Spine Study (60222076)\8. Issued Docs\8.1 Reports\Engagement Study\PT Spine
Study Engagement Report Final Milestone 2.docx
Revision - 19 February 2012AECOM Wellington Public Transport Spine Study 16
Engagement Report
Main thing to change now
Other 29.4%
Sheltered/comfortable waiting areas 2%
Less crowding on vehicles 4.2%
More direct routes 3.7%
Comfortable/modern vehicles 5%
Faster journeys 4%
Connections between services 4.9%
Frequency of services 18.9%
Reliability of services 27.8%
0 50 100 150 200 250
When asked what other things they would like to change (question 10) 105 people indicated the frequency of
services was most important. Less crowding on vehicles generated 54 responses. The remaining options were
all similarly selected with each chosen less than 50 times.
Other things to change
Other 17.7%
Sheltered/comfortable waiting areas 7.6%
Less crowding on vehicles 10.5%
More direct routes 7.6%
Comfortable/modern vehicles 7.4%
Faster journeys 9.1%
Connections between services 6.8%
Frequency of services 20.4%
Reliability of services 12.8%
0 20 40 60 80 100 120
2.4.6 Other PT Experiences
Domestic and overseas public transport experience generated 705 responses. When people were asked which
the best PT system they had used in New Zealand or abroad was and why, they demonstrated strong support for
Wellington’s public transport system. One hundred and thirty two respondents said they liked the capital’s system
because of its variety (trains, buses, ferry, cable car), said they were generally happy with it, it was relatively
efficient and easy to use with a lot of different routes, they liked the trains, they liked the Airport Flyer or because
they hadn’t used many or any other systems. Elsewhere in New Zealand there was support for Auckland’s PT
system (18 responses) because it had good coverage, had late services and the link bus. Palmerston North was
noted for its student discount and Christchurch was noted for its cheap fares, its city loop and bus services).
Other NZ centres identified were Hamilton, New Plymouth and Dunedin.
K:\WTTP\WTTP GWRC 001 Wellington PT Spine Study (60222076)\8. Issued Docs\8.1 Reports\Engagement Study\PT Spine
Study Engagement Report Final Milestone 2.docx
Revision - 19 February 2012AECOM Wellington Public Transport Spine Study 17
Engagement Report
Australia was strongly identified with 139 responses in favour of their systems. In particular, Sydney and
Melbourne were clear favourites with both earning 46 and 79 responses each. The reasons people approved of
these services were for efficiency, speed, coverage, price, reliability and variety of vehicles/routes available.
Melbourne’s trams were clear favourites with many because of their frequency, ease of use and consistent,
reliable nature.
In Asia, the systems in Singapore, Japan (Tokyo in particular) and Hong Kong were selected for their reliability,
speed, frequency and efficiency. Singapore was also noted for being clean. In North America the systems in San
Francisco and New York were identified because they were easy to use, efficient, reliable and, in the case of the
New York subway system, frequent and fast.
Europe was selected by a number of respondents for similar reasons to the other examples above – frequency,
reliability, efficiency and ease of use. In particular London’s tube system was identified for its ease of use and
frequency, as was Amsterdam’s system for its emphasis on cycling, Paris’ metro for its frequency and Berlin for its
reliability (on time every time was one comment).
Of all the domestic or overseas responses made, consistency, reliability, efficiency, frequency, speed, price and
ease of use were noted for the reason why people liked a particular system. Some demonstrated a wish for any
sort of subway/underground system, others for trains/trams.
When thinking about what two things they would most like to see for the future of Wellington’s CBD/central city
public transport system 657 shared their views. Key themes were more modern trains, modern and spacious
buses, free, cheaper and student fares, electric systems and environmentally friendly systems, faster and more
frequent services, integrated ticketing, removing cars from the CBD/Lambton Quay area, later/night services, light
rail/monorail/subway/trams (extending to the airport), accessibility improvements (particularly for the
disabled/elderly), more train and bus services, newer vehicles and polite/friendlier drivers.
A full list of the things people would like to see is included in Appendix G.
2.4.7 Walking Distance
There was a strong majority with a preference for only a 5-10 minute walk to a public transport service/stop. Of
the 691 responses, 285 selected 5-10 minutes as the amount of time they would be prepared to walk within the
Wellington CBD/central area and about 30% preferred less than five minutes walk. Those 10-15minutes or more
than 15 minutes were similar, 14-16%.
Distance to Service
Less than 5 minutes
5-10 minutes
10-15 minutes
More than 15 minutes
K:\WTTP\WTTP GWRC 001 Wellington PT Spine Study (60222076)\8. Issued Docs\8.1 Reports\Engagement Study\PT Spine
Study Engagement Report Final Milestone 2.docx
Revision - 19 February 2012AECOM Wellington Public Transport Spine Study 18
Engagement Report
2.4.8 Frequency of Services
Frequency at peak or other times also showed clear preferences. Of the 727 who responded, more than 40%
wanted services at least every 10 minutes with a further third preferring services every 5 minutes. Non peak the
clear preference was for services at least every 15 minutes. This was broken down further with 105 keen on
services every 30 minutes. The next favourite choice for service frequency was every 10 minutes, however, this
was well behind services at 15min intervals with 130 identifying this as an appropriate timeframe.
Frequency of service
At least every 15 minutes 42.3%
At least every 10 minutes 42.3% Other Times
Peak Times
At least every 5 minutes 33.2%
At least every 2 minutes 9.4%
0 100 200 300 400 500
2.4.9 Demographics
The demographics of respondents showed that of the 713 who provided their details, most were in the 20-39 or
40-64 age bracket. As for the online survey, the gender of respondents was evenly split. Of the 718 who
answered, 360 were male and 358 female.
Age Gender
0-19 4.9%
20-39 54.7%
Male
40-64 36.6% Female
Over 65
4.8%
The people who participated in the survey were from a variety of Wellington central and regional suburbs and
included people from Dunedin, Fielding, Gisborne and Auckland. The largest address/suburb group came from Te
K:\WTTP\WTTP GWRC 001 Wellington PT Spine Study (60222076)\8. Issued Docs\8.1 Reports\Engagement Study\PT Spine
Study Engagement Report Final Milestone 2.docx
Revision - 19 February 2012AECOM Wellington Public Transport Spine Study 19
Engagement Report
Aro/Aro Valley area with more than 90 taking part in the survey. Beyond the Wellington City Council boundary, the
largest group to take part in the survey came from the Lower Hutt area with 75 sharing their views. Twenty-nine
were from Porirua, 22 from Upper Hutt, 17 from the Kapiti Coast and five from the Wairarapa.
The alphabetical list of suburbs/locales noted by the 827 who answered question 18 is in Appendix D.
Other feedback of importance was provided by 251 people. The comments included consistent themes expressed
elsewhere across the surveys 16 other questions. In particular, people asked for accessibility improvements for the
elderly and disabled, better buses and drivers, integrated ticketing and cheaper fares, later buses, evening buses
and better weekend services, improved frequency, more child friendly services and more reliable.
A full list of the other feedback is included in Appendix G.
2.4.10 Summary
Overall, the comments from the market research demonstrate that high quality means a service that is frequent,
reliable, fast, provides good connection between modes, reasonably priced and offer integrated ticketing for ease of
use. Other services domestically or overseas that people found the best were in Sydney, Melbourne, Singapore,
London, Paris, Tokyo and Hong Kong. They were preferred for their efficiency, reliability, speed, cost, cleanliness,
frequency and because of mode. A future high quality system for the CBD would be only 5-10 minutes’ walk away
and would operate every 10 minutes during peak times and every 15-30 minutes at other times.
2.5 Other Feedback
2.5.1 PT Advocates
Peter Skyzinky from Community and Sustainable Transport and Brent Efford attended the PT Advocates focus
group, with their thoughts captured in this engagement method. However, Mr Skyzinky felt the focus group was too
intent on discussing current issues with the PT service rather than a future QTN link between the railway and
hospital. He concentrated his further feedback on this issue in particular. He felt there were some major obstacles
to establishing a QTN link and noted some points that may resolve these in his feedback. Mr Skyzinky wondered if
the location of PT services needed to change, but on reflection felt the best location was to keep PT running along
Lambton Quay because there wasn’t a better alternative. He felt electric articulated buses were best, the route
should be ring-fenced to a city service only and not share with other cross town buses, cars should be banned from
Lambton Quay and possibly the number of stops reduced. He wondered if the amount of traffic signals impeding
the flow of PT could be reduced on the Golden Mile and wanted to see ticketing improved.
Mr Efford commented that his group would like to see an expert panel established so there was continual
involvement in the study. They also sought early involvement in the study in order to explore key issues as Trans-
Action was considered by the group to be New Zealand’s centre of light rail expertise. He said Trans-Action
wanted to be sure that the right input was given at the right time to avoid a position going out for public
consultation later next year with little opportunity to change fundamentals.
2.5.2 Public
A member of the public, who wished to remain anonymous, suggested raising the train/tram lines so they run
around the outside of buildings as they do in Sydney and that such a system could be created to run all the way to
the airport.
Maria van der Meel from The City is Ours, who also attending a focus group session, suggested some reports that
would be useful to review, in particular, the Gehl report that Wellington City Council commissioned in 2004 and a
central city apartment dwellers survey of 2009. The Gehl report looked at how people use public spaces in the
central city, including the waterfront and assessed how people moved around the city considering how public
spaces could be used better. It had a number of recommendations, two of which related more specifically to this
study – taming vehicular traffic and supporting alternative transport modes. The report demonstrated that
Wellington compared favourably to other cities such as London, Copenhagen, Adelaide and Perth. The city is
thriving and successful, but much could still be done to unlock the central city’s full potential, particularly regarding
traffic and parking. A strong and clear street hierarchy needed to be developed, through traffic reduced, and
parking reduced to control the traffic coming into the city.
The apartment dwellers report looked at the then approximately 12,000 people who lived in the central city area. It
showed that 22% of respondents travelled to the suburbs to do their grocery shopping and Pak’nSave in Kilbirnie
was the preferred location. Travel patterns of apartment dwellers showed the most common mode of travel to work
K:\WTTP\WTTP GWRC 001 Wellington PT Spine Study (60222076)\8. Issued Docs\8.1 Reports\Engagement Study\PT Spine
Study Engagement Report Final Milestone 2.docx
Revision - 19 February 2012You can also read