Assessing data readiness of sub-national institutions using the Data Compass - Understanding data usage challenges and opportunities that inform ...
←
→
Page content transcription
If your browser does not render page correctly, please read the page content below
Assessing data readiness of
sub-national institutions using
the Data Compass
Understanding data usage challenges and opportunities that
inform decision-making processes in rural health facilities

Philip Davidovich
IREX

December 2020

                               1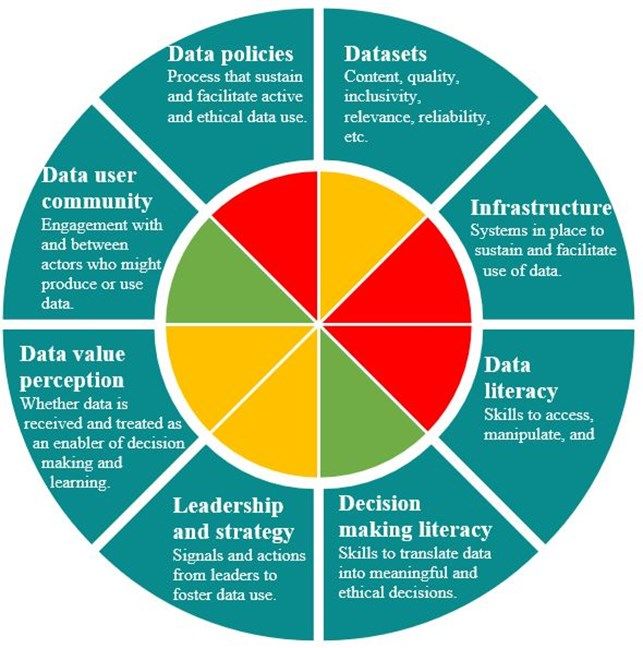
ABOUT THE DATA COLLABORATIVES FOR LOCAL IMPACT (DCLI) PROGRAM
DCLI is a unique partnership between the Millennium Challenge Corporation (MCC) and the
President’s Emergency Plan for AIDS Relief (PEPFAR) to strengthen the use of data for more
effective decision-making, particularly in areas that impact health, gender equality, and
economic growth. Learn more at www.dcli.co.

ABOUT THIS PUBLICATION
This report was prepared by Philip Davidovich, Technical Specialist for Data and Digital
Development at IREX, a global development and education organization. It can be cited as
follows:

Davidovich, Philip. “Assessing data readiness of sub-national institutions using the Data
Compass.” Prepared by IREX for the Millennium Challenge Corporation (December 2020).

ACKNOWLEDGMENTS
The partnership of Omar Bakari and other staff at the Tanzania Data Lab (dLab) was
instrumental to the design and implementation of data collection for this analysis. The data
collection processes were shaped with the guidance of Dr. Anna Nswilla and supported by
Tanzania’s President’s Office for Regional and Local Government (PORALG) and the Ministry
of Health. Agnieszka Rawa, Managing Director for DCLI, and Mitch Blaser, DCLI Regional
Lead, provided invaluable direction and feedback on this report, as did Dara Lipton, Project Di-
rector, and Jesus Melendez Vicente, Senior Technical Advisor for Digital Development at
IREX. Special acknowledgments to Samhir Vasdev and Julian Lopez for their initial design and
development of the Data Compass tool.

                                               2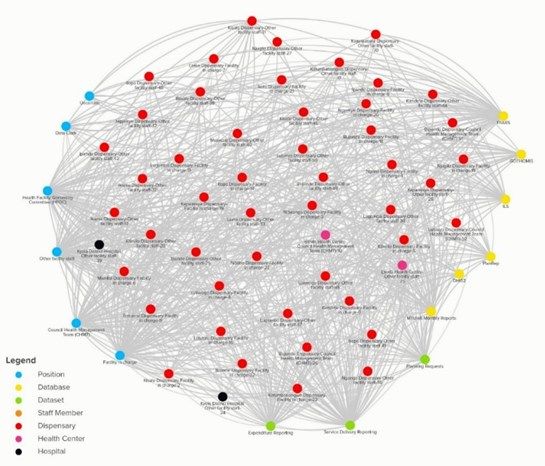
Assessing data readiness of sub-national institutions using the Data Compass
Understanding data usage challenges and opportunities that inform decision-making processes
in rural health facilities

Summary
Since 2016, a unique partnership between MCC and PEPFAR adopted
a systems thinking approach to strengthen Tanzania’s community of
actors using data to advance health, gender, and economic growth
outcomes. This program, Data Collaboratives for Local Impact (DCLI),
was intentionally designed to strategically inject key resources into that
system, with the hope that they would have sustaining impact that               Data Compass
outlasts the program’s implementation period.
                                                                                The Data Compass is an adaptable assessment
During this period, Tanzania’s public health industry was undergoing            tool that helps institutions in any sector
the Direct Health Facility Financing (DHFF) reforms, an effort to               strategically identify data-related
decentralize decision making processes so facilities can be more                improvements needed to optimize decision
autonomous and adaptable in their operations and better meet local              making within their unique environment. This
needs. Key stakeholders, including the Ministry of Health, wanted to            tool includes two instruments for analysis that
learn how prepared rural facilities were in managing these systems and          inform an actionable plan:
processes to inform their decisions.
To compliment these critical reforms and further its goal of
empowering key stakeholders at the subnational level, DCLI
commissioned an assessment of rural health facilities’ readiness to use
data to inform their decisions in the Kyela District using the Data
Compass tool, developed by IREX.

Findings
Rural health facilities in Kyela have a vibrant                   However, significant obstacles remain to achieving
data-sharing culture that improve local services                  efficient data usage
         30 of the 31 total health facilities in the Kyela                   Facility staff have limited capacity to efficiently use
         District contributed to the data-flow survey                        DHFF digital systems to identify insights that inform
         which identified an active information sharing                      decision making processes.
         environment and collaborative decision-making
         process with community members.                                     Health facilities lack adequate infrastructure to use
                                                                             DHFF systems. Unreliable electricity makes facility
                                                                             staff dependent on hard copies resulting in duplicate
         The more autonomous decision-making process                         data entry and reliance on external support.
         fostered from DHFF is favorable for facility staff
         to address local issues directly and ensure                         Inconsistent data security policies pose a significant
         resources reach their community.                                    risk for facility staff working with large volumes of
                                                                             patient information in hard copy form.

Specific district-level support across all facilities can provide meaningful improvements:
•   Invest in capacity building programs for staff to use required software and identify insights to inform decisions.
•   Develop a step-by-step user guide that prepares staff to use DHFF digital systems in order to foster consistent processes.
•   Improve facility infrastructure to ensure all have reliable electricity, internet connection, and computers.
•   Establish a data protection policy for facilities to ensure consistent and responsible practices for data storage and access.
Overall, this report highlights the challenges that emerge when policy and procedure improvements outpace
capacity and infrastructure investments at the sub-national level, as well as concrete opportunities to
strengthen this ecosystem towards achieving institutional and systems-level improvements.

                                                                 3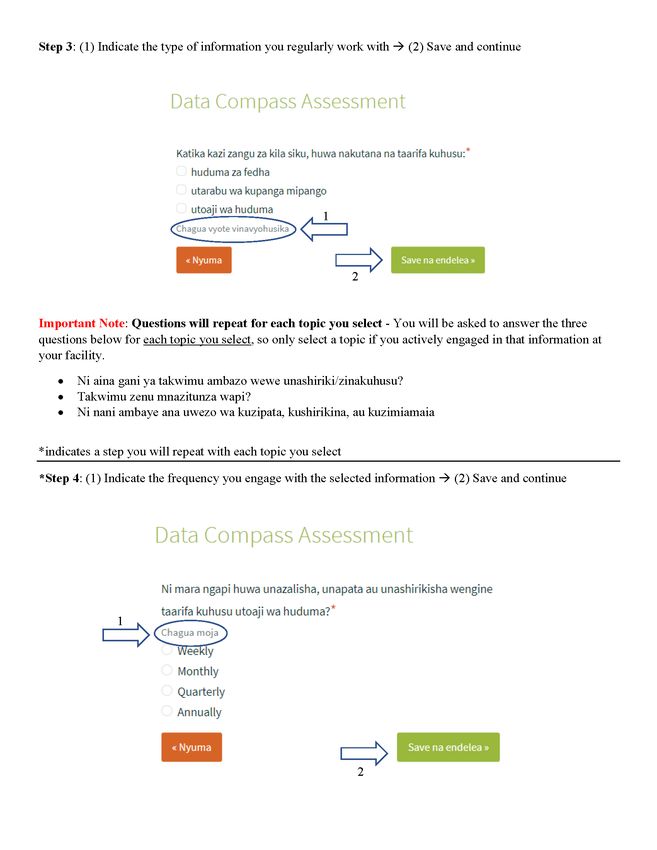
Table of Contents

Context                                              5

Introduction                                         7

Methodology                                          9

Findings                                             12

Comprehensive Dimension and Ideal State Evaluation   16

Conclusion and Next Steps                            25

Annex A: Expanded Methodology                        27

Annex B: Facility Action Plan template               34

Annex C: Interview and Discussion Questionnaire      43

Annex D: Flow Mapper Survey User Instructions        49

                                         4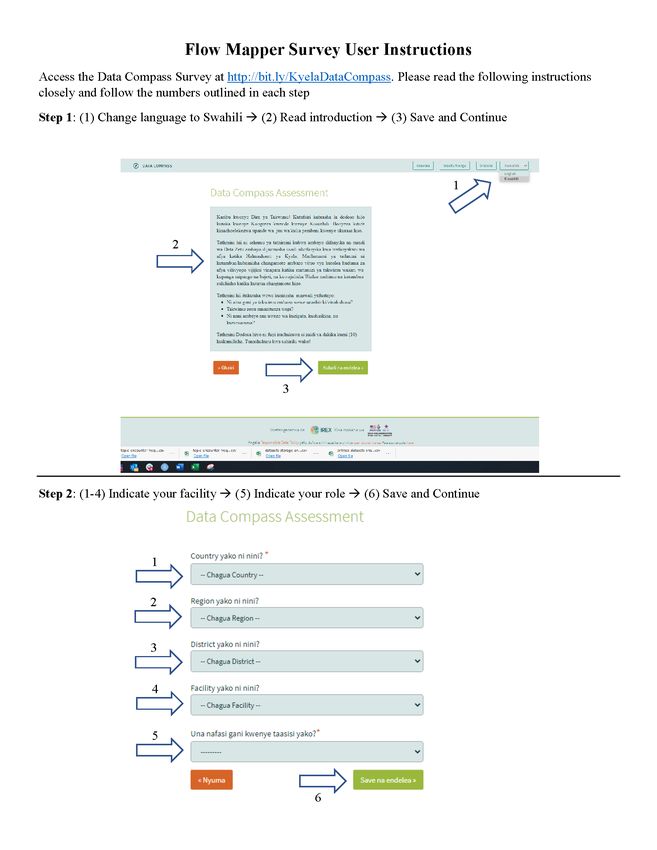
Context
Responsive and impactful development programming relies on the effective and strategic use of
data to inform decisions. Between 2016 and 2018, the Data Collaboratives for Local Impact
(DCLI) program—a unique partnership between MCC and PEPFAR to strengthen evidence-
based decision-making for improved HIV/AIDS and health, gender, and economic outcomes—
implemented a constellation of activities across Tanzania to help institutions, entrepreneurs, and
government actors use data more effectively and systematically. The three projects that
implemented DCLI initiatives in Tanzania between 2016 and 2019 are the following:

•   The Tanzania Data Lab (dLab): A premier center for excellence and innovation in data use.
    Located at the University of Dar Es Salaam’s College of ICT, the dLab converted into a lo-
    cally owned and operated NGO in 2018.
•   The Data for Local Impact Innovation Challenge (DLI): An innovation competition that
    challenged Tanzanian youth to develop data and digital solutions to health, gender equality,
    and economic growth problems.
•   Data Zetu: A multi-partner project in which IREX is the leading implementer that operated
    in fourteen wards across Tanzania, supporting local institutions to build and adopt data use
    capabilities to strengthen evidence-based decision-making.

Separately, in 2017 the Ministry of Health, Community Development, Gender, Elderly and
Children (MoHCDGEC) and the President’s Office of Regional Administration and Local
Government (PORALG) began implementing the Direct Health Facility Financing (DHFF)
program – a health sector reform initiative that decentralizes the disbursement of facility funds
so facilities can plan and procure funding based on local challenges and priorities. DHFF is the
most recent improvement to reforms conducted in 2000 which aimed to decentralize operations
by placing the powers to manage health facility finances and service delivery to the District
Council Health Management Team (CHMT)1. The disbursement of funds into CHMT accounts
instead of health facility accounts, however, created a loophole for use of facility funds on other
priorities set by CHMT instead of improving the services delivery of health facilities. This led
to primary health care facilities, particularly rural communities, experiencing shortages on
essential medicine and compromising the availability and quality of services. It was envisioned
that implementation of the DHFF program will improve community participation and
autonomy, efficiency and effectiveness of available resources, and ultimately improve the
quality of care at the local level2.

Since 2016 and in tandem with the Data Zetu project, IREX, a global development and educa-
tion organization, has established itself as a thought leader in approaches for improving data-

__________________________
1
  Dr. Ulisubisya, Mpoki M., and Eng. Mussa I. Iyombe. Direct Health Facility Financing Guide. Prepared by
MoHCDGEC and PORALG, Page 2.
2
  DHFF Guide, Page 3.                                  5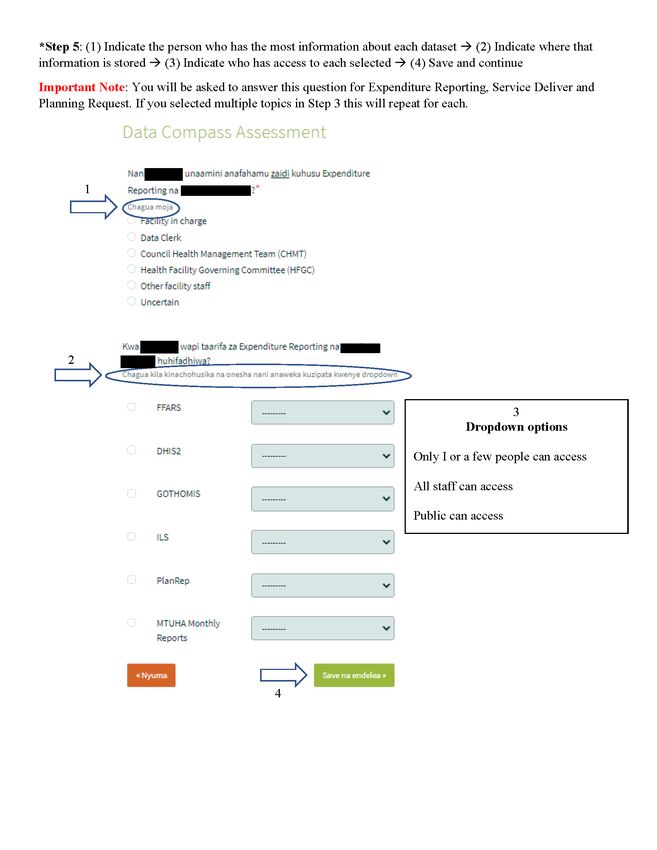
informed decision-making capacities for leaders and public serving institutions. In 2019, IREX
concluded a research study on the data-readiness of local civic institutions in Moldova to
address community needs3. The findings from this study along with the DCLI-funded Data Zetu
work at the subnational level on subnational data flows and spaces informed the design of a
new IREX product called the Data Compass, which is intended to help institutions strategically
identify where to invest for the most meaningful improvements to their data usage.

In a continuation of the Data Zetu program’s mission to help government actors use data more
effectively and systematically, and with support from Tanzania’s Ministry of Health and
PORALG, DCLI commissioned IREX in 2020, as part of the Data Zetu project, to use the Data
Compass to assess rural health facilities ability to use data to understand how prepared they
were to use the DHFF system. IREX focused the assessment on facilities in the Kyela District
because of the significant past engagement and relationships developed in previous activities
during the Data Zetu project. This assessment marks the first comprehensive use of the Data
Compass tool.

__________________________
3
 Vasdev, Samhir. “Getting more value from data: What we've learned from piloting a new tool with local govern-
ments”, Prepared by IREX, 2019 - link

                                                      6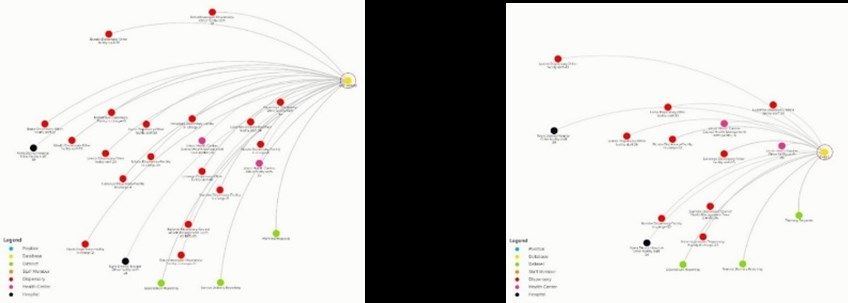
Introduction
Efforts to help institutions enhance their data usage to inform decisions oversimplify the
process of converting insights into action and lack context to the unique ways each institution
uses data in their environment. As an immediate response, many organizations turn to technical
skills training and invest in analytic software as a means to improve the capacity and output of
their staff, but this response often fails to consider other parts of the data use process. As shown
in Figure 1, IREX's data-informed decision-making (DID) model expands the typical data liter-
acy lifecycle by adding data usage in the context of a decision.
Figure 1: IREX's data-informed decision-making (DID) model
This model identifies the decision-making process as the central output for data usage in an or-
ganization, and cross cutting capacities, resources, and structures support the efficiency of that
output. This is where the Data Compass tool comes in.
The Data Compass, a new tool developed by IREX, aims to help public serving institutions
strategically identify where they should invest limited resources to improve their use of data
and serve their communities more effectively. This tool is intended to work closely with an
organization’s leadership and staff to design goals that are specific to their operational
environment, and identify reasonable recommendations to make sustainable improvements to a
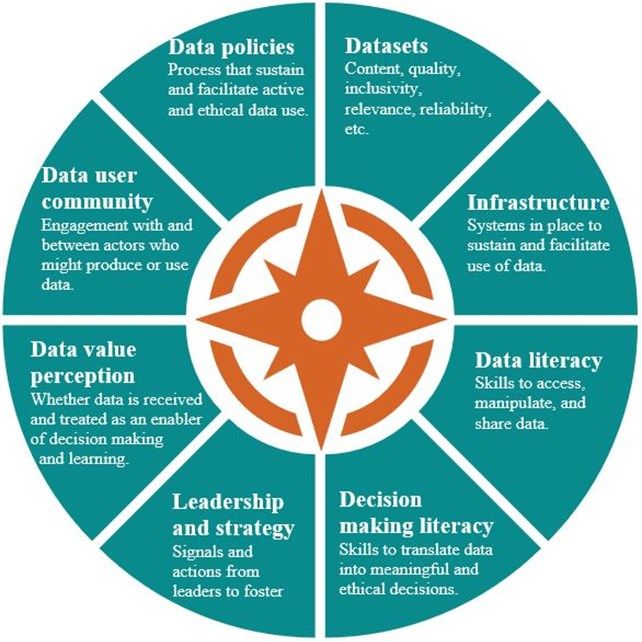
specific data-use ecosystem. The Data Compass approaches this process by assessing eight di-
mensions of data use capacities, resources, and policies to holistically understand an institu-
tion’s strengths and weaknesses towards a specific data-use goal. By clearly understanding the
state of each dimension towards a specific institutional goal, the data compass will “point” to
the areas that will foster the most meaningful growth for sustainable improvement.
7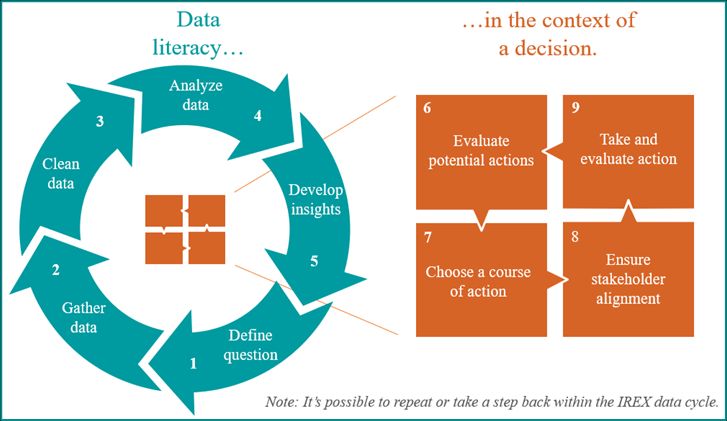
To inform the assessment of each of these dimensions, the Data Compass tool demands close
collaboration with institutional leadership and staff to understand the actors and systems in-
volved in a specific data-use ecosystem, and develop clear goals for what they envision
achieving in an “ideal” operational environment. With contextual guidance, Data Compass fa-
cilitators adapt two data collection tools. The first tool is a comprehensive questionnaire that
guides interviews and group discussions with key staff on granular components of each
dimension. The second tool is a survey software called Flow Mapper that conducts a dataflow
analysis on how information is shared and accessed between people and systems.

Based on the insights identified in the data collection and analysis process, an Action Plan is
developed by an organization’s leadership to strategically focus investments and identify steps
for improvement. Accordingly, and as a critical follow-on step of the Data Compass
implementation in Kyela, an Action Plan template will be shared with each health facility in
Kyela to complete independently and with continued guidance from the Tanzania Data Lab.
This report showcases the analysis process and key takeaways that informed the district-wide
recommendations and facility action plan structure.

                                                8
Methodology
The implementation of the Data Compass tool is intended to be a highly collaborative process
that seeks to engage with staff across an institution for the purpose of identifying actionable
recommendations to their contextual needs. This process allows the Data Compass tool to be
adaptive to different sectors and environments by customizing the indicators within each
dimension. In this assessment, the IREX team in partnership with the Tanzania Data Lab aimed
to understand the extent to which health facilities in the Kyela District are prepared to collect,
manage, and share financial data for the purpose of identifying strategic improvements. These
strategic improvements are informed by identifying the status of each of the eight Data Com-
pass Dimensions, which guide the data collection and analysis process (see Figure 2). These
Dimensions make up the capacities, resources, and policies that impact the use of data within an
organization and help inform the focus of the action plan. This section will dive into the high-
level methodology of the Data Compass tool, but Annex A provides an expanded methodology
that includes important contextual details about health facilities in Kyela, how IREX adapted
data collection tools used to inform the findings in this report, and key biases and limitations to
consider from the overall process. For the best understanding of identified findings, please ref-
erence Annex A before proceeding to the Findings and Comprehensive Dimension and Ideal
State Evaluation Sections.
Figure 2: Data Compass Dimension Descriptions
9The comprehensive methodology consists of four major components that are each conducted in
close consultation with institutional staff. Figure 3 below outlines the high-level flow of this
methodology including the development and implementation of an Action Plan.
Figure 3: Data Compass Methodology Process
Ideal States and adaptation
The customization of “Ideal States” within each Dimension makes the Data Compass tool
adaptable in different sectors and contexts. Ideal States are indicators of progress established at
the institutional level that reflect the best situation for specific data-usage components within
each Dimension across all facilities, offices, and programs. Ideal States guide the adaptation of
data collection tools and the overall evaluation process of the Data Compass. Developing ideal
states demands a clear vision from institutional leadership on how improved data-usage can
contribute to their long-term goals, and significant collaboration is required with staff and local
experts to understand their unique environment to achieve these goals. This process is the first
and most critical step in the adaptation of the Data Compass tool and allows institutions to pri-
oritize and develop specific components it finds most valuable, with the guidance of IREX
technical staff to ensure it aligns accurately with the respective Dimension. Once identified,
these Ideal States act as a roadmap during the data collection and analysis process, with the goal
being to gather enough information to efficiently evaluate each Ideal State and, as a result, their
respective Dimension. As an example, below are some Ideal States within the Datasets
Dimension that were identified for this assessment.
Figure 4: Sample of Dataset Ideal States
Datasets that support servicing and financial information for the ILS, PlanRep and FFARS
systems exist in analog or digital format.
Relevant datasets are inventoried on a regular (systematic) basis.
There is shared knowledge among facility staff on where to search for and access relevant ser-
vicing and financial datasets when needed.
There is a standardized format between datasets for consistent categories that enables longitu-
dinal and cross-dataset comparisons (e.g. common schema for addresses).
10Evaluation Criteria
Each Dimension and Ideal State are evaluated on a three-point scale (Low, Medium and High)
based on the consolidated insights identified from the data collection and analysis process4.
While each health facility has their own strengths and unique challenges, the scores identified in
this report reflect the major trends identified from the data collection and analysis processes
across all facilities. A Low score indicates that significant barriers exist, and systemic changes
needs to be made for improvements to be sustainable. A Medium score indicates a favorable
structure exists for improvements to be sustainable, but staff face significant limitations
regarding what is currently available. A High score indicates a favorable structure exists and
staff have what they need to make sustainable improvements.
Figure 5: Dimensions of Data Use Three Point Scale
Evidence of significant obstacles Unfavorable condition, but no evi- Favorable condition
dence of significant obstacles
(Low) (Medium) (High)
While an Ideal State and their respective Dimension are related, not all Ideal States are equally
valued within the same Dimension. During the process of identifying the Ideal States with
facility staff and local experts, insights to which Ideals States are critical to the overall
sustainability of each Dimension are discussed and noted. For this reason, Ideal States and
Dimensions, while rigorously connected, are evaluated with different considerations. While
Ideal States focus on a specific issue, the Dimensions consider the equitable balance between
critical and supporting Ideal States. The purpose of scoring each Dimension is to strategically
focus attention on critically weak areas. The purpose of scoring each Ideal State is to provide a
more granular insight into the strengths and weaknesses that exist within each Dimension and
inform potential improvements for facilities to consider when developing their action plan.
__________________________
4
Three-point scoring scale referenced from World Bank DataToolkit
11Findings
Overall, the IREX team’s analysis highlight a strong community-focused decision-making
process that is positively fostered by DHFF, but facility staff face challenges with limited
capacity and institutional support to improve processes autonomously. The major identified
obstacles are poor data literacy for identifying insights to inform planning and improvements,
and poor facility infrastructure that make accessing DHFF digital systems challenging and
infrequent, and result in dispensaries being dependent on CHMT support. Additionally,
inconsistent data security policies pose a significant risk for facility staff working with large
volumes of patient information.
Figure 6: Dimension evaluation overview
12Dimension-Level insights
Evidence of significant obstacles
Infrastructure: Facilities, particularly at the dispensary level, lack computers, required
software, and staff capacity to sustainably meet the Direct Health Facility Financing
procedures. Inconsistent electricity and internet access force dispensary staff to be dependent on
District Council support to enter and manage facility data and requests.
The dataflow analysis showcases the insight that many dispensaries are unable to accesses
systems like GoT-HoMIS or DHIS2, which are interoperable support systems that help manage
service delivery and inform decisions. This insight was identified from focusing on the
GoT-HoMIS and DHIS2 systems (see Figure 7; systems are in yellow) to filter any respondents
that did not indicate access, which resulted in less than half of all dispensaries (indicated in red)
remaining in the network.
Figure 7: Flow Mapper Graphs Depicting Access to GoT-HoMIS and DHIS2
Access to GoT-HoMIS Access to DHIS2
Data literacy: Most facility staff do not have the technical skills to analyze and learn from the
data they collect. While there is more autonomy for each facility to make decisions, facility
leadership at the dispensary level feel they do not have the capacity to use the data available to
inform discussions and identify investments. Additionally, many staff at the dispensary level
indicated not feeling adequately trained on how to use the required reporting software like
FFARS, PlanRep, ILS, and GOTHOMIS.
The significant weakness of this Dimension is a root cause for less favorable status of the
Datasets, Leadership and strategy, and Data value perception Dimensions.
Data policies: There are unclear policies and poor infrastructure to securely store and share pa-
tient and facility information. While staff approach this issue seriously, major security concerns
such as shared login passwords, using personal devices for facility reporting, limited (physical)
storage space, and inconsistent processes for storing and destroying hard copies of patient
information exist. Additionally, the dependent relationship of many dispensaries with their
District Council office demands the duplication of many hard copies of datasets for entry to
systems, which are then stored in two separate locations. This poses a significant risk for
datasets that may include any sensitive facility information.
13Dimension-Level insights
Unfavorable condition, but no evidence of significant obstacles
Datasets: Facility staff have the skills and capacity to accurately enter and manage datasets, and
do so routinely, but dispensary staff are held back from improving processes because of poor
data literacy and an overly burdensome double entry system – translating manual data collected
in hard copies to digital form in required systems.
Leadership and Strategy: The leadership and structure for learning and information sharing to
meet community needs exists, but there is a lack of data literacy capacity to improve the infor-
mation being collected. In many dispensaries this limited capacity exists with facility
leadership.
Data value perception: At the dispensary level, there is a general lack of incentive to prioritize
learning from data because of the significant challenges staff face to routinely access datasets,
at times being dependent on district council support. Additionally, poor data literacy among
most staff across facilities limits their ability to identify insights at each level of the organiza-
tion. These components foster a culture among most staff that data is more of a burden of
required collection than a resource for insights.
Favorable conditions
Decision making literacy: Clear decision-making policies and expectations to collaborate with
community members and other stakeholders exist and foster meaningful improvements. While
significant challenges exist to better use data in the collaboration process, the DHFF program
established a vibrant information sharing culture that foster more informed decisions based on
community needs. In addition to staff feedback, this was supported by the large number of
mutual connections identified from the dataflow analysis between facility staff, CHMT, and
HFGC.
Figure 8 shows nearly all respondents (represented in red/pink/black) having a mutual infor-
mation exchange with CHMT and HFGC (blue). This is indicated by the concave and convex
connections that form a ellipse shape between each respondent and the CHMT and HFGC.
Figure 8: Information shared with CHMT and HFGC
14Dimension-Level insights
Favorable conditions
Data user community: Information is routinely shared between facilities and community
leadership every three months and there is active engagement between facility staff and
community health workers (some of whom are part of the HFGC) to understand immediate
community needs. Additionally, the dataflow analysis identified very few gaps between facility
staff and other actors. While significant challenges exist for many dispensaries to access and
efficiently use certain database systems, all facility staff share information available across
several actors.
The extent of this information sharing can be seen in Figure 9, which includes all survey re-
spondents and their connections – demonstrating a significant number and diversity of linkages
across the ecosystem. Depicted are the 60 respondents (indicated in red, pink and black; in the
center of the map), generating 3,290 connections. While each of the actors, datasets, and
databases are individual in the network map, they represent the members of different
communities and datasets stored under unique logins or facility rooms. Each connection
representing a different piece of information being accessed, shared, and received. On average,
and with no major outliers identified, each respondent indicated accessing, sharing, or receiving
55 pieces of information from different elements. This is a vibrant and engaged data ecosystem.
Figure 9: All Dataflow Connections from Respondents
15Comprehensive Dimension
and Ideal State Evaluation
Ideals States guide the data collection and evaluation process of the Data Compass tool, and the
balanced consideration of insights identified within each of those Ideal States inform the com-
prehensive evaluation of their respective Dimension. While the Dimension status guides the ar-
eas of focus for the action plan, this comprehensive breakdown of each Ideal State informs the
more specific strengths and weaknesses that were identified across health facilities.
This section shares the comprehensive findings of each Dimension and respective Ideal States
with expanded details. The order of this section will start with the Dataset Dimension and move
clockwise as indicated in figure 10. This order does not reflect any priority between Dimen-
sions.
Figure 10: Order of section by Dimensions
16Datasets - Content, quality, inclusivity, relevance, reliability, etc.
Unfavorable condition, but no evidence of significant obstacles
Facilities are asked to collect and report an overwhelming volume of data without adequate resources and technical
capacity to manage it efficiently. This challenge makes the data entry process burdensome and unreliable, particularly
at the dispensary level. Each facility faces unique challenges in how and when they can enter data into a consolidated
system like DHIS2 and GOTHOMIS, but hard copies of monthly MTUHA reports are the most reliable dataset
available. This can cause significant challenges in sharing data, identifying issues, and improving processes. At the
dispensary level there is understanding about what is needed for reporting purposes, but the data reported is likely
unreliable due to the extended burden and duplicate data entry process. Below are some additional insights to
consider:
• The volume of data required to collect is extremely burdensome without reliable ICTs and facility electricity.
There is a dependence to enter data in analogue form when collecting it and then translating it digitally. This
becomes particularly challenging when electricity is out for extended periods of time and staff need to enter a
large volume at once.
• Routine discussions about data collection and analysis processes at the district hospital and health center level
exist, the limited staff and delayed data entry periods at the dispensary level make it challenging for staff to learn
from the data collected routinely and improve processes.
Datasets Ideal States Score Details
Datasets that support servicing and financial Favorable conditions They exist at every facility.
information for the PlanRep and FFARS
systems exist in analog or digital format.
Relevant datasets are inventoried on a regular Favorable conditions Data is routinely updated.
(systematic) basis.
There is shared knowledge among facility staff Favorable conditions There is shared knowledge of
on where to search for and access relevant where resources exist.
servicing and financial datasets when needed.
There is a standardized format between Unfavorable condition, There is a standard format, but
datasets for consistent categories that enables but no evidence of double data entry process raise
longitudinal and cross-dataset comparisons significant obstacles concern for errors
(e.g. common schema for addresses).
Datasets are of good enough quality (e.g. Unfavorable condition, Inconsistency in data entry.
cleanliness, resolution, credibility, update but no evidence of
frequency, representativeness) to inform significant obstacles
PlanRep and FFARS system inputs.
There are processes in place to audit and Evidence of significant CHMT conduct quality
improve the quality of datasets, including obstacles assurance audit, but inaccurate
gender audits. changes to datasets were
noted.
Datasets are accompanied with useful Unfavorable condition, Duplicate data entry at the
trustworthy metadata (their owner, frequency but no evidence of facility level and CHMT raise
of updates, source, etc.). significant obstacles concerns of trust.
Biases in the data collection and analysis Evidence of significant Staff have limited understand-
processes of datasets are known, and practices obstacles ing of bias that exist in data
to mitigate them are in place collection analysis.
When data from complementing datasets does Unfavorable condition, No standard process exists
not align, there is a process in place for but no evidence of with supporting datasets, but
reconciling competing information. significant obstacles interoperable systems like
PlanRep and FFARS mitigate
some concern.
Methods for data collection are consistent and Unfavorable condition, Data collection process is
leverage appropriate modern tools and but17
no evidence of consistent, but they do not
techniques. significant obstacles have modern tools.Infrastructure - Systems in place to sustain and facilitate use of data.
Evidence of significant obstacles
A lack of access for many facilities to directly access database systems like PlanRep, GOTHOMIS, and DHIS2 as
well as severely limited facility resources pose a significant challenge for facility staff to consistently collect, manage,
and share data autonomously.
While some of the challenges are not as significant at the district hospital, dispensaries and health centers are
dependent on support from their respective District Council offices for certain data entry requirements and resources.
Some facilities face significant challenges with access to electricity and water, resulting in less ability to collect and
manage their data consistently. Below are some additional insights to consider:
• Most facilities indicated only having one or two computers available and most without the support software like
GOTHOMIS or DHS2 installed. This causes a dependence with district council offices to enter MTUHA data and
other hard copies of datasets in the systems when available.
• Dispensary staff has noted that electricity can go down for extended periods or their computers are broken,
causing them to use their mobile phones to enter budget/funds expenditure requests.
• Dispensaries usually only have 2-3 staff and are burdened entering data twice, collecting data first in analog form
and then translating it digitally. This stretches an already limited staff with an extra step if they can enter data
directly into digital form.
• Inability for dispensaries to access PlanRep directly causes a dependency on CHMT to enter the information and
has raised concerns over inaccuracies.
• The District Hospital noted that there is a shortage of computers for the volume of data they are being required to
collect. This causes a backlog in data entry and increases the potential for errors. As a result, they have had to
borrow computers from other facilities to keep up with the incoming reports.
Infrastructure Ideal States Score Details
Infrastructure exists to store and use servicing and Unfavorable condition, Systems exist but they
financial data to the PlanRep and FFARS systems. but no evidence of are not always easily
significant obstacles accessible to use.
The way datasets are stored makes them accessible to Unfavorable condition, Not easily accessible for
different authorized users when needed. but no evidence of some facilities with
significant obstacles poor electricity.
Infrastructure to store datasets is interoperable Evidence of significant GOTHOMIS and
(within the organization). obstacles DHIS2 are not –
dependent on DC.
Infrastructure to store datasets is aligned and Evidence of significant GOTHOMIS and
interoperable with other systems (outside the obstacles DHIS2 are not –
organization). dependent on DC.
[Software] Systems allow non-sophisticated users to Evidence of significant Many dispensary staff
access data. obstacles are not trained to use
the required systems.
[Software] Systems support statistical analysis and Evidence of significant Many computers do not
can produce graphical displays of data. obstacles have required software
to analyze data.
There is enough staff and technology to ensure data Evidence of significant None or inaccessible
is securely stored and shared. obstacles computers are available
to many dispensary
staff.
18Data literacy - Skills to access, manipulate, and share data.
Evidence of significant obstacles
All facilities indicated staff have a limited capacity in data literacy. Some training exists and staff have consistent data
collection practices, but they do not have the skills to properly analyze or understand reports to learn or improve
processes. Additionally, many staff at the dispensary level are not adequately trained to enter data into GOTHOMIS or
DHIS2.
Data literacy Ideal States Score Details
Skills exist for staff to access (find or obtain) Unfavorable condition, There is understanding of
servicing and financial data from different sources but no evidence of what is needed for
and systems (both within and outside of an organi- significant obstacles reporting, but not always
zation) to inform input into FFARS and PlanRep reliable access.
systems.
Skills exist to manipulate (clean, analyze, or Evidence of significant Limited staff training.
visualize) data to surface findings. obstacles
Skills exist to share data to internal and external Favorable conditions Active dialogue with
audiences including non-data users when relevant. external audiences.
Skills exist to identify bias in datasets to ensure its Evidence of significant Limited staff training.
inclusivity when relevant. obstacles
Skills exist to implement data protection, privacy, Evidence of significant Limited staff training.
and security practices (such as anonymizing obstacles
personally identifying information).
Specific data literacy skills (collection, analysis, Unfavorable condition, Sometimes, but skills are
etc.) are included in job announcements or but no evidence of not developed.
descriptions. significant obstacles
Skills exist to enable a gender-aware approach to Evidence of significant Limited staff training.
manage and communicate about datasets. obstacles
19Decision making literacy - Skills to translate data into meaningful and ethical decisions.
Favorable conditions
Because of the clear priorities laid out in the planning process, there is consistency in how facilities approach decision
making for budgeting/funding requests and a vibrant dialogue with multiple stakeholders to inform those decisions.
While additional data literacy skills would enhance these processes, the structure and steps that currently exist is
favorable. Below are some additional insights to consider:
• Health quality improvement team and Health Facility Governing Committee (HFGC), which includes citizen
representatives, review data and community issues together and identify planning purposes each year.
• Summary reports inform committee and district council discussions. The district Council Health Management
Team (CHMT) is required to enter the information into the system, but the decisions are made by HFGC.
• The FFARS/PlanRep/ILS systems have made facility heads more adaptable to make decision for procurement of
medicines and medical supplies that hold them accountable to the decisions outlined in the planning processes.
Decision making literacy Ideal States Score Details
Data is frequently part of regular decision-making Favorable conditions Every quarter and
processes. annually for planning.
There is a structured process in place to incorporate Favorable conditions Clear structure.
data into decision-making processes.
Skills exist for recognizing what data is relevant to Favorable conditions Clear proess for what is
inform PlanRep and FFARS systems. needed for those systems.
Skills exist to draw meaningful conclusions and Evidence of significant Limited staff training.
interpretations from datasets and visualizations. obstacles
Skills exist to evaluate the sufficiency and quality Evidence of significant Limited staff training.
of data. obstacles
Skills exist to make inclusive decisions based on Evidence of significant Limited staff training.
evidence presented through data. obstacles
20Leadership and strategic priorities - Signals and actions from leaders to foster data use.
Unfavorable condition, but no evidence of significant obstacles
DHFF has fostered a more autonomous and collaborative structure for lower level facilities that presents a positive
opportunity to improve systems and use data more actively to inform decisions, but poor data literacy skills among
facility staff is holding them back. As a result, facility leadership on data usage is limited to reporting purposes
without a process of learning and improving systems. Below are some additional insights to consider:
• Community health workers (1-2 per village) collect data on local issues monthly and shares it with facility staff,
but there is no learning procedures or meetings at the dispensary level to identify insights or improve these
processes.
• The PlanRep system is not set up easily to organize the annual budget based on facility priorities and requires sup-
port from the district council to update. A more relevant user-guide for how to use PlanRep and other systems is
significantly desired by dispensary staff.
• All dispensaries indicated a strong need for a well-trained Data Manager to support their process. This emphasizes
the poor data literacy skills facility staff need and the stretched capacity of facility heads to manage too many
components without adequate training.
Leadership and strategic priorities Ideal States Score Details
Facility leaders have formally set the expectation Favorable conditions Clearly outlined in the
that staff are expected to incorporate data-driven planning processes and
insights into their update of the FFARS and discussions.
PlanRep systems.
Datasets are used by facility leaders to inform Unfavorable condition, but Yes, but inconsistent
strategic priorities (e.g. plans, performance indica- no evidence of significant capacity by facility lead-
tors, budgets). obstacles ers.
There are learning procedures in place that ensure Evidence of significant Does not exist at the
data is being used to guide institutional improve- obstacles dispensary level.
ment at the facility level.
A specific position(s) is responsible for managing Unfavorable condition, but Usually falls to the facility
datasets (e.g. CIO). no evidence of significant in charge person who has
obstacles many responsibilities.
Facility leaders have included specific plans to Unfavorable condition, but There is a desire from
improve data readiness and use through resource no evidence of significant facility leaders, but not
allocation. obstacles institutional support.
Facility leaders use data to assess their organiza- Favorable conditions Vibrant dialogue between
tion’s strengths and weaknesses when developing community members and
strategic plans. facility staff.
21Data value perceptions - Whether data is received and treated as an enabler of decision making
and learning.
Unfavorable condition, but no evidence of significant obstacles
Facility staff understand that data is used to drive facility activities and inform priorities, but there is limited
understanding and value from most staff in using data to learn and improve processes. This is likely a result of poor
data literacy among staff and infrastructure obstacles the keep them from efficiently engaging with data they collect.
Data value perception Ideal States Score Details
Staff recognize the importance and relevance of Unfavorable condition, Clear understanding that
building data literacy skills to their jobs. but no evidence of staff need these skills.
Trust exists in quality datasets that are known to be Favorable conditions MTUHA reports are
credible. reliable datasets.
Investments into infrastructure to collect, store, and Evidence of significant Not a priority investment
share datasets are prioritized. obstacles area.
Staff see a clear and visible connection between Favorable conditions The planning process
data, institutional planning, and resource allocation. makes this very clear.
Gender, age, etc. (note inclusion definition) – Unfavorable condition, It is acknowledged as a
disaggregated information is acknowledged as but no evidence of sig- value, but limited staff
fundamental to quality, usable data. nificant obstacles capacity to improve.
Responsibility for data protection is assigned to key Unfavorable condition, Staff have clear
staff and they are evaluated on their support of this but no evidence of understanding to protect
responsibility. significant obstacles private data, but there are
inconsistent policies and
practices.
22Data user community - Engagement with and between actors who might produce or use data.
Favorable conditions
A vibrant dialogue and sharing culture between facilities and their local communities exists and is fostered by the
planning processes required by DHFF. One major challenge, however, is the frequency and accuracy of the data being
collected and shared. Some facilities indicated the planned budget requests were not adequate for certain initiative
activities because of a lack of information and communities would provide in-kind donations to keep the activities
supported. This issue is likely an effect of limited staff capacity and infrastructure to collect and manage data
accurately indicated in the infrastructure dimension analysis. Despite these challenges facilities have favorable
conditions to foster an active data user community. Below are some additional insights to consider:
• Dispensaries indicated sharing information with community leaders every three months. It is the responsibility of
the community leaders to disseminate that information to their constituents.
• Facilities consolidate a discussion with community leaders once a year as they identify their local priorities for the
PlanRep entry.
Data user community Ideal States Score Details
Processes for external and internal actors to request Favorable conditions Routine sharing of data
data exist and are utilized. exists in planning
process.
Requests for datasets, both internally and externally, Unfavorable condition, Significant staff
are responded to constructively and efficiently. but no evidence of sig- shortages to frequently
nificant obstacles accommodate.
Requests for datasets are publicly available to Favorable conditions Routine sharing of data
enable other actors working on similar issues to exists in planning
utilize that information more effectively. process.
There is frequent dialog among staff about what Favorable conditions Critical information is
information is critical to know. known by all staff.
Data-informed decisions are shared with other Favorable conditions Routine sharing of data
actors to build trust in the institution and in the data. exists in planning
process.
23Data policies - Process that sustain and facilitate active and ethical data use.
Evidence of significant obstacles
Facilities face serious inconsistencies in the secure storage and access of personally identifiable information (PII).
While there was strong sense from facility staff to ensure that PII is not shared with unauthorized officials, specific
policies either do not exist or are not known by facility staff. The large volume of hard copies at facility and district
council sites without clear storage lengths and disposal policies is a particular concern. Below are some additional
insights to consider:
• All hard copies are stored at dispensary for the month, and then everything is summarized, copied, and shared with
the district council and store in both places. This increases the risk of PII being accessed by unauthorized
personnel.
• No facility staff indicated specific policies that exist which mitigate unauthorized access to PII.
Data policies Ideal States Score Details
There is awareness of external data privacy and Evidence of significant Limited awareness from
security regulations (e.g. GDPR). obstacles staff.
Formal policies, including trainings, exist to enforce Unfavorable condition, Trainings exist, but
privacy and security of personal information in but no evidence of policies are still unclear.
datasets. significant obstacles
Standards and policies exist for data archiving and Evidence of significant Limited awareness from
digital preservation once it has ceased to be used obstacles staff.
operationally.
Standard roles and responsibilities have been Unfavorable condition, Roles have been
assigned for data management. but no evidence of assigned, but it is too
significant obstacles burdensome for staff to
do efficiently.
Procedures exist for ensuring that no personally Unfavorable condition, Staff understand keeping
identifiable data are shared with inappropriate but no evidence of personal information
personnel or others outside the institution. significant obstacles secure, but procedures
are unclear.
Institutional structures and charts clearly identify Unfavorable condition, Roles have been
positions that have data management responsibilities but no evidence of assigned, but it is too
at each reporting level. significant obstacles burdensome for staff to
do efficiently.
24Conclusions and Next Steps
This analysis identified major challenges that exist with rural health facilities in Tanzania, but it
also revealed significant opportunities for investment in data usage practices to have
meaningful impact. The Flow Mapper analysis showcased a vibrant information sharing system
between facilities and their community leaders, validating one of the goals from the DHFF
program. Interviews and group discussions, however, highlighted major obstacles that exist for
many facilities. Unreliable infrastructure including poor electricity and access to water make it
challenging for staff to enter and manage data consistently. Limited staff capacity to access
standard database systems and draw meaningful insights discourage data usage and learning for
improvements. Inconsistent data security policies enhance risk and liability of patient infor-
mation being accessed by unauthorized personnel. Based on these findings and consultation
with facility staff, the below recommendations would be a valued investment for all facilities
across the Kyela District.
• Invest in capacity building programs for facility staff (at least two for every facility) that
actively engage with data. To start, provide resources and training on basic data
management practices and how to use required software like PlanRep, FFARS, and
GOTHOMIS. Then, provide resources and training on the actionable skills of identifying
insights from data collected and how those insights can inform decisions.
• Develop a user guide for staff on the “life cycle” of data they will encounter. By providing
staff with step-by-step guidance from how they collect data, enter it into a certain system,
and then use it to inform discussions and decisions will establish consistency among facility
staff’s capacity.
• Invest in resources for staff to adequately collect and manage their data. This includes
providing every facility with at least two computers with the required systems installed and
improving facility infrastructure to have more reliable electricity, water, and internet
connection.
• Establish a data protection policy for facilities to have consistency in who accesses
patient information, how it is stored, and how to dispose of hard and digital copies once it is
no longer needed.
Health facilities in Kyela are well positioned to succeed using the DHFF program to improve
community participation and autonomy of healthcare service delivery, but they are ill-equipped
to improve efficiency and effectiveness for higher quality, local care. Improving the capacities
and resources for facilities to enhance their data usage brings more insight to routine
discussions, and more efficiently address community needs. Additionally, developing a data
culture that fosters continuous learning can identify future challenges and inform systemic
improvements, but it demands local buy-in.
The recommendations in this report are high-level and resonate across all facilities, but they do
25not address the specific and unique challenges that each facility faces. The Facility Action Plan,
the final and most critical component of the Data Compass tool, is the next step to develop
clearer improvements for each facility and foster local buy-in to enhance data usage in their
operations. Reliable infrastructure, enhanced technical capacity for facility staff, and consistent
data security policies are all vital to achieving the goal of the DHFF program and will be dis-
cussed in these Facility Action Plans, but each facility needs to approach addressing those im-
provements based on their own capacities and priorities.
This report highlights how policy and procedure improvements need to be accompanied with
capacity and infrastructure improvements to achieve their intended goals when working with
sub-national institutions. DHFF positively structured institutional processes for rural facilities
to be more autonomous and address community needs, but the lack of capacity development
and infrastructure improvements to accompany this decentralization pose significant challenges.
Investments should be made in both these spaces for the DHFF program to achieve its desired
goal - improve community participation and autonomy, efficiency, and effectiveness of availa-
ble resources and ultimately improve the quality of care at the local level.
26Annex A:
Expanded Methodology
This expanded methodology outlines important contextual details about health facilities in
Kyela, how IREX adapted data collection tools used to inform the findings in this report, and
key biases and limitations to consider from the overall process.
Stakeholder and system mapping
In total, there are 31 health facilities in Kyela consisting of one district hospital (staff of 50+),
one health center (staff of 10-15) and 29 dispensaries (staff of 2-5 each) that follow the same
planning, financial reporting and service delivery procedures. Based on the theory of change
framework from the DHFF program’s implementation, the following were key effects and
outcomes envisioned:
• Increase autonomy for each facility over resource allocation.
• Invest in facility infrastructure and supplies.
• Increase engagement with community to be more responsive to local needs.
• Improve the quality of local healthcare services.
To achieve these outcomes, a variety of actors, datasets, and systems engage with each other to
inform inputs and make decisions. While this report will not dive into the specific procedures of
DHFF, it is important to understand each of the components that make up this data eco-system.
Actors, or stakeholders, include all the people or institutions that engage within the system,
sharing information and making decisions. Datasets indicate the different types of information
that is collected, manipulated, analyzed, and shared within the system. Database systems are
where data is entered, and datasets are stored. Figures 11 and 12 on the following page provide
descriptions of the key actors, datasets, and database systems that compose this specific data
ecosystem.
27Actors Figure 11: Actors by institution
• Facility in charge: Lead administrative
official at each facility.
• Data Clerk: Data management lead (only
at District Hospital and Health Center).
• Council Health Management Team
(CHMT): District Council representatives
that support planning process.
• Health Facility Governing Committee
(HFGC): Community representatives that
work closely with facility staff during the
planning processes to structure facility
priorities to meet local needs.
• Other facility staff: Doctors, nurses and
other facility staff
Figure 12: Datasets
Datasets (with respective supporting database systems)
• Expenditure reporting: Data that
informs financial requests input into
FFARS.
• Service delivery reporting: Data that
informs facility service reporting
consolidated in the GoT-HoMIS, DHIS2
and ILS systems and MTUHA monthly
reports.
• Planning requests: Data that informs the
planning process inputs into PlanRep.
Databases
• Facility Financial Accounting and
Reporting System (FFARS): An
accounting system connected to PlanRep
that facilities submit funding requests based on the activities outlined in the annual plan.
• PlanRep: A planning system connected the FFARS that facilities update their planned
activities for the year. Funding requests are only approved if they are linked to an activity in
PlanRep.
• Government of Tanzania Hospital Management Information System (GoT-HoMIS): A
database system that is interoperable with DHIS2 and ILS and consolidates patient infor-
mation to track of health facility services.
• District Health Information System 2 (DHIS2): A database system that consolidates ser-
vice delivery and allows for analysis at different levels of the health system.
• Integrated Logistic System (ILS): Pharmaceutical and medical supply request system con-
nected to FFARS and verified once funding is approved.
• MTUHA Monthly Reports: Monthly summary of individual MTUHA reports that collect
direct patient and service delivery information in hard copies.
28Data Collection
To inform the scoring process, data collection activities were conducted by the IREX team in
partnership with the Tanzania Data Lab between September and October 2020. The Key In-
formant Interviews and Group Discussions were facilitated around a comprehensive question-
naire that IREX staff designed to directly inform each Ideal State. These interviews and discus-
sions provide valuable context and understanding of the opportunities and challenges that exist
among facilities. The Flow Mapper Survey is an IREX software developed in partnership with
Tehamalab, a data science consultancy firm in Tanzania, which has a unique logic function al-
lowing respondents to indicate their dataflow practices - which type of information they engage
with and how it is received, accessed, and shared. When responses from this survey are mapped
out in a dataflow analysis, it provides valuable insights into the degree of activity that exists
within a data eco-system. Each activity occurred in the order indicated in figure 13 to help in-
form and develop the activity that follows.
Figure 13: Data Collection Activities
* Facility staff included doctors, nurses, and administrators that actively engage in data
management processes.
Key Informant Interviews (KII)
One-on-one interviews are the first step in the data collection process and an opportunity to
have an in-depth discussion with staff about each of the Dimensions and Ideal States from
diverse facilities. This discussion helps flag any areas of concern to follow up on in the group
discussion and consider any minor adjustment to the survey tool if new data sources or actors
are identified. A total of five staff were interviewed, each representing a different facility
(district hospital, health center, and three dispensaries), and each discussion lasted between 90
minutes to two hours. While these interviews were adapted to Whatsapp to accommodate the
travel restrictions in place during the month of September 2020, an ideal KII would incorporate
an in-person site visit and observation to validate user practices.
29You can also read