Need for Government Support for Public Bus Transport - BMTC - cstep
←
→
Page content transcription
If your browser does not render page correctly, please read the page content below
Need for Government
       Support for Public Bus
                   Transport

BMTC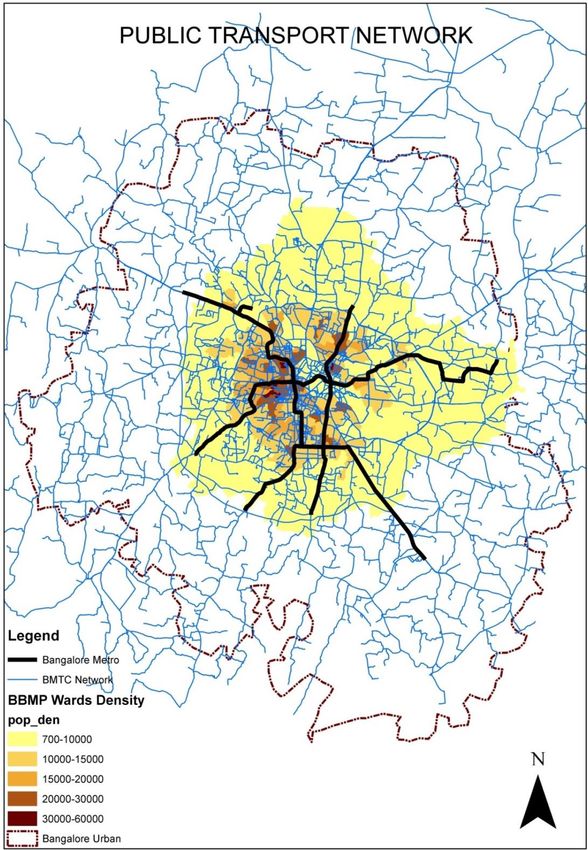
Need for Government Support for Public Bus
               Transport

                          Team Members

                    Anantha Lakshmi Paladugula
                           Sujaya Rathi
                        Vivek Vaidyanathan

         Center for Study of Science, Technology and Policy

                            May, 2015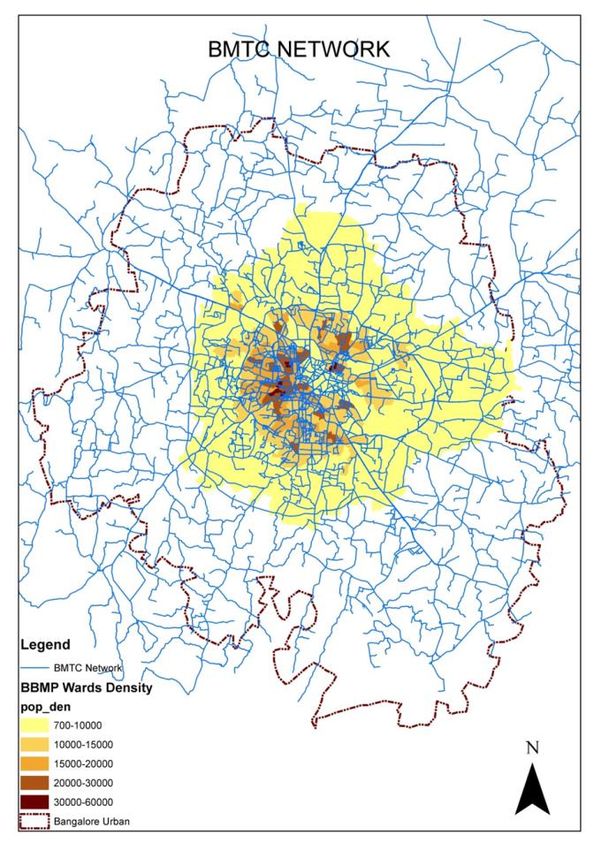
Center for Study of Science, Technology and Policy (CSTEP) is a private, not-for-profit (Section 25)
Research Corporation registered in 2005.

Designing and Editing by CSTEP
Disclaimer
While every effort has been made for the correctness of data/information used in this report, neither the
authors nor CSTEP accept any legal liability for the accuracy or inferences for the material contained in
this report and for any consequences arising from the use of this material.

© 2015 Center for Study of Science, Technology and Policy (CSTEP)

No part of this report may be disseminated or reproduced in any form (electronic or mechanical) without
permission from CSTEP.

May 2015

This report should be cited as: CSTEP (2015). Need for Government Support for Public Bus
Transport (CSTEP-Report-2015-05)

Center for Study of Science, Technology and Policy
# 18, 10th Cross, Mayura Street,
Papanna Layout, Nagasettyhalli, RMV II Stage,
Bangalore – 560094, Karnataka, INDIA
Tel.: +91 (80) 6690-2500
Fax: +91 (80) 2351-4269
Email: cpe@cstep.in
Acknowledgement

This report is based on the knowledge partner collaboration between Bangalore Metropolitan
Transport Corporation (BMTC) and Center for Study of Science, Technology and Policy (CSTEP,
Bengaluru) for conducting studies on urban transport in Bengaluru, and Karnataka. The report
was authored by the technical team of CSTEP, Bengaluru - Anantha Lakshmi Paladugula, Sujaya
Rathi and Vivek Vaidyanathan. The authors would like to express their gratitude to BMTC -
Managing Director, Dr Ekroop Caur for the immense support during the study. The authors
would like to thank C.G Anand, Chief Mechanical Engineer, BMTC for helping with the data
requirements. The authors would like to acknowledge research support of Sonali Anusree from
CSTEP. Finally, we would like to extend our sincere gratitude to the Communication and Policy
Engagement team at CSTEP for editorial support.
Table of Contents
Executive Summary ......................................................................................................................................................... 1
1       Background and Scope of this Study............................................................................................................... 2
2       The Role of Public Transport ............................................................................................................................. 3
3       Choice of Different Modes of Public Transport –Impact......................................................................... 6
    3.1          Energy and Emissions ................................................................................................................................. 6
    3.2          Cost...................................................................................................................................................................... 9
        3.2.1             Key Features of Metro Rail Systems in India......................................................................... 10
    3.3          Spatial Coverage ......................................................................................................................................... 10
4       Fiscal Policies related to Public Transport ................................................................................................ 11
    4.1          The Conflict in Policy and Fiscal Measures...................................................................................... 11
    4.2          Public Transport Fiscal Measures – Inconsistencies ................................................................... 14
5       Public Transport in Bangalore ....................................................................................................................... 16
    5.1          Public Transport System, Bangalore – Scenario 1 ........................................................................ 18
        5.1.1             Investment requirements for BMTC @ Scenario 1 ............................................................. 19
    5.2          Public Transport System, Bangalore – Scenario 2 ........................................................................ 19
        5.2.1             Investment Requirements for BMTC @ Scenario 2 ............................................................ 20
    5.3          Public Transport System, Bangalore – Scenario 3 ........................................................................ 20
        5.3.1             Investment Requirements for BMTC @ Scenario 3 ............................................................ 21
    5.4          Summary of Scenarios – An Overview............................................................................................... 21
6       Case of Bangalore Metropolitan Transport Corporation (BMTC) ................................................... 24
    6.1          Performance of BMTC Public Transport Facilities ....................................................................... 27
        6.1.1             Operational and Financial Performance ................................................................................. 27
    6.2          Initiatives by BMTC and how they connect with National Urban Transport Policy....... 30
7       Conclusion............................................................................................................................................................... 32
8       Recommendations ............................................................................................................................................... 32
9       Way Forward ......................................................................................................................................................... 33
References ........................................................................................................................................................................ 33
List of Tables Table 1: Mode Wise Parameters Comparison................................................................................................... 10 Table 2: Key Features of Metro Rail Systems in India – Comparison ...................................................... 10 Table 3: Taxes paid by Car and Bus Comparison ............................................................................................. 14 Table 4: RTO fees of New Registration of Vehicles in Karnataka .............................................................. 14 Table 5: Urban Rail Transport Investments in India ...................................................................................... 15 Table 6: DTC and Delhi Metro Tax Comparison................................................................................................ 15 Table 7: Taxes paid by BMTC.................................................................................................................................... 16 Table 8: List of Scenarios........................................................................................................................................... 18 Table 9: Scenario 1- Public Transport Share...................................................................................................... 18 Table 10: Scenario 1 – Investment Requirement ............................................................................................. 19 Table 11: Scenario 2 - Public Transport Share .................................................................................................. 19 Table 12: Scenario 2 - Investment Requirement .............................................................................................. 20 Table 13: Scenario 3 - Public Transport Share .................................................................................................. 20 Table 14: Scenario 3 - Investment Requirement .............................................................................................. 21 Table 15: Modal Split of Metros across the World ........................................................................................... 22 Table 16: BMTC Key Statistics .................................................................................................................................. 24 Table 17: Level of Service - Bangalore Public Transport .............................................................................. 27 Table 18: Initiatives by BMTC in line with NUTP ............................................................................................. 30 Table 19: Method of Financing Public Transport............................................................................................. 33 List of Figures Figure 1: Total fleet of BMTC ....................................................................................................................................... 2 Figure 2: Annual Crude Oil Use & CO2 Emissions ................................................................................................ 4 Figure 3: Effects of non-investments in public transport ................................................................................ 6 Figure 4: Construction and Maintenance Energy Requirement (TJ/km) - Mode of Transport ....... 7 Figure 5: Construction and Maintenance CO2 Emissions - Mode of Transport....................................... 7 Figure 6: Energy Consumption (KJ/PKM) .............................................................................................................. 8 Figure 7: Energy Consumption (TJ/PKM) and TJ- Mode of Transport ....................................................... 8 Figure 8: CO2 Emissions (Grams/PKM) ................................................................................................................... 9 Figure 9: CO2 Emissions (Tonnes) - Mode of Transport ................................................................................... 9 Figure 10: Spatial Coverage for 1 Billion USD - Bangkok Case ................................................................... 11 Figure 11: Registered Vehicles share in India (2012) .................................................................................... 12 Figure 12: Registered Vehicles share in Bangalore (2012) ......................................................................... 12 Figure 13: Percentage share of cost of projects sanctioned under JNNURM – 2014......................... 13 Figure 14: BMTC and Bangalore Metro Public Transport Network ......................................................... 17 Figure 15: BMTC Additional Fleet Requirement across Scenarios ........................................................... 21 Figure 16: BMTC Cost of Procuring Additional Bus Fleet across Scenarios .......................................... 22 Figure 17: Public Transport Network – Bangalore.......................................................................................... 23 Figure 18: BMTC Network Coverage ..................................................................................................................... 26 Figure 19: Physical Parameters of State Road Transport Undertakings (STRUs) .............................. 28 Figure 20: No. of Kilometres serviced (Lakh) - BMTC .................................................................................... 29 Figure 21: Passengers Carried (Lakhs) - BMTC ................................................................................................ 29 Figure 22: Staff Cost and Fuel Cost - BMTC......................................................................................................... 30 Figure 23: Investment required year-wise – BMTC ........................................................................................ 31
Abbreviations

AMTC            Ahmedabad Municipal Transport Services
BBMP            Bruhat Bangalore Mahanagara Palike
BEST            Brihanmumbai Electricity Supply and Transport Undertaking
BMR             Bangalore Metropolitan Region
BMRCL           Bangalore Metro Rail Corporation Limited
BMTC            Bangalore Metropolitan Transport Corporation
BPKM            Billion Passenger Kilometres
CNG             Compressed Natural Gas
CSTC            Calcutta State Transport Corporation
CSTEP           Centre for Study of Science Technology and Policy
CTU             Chandigarh Transport Undertakings
DTC             Delhi Transport Corporation
GHG             Green House Gases
GoI             Government of India
GoK             Government of Karnataka
ITS             Intelligent Transport Systems
JICA            Japan International Cooperation Agency
JNNURM          Jawaharlal Nehru National Urban Renewal Mission
LRT             Light Rail Transport
MoUD            Ministry of Urban Development
MTC             Metropolitan Transport Corporation of Chennai
NUTP            National Urban Transport Policy
PKM             Passenger Kilometres
PMPML           Pune Mahanagar Parivahan Mahamandal Limited
TTMC            Traffic and Transport Management Centres
Need for Government Support for Public Bus Transport
Executive Summary
With increasing trends in road congestion, air pollution, energy demand and emissions, there is
a need to look for effective solutions to meet the urban transport demand in Bangalore.
Investment in public transport is imperative. Buses are the cheapest, relatively energy and
emission efficient form of public transport systems which can be proposed to provide service to
the core and peripheral areas in a shorter time span. Bangalore Metropolitan Transport
Corporation (BMTC) with good network coverage in Bangalore Urban district and as well as
some areas in Bangalore Rural district needs to be supported to provide better service.
BMTC with an existing ridership of 50 lakh passenger trips per day should be able to serve the
projected demand in order to maintain the current mode share of public transport. To maintain,
improve and increase the public transport share of the city, the bus system needs to be
upgraded and the fleet needs to be augmented significantly. BMTC and Bangalore Metro Rail
with their collective network can contribute to an effective and integrated public transport
system in Bangalore. The imperatives for sustained investments in a bus system are listed
below:
1. Investment requirement for buses is much less, and network coverage is higher
than other transport modes like Light Rail, Mono Rail and Metro Rail
2. Ridership estimates are realised in a very short time, and modifications (extension,
re-routing, etc.) can be incorporated easily (as a city grows, new activity centers
emerge)
3. Other mass rapid transport infrastructure has a risk of lock-in (money, time and
space) and needs careful analysis of alternatives
4. Existing right of way can be utilised quickly (instead of dedicated lane systems in
some cases)
5. Operational and maintenance costs are relatively less than other modes of urban
public transport
6. Acts as a complimentary network with mass rapid transport systems such as
Bangalore Metro Rail
7. GHG and local emission reduction due to reduction in the personal vehicle kilometers
8. Reduces fuel consumption.
Recommendations
Support for existing bus system which has high network coverage in Bangalore and serving 50
lakh passenger trips per day is important. The following points are recommended:
Innovative financial strategies other than fare box revenues need to be explored to
meet the cost involved in providing a long-term service (land monetization, advertising,
consultancy)
Need for dedicated budget allocation (for capital cost of buses) to ease the financial
burden on BMTC and also to meet the future ridership demand
Promotion of fiscal incentives (Central Excise, exemption from Motor Vehicle Tax,
exemption from VAT)
Need to move toward energy efficient technology solutions (CNG, Electric, ITS).
1Need for Government Support for Public Bus Transport
1 Background and Scope of this Study
The Bangalore Metropolitan Transport Corporation (BMTC) is a government organisation that
operates the public transport bus service in Bruhat Bangalore Mahanagara Palike (BBMP) area
and parts of the Bangalore Metropolitan Region (BMR). At present, BMTC is one of the better
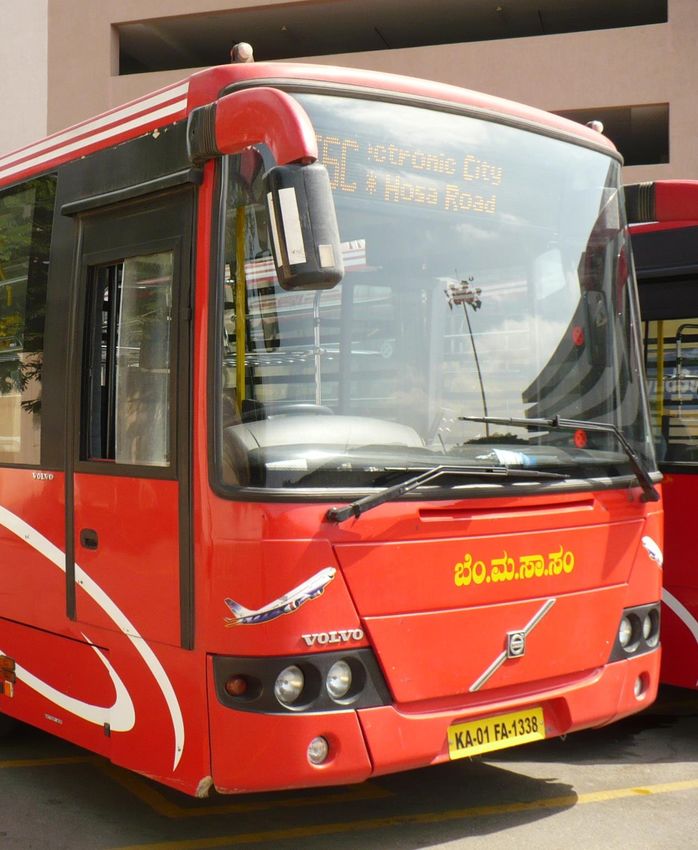
run bus transport systems in the country. BMTC operates approximately 2440 routes with a
fleet of about 6775 buses catering to approximately 45-50 lakh passenger trips per day. The
trend in increase of the bus fleet size over the years is shown in Figure 1. It is expected that by
2021, at least 67 lakh passenger trips per day have to be served by buses only. In addition to
Bangalore city, BMTC provides transport services to areas such as Hoskote, Anekal, Kengeri,
Magadi, Nelamangala, Dodaballapur and Devanahalli.
Total Fleet
7000
6775
6800
6600 6431
6400
6150
6200 6074
6000
5800
5600
2010-2011 2011-2012 2012-2013 2013-2014
Total Fleet
Figure 1: Total fleet of BMTC
Source: BMTC data provided to CSTEP
BMTC has been upgrading its services,
Requisites to make public transport a
through increase in fleet size, improved
preferred mode choice:
buses, better customer service, etc.
• Reliable - high frequency, timely service
However, to make bus public transport a
• Flexible - rational routing systems, adaptive to
mode of choice, there is a need for change in urban densities
constant up-gradation and it should be • Comfortable - comfort in aspects of entry/exit,
kept in mind that some of these costs of seating, leg space, ventilation and other
upgrades are based on market rates, aspects, buses which provide accessibility for
which ideally should not be passed on to the differently-abled
the customer, through frequent bus fare • Affordable - To various socio economic groups
hikes. BMTC was known to be the one • Energy and emission efficient
organisation that earned operating profits, • Seamless connectivity to other transport/para-
transport modes - Use of Intelligent Transport
though in the last two years this has
Systems
changed and they have incurred
• Integrated planning (last/first mile
significant losses. There is a need for state connectivity) - Feeder systems, accessible bus
government to support for the required stops
up-gradation of services, and fleet
enhancement for BMTC.
2Need for Government Support for Public Bus Transport
In this context, BMTC, Government of Karnataka has requested Centre for Study of Science,
Technology and Policy (CSTEP) to assist in proposing a case for justification for Government
support for BMTC.
Based on the above requirement, CSTEP conducted an independent assessment for the above
within the given time frame. The assessment is based on secondary information, and primary
data/information made available by BMTC.
The following sections present a summary of findings by CSTEP from the interactions with
BMTC.
2 The Role of Public Transport
The National Urban Transport Policy (NUTP) has long recognised transport as a public benefit.
Around the world, nowhere passenger fares are expected to fully cover operating costs, much
less capital costs. Public transport replaces congestion and pollution, otherwise generated by
low-occupancy private cars. It thus conserves fuel, and it provides an affordable option of
transportation. It is crucial to people without vehicles or to vehicle owners when their regular
transport modes are unavailable. Accessible transport helps differently-abled persons and
senior citizens and those with reduced mobility to lead a more independent life. The social
benefits of public transport cannot be denied, and all this come at a cost to the public transport
authority.
The urban population in India is growing, along with motorisation rates. The growth in the
number of registered motor vehicles in India during 1981-2011 was about 26 times while the
population increase and urban population increase was about 1.8 times and 2.4 times
respectively. Motorised two-wheelers occupy the dominant share in a city’s vehicular fleet.
Public transport systems have proved inadequate to help reverse the motorisation trends. By
and large, BMTC, Chandigarh Transport Undertakings (CTU) and Metropolitan Transport
Corporation of Chennai (MTC) have tended to perform well in the public transport systems.
BMTC was known to be the one organisation that earned operating profits, though in 2012-13
even they incurred losses. In fact, in many cases, the inability to replace old vehicles through
fleet renewal has led to poor services and informal private operators taking over the role of
providing urban public transport services.
A study by the Institute of Urban Transport (IUT) and CSTEP anticipates that the passenger
travel demand from urban areas (cities with population > 1 lakh) would double by 2021(1448
BPKM) and triple by 2031 (2315 BPKM). Energy consumption by the urban transport sector is
likely to increase dramatically in the coming decades. This will impact the quality of life in cities
and increase dependency on oil imports, thus threatening our energy security. Focus on high
cost transport projects have not eased the growing motorisation rates. Air pollution, fuel
consumption and the impact on our import bill have been severe. Clearly, the situation will only
get worse.
The same study reveals that the annual fuel consumption from urban transport (cities with
population > 1 lakh) will increase by two times by 2021 and four times by 2031 in the Business
3Need for Government Support for Public Bus Transport
As Usual (BAU) scenario. The scenario analysis in this study highlights that Scenario 3 which
focused on efforts towards increasing the share of public transport, makes the highest impact in
reduction of energy consumption, and emissions. The same scenario is best when compared to
fairly aggressive strategies such as ‘urban structure control’ and ‘’form control’ that is unlikely
to be realised in a short to medium term. The scenarios considered in the IUT and CSTEP study
“Review of Urban Transport in India, 2014” are described in detail below:
Scenario 1- represents the future based on the existing trends, BAU.
Scenario 2- considers improvement in Non-Motorized Transport (NMT) infrastructure with the
assumption of increasing the modal share of NMT modes by 10%.
Scenario 3- presumes an increase in public transport mode share, through improvements in
public transport systems.
Scenario 6A & 7 –concentrate on improving urban structure, form control and in essence are
extremely aggressive and relatively long-term strategies to cut down crude oil consumption and
reduce CO2 emissions.
Figure 2: Annual Crude Oil Use & CO2 Emissions
Source: (CSTEP & IUT, 2014)
Figure 2 demonstrates investments in public transport are imperative. It also shows that in the
short-term it is relatively easier to move towards an increase in public transport share
4Need for Government Support for Public Bus Transport
primarily aided by investments in bus-based systems and a comprehensive transport network
comprising different public transport modes.
Impact of increase in public transport - Scenario 3
An intervention, specifically Scenario 3 would lead to the following outcomes as against the BAU
(Scenario 1)
Annual Passenger Vehicle Kilometres (BPKMS)
Decrease by 36% in 2021 from BAU scenario
Decrease by 50% in 2031 from BAU scenario
Annual Crude Oil Use (Million Barrel)
Decrease by 24% in 2021 from BAU scenario
Decrease by 38% in 2031 from BAU scenario
Annual Emissions –CO2
Decrease by 34% in 2021 from BAU scenario
Decrease by 43% in 2031 from BAU scenario
Figure 3 demonstrates the need for sustained investments in a dedicated bus transport system
without which there is a cyclical effect on urban transport and other important sectors. A lack of
available funding has many cataclysmic effects including increased maintenance costs of the
existing fleet, which in turns reduces the budget to purchase additional fleet. A lack of regular
maintenance would also have a direct impact on the reliability of bus (frequency and timings).
Finally, even those who would like to use the bus system would be forced to move to other
modes of transport including private modes of transport which proliferate among cities and
result in high pollution, congestion and other forms of economic loss. Thus investments in
public transport should be a priority.
5Need for Government Support for Public Bus Transport
Lack of available
funding for Bus
systems
Need for recurring Crisis in the delivery
investments in road of safe and reliable
infrastructure bus service
Low maintenance, old
fleet
Congestion, pollution, high
energy consumption high
travel times- economic loss
Increased
maintenance costs
Shift to personal
modes of transport
Less funds for
purchase of newer
and more efficient
buses
Bus systems less
attractive Impacts frequency
and reliability of
buses
Figure 3: Effects of non-investments in public transport
3 Choice of Different Modes of Public Transport –Impact
Public transport systems require high investments and have a long lock in period. Thus
decisions regarding investments require a careful analysis, looking at different alternatives and
their impacts on various development parameters (improving mobility spatially, environmental,
economic and financial impacts, including induced effects of better transport infrastructure).
3.1 Energy and Emissions
According to a TERI study titled “Life cycle analysis of transport modes”, it is evident that bus-
based solutions emerge as the most efficient and low emission generating mode. The different
transport modes compared in the study are rail, bus and metro rail. The energy requirement per
km of bus lane during construction and maintenance is less compared to others as shown in
Figure 4.
6Need for Government Support for Public Bus Transport
120 Energy (Tera Joules (TJ)/PKM)
104.4
100
80 72.8
60
Construction
39.1 Maintenance
40
31.3
27.8
20.1
20 16
12 12.3
8.8
0
Rail (single line) NH (4-lane with City road (6- BRTS (Bus lanes Metro rail
service road) lanes BRTS with only) (double track)
service road)
Figure 4: Construction and Maintenance Energy Requirement (TJ/km) - Mode of Transport
Source: (TERI, 2013)
CO2 emissions (tonnes per km) during construction and maintenance of bus lane are less
compared to others as shown in Figure 5.
Energy (TJ)
12000
9996.5
10000
8000
6000
4594.3 Construction
4000 3442.4
2439.5 Maintenance
1892.2
2000 1294.3 1072.9
371.7 446 792
0
Rail (single line) NH (4-lane with City road (6-lanes BRTS (Bus lanes Metro rail
service road) BRTS with only) (double track)
service road)
Figure 5: Construction and Maintenance CO2 Emissions - Mode of Transport
Source: (TERI, 2013)
Embodied energy consumption for rolling stock and embodied CO2 of rolling stock comparison
are given in Figure 6 & 7. Energy consumption (Kilo Joules/PKM) is less for urban bus systems
(e.g. Bangalore) by 2 times when compared to two wheelers and 10 times with car (all fuel
types).
7Need for Government Support for Public Bus Transport
Energy Consumption(Kilo Joules/PKM)
2500 2343.3 2293.3
2000 1870
1500
1000
554.1 467.5
500 194.2 270.2 213.9 215.6 221.9
86.4 107.6 50.7
0
Urban bus (diesel)
Urban bus (diesel)
Petrol car
BRTS (Non-AC bus)
Rail (diesel) (traction
CNG car
BRTS (AC bus)
Two wheeler
Diesel car
Urban bus (diesel)BEST
Long distance bus (diesel)
Rail (electric) (traction
Metro rail-Delhi
Bangalore
Chennai
only)
only)
Figure 6: Energy Consumption (KJ/PKM)
Source: (TERI, 2013)
Energy -TJ
10 9.2
8
6
4
4
2
2
0.1 0.2
0
Bus Train (per coach) Metro rail (per Car (petrol) Car (diesel)
coach)
Figure 7: Energy Consumption (TJ/PKM) and TJ- Mode of Transport
Source: (TERI, 2013)
8Need for Government Support for Public Bus Transport
CO2 Emissions (Grams/PKM)
188.6
200
180 146
160 138.1
140
120
100
80
60 36.9 36.5
40 19.7 10.8 21.8 17.2 17.4 11.4 17.9
8.7
20
0
Urban bus (diesel)
(diesel)BEST
Urban bus (diesel)
Long distance bus
Petrol car
CNG car
Rail (diesel) (traction
BRTS (Non-AC bus)
BRTS (AC bus)
Two wheeler
Diesel car
(traction only)
Metro rail-Delhi
Rail (electric)
Urban bus
Bangalore
(diesel)
Chennai
only)
Figure 8: CO2 Emissions (Grams/PKM)
Source: (TERI, 2013)
CO2-Tonnes
600
483.3
500
400
300
211
200 162
100
11.8 13.1
0
Bus Train (per coach) Metro rail (per Car (petrol) Car (diesel)
coach)
Figure 9: CO2 Emissions (Tonnes) - Mode of Transport
Source: (TERI, 2013)
CO2 Emissions (g/PKM) is less for urban bus systems (Bangalore) by 2 times when compared to
two wheelers and 9 times with car (all fuel types) as shown in Figures 8 &9. The energy
consumption and CO2 emissions during construction, maintenance and operation phases of the
bus system are relatively less when compared to other modes of transport.
3.2 Cost
Costs associated with commuter rail, Metro-rail, Monorail, LRT, BMTC bus are compared in
Table 1 based on station spacing, seated capacity of mode, total carrying capacity, approximate
Operation and Maintenance cost (O&M) cost per km and also approximate capital cost per km.
9Need for Government Support for Public Bus Transport
Table 1: Mode Wise Parameters Comparison
Transport Commuter Metro Monorail LRT BMTC
Mode Rail
Station Spacing 3 -15 km 1 - 2 km 1 km 1.5 km 0.5 km
(Approx.)
Seated Capacity 90-185 per 60-80 per car 25 - 45 per 65-85 40 Standard;
car car per car 75 Articulated;
125 Double
Articulated
Total Capacity - 100 – 250 per car 50 - 100 per 75 – 225 50 – 100
car per car Standard
App O & M Cost 40-60 Lakhs 100-200 Lakhs 40-60 Lakhs 50-60 ~2.8 Lakhs **
per km Lakhs
App Capital 80 Crores 250 Crores 80 Crores 150 ~42 Lakhs per
Cost per km (Elevated) Crores bus***
(Rupees) 550 Crores
(Underground)
Source: BMTC data provided to CSTEP
(**Calculation: Rs 44/km/day/bus – buses per day -6473, *** Average cost of bus (all types)
3.2.1 Key Features of Metro Rail Systems in India
The capital costs, daily passengers, planned length of different metros in Indian cities are given
in Table 2. It can be observed that the cost per kilometre was as high as Rs. 232 crore per km in
case of Bangalore Metro Rail. Delhi Metro with an operational length of 193 kilometres caters to
about 25 lakh passenger trips per day ( Modal share – 4.1% in 2008)(Tiwari, 2011). However
the passengers served per kilometre in case of Delhi metro is only 60% of what Mumbai Metro
(Phase I) serves per km.
Table 2: Key Features of Metro Rail Systems in India – Comparison
Metro Daily Operationa Total Passenger Capital Cost/km
passenger l length Length served/k Investmen (crores)
s (lakhs) (kms) (kms) m t (crores)
Delhi Metro 25.23 192.81 193 13087 29700 154
Bangalore 0.41 14.6 112 2808 26000 232
Metro
Mumbai Metro 2.5 11.4 145 21930 25400 175
(Phase I)
Gurgaon Rapid 0.32 5.1 6 6275 1100 183
Metro
Source: (DMRCL, n.d.; Metrobits, n.d.)
3.3 Spatial Coverage
As shown in Figure 10, as in the case of Bangkok, the spatial coverage achieved by bus systems
for a certain amount of investment is much higher than any other public transport mode.
10Need for Government Support for Public Bus Transport
426 kilometres of BRT 40 kilometres of LRT
14 kilometres of elevated rail 7 kilometres of subway
Figure 10: Spatial Coverage for 1 Billion USD - Bangkok Case
Source: (ENOTRANS, n.d.)
Bus systems are cost-effective, and relatively more energy and emission efficient compared to
other modes of transport. The spatial coverage of the bus networks is generally denser than
other modes of transport, and the flexible nature of this system is an advantage. It serves urban
and sub-urban areas as the primary mode of transport in major cities in India and complements
the mass rapid transport system such as metro.
4 Fiscal Policies related to Public Transport
4.1 The Conflict in Policy and Fiscal Measures
Rapid increase in the growth rate of two wheelers and car population has been the current
trend in Indian cities. As per the statistics given by the Ministry of Road Transport and
Highways (MORTH), the total number of buses was 17 lakhs in 2012 which is only 1.5 % of the
number of registered two wheelers in India. Similarly out of the total registered vehicles in
Bangalore, buses contribute to only 0.7 % (2012). The dependency on two wheelers in India,
and Bangalore is evident from the share of buses in the total registered vehicles as shown in
Figures 11 and 12. In addition to this, the financial performance of bus transport service
providers in major cities of India (Delhi, Mumbai, Ahmedabad and Chennai) is such that they are
not able to recover the total cost incurred.
11Need for Government Support for Public Bus Transport
Percentage share of Registered Vehicles in India (2012)
1.3 0.9 Multi-axled/Articulated
0.5 1.3
2.3 Vehicles/Trucks/Lorries
1.4 0.3 2.8 Light Motor Vehicles(Goods)
3.9 2.7
Buses
10.8 Taxis
Light Motor Vehicles(Auto)
Two Wheelers
Cars
Jeeps
Omni Buses
Tractors
71.9 Trailers
Others
Figure 11: Registered Vehicles share in India (2012)
Source: (Ministry of Road Transport and Highways, 2012)
Percentage share of Registered Vehicles in Bangalore (2012)
1.1 0.2 0.1 0.5 1.9 1.8 Multi-axled/Articulated
0.2 0.7 Vehicles/Trucks/Lorries
1.1 Light Motor Vehicles(Goods)
3.3
Buses
19.4 Taxis
Light Motor Vehicles(Auto)
Two Wheelers
Cars
Jeeps
Omni Buses
Tractors
69.6
Trailers
Others
Figure 12: Registered Vehicles share in Bangalore (2012)
Source: (Ministry of Road Transport and Highways, 2012)
To promote the mobility of people over mobility of vehicles, the National Urban Transport
Policy (NUTP) encourages greater use of public transport and non-motorised transport. It also
calls for the establishment of quality focused integrated multi-modal public transport systems
in urban areas. However the fiscal incentives from Central government through Jawaharlal
Nehru National Urban Renewal Mission (JNNURM) focussed on provision of inventory in terms
of buses to urban areas to meet public transport demand; however issues concerning
12Need for Government Support for Public Bus Transport
operational costs were not considered. Alternatively, it may have been worthwhile, to provide
incentives based on strategies formulated by respective state governments for effective service
delivery. The disparities in allocation of funds is evident from the cost of projects sanctioned for
mass rapid transport projects under JNNURM’s sub mission, ‘Urban Infrastructure and
Governance’ which is 67% of the cost of projects sanctioned for roads and flyovers. The
allocation of JNNURM funds with respect to various sectors is given in Figure 13. In the case of
Bangalore, the approved cost under JNNURM, for roads and flyovers amounts to Rs. 304 crores
(Ministry of Urban Development, 2014). The financial allocation pattern so adopted does not
support the main objectives of NUTP. Moreover, as per the Bangalore Mobility Indicators 2011,
the congestion index and travel time index for the city has deteriorated, over that of 2008.
Congestion index for 2011 was 0.45, while it was 0.33 in 2008 (increase in congestion). Travel
time penalty of 69% in 2011 compared to 57% in 2008.
Percentage Share of Cost of Projects Sanctioned
Drainage/Storm Water
3.36 0.37 0.19 1.41
Drainage
1.33 Roads/Flyovers
13.49
Water Supply
0.80 8.52
Sewerage
Urban Renewal
13.80
Mass Rapid Transport
System
24.30 Other Urban Transport
Solid Waste
Management
Development of
32.44 Heritage Areas
Preservation of Water
Bodies
Parking
Figure 13: Percentage share of cost of projects sanctioned under JNNURM – 2014
Source: (Ministry of Urban Development & JNNURM, 2014)
Public transport revenue generation models implemented in major cities in India are highly fare
box revenue based which is insufficient to meet the operating and maintenance costs. In case of
Bangalore, about 89% of the cost incurred is recovered from the fare box revenue as of 2013-
2014 and the rest from non-fare box revenue. The rate per km is different for various public
transport providers in India. Bus fares in Bangalore range from Rs. 5.0 to Rs. 44.00 for ordinary
bus service where as in Chennai the range is from Rs 3.0 to Rs 14.00; however in the case of
Delhi, the fare ranges between Rs. 5.0 to Rs. 15.00. The cost per kilometre for two wheelers
works out to be cheaper (Re. 1/km)than the minimum fare charged by public transport
providers ( Rs. 5 for buses in Bangalore) (Centre for Science & Environment, 2012). In the case of
Bangalore, buses are taxed more than personal vehicles based on the traffic revenue generated.
In case of BMTC, the tax is about 5.5 % of the traffic revenue. This can be seen from Tables 3 & 4.
13Need for Government Support for Public Bus Transport
Table 3: Taxes paid by Car and Bus Comparison
Mode of Transport Bangalore Delhi Mumbai
Car Rs. 2,600/year Rs. 533 per year Rs. 9,000 (Life Time
Tax)
Bus 5.5% of traffic revenue Rs. 13,765 per year Rs. 41,000 per annum
(1.7lakhs per year)
Source: (Business Economics, 2013), BMTC data provided to CSTEP
Table 4: RTO fees of New Registration of Vehicles in Karnataka
Particulars Bus Car
Registration Fee 600 200
FC Fee 500 -
Smart Card 200 200
Total 1300 400
Road Tax 5.5% of Traffic Revenue -
Average Rs.1.7 lakhs per -
year
Life Time Tax 15 years = Rs. 26 lakhs Up to Car price of Rs. 5 lakhs (Rs. 3,575 per year)
(approx. 1.7*15) Up to Car price of Rs. 5 to 10 lakhs (Rs.7,700 per year)
Up to Car price of Rs. 10 to 15 lakhs(Rs. 18,700 per
year)
Above Car price of Rs. 20 lakhs (Rs.22,850 per year)
Source: BMTC data provided to CSTEP
BMTC pays on an average Rs. 1.7 lakhs per year per bus as part of the lifetime tax. Cars in
Karnataka with the price range up to Rs. 5.0 lakhs pay about Rs. 7,700 per year which is only 2.5
percent of the tax paid by BMTC bus which is negligible. Thus there is a disconnect between
NUTP and fiscal strategies wherein the NUTP talks about promoting public transport, but fiscal
strategies favour the use of private transport modes. Therefore funding strategies need to be
explored to maintain the share of public transport in Bangalore.
4.2 Public Transport Fiscal Measures – Inconsistencies
Mass rapid transport systems such as Metro Rail projects are capital intensive and have a longer
lock in period. NUTP recommends various financial models for funding public transport projects
in India. The financing models adopted by various metro projects in India are given in the Table
5. Gurgaon and Hyderabad are two cases where maximum funding is from private agencies.
Delhi Metro Phases I and II are one of the capital intensive projects listed in the Table 5 having
an equal share from the State and Government of India (GoI), however with a major share from
Japan International Cooperation Agency (JICA) (Goel & Tiwari, 2014).
14Need for Government Support for Public Bus Transport
Table 5: Urban Rail Transport Investments in India
Metro Project GoI (%) State JICA (%) Others (%) Total (USD
Govt. (%) Crores)
Delhi Metro Phases I & II 18 18 53 10 590
Kolkata 100 0 0 0 40
Kolkata East-West 24 30 46 0 90
Corridor
Bangalore 15 15 45 25 160
Chennai 20 20 59 0 296
Public –Private Partnerships (PPP)
Delhi Airport Express 19 19 0 62 80
Link
Mumbai Phase I 9 22 28 41 510
Hyderabad 9 0 0 91 330
Gurgaon 0 0 0 100 22
Source: (India Infrastructure Research, 2011)
Table 5 also demonstrates that if GoI can invest in metro rail and given that these are extremely
capital intensive, surely the government can also fund bus systems which cater to a significant
share of population in urban areas. It is also important that while GoI has already funded
purchase of buses under JNNURM, it might also be worthwhile to consider funding of operations
and maintenance costs as well.
A comparison of Tax Liabilities of Delhi Transport Corporation (DTC) and Delhi Metro Rail
Corporation (DMRC) is shown in the Table 6.
Table 6: DTC and Delhi Metro Tax Comparison
Delhi Transport Corporation Pays: Delhi Metro Rail Corporation Pays:
1.Wealth Tax 1.Wealth Tax
1.Taxes on acquisition of immovable DMRC is ‘exempted’ from the following
property: taxes:
a. Tax on acquisition of land (State) 1.Property Tax
b. Property Tax (Municipal Body) 2.Sales Tax
2.Taxes on acquisition of buses: 3.Works’ Contract Tax
a. VAT (State) 4.Income Tax
b. Central Excise (Centre) 5.Capital Gains Tax
c. Customs Duty in case of Imports (Centre) 6.Customs
d. Octroi (Municipal body) 7.Excise
e. Entry tax (State)
3.Taxes related to operations:
a. Excise Duty on consumables (Centre)
b. VAT on consumables (State)
c. Excise and VAT on spare parts
15Need for Government Support for Public Bus Transport
4.Tax on use of vehicles for transporting
passengers:
a. Motor Vehicle Tax (State)
5.Advertisement Tax (City)
Source: (Kharola & Tiwari, 2008)
Tax Liabilities of BMTC is shown in the Table 7.
Table 7: Taxes paid by BMTC
Tax Category BMTC
Excise Duty 10.125% on Basic Price of Chassis (as on 2014)
Motor Vehicle Tax 5.5% on Traffic Revenue Traffic (1.7 lakh/bus/year)
VAT 14.5%
Fuel Tax Rs.112.83 crores per year (Entry Tax @ 5% and Local Sales Tax @ 15.65%)
Property Tax Rs. 510 lakhs
Source: BMTC data provided to CSTEP
5 Public Transport in Bangalore
As mentioned in the earlier sections, BMTC is the backbone of public transport in Bangalore.
BMTC operates approximately 2,440 routes with a fleet of about 6,775 buses serving
approximately 45-50 lakh passenger trips per day. Till recently, it also was the only profit
making public transport entity in the country. This has subsequently changed with the entity
registering successive losses in 2012-2013 and 2013-2014. In the past few years, BMTC has
been the recipient of JNNURM funding and has been able to acquire hundreds of buses including
air-conditioned buses. While non-air-conditioned buses run on regular BMTC network, air-
conditioned buses are usually limited to the more lucrative Information Technology corridor. It
is also noticed that out of 6,700 odd buses, the operational strength is around 6,400 buses.
Recently the BMTC also had to scrap its 92 air-conditioned Marco Polo buses because of poor
performance standards (Times of India, 2015).
The other public transport service provider is Bangalore Metro Rail Corporation Limited
(BMRCL). The Bangalore Metro Rail Phase I consists of two corridors, East –West
(Baiyappanahalli Terminal to Mysore Road Terminal – 18.10 km) and North-South corridors
(Hesaraghatta cross station to Puttenahlli cross-24.20 km) with a total length of 42.30 km. Out
of the total length approximately 80% (i.e. 33.48 km) of the metro alignment is elevated and the
remaining length is an underground section. The average speed is around 34 kmph, with an
average travel time of 33-44 minutes (end-to-end). For Metro Phase I, the total cost of the
project was Rs. 11,609 crores where in GoI funding share was 25%, GoK share was 30% and
JICA share was 45% of the total cost. Bangalore Metro Rail Phase II proposed 6 alignments (4
extensions for Phase I and 2 new lines) with a total length of 72.095 kms at an estimated cost of
Rs. 26,405.14 crores.
Figure 14 below displays BMTC bus network coverage and Bangalore Metro Rail network
coverage. It can be observed that the spatial network coverage of bus network is evident in
Bangalore Urban district and few areas in Bangalore Rural district. It can also be observed from
16Need for Government Support for Public Bus Transport
the Figure 14 that a large section of the area in BBMP is not densely populated with the
population density ranging from 700 to 10,000 persons per sq.km. Only a few pockets have high
density population. From the evident low population densities, the bus network is more suitable
at the sub urban areas in BBMP area.
Figure 14: BMTC and Bangalore Metro Public Transport Network
Source: BMTC data provided to CSTEP
Based on the existing mode of public transport in Bangalore, the ridership, inventory
requirement and costs involved are projected and scenarios are worked out over the ‘Business-
As-Usual’ case. A second scenario, Scenario -2 is also represented. This scenario assumes a
reduced modal split for BMTC over the coming decades. These scenarios help to understand the
public transport mode share between the two different modes of public transport in Bangalore
and also estimate the inventory requirement and costs involved to meet the projected ridership
by BMTC. A third scenario, Scenario -3 was also considered which assumes that BMTC will
serve to 50% of the projected passenger trips per day. The scenarios considered are given in
Table 8.
17Need for Government Support for Public Bus Transport
Table 8: List of Scenarios
Scenarios Description
Scenario 1 BMTC will cater to 30% share of the projected passenger trips per day and tries to
maintain the current public transport mode share for the projected years
Scenario 2 BMTC and Bangalore Metro Rail will cater to 35% share of the projected passenger trips
per day. The public transport mode share of BMTC will decline for the projected years
(mode shift to Metro)
Scenario 3 BMTC will cater to 50% of the projected passenger trips per day. The total Public
Transport (PT) mode share will be approximately 60%
5.1 Public Transport System, Bangalore – Scenario 1
BMTC serves about 45-50 lakh passenger trips per day (2011), which is about 30% of the 2011
census Bangalore Urban population. As per the Bangalore Metro Rail Detailed Project Report
(DPR), it was projected that approximately 10.2 lakh passenger trips/day will be served during
the same period, which is about 7% of the modal share. In this scenario, the following
assumptions are considered:
a) Bangalore Metro Rail will meet approximately 10% of the projected passenger trips per
day trips
b) BMTC will cater to 30% share of the projected passenger trips per day
c) Projected Bangalore Urban population was the basis for an analysis for BMTC and
Bangalore Metro Rail passengers per day ridership.
The projected ridership for Bangalore Metro Rail and BMTC are given in Table 9 below. As per
the analysis it was estimated that BMTC has to cater to 73 lakh passenger trips per day by 2031
in order to maintain a modal share of 30%. Table 9 also reveals that if BMTC maintains its
present modal share and if Bangalore Metro Rail keeps up to its DPR ridership projections,
Bangalore would have a strong public transport position where it would cater to almost 42% of
the modal share. And once again, BMTC would provide the backbone of the public transport
services.
Table 9: Scenario 1- Public Transport Share
BMTC BMRCL (Actual Projected Best Case total PT
Year (Passenger passenger trips Ridership Coverage (BMTC +
trips per per day/ modal (Projected BMRCL) – in
day/ modal share) passenger trips per lakhs/percentage of PT
share) day/ modal share)
2011 45-50 lakhs 0.41 lakhs/ (0.2%) 10.2 lakhs/ 7% 50.41/30%
/30%
2016 56 lakhs/30% 14.8 lakhs/8.1% 71.8 lakhs/38%
2021 67 lakhs/30% 22 lakhs/9.5% 89 lakhs/39.5%
2031 73 lakhs/30% 28 lakhs/11.5% 101 lakhs/41.5%
Source: BMTC data provided to CSTEP
18Need for Government Support for Public Bus Transport
5.1.1 Investment requirements for BMTC @ Scenario 1
If BMTC has to maintain the current modal share of ~ 30%* over the coming decades, the
investment requirements are given in Table 10. Additional passenger trips per day to be served
by BMTC by 2021 will be approximately 22 lakhs, and by 2031 approximately 28 lakhs. Based
on this demand in 2021 and 2031, additional bus requirements will be approximately 3,000 &
3,250 respectively as given in Table 10. In order to finance the purchase of vehicles, BMTC
would need to invest Rs. 1,250 crores to purchase buses. Similarly by 2031, BMTC needs to
invest Rs. 1,600 crores1.
Table 10: Scenario 1 – Investment Requirement
Year Total Additional Total Additional buses Investment
passenger passenger trips Bangalore required (to cater Need in Rs.
trips to be served Population to incremental crores
served/to be (lakhs) (lakhs) passenger trips)
served
(lakhs)
2011 ~45 Base figure (~ 45 87 Base figure (~ 6100 NA
lakhs passenger operational buses
trips served/day) fleet)
2021 ~67 ~22 132 ~3000 ~ 1250
2031 ~73 ~28 144 ~3250 ~1600
Sources: (BMRDA, 2009),(Directorate of Economics and Statistics, 2013)
5.2 Public Transport System, Bangalore – Scenario 2
In this scenario, it was assumed that there will be some shift to Metro from the existing bus
share, and BMTC mode share of 30% in the projected years is likely to decline. The total public
transport mode share by BMTC and Bangalore Metro Rail is maintained at an average of 35%
approximately. In Table 11 given below, it can be observed that the mode share of BMTC is
declining and an assumption that there is an increased modal share in favour of Bangalore
Metro Rail (as projected in the DPR). As shown in Table 11, the current share of BMRCL is far
below the projections for 2011.
Table 11: Scenario 2 - Public Transport Share
Year BMTC BMRCL (projected Best Case total PT Coverage
(Passenger trips passenger trips per day/ (BMTC + BMRCL) – in
per day/ modal modal share)* lakhs/percentage of PT
share)
2011 45 lakhs /30% 0.41 lakhs/0.2% 50.41 lakhs/30%
2016 51 lakhs/28% 14.8 lakhs/8.1% 71.8 lakhs/36%
2021 56 lakhs/25% 22 lakhs/9.5% 89 lakhs /34.5%
2031 56 lakhs/23% 28 lakhs/11.5% 101 lakhs /34.5%
*Calculations based on actual BMRCL DPR projections, GoI/GoK population projections
*Current mode share assumed=30% (27% PT mode share – Bangalore Mobility Indicators, 2011 and 34% according to
MOUD, 2008 – Study in traffic and transportation policies and strategies in urban areas in India)
19Need for Government Support for Public Bus Transport
Source: BMTC data provided to CSTEP
5.2.1 Investment Requirements for BMTC @ Scenario 2
If the public transport mode share of 35% has to be met by BMTC and Bangalore Metro Rail,
where in there is a declining share of passenger trips per day served by BMTC, the investment
requirements are given in Table 12. In this case, additional passenger trips per day to be served
by BMTC by 2021 are 6 lakhs, and by 2031 approximately 11 lakhs. Based on this demand in
2021 and 2031, additional buses required are approximately 1,860 for both the time periods. By
2021 in order to purchase 1,860 buses, BMTC will need to invest Rs. 780 crores. Similarly by
2031, BMTC needs to invest Rs. 780 crores to meet the demand from 56 lakh passenger trips
per day.
Table 12: Scenario 2 - Investment Requirement
Year BMTC Additional Total fleet Additional Investment
(Passenger trips passengers to be requirement fleet required in
per day in lakhs/ served in lakhs requirement Rs. crores
modal share)
2011 45 lakhs /30% Base figure = 45 6,100 NA NA
lakhs passengers
served
2016 51 lakhs/28% 6 ~7,250 ~1,150 ~480
2021 56 lakhs/25% 11 ~7,960 ~1,860 ~780
2031 56 lakhs/23% 11 ~7,960 ~1,860 ~780
Source: CSTEP Analysis
In both the scenarios considered, there is a need to meet the projected public transport
ridership by BMTC. There is also a need to invest in an additional fleet to serve the projected
ridership. Based on these scenarios, it is evident that investment in the bus system is essential,
irrespective of maintaining the share or declining public transport share.
5.3 Public Transport System, Bangalore – Scenario 3
In this scenario, it was assumed that there public transport will be benchmarked at 60% of all
motorized passenger trips per day. BMTC is expected to have a mode share of 50% in the
projected years. As mentioned earlier this is best case scenario for public transport and BMTC.
In Table 13 given below, it can be observed that the mode share of BMTC is increasing (50%)
and an assumption that the modal share in of Bangalore Metro Rail is as projected in its DPR.
Table 13: Scenario 3 - Public Transport Share
Year BMTC BMRCL (projected Best Case total PT Coverage
(Passenger trips passenger trips per day/ (BMTC + BMRCL) – in
per day/ modal modal share)* lakhs/percentage of PT
share)
2011 45 lakhs /30% 0.41 lakhs/0.2% 50.41 lakhs/30%
2021 110 lakhs/50% 22 lakhs/9.5% 132 lakhs /59.5%
2031 122 lakhs/50% 28 lakhs/11.5% 150 lakhs /61.5%
*Calculations based on actual BMRCL DPR projections, GoI/GoK population projections
20Need for Government Support for Public Bus Transport
Source: BMTC data provided to CSTEP
5.3.1 Investment Requirements for BMTC @ Scenario 3
If the mode share of 50% has to be met by BMTC, where in there is an increasing share of
passenger trips per day served by BMTC, the investment requirements are given in Table 14. In
this case, additional passenger trips per day to be served by BMTC by 2021 are 60 lakhs, and by
2031 approximately 72 lakhs. Based on this demand in 2021 and 2031, additional buses
required are approximately 7,820 by 2021 and 9,280 by 2031. By 2021 in order to purchase
7,820 buses, BMTC will need to invest Rs. 3,503 crores. Similarly by 2031, BMTC needs to invest
Rs. 4,640 crores to meet the demand from 122 lakh passenger trips per day.
Table 14: Scenario 3 - Investment Requirement
Year BMTC (Passenger Additional Additional fleet Investment
trips per day in passengers to be requirement required in
lakhs/ modal share) served in lakhs Rs. crores
2011 50 lakhs Base figure = 50 lakhs NA NA
passengers served
2021 110 lakhs/50% 60 ~7,820 ~3,503
2031 122 lakhs/50% 72 ~9,280 ~4,640
Source: CSTEP Analysis
5.4 Summary of Scenarios – An Overview
Figure 15 and 16 represent the additional fleet requirement and the associated cost for
procuring that fleet respectively; this representation is a comparison across three scenarios
which have been described in detail in the previous sub- section. Since Scenario 3 represents a
benchmark case, the additional fleet requirement as well as the cost of procuring that additional
fleet goes up considerably.
10000 9280
9000
8000 7820
Number of buses
7000
6000
5000
4000 3500 3750
3000 2360
2000
1000
0
Scenario 1 Scenario 2 Scenario 3
2021 2031
Figure 15: BMTC Additional Fleet Requirement across Scenarios
21Need for Government Support for Public Bus Transport
5000 4640
4500
4000
3503
3500
Rs. in Crores
3000
2500
2000 1875
1568
1500 1057 1180
1000
500
0
Scenario 1 Scenario 2 Scenario 3
2021 2031
Figure 16: BMTC Cost of Procuring Additional Bus Fleet across Scenarios
In the context of public transport scenarios, specifically comparing bus systems and metro rail
systems, it might be good to compare ridership details from different transport systems world
over. This is shown in Table 15.
Table 15: Modal Split of Metros across the World
City Metro Modal split Number of Operational Bus share in Modal
as a % of all passengers length split as a % of all
modes) (lakhs) (kms) modes
Hong Kong (2011) 25% 39.6 175 55% (Bus +Tram)
Singapore (2011) 19% 21.8 150.8 25%
New York (2010) 12% 45.3 368 10%
London (2010) 10% 32.1 402 15- 20% (Bus + Tram)
Sources: (Acharya, 2013; LTA, 2011),(Transport for London, 2011)
What Table 15 reveals is that even with an extensive rail network, metro systems in cities like
London and New York don’t carry more than 10-12% of the modal split. One might also argue
that the bus systems in those cities also don’t carry more passengers. However a look at the
Singapore model or the Hong Kong one reiterates the fact that systemic investments in different
public transport modes are required. These include metro rail, bus systems, trams, and other
modes, and only integration of these modes will create a robust public transport network. Thus
in the case of Indian cities, especially Bangalore it once again points out that BMTC needs to be
supported along with the Bangalore Metro Rail.
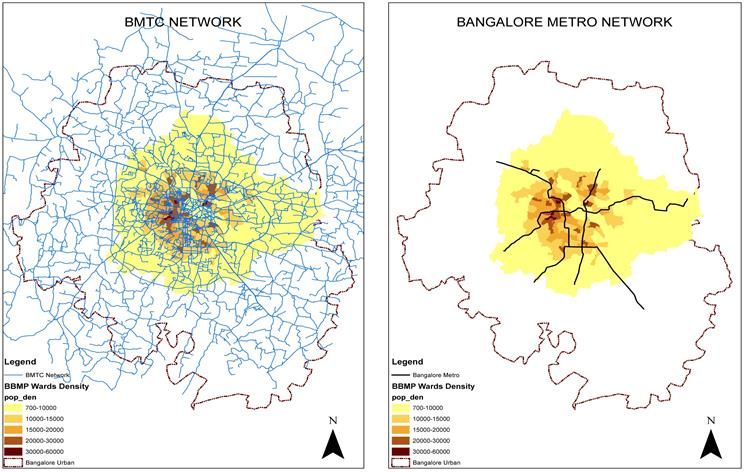
Figure 17 clearly reveals the extent of BMTC’s network coverage which as can be seen covers
not just Bangalore Urban District, but also certain parts of the outlying areas. However, it would
also be very interesting to understand deeper issues of coverage by plotting information on
frequency, bus-stops, real-time data on location of buses etc. By plotting that information, one
would get a true sense of the extensive nature of BMTC operations. As can be seen from the
Figure 17, the Bangalore Metro Rail network in some cases complements the BMTC network
(especially in those areas where BMTC already has a wider coverage) and in some other areas it
22Need for Government Support for Public Bus Transport
proposes to play a primary role especially in those outlying areas where the BMTC network
might not be so robust or saturated.
Figure 17: Public Transport Network – Bangalore
Source: BMTC data provided to CSTEP, CSTEP Analysis
23You can also read