Characterizing Photometric Flicker - Handheld Meters November 2018 - Department of Energy
←
→
Page content transcription
If your browser does not render page correctly, please read the page content below
Characterizing Photometric Flicker
Handheld Meters

November 2018

(This page intentionally left blank)

ii
Executive Summary
Temporal light modulation (TLM) is the variation of light output as a function of time, and its presence can
have adverse effects on health and visual performance (e.g., increased occurrence of migraines, reduced visual-
task performance). TLM has been the subject of recent articles primarily associated with flicker in LED
lighting. Lighting system characteristics that can affect flicker vary by technology; examples include filament
thickness for incandescent sources, phosphor persistence for fluorescent and coated metal halide sources, and
circuit designs for electronically ballasted or driven sources. The characterization of flicker, especially in the
field, is important to ensure adequate living and working conditions.

Today, various types of flicker meters are available, including high-speed and precise benchtop models for
laboratory environments and portable handheld meters that can range from simple smartphone applications in
an existing smart device to scientific grade meters that have capabilities beyond flicker measurements. In this
report, the performance of eight handheld meters capable of measuring flicker in the field is compared to a
reference benchtop meter chosen based on its performance in the initial round of meter comparisons performed
by Pacific Northwest National Laboratory (PNNL). 1

The two most commonly used metrics for quantifying flicker remain Percent Flicker and Flicker Index, though
meters today also have the capability of measuring and reporting other flicker metrics. Fundamental Frequency
is also reported by meters and refers to the dominant sinusoidal component – the one with the greatest
amplitude – of the fast Fourier transform (FFT) of the flicker waveform. For many traditional lighting sources,
the Fundamental Frequency is simply twice the input-line-voltage frequency (e.g., 120 Hz for 60 Hz AC in
North America). While less commonly reported by handheld meters, the Stroboscopic Effect Visibility
Measure (SVM) attempts to predict both the visibility and acceptability of the stroboscopic effect, a visual
artifact resulting from a light source’s TLM and motion in an environment. SVM differs from Percent Flicker
and Flicker Index in that it uses Fourier analysis to convert the light-intensity waveform from its time-domain
representation to a frequency-domain representation so that frequency dependencies for varying effects can be
accounted for by means of a weighting function. SVM does not address non-visible flicker, however, and may
not be suitable for predicting some neurological issues. Various meters were capable of reporting SVM. Thus,
it is a metric studied in this report.

Based on the previous testing of benchtop meters, the Admesy Asteria SC-ASTR-01 High-Speed Illuminance
Photometer was selected for permanent installation in an integrating sphere in PNNL’s Lighting Metrology
Laboratory. This meter served as the reference meter to which the handheld meters were compared. The
handheld meters were set up in the integrating sphere just adjacent to the reference meter. A set of 12 light
sources was selected for this study based on their being typical of a specific architectural lighting product,
exhibiting a specific waveform characteristic (e.g., amplitude modulation, shape, and frequency), and/or
because they had previously been tested and were available for re-use in this study. In order to characterize the
performance of each handheld meter, testing was completed using an integration time of as close to 2 seconds
as possible to allow for capturing metrics that require much time for their reporting. In some cases, however,
the integration time was not configurable or even known, for some meters.

Table ES. 1 and Table ES. 2present meter performance as it relates to Percent Flicker and Flicker Index,
respectively, as well as the performance at maximum and dimmed light output levels across all light sources
tested. Two meters in particular are worth mentioning to qualify the results presented, as well as the
smartphone application (i.e., Viso [App]). For the Viso meter, the results of this table include only a portion of
all light sources and dimmed levels tested, since it deemed light levels inadequate on many occasions and
would have required positioning the meter closer to the light source. The Everfine meter had limitations during
testing related to the highest frequency it could measure, which affected percent flicker, and a software bug in

1
 Pacific Northwest National Laboratory for U.S. Department of Energy, Characterizing Photometric Flicker, February 2016.
https://www.energy.gov/sites/prod/files/2016/02/f29/characterizing-photometric-flicker.pdf.

                                                                                                                           iii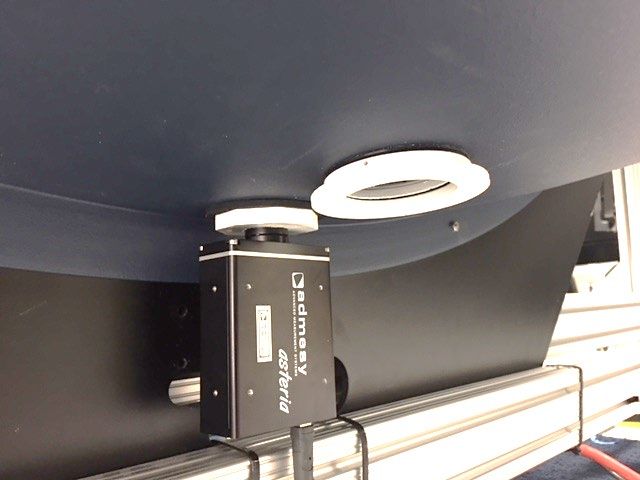
data transfer that affected flicker index. The latter issue was resolved, and limited follow-on testing confirmed
this. Lastly, the Viso Application for smartphones does not use a dedicated sensor, but rather a smartphone’s
camera, to determine flicker performance of a light source. Although the performance is not great compared to
the dedicated meters, it can be a handy tool to help identify that a problem may exist and lead to follow-up
testing with a more adequate device.

         Table ES. 1. Deviation of Percent Flicker for handheld meters relative to reference meter measurement.
                           Viso                                                                    GL       Gigahertz-
     Percent Flicker                Viso     AsenseTek       Fauser      UPRtek      Everfine
                          (App)                                                                   Optic       Optik
 Mean Deviation
                          17.31     0.20         1.27         3.14        2.34        19.10       0.75           0.68
 (all measurements)
 Mean Deviation
                          10.69     0.25         1.76         4.06        2.53        10.31       0.54           0.72
 (max levels)
 Mean Deviation
                          33.20     0.00         0.61         1.91        2.08        30.82       1.03           0.64
 (dimmed levels)

          Table ES. 2. Deviation of Flicker Index for handheld meters relative to reference meter measurement.
                           Viso                                                                   GL       Gigahertz-
      Flicker Index                Viso      AsenseTek      Fauser      UPRtek      Everfine
                          (App)                                                                  Optic       Optik
 Mean Deviation
                         0.100     0.017       0.024          N/A        0.016       0.163      0.023        0.008
 (all measurements)
 Mean Deviation
                         0.038     0.005       0.010          N/A        0.009       0.111      0.006        0.002
 (max levels)
 Mean Deviation
                         0.250     0.066       0.042          N/A        0.026       0.232      0.047        0.016
 (dimmed levels)

The meters tested hold qualities that vary in utility depending on the intended use of the meter. This report
presents each meter in a way that informs the reader regarding its design and utility (e.g., detachable sensor
head allowing measurements to be performed or observed remotely). It is necessary, though, to also be aware
of meter limitations that prohibit certain measurements from being reliable (e.g., some of the meters began to
fail to detect flicker at much lower frequencies compared to other meters) when selecting a meter. As flicker
continues to be an important factor in the selection and use of lighting products, future flicker meters will
enable users in the field to adequately characterize lighting in a space and determine whether the level of
flicker is acceptable for the given application.

iv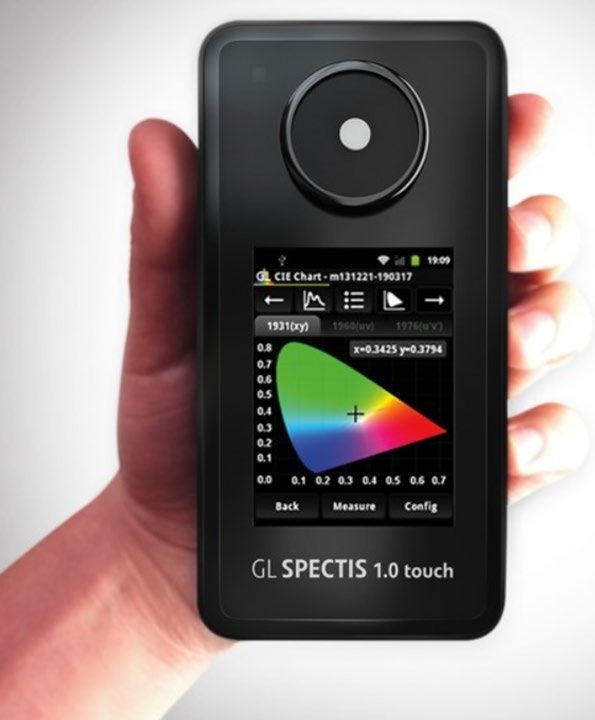
CHARACTERIZING PHOTOMETRIC FLICKER: HANDHELD METERS

Table of Contents
Executive Summary .................................................................................................................................... iii
1      Introduction .......................................................................................................................................... 1
    1.1       Background .................................................................................................................................. 1
    1.2       Test and Measurement Practices ............................................................................................... 2
    1.3       Metrics .......................................................................................................................................... 4
    1.4       Scope ............................................................................................................................................ 6
2      Test and Measurement ....................................................................................................................... 6
    2.1       Test Light Sources........................................................................................................................ 6
    2.2       Reference Flicker Meter .............................................................................................................. 7
    2.3       Commercially-Available Handheld Flicker Meters...................................................................... 7
    2.4       Test Setup and Procedure ........................................................................................................... 9
       2.4.1          Flicker Measurement ........................................................................................................ 10
    2.5       Meter-Specific Testing Methodology........................................................................................ 11
    2.6       Data Analysis ............................................................................................................................. 17
3      Results and Analysis ......................................................................................................................... 18
    3.1       Reported Values: Test vs. Reference ....................................................................................... 18
       3.1.1          Viso Systems Flicker Tester App for iPhone .................................................................... 19
       3.1.2          Viso Systems LabFlicker ................................................................................................... 20
       3.1.3          AsenseTek Lighting Passport Pro ..................................................................................... 21
       3.1.4          Fauser Lightmeter LM10 .................................................................................................. 22
       3.1.5          UPRtek MK350N Premium............................................................................................... 23
       3.1.6          Everfine SFIM-300 ............................................................................................................ 24
       3.1.7          GL Optic Spectis 1.0 touch ............................................................................................... 25
       3.1.8          Gigahertz-Optik BTS256-EF .............................................................................................. 26
    3.2       Comparisons Using Calculated Values .................................................................................... 28
4      Conclusions ....................................................................................................................................... 32
5      Considerations .................................................................................................................................. 32
Appendix A ................................................................................................................................................. 35

                                                                                                                                                                v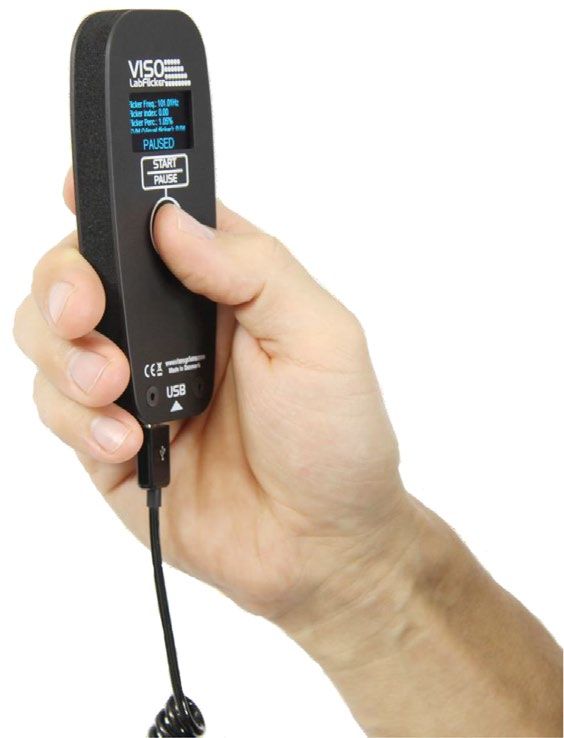
CHARACTERIZING PHOTOMETRIC FLICKER: HANDHELD METERS
List of Figures
Figure 1. A graphic of the various standard bodies interested in TLM. .....................................................2
Figure 2. Positioning of reference and handheld flicker meters on integrating sphere.........................7
Figure 3. Handheld meter slid into place on flange, next to the reference meter. .................................9
Figure 4. Screenshots showing the Apple iOS (left) and Google Play Android (right) versions of the
Viso Flicker Tester App. ........................................................................................................................... 12
Figure 5. Viso Systems LabFlicker handheld meter. ................................................................................. 13
Figure 6. Viso Systems LabFlicker invalid reading. ................................................................................... 14
Figure 7. AsenseTek Lighting Passport Pro Spectrometer. Source: AsenseTek. .................................. 14
Figure 8. Fauser Light meter LM10.............................................................................................................. 15
Figure 9. UPRtek MK350N Premium........................................................................................................... 15
Figure 10. Everfine SFIM-300 Spectral Flickering Irradiance Meter....................................................... 16
Figure 11. GL Optic Spectis 1.0 touch Spectral Light Meter. .................................................................. 16
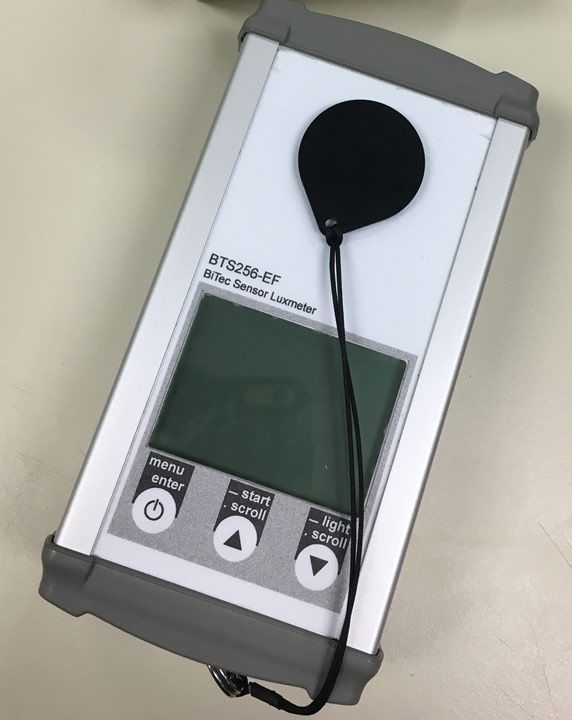
Figure 12. Gigahertz-Optik BTS256-EF handheld flicker meter. ............................................................. 17
Figure 13. Viso (App) and reference meter flicker metrics for the various light sources tested........ 19
Figure 14. Viso and reference meter flicker metrics for the various light sources tested. ................. 20
Figure 15. AsenseTek and reference meter flicker metrics for the various light sources tested. ..... 21
Figure 16. Fauser and reference meter flicker metrics for the various light sources tested. ............ 22
Figure 17. UPRtek and reference meter flicker metrics for the various light sources tested. ........... 23
Figure 18. Everfine and reference meter flicker metrics for the various light sources tested. .......... 24
Figure 19. GL Optic and reference meter flicker metrics for the various light sources tested. ......... 25
Figure 20. Gigahertz-Optik and reference meter flicker metrics for the various light sources tested.
.................................................................................................................................................................... 26
Figure 21. Comparison of the metrics reported by the meter and metrics derived from MATLAB
calculations from the same meter’s waveform. ................................................................................. 29
Figure 22. Comparison of SVM as reported by the meter and SVM as derived from MATLAB
calculations from the same meter’s waveform. ................................................................................. 30
Figure 23. Comparison of handheld meter metrics calculated from waveform measurements using
MATLAB and measurements from the reference meter metrics derived from the reference
meter waveform using MATLAB. ........................................................................................................... 31
Figure 24. Comparison of handheld meter SVM calculated from waveform measurements using
MATLAB and measurements from the reference meter SVM derived from the reference meter
waveform using MATLAB. ....................................................................................................................... 32
vi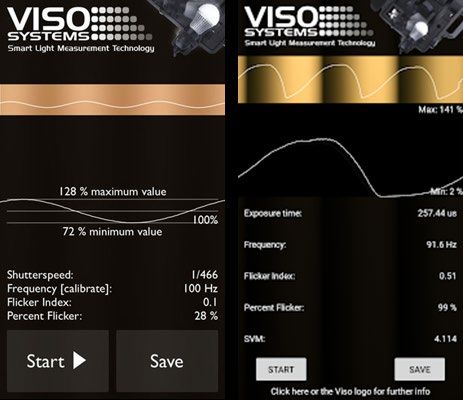
CHARACTERIZING PHOTOMETRIC FLICKER: HANDHELD METERS

List of Tables
Table 1. Measurement parameters for various different flicker metrics..................................................5
Table 2. Test light sources. ............................................................................................................................... 6
Table 3. Basic comparison of commercially-available handheld flicker meters and the reference
   meter............................................................................................................................................................. 8
Table 4. Dimming values and tolerances.................................................................................................... 10
Table 5. Test and measurement conditions. .............................................................................................. 11
Table 6. SVM and MP data (median) for the Viso Flicker meter (VISO), UPRtek MK350N Premium
   (UPRT), GL Optic Spectis 1.0 touch (GL-O), and Gigahertz-Optik BTS256-EF (G-O) meters. ......... 27
Table 7. Deviation of Percent Flicker for handheld meters relative to reference meter
   measurement. .......................................................................................................................................... 27
Table 8. Deviation of Flicker Index for handheld meters relative to reference meter measurement.
    .................................................................................................................................................................... 27

                                                                                                                                                                        vii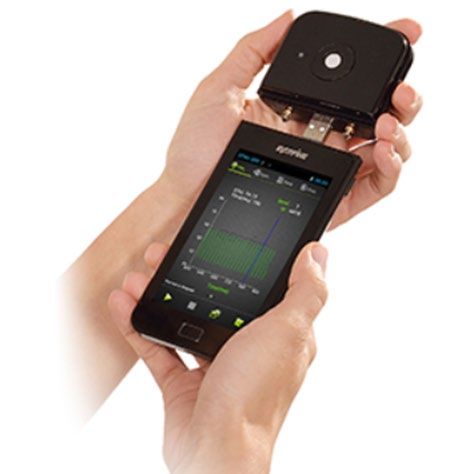
CHARACTERIZING PHOTOMETRIC FLICKER: HANDHELD METERS

                                  (This page intentionally left blank)

viii
CHARACTERIZING PHOTOMETRIC FLICKER: HANDHELD METERS

1 Introduction
1.1 Background
Temporal light modulation (TLM) is the variation of light output as a function of time. TLM can have adverse
effects on health and visual performance and has been the subject of recent articles primarily associated with
flicker in LED lighting. 1,2 Visible flicker is a type of temporal light artifact (TLA) that refers to variations in
light intensity perceived by an observer where the observer and environment are not moving. 3 Lighting system
characteristics that can affect flicker vary by technology; examples include filament thickness for incandescent
sources, phosphor persistence for fluorescent and coated metal halide sources, and circuit designs for
electronically ballasted or driven sources. In this report, the colloquial term “flicker” is used in lieu of TLM to
describe repetitive variations in light output, over a large frequency range, irrespective of the relative eye or
object movement. It is acknowledged that the measured TLM may result in other perceptual effects beyond
visible flicker, such as the stroboscopic effect or the phantom array effect.

Work in this area by the U.S. Department of Energy has focused on methods of measuring TLM, which is
necessary to evaluate the range of characteristics for LED lamps and luminaires. A previous report,
Characterizing Photometric Flicker, compared three benchtop laboratory meters against a reference system
built by Pacific Northwest National Laboratory (PNNL). 4 The meters all measured light-intensity waveforms
and calculated essential flicker-performance characteristics and metrics similarly, both to each other and to the
reference system, which was custom-built based on the available guidance at the time and found to produce
consistent results to other flicker-testing apparatus in use at the time. Some differences in performance were
found when the light-intensity waveforms had significant high-frequency content and when the meters were
not properly configured (or configuration was not possible).

Today, more flicker meters are available, including more handheld meters that range from simple smartphone
applications to scientific-grade meters. This report compares the performance of eight meters capable of
measuring flicker in the field to a reference benchtop meter chosen based on its performance in the initial
round of meter comparisons. Flicker-related research efforts have received significant attention of late and
there is growing momentum to establish specific measurement procedures, agree on application-dependent
metrics, and recommend performance criteria. Once these are in place, the use of handheld flicker meters will
likely increase substantially, making the present a good time to investigate the performance of such meters and
provide guidelines for field measurements of flicker.

1 Zielinska-Dabkowska, Karolina M., Make lighting healthier (Comment), Nature, Issue 553, p. 274-276, January 16, 2018.

https://www.nature.com/articles/d41586-018-00568-7.
2 Wilkins, Arnold J., The scientific reason you don’t like LED bulbs — and the simple way to fix them, The Conversation, July 27, 2017.

https://theconversation.com/the-scientific-reason-you-dont-like-led-bulbs-and-the-simple-way-to-fix-them-81639.
3 Officially, Commission Internationale de l’Eclairage (CIE) Technical Note (TN) 006:2016, Visual Aspects of Time-Modulated Lighting Systems –

Definitions and Measurement Models, defines visible flicker as the “perception of visual unsteadiness induced by a light stimulus, the luminance or
spectral distribution fluctuates with time, for a static observer in a static environment.” http://files.cie.co.at/883_CIE_TN_006-2016.pdf.
4
  Pacific Northwest National Laboratory for U.S. Department of Energy, Characterizing Photometric Flicker, February 2016.
https://www.energy.gov/sites/prod/files/2016/02/f29/characterizing-photometric-flicker.pdf.

                                                                                                                                                      1
CHARACTERIZING PHOTOMETRIC FLICKER: HANDHELD METERS

1.2 Test and Measurement Practices
Flicker is garnering increased attention from lighting designers and specifiers, the standards and specification
community, and, consequently, lighting manufacturers. Figure 1 shows the various standards bodies with a
specific interest in TLM on national, regional, and global levels.

                                Figure 1. A graphic of the various standard bodies interested in TLM.

              (Source: CIE Stakeholder Workshop for Temporal Light Modulation Standards for Lighting Systems.)

Following is a list of published flicker-related activities:

    • The Institute of Electrical and Electronics Engineers (IEEE) published P1789-2015, IEEE Recommended
      Practices for Modulating Current in High-Brightness LEDs for Mitigating Health Risks to Viewers in
      June 2015. 5 The recommended practice sets thresholds for TLM, specifically the concept of modulation
      frequencies, for LEDs used in various applications at three risk levels. This was the first industry
      recommendation that specified how to limit TLM to reduce user risk. The document also discusses
      various LED dimming methods that alter the frequency of drive currents and voltage, specifically
      identifying their effects on TLM.

    • CIE Technical Committee (TC) 1-83 published Technical Note (TN) 006:2016, Visual Aspects of Time-
      Modulated Lighting Systems – Definitions and Measurement Models in 2016. 6 The TN provides
      definitions and a literature review. It also describes two methods to predict TLA, one in the time domain

5 IEEE Std 1789-2015 – IEEE Recommended Practices for Modulating Current in High-Brightness LEDs for Mitigating Health Risks to Viewers.

Available at http://standards.ieee.org/findstds/standard/1789-2015.html.
6 CIE TN 006:2016, Visual Aspects of Time-Modulated Lighting Systems – Definitions and Measurement Models. Available at

http://files.cie.co.at/883_CIE_TN_006-2016.pdf.

2
CHARACTERIZING PHOTOMETRIC FLICKER: HANDHELD METERS
(for predicting visible flicker) and another in the frequency domain (for predicting stroboscopic and
phantom array effects).
• The National Electrical Manufacturers Association (NEMA) published NEMA 77-2017: Temporal Light
Artifacts: Test Methods and Guidance for Acceptance Criteria in 2017. 7 This document describes
various methods for quantifying the visibility of TLA, identifies specific metrics to quantify visible
flicker and stroboscopic effect, provides a measurement method, and sets initial application-dependent
limits.
• A CIE International Stakeholder Workshop for Temporal Light Modulation Standards for Lighting
Systems was held in February 2017. The aim of the meeting was to establish a roadmap of research,
recommendations, and standards activities. The discussions from the meeting are documented in the CIE
TN 008:2017 Final Report: CIE Stakeholder Workshop for Temporal Light Modulation Standards for
Lighting Systems. 8
There are also various activities related to flicker currently being undertaken, including the following:
• CIE TC 1-83, Visual Aspects of Time-Modulated Lighting Systems, is tasked with using the data
collected according to the measurement models identified in TN 006:2016 to verify the metrics used to
predict TLA. Based on this verification, the TC will then develop a system to predict the issues of
visibility of TLA, as opposed to neurological response, which may or may not lead to seeing the flicker.
• CIE TC 2-89, Measurement of Temporal Light Modulation of Light Sources and Lighting Systems, is
tasked with establishing a standardized measurement procedure so that TLM can be consistently
captured and the corresponding metrics can be calculated.
• The IES Testing Procedures Committee is currently drafting a lighting measurement guide, titled Method
of Measuring Optical Waveforms for Use in Temporal Light Artifact (TLA) Calculations, focused on the
measurement and quantification of TLM.
The information produced by the standards organizations is used by various programs. The ENERGY STAR®
V2.0 Lamps Specification includes a requirement to report periodic frequency, Percent Flicker, and Flicker
Index for lamps marketed as dimmable. A proposed revision, Product Specification for Lamps (Light Bulbs)
Version 2.1, replaced the previous version on October 1, 2017. This version added the Short Term Flicker
Indicator (Pst), Stroboscopic Visibility Measure (SVM), and the Flicker Perception Metric (MP), also for all
lamps marketed as dimmable. The ENERGY STAR Method of Measurement for Light Source Flicker outlines
the measurement process, calculations, and test report (i.e., the ENERGY STAR® Dimming Data Sheet).
ENERGY STAR is also implementing the measurement method and recommended performance limits
stipulated in NEMA 77-2017.
The California Building Standards Code (Title 24 of the California Code of Regulations) includes energy
efficiency requirements that apply to the construction of new and renovated buildings, both residential and
commercial. The 2016 version has “reduced flicker operation” requirements for dimmable products to limit
7 NEMA 77-2017, Temporal Light Artifacts: Test Methods and Guidance for Acceptance Criteria. Available at
https://www.nema.org/Standards/Pages/Temporal-Light-Artifacts-Test-Methods-and-Guidance-for-Acceptance-Criteria.aspx.
8 CIE TN 008:2017, Final Report CIE Stakeholder Workshop for Temporal Light Modulation Standards for Lighting Systems. Available at
http://www.cie.co.at/publications/final-report-cie-stakeholder-workshop-temporal-light-modulation-standards-lighting.
3CHARACTERIZING PHOTOMETRIC FLICKER: HANDHELD METERS TLM. These requirements are expressed as a limit on modulation depth as a function of frequency. There is an accompanying test method JA10 that is unique to California. 9 As of July 2018, the DesignLights Consortium®, which is a group of utilities incentivizing most products outside the scope of ENERGY STAR®, does not have a flicker requirement, but they are considering adding one once there is an agreed-upon specification. They currently maintain a webpage dedicated to flicker and a document with key technical questions and requests for input. 10,11 1.3 Metrics The two most commonly used metrics for quantifying flicker remain Percent Flicker and Flicker Index. Percent Flicker (with a range from 0% to 100%) is perhaps better-known (albeit sometimes referred to by other monikers, such as modulation depth or percent modulation) and easier to calculate, but Flicker Index (with range from 0 to 1) has the advantage of being able to account for variation in waveform shape or duty cycle. Both metrics account for amplitude variation and DC offset, but since both only require analysis of a single waveform period, neither is able to account for variation in periodic frequency. Thus, both metrics are best used for comparing light sources with the same frequency. Two other metrics were reported by some meters tested; Stroboscopic Effect Visibility Measure (SVM) and the Lighting Research Center’s Flicker Perception Metric (MP). Flicker sensitivity is generally accepted to be dependent on waveform frequency; the higher the frequency, the lower the sensitivity to most potential effects of flicker. While the periodic light-intensity waveforms created by traditional lighting sources may be purely sinusoidal (e.g., incandescent-source performance), often they contain multiple frequency components. That is, the light-intensity waveform appears to be composed of multiple, superimposed sinusoids. The dominant sinusoidal component – the one with the greatest amplitude – is referred to here as the Fundamental Frequency. For many traditional lighting sources, the Fundamental Frequency is simply twice the input-line-voltage frequency (e.g., 120 Hz for 60 Hz AC in North America). Electronically ballasted fluorescent light sources represent the predominant exception; the low-amplitude modulation found in such lighting systems is typically in the 20 to 60 kHz range. Given this lack of variation in Fundamental Frequency (in particular, for a given lighting technology), frequency has not historically been a key specification factor when considering flicker. With the advent of LED technology, however, this is no longer the case. The Fundamental Frequency found in LED source flicker can vary significantly. As a result, the guidance provided in IEEE Standard 1789-2015 consists of limits on Percent Flicker, as a function of the operating frequency generated by the driver or ballast for the light source. SVM attempts to predict both the visibility and acceptability of the stroboscopic effect. The SVM differs from Percent Flicker and Flicker Index in a few significant ways. First, it can account for variations in waveform frequency – even for waveforms that have multiple frequency components. It uses Fourier analysis to convert the light-intensity waveform from its time-domain representation to a frequency-domain representation, so that frequency dependencies for varying effects (in this case, visibility) can be accounted for by a weighting function, which is a second key differentiator between the SVM and other metrics. Fourier analysis allows a complex, not just sinusoidal, waveform to be analyzed as a sum of individual frequency components. Notably, the weighting function is application-specific; as a result, the SVM does not address non-visible flicker, for example, and is likely not suitable for predicting some neurological issues. Other weighting functions, addressing other potential effects of flicker (e.g., increased occurrence of migraines, reduced visual-task performance) could be developed and applied using a similar approach. The SVM applies such a weighting, or sensitivity function, to frequencies between 80 and 2,000 Hz. Calculating the SVM from a light-intensity 9 California Energy Commission, 2016 Reference Appendices for the 2016 Building Energy Efficiency Standards – Title 24, Part 6, and Associated Administrative Regulations in Part 1. See Reference Appendix JA10. Available at http://www.energy.ca.gov/2015publications/CEC-400-2015-038/CEC- 400-2015-038-CMF.pdf. 10 DesignLights Consortium Flicker webpage. Available at https://www.designlights.org/workplan/flicker/ (accessed August 2018). 11 DesignLights Consortium, Flicker: Key Questions. Available at https://www.designlights.org/default/assets/File/Workplan/DLC- Workplan_Flicker_Key-Questions.pdf (accessed August 2018). 4
CHARACTERIZING PHOTOMETRIC FLICKER: HANDHELD METERS

waveform requires at least 1 second of data with a minimum sampling frequency of 4,000 samples per second
(with at least 5,000 preferred) to generate enough frequency resolution to accurately apply the sensitivity
function. Finally, while the SVM is necessarily greater than zero, it is not otherwise limited in range; for
reference, the SVM of a typical incandescent lamp is less than 0.5, at both full output and all dimmed levels,
and the threshold of visibility (i.e., just visible by 50% of subjects) for SVM is defined as 1.0.

A metric less commonly reported (only one meter in this testing), the MP metric was developed by the Lighting
Research Center at Rensselaer Polytechnic Institute. The Alliance for Solid-State Illumination Systems and
Technologies (ASSIST) program published the Flicker Perception Metric (MP) for evaluating flicker, in the
range of 5 to 65 Hz, using a weighted Fourier transform approach. For a single-frequency sinewave with 30%
modulation depth, the MP value is 1 at 54 Hz. Similar to both SVM and PstLM, a value of 1 is the threshold at
which 50% of observers would indicate perception of visible flicker. 12

Two other flicker metrics worth mentioning are the International Electrotechnical Commission’s (IEC’s)
Flicker meter Short-Term Flicker Severity (PstLM) and the Compact Flicker Degree (CFD). The flicker meter
method was developed by IEC to predict the visibility of light modulation from voltage fluctuations in
electrical power systems. One of the included metrics is PstLM, which quantifies visible flicker up to 80 Hz
based on a 180-second sample length. CIE TN 006:2016 and NEMA 77-2017 recommend the use of PstLM to
quantify the visibility of TLA. ASSIST’s MP also supports the findings (specifically the response threshold) of
PstLM. CFD is a Fourier-based metric that is designed to predict TLA. CFD is similar in approach to ASSIST’s
MP, but includes a greater range of frequencies (up to 2,000 Hz). CFD is presented as a percentage, with higher
percentages indicating potential issues with TLA; the values can exceed 100% with artificially created
waveforms. One meter in this testing was capable of reporting values for PstLM, but the waveform data required
to calculate that metric could not be obtained. For that reason, and because each measurement requires a 180-
second sample length, this metric is not presented or evaluated in this report.

Table 1 includes the required measurement parameters needed to calculate different metrics. The measurement
requirements were first recorded from the original documentation of the metrics; if there were no specific
requirements, then they were taken from the various measurement methods (e.g., ENERGY STAR®, National
Electrical Manufacturers Association). Any discrepancies between the measurement requirements in the
metrics documentation and the various measurement methods are noted in the table footnotes.

                                Table 1. Measurement parameters for various different flicker metrics.

                                                Percent            Flicker         ASSIST’s            Philips            IEC
                                                                                                                                             CFD
                                                Flicker             Index            MP                 SVM               PstLM
     Target frequency range (Hz)                   ––                ––               5-65            80-2000             0-80           0-250,000
     Sampling frequency (Hz)                       ––                ––              2,000a            4,000b            4,000c           20,000d
     Sample length (s)                             1                 1                  2                 1               180                1
     Cut-off filter (Hz)                           ––                ––               100              3,000e            1,000f             ––g
(a) ENERGY STAR® requires at least 10,000 Hz.
(b) 10,000 Hz is more ideal (according to Philips).
(c) Although 4,000 Hz is the minimum required sampling frequency, for a cut-off filter at 1,000 Hz, an increased sampling frequency of 10,000 Hz is
recommended.
(d) 20,000 Hz is the minimum necessary for sufficient presentation and calculation (according to Der Lichtpeter’s CFD website,
https://www.derlichtpeter.de/en/light-flicker/cfd/).
(e) NEMA 77-2017 requirement.
(f) NEMA 77-2017 requires 2,000 Hz.
(g) Depends on the sampling rate.

12
  The Alliance for Solid-State Illumination Systems and Technologies (ASSIST) Program. https://www.lrc.rpi.edu/programs/solidstate/assist/pdf/AR-
FlickerMetric.pdf.

                                                                                                                                                      5
CHARACTERIZING PHOTOMETRIC FLICKER: HANDHELD METERS
1.4 Scope
This report documents the performance of eight handheld flicker meters that were available in 2017 when the
study was initiated. Each meter was used to measure 12 test light sources according to an internal procedure
following laboratory best practices. The resulting waveforms and flicker metrics (Percent Flicker, Flicker
Index, Fundamental Frequency, SVM, and MP) were evaluated and, where possible, compared to those from a
previously evaluated benchtop meter, which was considered the reference.
2 Test and Measurement
2.1 Test Light Sources
Because no standard light source(s) were available for evaluating flicker measurement capability, a set of 12
light sources was established for this study. The lighting devices were selected based on their being typical of a
specific architectural lighting product, exhibiting a specific waveform characteristic (e.g., amplitude
modulation, shape, and frequency), and/or because they had previously been tested and were available for re-
use in this study. Table 2 provides further details for these light sources.
Table 2. Test light sources.
The following light sources were selected based on their exemplification of a familiar type of architectural lighting product,
specific waveform characteristics, and/or because they had previously been tested.
ID Type Description Reason for selection
NGL 2015a prototype with low-duty cycle but
A LED White-tunable linear LED cove luminaire. high-frequency (730 Hz) flicker. Tested at four
light-output levels.
Halogen infrared (HIR) PAR38 halogen screw- Common halogen lamp used in retail
B HAL
base lamp. applications included as a benchmark.
High color rending index (CRI) PAR38 LED
C LED 10% flicker at full output.
replacement screw-base lamp.
D LED PAR38 LED replacement screw-base lamp. 100% flicker at full output.
E LED PAR38 LED replacement screw-base lamp. 0% flicker at full output.
Compact fluorescent lamp (CFL) self-ballasted Integral high-frequency electronic ballast.
F CFL
screw-base A-lamp. Included as a benchmark.
G LED BR30 LED screw-base replacement lamp. Uses AC LED technology.
0 – 10 V dimming driver that produces
Recessed 2 x 2 LED troffer with a contoured
H LED minimal flicker at full and dimmed output.
diffuser.
Tested at four light-output levels.
Recessed T8 2 x 2 lensed (prismatic) troffer Benchmark of 1990s-to-present 0 – 10 V
I FL with two 32W T8 fluorescent U-lamps and 0 – dimmable fluorescent technology. Tested at
10 V electronic dimming ballast. four light-output levels.
Included as a benchmark product, as it
4' fluorescent strip light with one T12 lamp represents flicker that was common before the
J FL
and magnetic rapid-start ballast. 1990s widespread adoption of electronic
ballasts.b
Represents a typical LED with a fundamental
K LED Philips TLA demo unit waveform WF21.
frequency of 100 Hz.
Represents a typical 60W incandescent bulb
L LED Philips TLA demo unit waveform WF22.
with a fundamental frequency of 100 Hz.
(a) Next Generation Luminaires™ (NGL) Solid-State Lighting (SSL) Design Competition: http://www.ngldc.org/.
(b) This flicker was accepted by most, tolerated by some, considered distracting or physiologically disturbing by others. The 4' fluorescent strip light with
T12 or T8 lamps magnetic ballasts is a source widely believed to contribute to headaches and malaise in some populations, along with likely reduction in
visual task performance.
6CHARACTERIZING PHOTOMETRIC FLICKER: HANDHELD METERS
2.2 Reference Flicker Meter
Based on the previous testing of benchtop meters, the Admesy Asteria SC-ASTR-01 High-Speed Illuminance
Photometer was selected for permanent installation on the exterior of a 2-meter integrating sphere in the PNNL
Lighting Metrology Laboratory. A porthole on the bottom section of the sphere was used, directly below the
light source, ensuring maximum light collection during testing. The typical distance from light source to the
reference meter was approximately 90 cm, with some slight variation possible due to the dimension of the test
light source. In addition to flicker analysis, the Admesy Asteria can measure luminance, illuminance, and
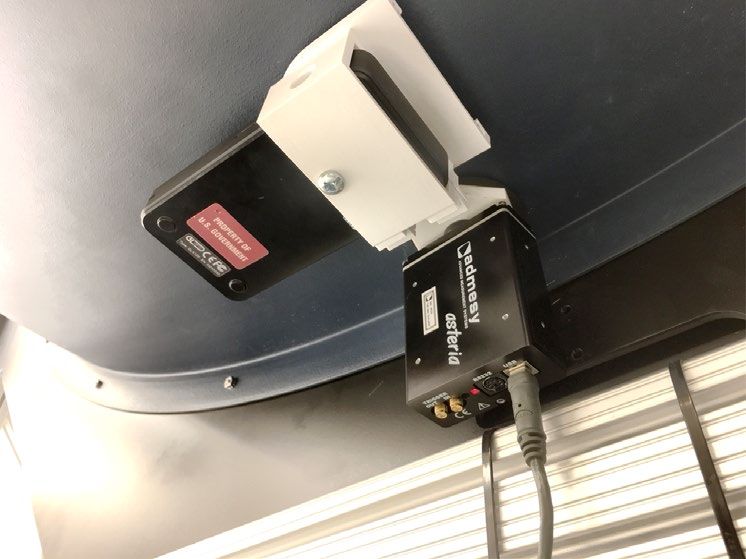
luminous intensity, although these capabilities are not the focus of this report. Figure 2 shows the reference
flicker meter as placed permanently under the integrating sphere and the adjacent porthole opening with a
custom flange used to attach the commercially-available handheld flicker meters.
Figure 2. Positioning of reference and handheld flicker meters on integrating sphere.
The reference meter was placed permanently under the integrating sphere about 90 cm from the light source inside the
sphere. A flange designed for easy attachment of handheld meters is also visible. When not used, this flange was covered.
2.3 Commercially-Available Handheld Flicker Meters
To identify commercially-available handheld meters, PNNL surveyed the instrument market, primarily through
Internet searches and manufacturer trade shows, but also via inquiries to independent commercial laboratories
currently characterizing or planning to characterize flicker. The focus was on handheld meters; meters
designed for high-throughput production-line characterization were not considered. Once the appropriate
handheld commercial meters were identified, PNNL requested manufacturer quotes and product information,
along with availability. Eight products were selected and ordered for testing, with prices ranging from $2,000
to $5,000 and all available to ship within 8 weeks of ordering. A basic comparison of the selected products and
the reference meter is shown in Table 3.
7CHARACTERIZING PHOTOMETRIC FLICKER: HANDHELD METERS
Table 3. Basic comparison of commercially-available handheld flicker meters and the reference meter.
The eight products selected are compared for the following performance characteristics: size, measurement time, sampling
rate, and calculated outputs, based on manufacturer claims. In the Sampling Characteristics column, “S” refers to samples.
Dimension/ Measurement Sampling
Meter Calculated Outputs
Weight Time Characteristics
Percent Flicker
Viso Systems Flicker
Flicker Index
Tester app for Varies - -
Fundamental Frequency
iPhonea
SVM
Percent Flicker
Viso Systems 115 x 53 x 13 mm 50 kS Flicker Index
1
LabFlicker 155 g 50 kS/s Fundamental Frequency
SVM
68.5 x17 x56mm Percent Flicker
AsenseTek Lighting
76.5 g 6 ms – 16 s - Flicker Index
Passport PRO
Fundamental Frequency
Fauser Light meter Percent Flicker
120 x 79 x 28 mm - -
LM10 Flicker Frequency (Highest)
Percent Flicker
147.5 x 78 x 24
UPRtek MK350N Flicker Index
mm 0.1 ms – 64 s Up to 100 kS/s
Premium Fundamental Frequency
225 g
SVM
Percent Flicker
180 x 70 x 30 mm Flicker Index
Everfine SFIM-300 50 ms – 12 s Up to 50 kS/s
200 g Fundamental Frequency
FFT spectrum
Percent Flicker
JUST Normlicht Inc.
74 x 146 x 24 mm Flicker Index
GL Optic Spectis 1.0 10 ms – 10 s Up to 125 kS/s
315 g Dominant Frequencies
T
SVM
Percent Flicker
Gigahertz-Optik Flicker Index
BTS256-EF 159 x 85 x 45 mm Fundamental Frequency
5 ms – 180 s Up to 50 kS/s
BiTec Sensor Light 500 g SVM
meterb MP
PstLM
Admesy Asteria SC-
ASTR-01 Percent Flicker
69 x 31 x 93 mm Up to 250 kS;
High-Speed 1 ms – unknownd Flicker Index
320 g up to 187 kS/s
Illuminance Fundamental Frequency
Photometerc
(a) Flicker Tester: http://www.visosystems.com/products/flicker-tester/.
(b) Gigahertz-Optik BTS256-EF BiTec Sensor Light meter: https://www.gigahertz-optik.de/en-us/product/BTS256-EF
(c) Admesy Asteria SC-ASTR-01 High Speed Illuminance Photometer: http://www.admesy.nl/product/asteria/.
(d) The Asteria SC-ASTR-01 can take measurements for longer times using a DELAY function that averages a predefined number of samples to produce a
measurement point. Admesy has advised that the DELAY function can currently be used to extend measurement time to 20 s, and that a forthcoming
software update will enable measurement times of up to 200 s.
8CHARACTERIZING PHOTOMETRIC FLICKER: HANDHELD METERS
2.4 Test Setup and Procedure
The eight commercially-available handheld meters were set up in the integrating sphere just adjacent to the
reference meter. To maintain consistent placement of meters and minimize stray light, a custom flange was
developed for the integrating sphere porthole, as well as custom sleeves/holders for each meter that allowed
easy and repeatable placement of each handheld meter onto the flange. Figure 3 demonstrates the placement of
the handheld meter onto the flange.
Figure 3. Handheld meter slid into place on flange, next to the reference meter.
Each light source was connected to a laboratory power supply delivering 120 VAC and allowed to thermally
stabilize for approximately 5 minutes before measurement. The ambient temperature was maintained at 25° C
± 1° C. Previous experiments have demonstrated that flicker performance is not a strong function of thermal
stabilization; thus, in the interest of time, thermal stabilization of the light source was limited in time. Lamp
temperatures and other operating characteristics (e.g., power and light output) were not monitored during this
warmup. Light output, however, was captured throughout the testing of each test light source by the reference
meter. To minimize testing time, dimmable test light sources were not required to establish a new thermal
equilibrium at each dimmed level when testing occurred within the same day, but the typical 5-minute
stabilization was performed when testing continued on a different day.
Each test light source was measured by all of the handheld meters in a continuous sequence. Light sources A,
H, and I were chosen for evaluating different dimming scenarios (e.g., LED, fluorescent, 0-10V dimming,
DMX dimming) and operated at varying light-output levels, as specified in Table 2. Light sources H and I light
levels were set using a Lutron Nova T 0-10VDC dimmer. The light levels tested were maximum/100%, 50%,
20%, and minimum. For the 50% and 20% levels, this was done by measuring maximum lumen output with
the reference meter, adjusting the dimmer, and iteratively measuring the lumen output with the reference meter
until the target light output was reached. Once reached, throughout that dimmed level testing, values were
maintained within 2% of the initial light output by adjusting the dimmer setting. Light source A was tested
using a proprietary manufacturer provided DMX controller at the same percentages relative to the 100%
setpoint value on the controller to achieve the dimmed light output levels (see Table 4 for settings). At the
lowest DMX setting, the light output could not be reduced any further, causing a 4.06% increase in light output
during testing, or 0.28 lumens. Table 4 shows the dimming level and voltage used during testing. Note that the
minimum dimmed level was the lowest setting on the dimmer or controller possible without regard for the
stability of the light source, as it was desirable to observe any flicker that may have been present at this setting.
9CHARACTERIZING PHOTOMETRIC FLICKER: HANDHELD METERS
Table 4. Dimming values and tolerances.
Light Source Dimmer Type Voltage/Setting Actual Lumens Actual Dimmed Level
100 1873 100%
70 925 49%
A DMX
44 367 20%
1 7 0.4%
9.58 2984 100%
4.79 1503 50%
H 0-10 VDC
1.84 597 20%
0.84 262 9%
9.58 3207 100%
3.67 1605 50%
I 0-10 VDC
1.86 644 20%
0.83 159 5%
Both prior to starting measurements for any test light source – or dimmed level of a test light source – and after
completing all handheld meter measurements, a full set of measurements was performed using the reference
meter, including the flicker characteristics and light-intensity waveform. For each handheld meter
measurement performed, a nearly simultaneous measurement with the reference meter was also performed,
with the photometric and flicker metrics recorded for both. For the reference meter, the light-intensity
waveform was only recorded at the start and end of a series of measurements on a given test light source.
For both test and reference meters, five sequential measurements were obtained to evaluate repeatability. Since
data acquisition was mostly a manual process, at times requiring transferring data from a handheld meter to a
computer, the measurement time for, and lag time between, handheld meter measurements varied slightly, but
the process remained consistent throughout the testing. With rare exceptions, repeatability of the reported
flicker metrics across five consecutive readings was deemed adequate. Percent Flicker values of handheld
flicker meters showed an average deviation of 0.066 percentage point with a maximum average deviation of
0.59 percentage point. Similarly, Flicker Index values of handheld flicker meters showed an average deviation
of 0.00053 with a maximum average deviation of 0.022. In the maximum cases for these metrics, the readings
were for a light source dimmed at its lowest level and with high-frequency content. SVM repeatability showed
an average deviation of 0.009 with a maximum average deviation of 0.32, with the maximum reading
occurring for the same light source dimmed at its lowest level.
2.4.1 Flicker Measurement
To characterize the performance of each commercial handheld meter, testing was completed using an
integration time of as close to 2 seconds as possible. The integration time was not configurable or even known,
for some meters.
Table 5 shows the actual conditions used for meters that allowed integration times to be set, or that were
known, including the reference meter. The Viso app, Viso Systems meter, and Fauser meter, in particular, did
not provide an option to specify an integration time for flicker measurements. As such, their performance in
this report is evaluated based on the meter’s own established integration time.
10CHARACTERIZING PHOTOMETRIC FLICKER: HANDHELD METERS
Table 5. Test and measurement conditions.
For each meter, the measurement time, sampling rate, and the number of samples are specified, if configurable or known.
Additionally, the fast Fourier transform (FFT) resolution (defined as the inverse of the sample duration) and maximum FFT
frequency (the number of FFT bins – equal to half the number of samples multiplied by the FFT resolution) are calculated.
Measurement Max FFT
Sampling Rate Number of FFT Resolution
Meter Time Frequency
(samples/s) Samples (Hz)
(ms) (Hz)
Viso Systems Flicker
− − − − −
Tester app for iPhonea
Viso Systems
− 60,000 − − 30,000
LabFlickerb
AsenseTek Lighting
Passport PRO − − − − −
Spectrometerc
Fauser Light meter
− − − − −
LM10d
UPRtek MK350N 2,000 32,768 65,536 0.5 16,384
Everfine SFIM-300e 3,000 781 2,343 0.33 387
JUST Normlicht Inc. GL
2,000 7,813 15,626 0.5 3,907
Optic Spectis 1.0 T
Gigahertz-Optik
BTS256-EF BiTec 2,000 50,000 100,000 0.5 25,000
Sensor Light meter
Asteria SC-ASTR-01 2,000 186,567 373,137 0.5 93,284
(a) Viso Systems Flicker Tester app does not have a manual or provide any user-adjustable settings, and does not specify/provide sampling information. It
is possible that these may vary depending on the smartphone on which the app is installed, and thus specifications could vary from device to device.
Although a “Shutterspeed” is provided for the iOS app and “Exposure Time” for the Android app, it is unclear if there is a correlation between those values
and the sampling rate or a number of samples being analyzed.
(b) Viso Systems LabFlicker does not allow users to select an integration time or sampling rate. The default sampling rate is 60,000 samples per second.
During testing, export of light intensity waveform data was not available. The newest update allows exported data at 50,000 samples per second.
(c) AsenseTek Lighting Passport allows users to set integration time for exposure purposes; for this reason, the automatic exposure integration was
selected.
(d) Fauser Lightmeter LM10 does not allow users to select an integration time or sampling rate. Settings for the Fauser only allow setting the sampling
interval time as 0.25 s, 1 s, 10 s, and 1 minute.
(e) Everfine SFIM-300 displays an on-screen message momentarily informing the user that frequencies below 125 Hz would not measure properly when
integration time is set to 3 seconds. However, since a measurement is provided and the user would be unaware of the high frequency content in a light
source, the data was used and analyzed.
2.5 Meter-Specific Testing Methodology
The following descriptions provide meter-specific details relevant to the testing performed, as well as
deviations from the standard test setup and/or measurement protocol that may have been necessary.
Viso Systems Flicker Tester Application
The Flicker Tester app from Viso Systems is unique in that it is an application installed on a smartphone, and
leverages the camera to provide flicker measurements. The results provided in this report are specific to the
version of the application used and the device on which it was installed. 13 The Apple version of the app
provides Percent Flicker, Flicker Index, Fundamental Frequency, 14 and a visual representation of the flicker
13Version 1.0 of the Flicker Tester app was installed on an iPod Touch 5th Generation.
14On the iPod device used, the app actually displays “Frequency [calibrate]”, and it is not clear what calibration is required or whether the frequency
provided is representative of the Fundamental Frequency. During this testing, that reading was assumed to represent Fundamental Frequency.
11CHARACTERIZING PHOTOMETRIC FLICKER: HANDHELD METERS
waveform. The Google Play version of the app provides the same metrics as the Apple app plus SVM.
Furthermore, the Frequency measurement is not qualified with “[calibrate]” on the Google Play version. 15
Figure 4. Screenshots showing the Apple iOS (left) and Google Play Android (right) versions of the Viso Flicker Tester App.
Source: Viso Systems Apple App and Google Play stores.
Since the Flicker Tester app uses the device’s camera to take a measurement, a means to diffuse the image
entering the camera is recommended to ensure accurate results. The manufacturer’s website recommends the
use of either frosted film or paper in front of the lens. Testing was conducted with plain white paper as the
diffusing mechanism, as it is assumed that most users of this app would find paper more easily accessible than
frosted film. The app has no user-configurable settings for measurements. During testing, measurements were
saved to the “Photos” app and were later retrieved to a computer by connecting the device via USB and using
Windows Explorer.
During testing, the typical test setup did not allow the device to obtain sufficient light to take a measurement
for various test light sources. When this occurred, a deviation from the standard testing methodology was made
to obtain a measurement: The integrating sphere was opened and the iPod Touch was placed near the test light
source. A video on the vendor’s website demonstrates the proximity required for measurements, and the app
shows “Hold the camera as close as possible to the light source” on the display when there is insufficient light.
Although there is a potential for ambient light to influence the measurements when the integrating sphere is
opened, the proximity of the device to the test light source and the room/lighting configuration is such that any
impact is expected to be minimal, at best, and something that would likely be unavoidable in real-world use of
this app.
Viso Systems LabFlicker
The Viso Systems LabFlicker (Figure 5) is a portable meter that requires a connection to a computer to
function. The Viso Systems Light Inspector software is required to begin collecting samples. 16 With the
software active, the LabFlicker can measure Percent Flicker, Flicker Index, Fundamental Frequency, and
SVM.
Data collected during flicker testing was exported from the Viso Light Inspector software by saving a
screenshot as a JPEG. Measurement results are continuously updated in the software interface and have a fixed
integration time and sample rate. During testing, these settings were unable to be changed. In the time since
15 Android Google Play version characteristics obtained from the Google Play Store
(https://play.google.com/store/apps/details?id=com.visosystems.viso.flickertester&hl=en) on June 27, 2018.
16 Testing was conducted using software version 5.35 and firmware version 1.12.
12CHARACTERIZING PHOTOMETRIC FLICKER: HANDHELD METERS
testing was conducted, a software update was released that allows the meter to export the light-intensity
waveform data to a CSV or PDF file and the resolution changed to 50,000 samples per second. 17
Figure 5. Viso Systems LabFlicker handheld meter.
Source: Viso Systems.
Although the LabFlicker meter provides measurements and a waveform each time, the meter screen and
software may indicate that the light levels are too low for an accurate measurement, and this is also indicated
by a large “X” across the meter screen and the waveform section on the software (Figure 6). Dimmed levels, in
particular, resulted in such warnings, but even some full/max light output levels were also noted as having
insufficient light levels for the meter to obtain a valid measurement. Given that this is a standalone meter that
should be capable of providing a measurement at the distance tested, no accommodation was given to enable a
measurement to be made (e.g., to open the integrating sphere and place the sensor closer to the light source, as
was done for the Viso Flicker app).
In comparing the LabFlicker meter against the reference meter, the flicker metrics for all test light sources
regardless of the meter/program indicating light levels as being too low, are presented. In later sections of this
report analyzing flicker metric performance (e.g., deviation or matching to the reference meter), the flagged
measurements were not considered in the calculations, as it was assumed the user would have understood that
the measurement accuracy could not be trusted and attempted to move closer to the light source.
17 New software version 5.52 and firmware version 1.19. During testing for functionality, the data could be downloaded, but it was observed that the
comma-separated value was actually separated by semicolons. In most cases, this is a mere inconvenience that may be overcome by selecting the
appropriate data delimiter when importing the data into a program (e.g., Excel or MATLAB).
13You can also read


