Air Quality 2020 Preliminary Evaluation - Umweltbundesamt
←
→
Page content transcription
If your browser does not render page correctly, please read the page content below
background // february 2021
Air Quality 2020
Preliminary Evaluation

German Environment Agency
Imprint
Publisher:
Umweltbundesamt [German Environment Agency]
Section II 4.2
PO Box 14 06
D-06813 Dessau-Roßlau
Tel: +49 340-2103-0
buergerservice@uba.de
Internet: www.umweltbundesamt.de
/umweltbundesamt.de
/umweltbundesamt
/umweltbundesamt
/umweltbundesamt
Authors:
Susan Kessinger, Andrea Minkos, Ute Dauert,
Stefan Feigenspan
Direct contact to the authors: II4.2@uba.de
Editors:
Section II 4.2 “Air Quality Assessment”
Design:
le-tex publishing services GmbH
Publications as a pdf:
www.umweltbundesamt.de/publikationen/air-quality-2020
Photo credits:
Cover photo: Shutterstock/Jimmi Lammons
Photo of air quality monitoring station Schauinsland:
Frank Meinhardt
As at: February 2021
ISSN 2363-829X
The information presented in this brochure reflects the
level of research at the time of publication. The definitive
data is presented on the UBA website from the middle of
the year onwards.
background // february 2021
Air Quality 2020
Preliminary Evaluation
List of figures/tables
List of figures/tables
Figure 1: Overview of the monitoring stations in Germany. . . . . . . . . . . . . . . . . . . . . . . . . . . . . . . . . . . . . . . 6
Figure 2: Diagrammatic presentation of the pollution regimes for particulate matter and nitrogen dioxide. . . 7
Figure 3: Percentage share of air monitoring stations exceeding the PM10 limit value. . . . . . . . . . . . . . . . . 8
Figure 4: Average number of days on which the PM10 limit was exceeded (24-hour values > 50 μg/m³) . . . 9
Figure 5: Development of the annual mean PM10 values. . . . . . . . . . . . . . . . . . . . . . . . . . . . . . . . . . . . . . . . 10
Figure 6: Development of the annual mean PM2.5 values and of the Average Exposure Indicator (AEI). . . 11
Figure 7: Percentage share of air monitoring stations exceeding the NO2 limit value for the annual mean. . . 12
Figure 8: Development of the annual mean NO2 values. . . . . . . . . . . . . . . . . . . . . . . . . . . . . . . . . . . . . . . . . 13
Figure 9: Medium NO2 monthly mean values of the period 2016–2020. . . . . . . . . . . . . . . . . . . . . . . . . . . . 14
Figure 10: NO2 annual mean values 2020. . . . . . . . . . . . . . . . . . . . . . . . . . . . . . . . . . . . . . . . . . . . . . . . . . . . . 15
Figure 11: Hours during which the information threshold (180 μg/m³) for ozone was exceeded. . . . . . . . 16
Figure 12: Spatial distribution of the number of days on which the long-term objective for the protection
of human health was exceeded (number of days with 8-hour average values > 120 μg/m³). . . . . . 17
Figure 13: Percentage share of air monitoring stations recording an exceedance of the target value . . . . 18
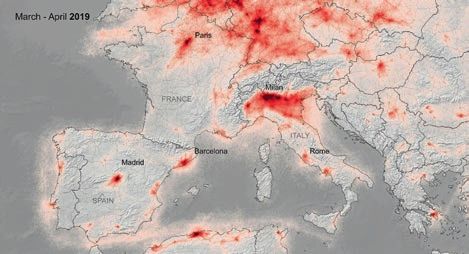
Figure 14: Comparison of NO2 levels in the total air column in Europe between March/April 2019 and
2020 . . . . . . . . . . . . . . . . . . . . . . . . . . . . . . . . . . . . . . . . . . . . . . . . . . . . . . . . . . . . . . . . . . . . . . . . . 20
Figure 15: Composition of German NOx and PM10 emissions for the year 2019. . . . . . . . . . . . . . . . . . . . . . . 22
Figure 16: Hourly NO2 levels in March and April 2020 for all stations close to traffic. Lockdown period
marked . . . . . . . . . . . . . . . . . . . . . . . . . . . . . . . . . . . . . . . . . . . . . . . . . . . . . . . . . . . . . . . . . . . . . . . 23
Figure 17: Average daily NO2 concentrations in close proximity to traffic for Germany and all federal
states in 2020, lockdown period in yellow. . . . . . . . . . . . . . . . . . . . . . . . . . . . . . . . . . . . . . . . . . . 25
Figure 18: Distribution of the lowest afternoon NO2 pollution levels (Mon–Fri, 13–18 hrs) at all
traffic-related measuring stations in Germany 2020. . . . . . . . . . . . . . . . . . . . . . . . . . . . . . . . . . . 26
Figure 19: Breakdown of urban NO2 pollution . . . . . . . . . . . . . . . . . . . . . . . . . . . . . . . . . . . . . . . . . . . . . . . . . 27
Figure 20: Example of a measurement in close proximity to traffic and in an urban background
with marked local traffic contribution. . . . . . . . . . . . . . . . . . . . . . . . . . . . . . . . . . . . . . . . . . . . . . . 27
Figure 21: Average course of the local traffic contribution of the 30 municipalities three months
before and after spring lockdown, lockdown period marked in yellow . . . . . . . . . . . . . . . . . . . . 28
Figure 22: Mean NO2 time series in German cities with populations of > 100 000 (red) compared with
the time series fitted using meteorological parameters and their forecast for the Corona
period (grey). Daily averages on working days from measuring points in close proximity
to traffic are shown for the regions of northern and eastern Germany (R-N-O-D), western
Germany (R-W-D) and southern Germany (R-S-D); start of Corona lockdown (yellow) . . . . . . . . 29
Figure 23: Relative changes in NO2 concentrations due to lockdown restrictions in April 2020 . . . . . . . . . 30
Figure 24: NO2 annual mean values 2020 of all hourly measuring stations in close proximity to traffic. . . 31
Table 1: Averaging periods by calendar weeks and corresponding periods with date. . . . . . . . . . . . . . . 21
4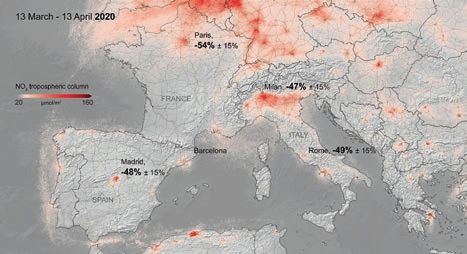
Table of contents

Table of contents

I Air Quality in 2020: Data Basis and Evaluation Methodology ������������������������������������������ 6
   1   Air Quality and Air Pollutants������������������������������������������������������������������������������������������� 6
   2   Provisional Nature of the Information��������������������������������������������������������������������������������� 7
   3   Causes of Air Pollution��������������������������������������������������������������������������������������������������� 7
   4   Influence of Environmental Conditions�������������������������������������������������������������������������������� 7

II Particulate Matter: Further Reduction of Pollution���������������������������������������������������������� 8
   1 PM10 – 24-hour Values��������������������������������������������������������������������������������������������������� 8
   2 PM10 – Annual Mean Values��������������������������������������������������������������������������������������������� 9
   3 PM2.5 – Air Pollution���������������������������������������������������������������������������������������������������� 10

III Nitrogen Dioxide: Hardly any Exceendances��������������������������������������������������������������� 12
   1 NO2 – Annual Mean Values�������������������������������������������������������������������������������������������� 12
   2 NO2 – One Hour Values������������������������������������������������������������������������������������������������� 14

IV Ground-level Ozone: Less Pollution than in both Previous Years����������������������������������� 16
   1 O3 – Information and Alert Threshold�������������������������������������������������������������������������������� 16
   2 O3 – Target Value for the Protection of Human Health ������������������������������������������������������������ 17
   3 O3 – Protection of the vegetation������������������������������������������������������������������������������������� 18

V Air Quality During the Spring Lockdown���������������������������������������������������������������������� 20
   1 Introduction�������������������������������������������������������������������������������������������������������������   20
   2 NO2 Situation During the Spring Lockdown ������������������������������������������������������������������������           23
   3 Impact on Compliance with Air Limit Values �����������������������������������������������������������������������         31
   4 Conclusion ��������������������������������������������������������������������������������������������������������������   31
   5 References ��������������������������������������������������������������������������������������������������������������   32

Further information on the topic������������������������������������������������������������������������������������� 34

                                                                                                                                   5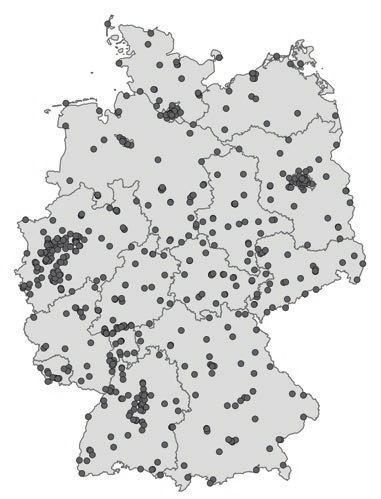
I Air Quality in 2020: Data Basis and Evaluation Methodology

I Air Quality in 2020: Data Basis and Evaluation Methodology
1 Air Quality and Air Pollutants
Air quality is monitored throughout Germany by the                          Particulate matter (PM10, PM2.5)
individual federal states and the UBA (German Envi-                         is defined as particles which pass through the
ronment Agency/Umweltbundesamt). In this respect,                           size-selective air inlet of a monitoring device, which
air quality is determined on the basis of the amount                        demonstrates a 50 percent efficiency cut-off for an
of air pollutants it contains, which means substances                       aerodynamic diameter of 10 (PM10) and 2.5 (PM2.5)
which have a harmful impact on human health                                 micrometres (µm) respectively. Above all, particu-
and/or the environment. These include, primarily,                           late matter is propagated by combustion processes
particulate matter, nitrogen dioxide and ozone.                             in motor vehicles, power stations and small-scale
                                                                            furnaces and during the production of metals and
The pollutant concentrations in the air are measured                        steel. It is also propagated by soil erosion and
several times a day at over 600 air monitoring                              precursors such as sulphur dioxide, nitrogen oxides
stations throughout Germany (Figure 1). It is the                           and ammonia. Particulate matter has been proven
task of the individual federal states to monitor the                        to have a negative impact on human health.
air quality, therefore most of the data come from
their monitoring networks. For the Germany-wide                             Nitrogen dioxide (NO2)
assessment of the air quality, the data gathered by the                     is a reactive nitrogen compound which occurs in the
federal states is collected and evaluated at the UBA.                       form of a by-product during combustion processes,
                                                                            particularly in motor vehicles, and can have several
                                                                            negative effects on the environment and health.
Figure 1
                                                                            Nitrogen dioxide affects the respiratory mucous
Overview of the monitoring stations in Germany                              membrane, influences the respiratory function and
                                                                            can lead to a Bronchoconstriction, which may be
                                                                            worsened by the impact of allergens.

                                                                            Ozone (O3)
                                                                            is a colourless and toxic gas which forms a natural
                                                                            layer in the upper atmosphere (stratosphere) and
                                                                            protects the earth from the harmful ultraviolet radi-
                                                                            ation from the sun (the ozone layer). During intense
                                                                            sunlight, however, it also arises at ground-level
                                                                            due to complex photochemical processes between
                                                                            ozone precursors – primarily nitrogen oxides and
                                                                            volatile organic compounds. High concentrations of
                                                                            ozone can cause people to suffer coughs, head-
                                                                            aches and respiratory tract irritations.

                                                                         The evaluation and assessment of the air quality
                                                                         takes place in terms of the limit and target values as
                          Source: German Environment Agency (UBA) 2021   defined by the Directive on Ambient Air Quality and

6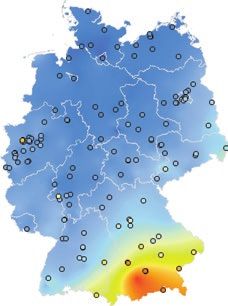
I Air Quality in 2020: Data Basis and Evaluation Methodology
Cleaner Air for Europe1. The results are also compared primarily caused by different weather conditions of
with the considerably stricter recommendations of the this kind. They therefore affect the influence of the
World Health Organization (WHO). more long-term development of the emissions.
2 Provisional Nature of the Information 4 Influence of Environmental Conditions
This evaluation of air quality in Germany in the year In the following sections, the concentration values
2020 is based on preliminary data which has not yet recorded at the individual air monitoring stations
been conclusively audited from the air monitoring are summarised in the form of what are referred to
networks of the federal states and the UBA, valid on as “pollution regimes”. Pollution regimes group air
1st February 2021. Due to the comprehensive quality monitoring stations together with similar environ-
assurance within the monitoring networks, the final mental conditions. The “rural background” regime
data will only be available in mid-2021. relates to areas in which the air quality is largely
uninfluenced by local emissions. The air monitoring
The currently available data allows for a general stations in this regime therefore represent the
assessment of the past year. The following pollutants regional pollution level, which is also referred to as
were subject to consideration: particulate matter the regional background. The “urban background”
(PM10 and PM2.5), nitrogen dioxide (NO2) and ozone regime is characterised by areas in which the meas-
(O3), since, the measured concentrations are either ured pollutant concentrations can be seen as being
slightly higher or lower than the limit and target typical for the air quality in the city. In this respect,
values for the protection of human health for such the pollution results from emissions in the city itself
pollutants. (road traffic, heating systems, industry, etc.) and
that in the regional background. The air monitoring
3 Causes of Air Pollution stations in the “urban traffic” regime are typically
The primary sources of the air pollutants are road located on busy roads. As a result of this, the urban
traffic and combustion processes in industry, the background pollution is joined by a contribution
energy sector and households. Agriculture also which arises due to the direct road traffic emissions.
contributes to particulate matter emissions due to the Figure 2 provides a diagrammatic representation
formation of what are known as “secondary parti- of the contributions by the individual pollution
cles”, which are particles that arise from complex regimes, although it only provides the approximate
chemical reactions between gaseous substances. The proportions. Another pollution regime relates to
degree of the pollution level is also influenced by measurements in the vicinity of industrial areas,
the weather conditions. In cold weather, emissions which are used to assess the contribution of indus-
(quantity of a pollutant released to the ambient air) trial emissions to the air quality in nearby residential
often increase because for example heating systems areas.
go into increased use. High-pressure weather during
the winter, which is often characterised by low wind
Figure 2
speeds and a limited vertical exchange of air, means
that air pollutants become concentrated in the lower Diagrammatic presentation of the pollution regimes
atmospheric strata. High-pressure weather in the for particulate matter and nitrogen dioxide
summer, with intense sunlight and high tempera- Modified according to Lenschow*
tures, acts to boost the formation of ground-level
ozone.
At high wind speeds and under positive mixing
conditions, the levels of pollution fall, however.
Inter-year variations in the levels of air pollution are
rural background urban background urban traffic
1 EU Directive 2008/50/EC, which became German law with the 39th Ordinance
Implementing the Federal Immission Control Act (Ordinance on Air Quality * Lenschow et al., Some ideas about the sources of PM10,
Standards and Emission Ceilings – 39. BImSchV). Atmospheric Environment 35 (2001) p. 23–33
7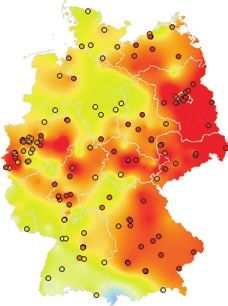
II Particulate Matter: Further Reduction of Pollution

II Particulate Matter: Further Reduction of Pollution
1 PM10 – 24-hour Values                                            shares of traffic stations with exceedances has been
Like in the year before, none of the 380 stations                  below 10 percent, and no exceedances at background
measured PM10 24-hour values over 50 µg/m³ at                      stations have occured anymore (see figure 3).
more than 35 days. Thus, the positive trend of
the past years continues. In the past, most of the                 The recommendations of the World Health Organiza-
exceedances occured at traffic stations (up to more                tion (WHO2) were not complied with at 12 percent of
than half of those stations in 2006). Since 2012 the               all air monitoring stations, and therefore much less
                                                                   than in the year before (37%).

                                                                   Figure 4 shows how many days were recorded on
                                                                   which the limits were exceeded, on average, per
                                                                   month. In this case, 2020 is compared with the
    EU limit value
                                                                   previous year (2019) and an extended reference
    The 24-hour PM10 value must not exceed 50 µg/m³
                                                                   period (2005–2019). It can be seen that in 2020
    more than 35 times per year.

    WHO recommendation
    The 24-hour PM10 value should not exceed 50 µg/m³              2   WHO Air quality guidelines for particulate matter, ozone, nitrogen dioxide and
                                                                       sulfur dioxide, Global update 2005: http://www.euro.who.int/en/health-topics/
    more than 3 times per year.                                        environment-and-health/Housing-and-health/publications/pre-2009/air-qualit-
                                                                       yguidelines.-global-update-2005.-particulate-matter,-ozone,-nitrogen-dioxide-
                                                                       and-sulfur-dioxide

Figure 3

Percentage share of air monitoring stations exceeding the PM10 limit value
for the 24-hour values in the corresponding pollution regime, time frame 2005–2020

    70%

    60%

    50%

    40%

    30%

    20%

    10%

     0%
           2005      2006   2007   2008    2009   2010   2011   2012   2013    2014      2015      2016     2017      2018      2019     2020

                        rural background                 urban background                       urban traffic

                                                                                                        Source: German Environment Agency (UBA) 2021

8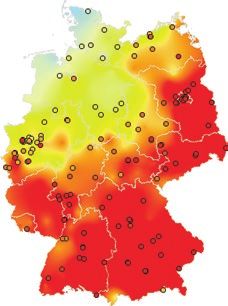
II Particulate Matter: Further Reduction of Pollution

Figure 4

Average number of days on which the PM10 limit was exceeded (24-hour values > 50 μg/m³)
per month in the corresponding pollution regime, shown for the years 2020, 2019 and the period 2005–2019.

            2020

            2019                                                                                                      rural background

    2005–2019

            2020

            2019                                                                                                    urban background

    2005–2019

            2020

            2019                                                                                                      urban traffic

    2005–2019

                    0                           5                          10                   15                     20                          25

           Jan          Feb          Mar         Apr          May          June     July      Aug       Sept       Oct          Nov          Dec

                                                                                                               Source: German Environment Agency (UBA) 2021

there were only very few days on which the limits                                 2 PM10 – Annual Mean Values
were exceeded, most of them occurred in January                                   In 2020 the decreasing trend of the mean PM10 pollu-
and March. This extraordinarily low number of                                     tion continued. 2020 was the year with the lowest
exceedance days goes along with a very mild and wet                               level of pollution compared to the considered period
winter: Both January and February showed, besides                                 since 2000 (Figure 5). Accompanied by the regional
April and August, highest positive temperature                                    falls in the PM10 emissions, the annual mean PM10
differences3. Since the beginning of recording, this                              values also show a clear fall in all pollution regimes
winter has been the second warmth4. Even though                                   throughout the entire period of observation. The
in 2020 no episodes with high particulate matter                                  progression is also characterised by strong inter-year
concentrations were observed, with weather condi-                                 variations, however, particularly due to the different
tions like low temperatures and stable high-pressure                              weather conditions. The PM10 limit of 40 µg/m³ as the
area exceedances of PM10 limit values for the 24-hour                             annual mean value was complied with throughout
values cannot be excluded in the future.                                          Germany. Only 5 percent of the air monitoring
                                                                                  stations recorded values that infringed the air quality
                                                                                  guidelines proposed by the WHO. All of these air
                                                                                  monitoring stations were in urban traffic locations.

3   Press release of the German weather service DWD, 2019: https://www.dwd.de/
    DE/presse/pressemitteilungen/DE/2019/20191230_deutschlandwetter_
    jahr2019_news.html?nn=16210
4   Press release of the German weather service DWD: https://www.dwd.de/
    DE/presse/pressemitteilungen/DE/2020/20200228_deutschlandwetter_
    winter2019_2020.html?nn=714786

                                                                                                                                                         9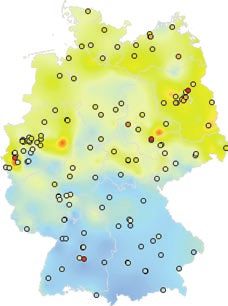
II Particulate Matter: Further Reduction of Pollution

Figure 5

Development of the annual mean PM10 values
via selected air monitoring stations in the corresponding pollution regime, time frame 2000–2020

             40

             35

             30

             25
     µg/m³

             20

             15

             10

              5

              0
                  2000 2001 2002 2003 2004 2005 2006 2007 2008 2009 2010 2011 2012 2013 2014 2015 2016 2017 2018 2019 2020

                             rural background              urban background              urban traffic

                                                                                              Source: German Environment Agency (UBA) 2021

3 PM2.5 – Air Pollution
From 1st January 2015, for the smaller fraction of                     EU limit value
particulate matter which only contains particles with                  The annual mean PM10 value must not exceed
a maximum diameter of 2.5 micrometres (µm), an                         40 µg/m³.
annual mean limit of 25 µg/m³ applies throughout
Europe. In Germany, since 2015 and also in 2020,                       WHO recommendation
this value was not exceeded at any air monitoring                      The annual mean PM10 value should not exceed
station. The annual mean PM2.5 values decrease                         20 µg/m³.
during the entire period and for all pollution regimes
(Figure 6). This figure shows concentrations at urban
background and traffic stations, which are usually
higher polluted, at the same level than rural back-
ground stations some years ago. However, the stricter                  EU limit value
recommendations of the WHO (10 µg/m³ as the                            the annual mean PM2.5 value must not exceed
annual mean value) were not complied with at 13 per                    25 µg/m³.
cent of about 160 measuring stations, which were less
exceedances than in 2019 (56%). Furthermore, the                       WHO recommendation
WHO recommendation is that the 24-hour PM2.5 value                     The annual mean PM2.5 value should not exceed
should not exceed 25 µg/m³ more than 3 times a year.                   10 µg/m³. The 24-hour PM2.5 value must not exceed
This recommendation was not complied with at most                      25 µg/m³ more than 3 times per year.
air monitoring stations (86%). The EU Air Quality

10
II Particulate Matter: Further Reduction of Pollution
Figure 6
Development of the annual mean PM2.5 values and of the Average Exposure Indicator (AEI)
via selected monitoring stations in the corresponding pollution regime, time frame 2010–2020
20
17,0
16,2
15,3
16,4
15
14,6
14,1 13,4 12,1
12,6 12,6 11
µg/m³
10
5
0
2010 2011 2012 2013 2014 2015 2016 2017 2018 2019 2020
rural background urban background urban traffic
AEI (3-year averaging period) reduction target
Source: German Environment Agency (UBA) 2021
Directive also requires the average exposure of the
population to PM2.5 to be reduced until the year 2020. Exposure
For this purpose, the Average Exposure Indicator The contact of an organism with chemical, biologi-
(AEI) was developed. As the initial value for Germany cal or physical influences is known as “exposure”.
for 2010, an AEI of 16.4 µg/m³ was calculated as the A person is “exposed” to particulate matter, for
average value of the years 2008 to 2010. According example.
to the requirements of the EU Directive, this results
in a national reduction goal of 15 percent until 2020. How is the Average Exposure Indicator (AEI)
Accordingly, the AEI calculated for 2020 (average calculated?
value of the years 2018, 2019 and 2020) may not The average exposure indicator is determined as
exceed the value of 13.9 µg/m³. Even with not all of an average value over a period of 3 years from the
the necessary data available it is clear: Germany will individual annual mean PM2.5 values of selected air
meet the reduction target of 15 percent in 2020. The monitoring stations with an urban background. This
AEI for 2020 (average value of the years 2018, 2019 results in a value which is expressed in µg/m³ for
and 2020) is 11 µg/m³ with those data available at each 3-year period.
the moment, and therefore well below the required
13,9 µg/m³.
In addition, from 1st January 2015 onwards, the AEI
is not permitted to exceed a value of 20 µg/m³. This
value has not been exceeded in Germany since the
start of the measurements in 2008.
11III Nitrogen Dioxide: Hardly any Exceendances
III Nitrogen Dioxide: Hardly any Exceendances
1 NO2 – Annual Mean Values
Nitrogen dioxide is measured at about 400 automatic EU limit values
monitoring stations across Germany. In addition, The annual mean NO2 value must not exceed
about 140 passive collectors measure nitrogen 40 µg/m³.
dioxide. Most of the data of the passive collectors
is not yet available and thus not included in this WHO recommendation
preliminary evaluation. Taking into account all meas- The WHO recommendation is equivalent to the EU
urement data, available for UBA at 1st February 2021, limit value.
2 percent of the air monitoring stations in urban
traffic locations exceeded the limit. On the basis of a
projection derived from the previous years’ data, we
estimate the proportion of all air monitoring stations influence of the closure or opening of stations on
in urban traffic locations that exceeded the limit and the development of the average NO2 values only air
thus the identical WHO recommendation in 2020 to monitoring stations were selected for this figure that
be approx. 3 to 4 percent (Figure 7, red bars). conducted measurements over an extended period.
The levels of pollution are primarily determined by
The nitrogen dioxide pollution shows a clear decrease local emission sources – particularly the traffic in
in the last decade, particularly pronounced in the urban conurbations – and only show limited inter-
last few years (Figure 8). In order to minimize the year variations due to weather.
Figure 7
Percentage share of air monitoring stations exceeding the NO2 limit value for the annual mean
in the corresponding pollution regime, time frame 2010–2020
80%
70%
60%
50%
40%
30%
20%
10%
0%
2010 2011 2012 2013 2014 2015 2016 2017 2018 2019 2020
rural background urban background urban traffic projection urban traffic
Source: German Environment Agency (UBA) 2021
12III Nitrogen Dioxide: Hardly any Exceendances
Figure 8
Development of the annual mean NO2 values
via selected air monitoring stations in the corresponding pollution regime, time frame 2000–2020
60
50
40
µg/m³
30
20
10
0
2000 2001 2002 2003 2004 2005 2006 2007 2008 2009 2010 2011 2012 2013 2014 2015 2016 2017 2018 2019 2020
rural background urban background urban traffic
Source: German Environment Agency (UBA) 2021
In rural areas, which are typically a long way from lines). Why the Lockdown of March and April is
the major sources of NO2, from 2000–2020, the not reflected directly in figure 9 is explained in the
average annual concentration for all the air monitor- special chapter starting on page 20.
ing stations amounted to 10 µg/m³ (Figure 8, green
curve). At the air monitoring stations with an urban In the last years, the concentrations were above
background, the values were well below the limit of 40 µg/m³ and therefore above the limit value at a
40 µg/m³ with a slight decline over the last 20 years large part of the stations close to traffic. This has
(Figure 8, yellow curve), as it is also seen at rural changed now: there are only few stations with
background stations. In 2020, like in the previous concentrations above 40 µg/m³. Figure 10 shows the
year, the average NO2 concentration at urban traffic NO2 annual mean values of all air monitoring stations
air monitoring stations was well below 40 µg/m³. in urban traffic locations as bars in descending order.
Thus, the trend in reduction over the last ten years
continues. The gaps result from the missing data of the passive
collectors, which are only available in the course
Figure 9 shows the annual variation of NO2 in the of 2021. Their position in the descending order is
three pollution regimes within the last five years (only deduced from the data of the previous year. The pink
stations with data in all five years). A clear decline curve shows the annual mean values of the previous
of concentrations can be seen. Except for variations year, in descending order as well. It is apparent that
due to weather conditions, which often lead to higher the values decreased not only in highly-polluted
concentrations in winter and lower concentrations in areas but also at traffic stations with median or low
summer especially in the urban background regime, concentrations.
most of the monthly mean values are lower as in the
year before. Therefore, a steady decline of annual
means is seen in every pollution regime (dashed
13III Nitrogen Dioxide: Hardly any Exceendances
Figure 9
Medium NO2 monthly mean values of the period 2016–2020
µg/m³ 2016 2017 2018 2019 2020
60
50
40
30
20
10
0
Jan
Mar
May
July
Sep
Nov
Jan
Mar
May
July
Sep
Nov
Jan
Mar
May
July
Sep
Nov
Jan
Mar
May
July
Sep
Nov
Jan
Mar
May
July
Sep
Nov
urban traffic urban background rural background
Source: German Environment Agency (UBA) 2021
2 NO2 – One Hour Values
Since 2010, one hour NO2 values exceeding 200 µg/m³ EU limit value
are only permitted a maximum of 18 times per year. The one hour NO2 values must not exceed
In 2020, like in the previous years, this value was 200 µg/m³ more than 18 times per year.
not exceeded. The last time that few exceedances at
urban traffic station were recorded was in 2016. WHO recommendation
The one hour NO2 values should never exceed
Only one of about 200 air monitoring stations in 200 µg/m³.
urban traffic locations failed to comply with the WHO
recommendation in 2020.
14III Nitrogen Dioxide: Hardly any Exceendances
Figure 10
NO2 annual mean values 2020
of all urban traffic monitoring stations
80
70
60
50
limit value = 40 µg/m3
µg/m³
40
30
20
10
0
Bars: NO2 annual mean values 2020 in descending order; gaps: missing data of passive collectors
Line as a comparison to the previous year: NO 2 annual mean values 2019 in descending order
Source: German Environment Agency (UBA) 2021
15IV Ground-level Ozone: Less Pollution than in both Previous Years
IV Ground-level Ozone: Less Pollution
than in both Previous Years
1 O3 – Information and Alert Threshold out clearly. But also the year 2015, with exceptional
Ozone is measured at about 260 monitoring stations hot and dry periods in July and August, was charac-
throughout Germany. In 2020, the highest 1-hour terised by a rather high ozone pollution.
average value amounted to 235 µg/m³. This value
is considerably lower than the previous year value The reason for the variation of the peak concentration
(314 µg/m³). In 2020 the alert threshold of 240 µg/m³ between the years is the high dependency on the
was not exceeded. The information threshold of weather conditions. In contrast to particulate matter
180 µg/m³ was exceeded on 13 days. 2020 was a and nitrogen dioxide, ozone is not emitted directly
less affected year with regards to exceedances of the but formed from specific precursors (nitrogen oxides
threshold values, compared to the last 20 years, see and volatile organic compounds) and with intensive
figure 11. It also shows that the exceedances of the solar radiation. When there are several days of
information threshold vary in a wide range between summery high-pressure weather conditions, ozone
the years, the record-breaking summer of 2003 sticks can be accumulated in the lower atmospheric layers
which leads to high concentrations. After the first
Figure 11
Hours during which the information threshold (180 μg/m³) for ozone was exceeded
Average over selected monitoring stations, time frame 2000–2020
50
45
40
35
30
number of hours
25
20
15
10
5
0
2000 2001 2002 2003 2004 2005 2006 2007 2008 2009 2010 2011 2012 2013 2014 2015 2016 2017 2018 2019 2020
rural background urban background
Source: German Environment Agency (UBA) 2021
16IV Ground-level Ozone: Less Pollution than in both Previous Years
summer days in April, both June and July were quite differences between the years. In 2020 especially
unstable. Only in August a long-lasting heat wave the south-west and west of Germany was affected by
with temperature maxima around 35 °C occurred. exceedances of the long-term objective, but overall
Overall, the summer was too warm and too dry, and Germany was less polluted than in the year before.
2020 was the second warmth year since the begin- Ozone concentration is generally lower in Northern
ning of records in 18815. Germany, particularly so in 2015.
2 O3 – Target Value for the Protection The WHO recommendation that the 8-hour average
of Human Health values should not exceed 100 µg/m³ was missed
At almost all monitoring stations (=100%) 8-hour again at almost all stations.
average values of over 120 μg/m³ were measured, so
that, like in the previous year, the long-term objective A 3-year period is monitored for the target value
is not complied with. for the protection of human health: on average,
an 8-hour average value of 120 µg/m³ may only be
In 2020, an ozone value of 120 µg/m³, as the highest exceeded on 25 days. In the most recent averaging
daily 8-hour average value, was exceeded on an period of 2018 to 2020, however, 48 percent of the air
average of 17 days per station. Compared to the monitoring stations exceeded this value on more than
time period since 2000, this value is slightly above 25 days. This is slightly more than in the previous
average. In the previous year, 24 exceedance days averaging period (42 percent). Figure 13 shows that
were recorded as an average over all air monitoring most cases in which the target values were exceeded
stations. occurred in rural areas – in contrast to pollutants
such as particulate matter and nitrogen dioxide,
Figure 12 shows the spatial distribution of the which have the highest concentrations in the vicinity
number of exceedance days in 2020 in comparison of roads, the ozone values in the vicinity of roads are
to the last five years. This figure highlights the a lot lower. Therefore, ozone is rarely measured at air
monitoring stations in urban traffic locations.
5 https://www.dwd.de/DE/presse/pressemitteilungen/DE/2020/20200831_
deutschlandwetter_sommer2020.html?nn=714786
Figure 12
Spatial distribution of the number of days on which the long-term objective for the protection of human
health was exceeded (number of days with 8-hour average values > 120 μg/m³)
time frame 2015–2020, based on station measurements and a geostatistical interpolation method
2015 2016 2017 2018 2019 2020
0–5 > 10 > 20 > 30 > 40 > 75
>5 > 15 > 25 > 35 > 50
Source: German Environment Agency (UBA) 2021
17IV Ground-level Ozone: Less Pollution than in both Previous Years
Figure 13
Percentage share of air monitoring stations recording an exceedance of the target value
for the protection of human health, time frame 2010–2020 (in each case, 1-year moving average over 3 years)
80%
70%
60%
50%
40%
30%
20%
10%
0%
2008–2010 2009–2011 2010–2012 2011–2013 2012–2014 2013–2015 2014–2016 2015–2017 2016–2018 2017–2019 2018–2020
3-years-average
rural background urban background
Source: German Environment Agency (UBA) 2021
3 O3 – Protection of the vegetation stations. In both 2018 and 2019, the target value was
According to the EU Air Quality Directive, to exceeded at every station. Averaged over all rural
determine the target values for the protection of the background stations the AOT40-value in 2020 is very
vegetation (AOT40), only the data from the around low in comparison to other years since 2000, and well
160 air monitoring stations in non-urban locations below the value of 2018 and 2019.
is considered. For the target value (which has been
mandatory since 2010), an averaging over a five-year New methods of the impact evaluation of ozone have
period is required. The target value (18,000 µg/m³ h been developed meanwhile. They are recommended
obtained from May to July) for the most recent aver- for monitoring air pollution impacts according to
aging period of 2016 to 2020 was exceeded at 32 out annex V in the NEC-directive (Directive 2016/2284
of 161 air monitoring stations (= 20%, previous year: on the reduction of national emissions of certain
31%). atmospheric pollutants). In this respect, it isn’t just
the concentration of ozone, but the meteorological
In 2020, the long-term objective for the protection conditions, the opening characteristics of the stomata
of the vegetation (6,000 µg/m³ h) was complied with of the plants and therefore the ozone flux into the
at 23 monitoring stations, that is 15 percent of all plants, which are taken into account.
18IV Ground-level Ozone: Less Pollution than in both Previous Years
Information threshold WHO recommendation
With ozone values of over 180 µg/m³ (1-hour average The 8-hour average values should never exceed
value), the general public is notified by the media of 100 µg/m³.
the presence of a health risk for particularly sensitive
sections of the population. Target values for the protection of vegetation (AOT40)
The term AOT40 (Accumulated Ozone exposure over a
Alert threshold Threshold of 40 parts per billion) designates the total
With ozone values of over 240 µg/m³ (1-hour average sum of the differences between the 1-hour average
value), the general public is warned by the media of the values exceeding 80 µg/m³ (= 40 ppb) and the value
presence of a general risk to human health. 80 µg/m³ between 8 am and 8 pm in the months of May
to July. Since 2010, as 5-year average, the AOT40 target
Target values for the protection of human health value should not exceed a value of 18,000 µg/m³ h –
Ozone values of over 120 µg/m³ (highest daily 8-hour i. e. 9,000 ppb h and/or 9 ppm h. Over the long term,
average value) are only permitted to occur on a the value should not exceed a maximum value of
maximum of 25 days per calendar year, averaged over 6,000 µg/m³ h in one year – i. e. 3,000 ppb h and/or
3 years. Over the long term, the 8-hour average values 3 ppm h.
should never exceed 120 µg/m³ (long-term objective).
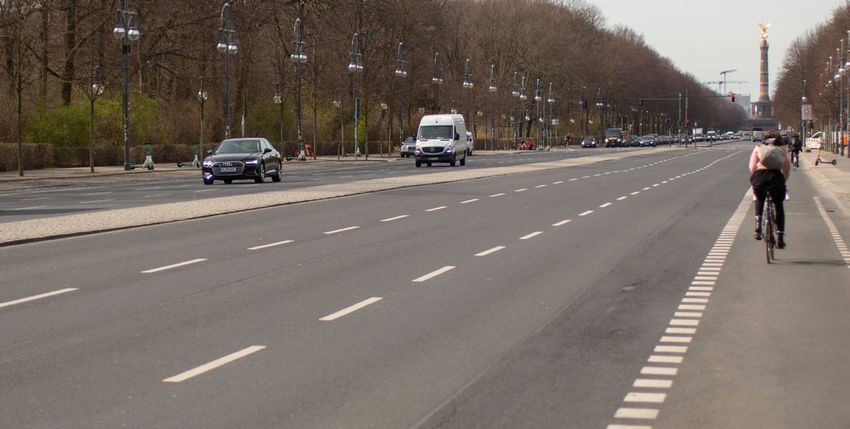
The measuring field of the UBA monitoring station Schauinsland in January 2021. Located 1.200 meters above sea level, this means a lot
of additional work for the staff due to snow and ice in such winterly conditions.
19V Current air quality conditions throughout Germany
V Air Quality During the Spring Lockdown
1 Introduction
Less traffic, less production, fewer pollutants: Which effects have an influence on the air quality at
environmental pressures are decreasing as a result of ground level?
the Corona crisis. In relation to the medium air, this The concentration of an air pollutant results from
becomes particularly visible on the basis of satellite the interaction of various processes. Important
measurements. Satellite data from the spring of 2020 factors influencing the concentration of air pollut-
show that pollution levels within the atmosphere ants at a location include
decreased in many countries around the world.
▸▸ Local emissions: the release of air pollutants
and precursors into the atmosphere
Fig. 14 illustrates that large parts of Europe, espe-
▸▸ Transmission: horizontal transport and vertical
cially hotspots such as the Po Valley, Madrid, Paris,
mixing of air pollutants in the atmosphere
Milan and Rome, showed a decrease in tropospheric
▸▸ Chemical processes: chemical production,
nitrogen dioxide (NO2) during the months of lock-
conversion and degradation of air pollutants
down compared to the previous year. This amounted
▸▸ Deposition: processes that remove air pollut-
to more than 40 percent in many places (DLR2020).
ants from the atmosphere by deposition on the
It is however worth noting that the satellite captures
ground
the total amount of pollutant between the ground
▸▸ Background concentration: underlying pollution
and the measuring instrument. The concentration of
at a location not in the immediate vicinity of
pollutants varies greatly in this “column”, however,
emission sources (including from cross-border
and usually decreases with increasing altitude.
transport)
Conclusions about air quality on the ground, i. e.
▸▸ Prevailing weather conditions
where people are breathing the air, can therefore not
▸▸ Measuring station location on a small and large
readily be drawn.
scale
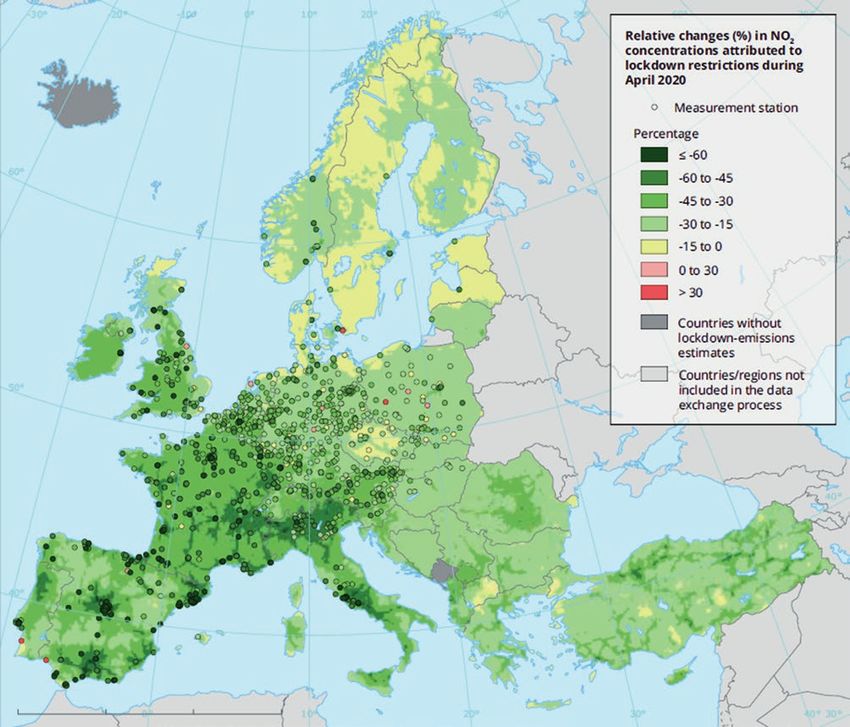
Federal and state-wide measures to contain the
Corona pandemic came into effect in Germany in
March 2020. Kindergartens and schools were closed, the house if they had a valid reason to do so, were
and people began to work from home more. Begin- in effect nationwide. The following constraints on
ning on the 23 March 2020, far-reaching contact public life have resulted in a significant decrease in
bans, under which people were only allowed to leave mobility/road travel during this time:
Figure 14
Comparison of NO2 levels in the total air column in Europe between March/April 2019 and 2020
March–April 13 March–13 April
2019 2020
Source: https://www.dlr.de/content/de/bilder/2020/02/earth-day-stickstoff-konzentration.html
20V Current air quality conditions throughout Germany
▸▸ Spending time in public spaces was only Changes in road traffic during the lockdown period
permitted when alone, with one other person not State evaluations can be used to quantify the reduc-
residing in the same household, or with members tion in road traffic during the lockdown as follows:
of one’s own household;
In Berlin, the number of vehicles identified as cars
▸▸ Catering establishments, cultural and leisure and small trucks fell by 20–30 percent, while the
facilities and personal care services were forced to number of medium and large trucks remained about
close; the same. A rough estimate suggests that nitrogen
oxide emissions decreased by about 15–20 percent
▸▸ Retail stores which were not necessary for daily (BE2020) on account of the observed decrease in
needs were closed; traffic for passenger cars and small trucks. Traffic
volume measurements at three locations in Hesse
▸▸ Events, meetings, religious services, etc. were showed that, on average, traffic volumes decreased by
prohibited. approximately 30 to 40 percent, with the percentage
of traffic reduction being greater on weekends than
The following averaging periods for air quality data during the week (HE2020). Daily traffic volumes on
are examined in the following evaluations with the Heiligengeistwall in Oldenburg, Lower Saxony,
consideration of the duration of the above-mentioned showed a significant decrease in total traffic volume
restrictions (see Tab. 1): (40–50 percent), most notably for passenger cars,
though the number of vans, trucks, and buses also
Table 1 decreased (NI2020). According to estimates from
North Rhine-Westphalia, road traffic decreased by
Averaging periods by calendar weeks and as much as 30 to 50 percent (NW2020). The counting
corresponding periods with date station at Mommsenstraße/Bergstraße in Dresden
Averaging period corresponds to the time period recorded a 42 percent decrease in total traffic, a 44
percent decrease in car traffic, and a 25 percent
CW1–CW4 30.12.2019–26.01.2020 decrease in delivery traffic (SN2020).
CW5–CW8 27.01.2020–23.02.2020
This exemplary data shows that the lockdown
CW9–CW12 24.02.2020–22.03.2020
significantly reduced traffic, but it was not brought to
*CW13–CW16 23.03.2020–19.04.2020 a complete standstill. Buses in the public transport
system and private cars were still on the road in the
CW17–CW20 20.04.2020–17.05.2020
cities. It must even be assumed that there was an
CW21–CW24 18.05.2020–14.06.2020 increased volume of delivery traffic at times. It can
also be assumed that public transport was avoided in
CW25–CW28 15.06.2020–12.07.2020
many cases due to the risk of infection and that the
CW29–CW32 13.07.2020–09.08.2020 use of cars increased. Furthermore, other emission
effects are also conceivable, e. g. resulting from the
CW33–CW36 10.08.2020–06.09.2020
increased number of people working from home.
CW37–CW40 07.09.2020–04.10.2020
Focus on pollutants
CW41–CW44 05.10.2020–01.11.2020
Road traffic and power generation are the main
CW45–CW48 02.11.2020–29.11.2020 sources of nitrogen dioxide pollution (see Fig. 15,
left). Consequently, the highest NO2 concentrations in
CW49–CW52 30.11.2020–27.12.2020
metropolitan areas and cities are typically measured
on busy roads. It was therefore to be expected that
reduced traffic counts during the spring Corona
The period most affected by the lockdown measures
lockdown would have had an impact on nitrogen
occurred in calendar weeks 13 to 16 (March 23 to
dioxide levels.
April 19).
21V Current air quality conditions throughout Germany
Figure 15
Composition of German NOx and PM10 emissions for the year 2019
10% 10%
7% 25%
14%
4% 40%
NOx emissions PM10 emissions
2019 2019 5%
8%
3%
20%
39%
15%
Power generation Road transport Other traffic Industrial processes
Agriculture Waste Wood combustion Bulk handling
Source: German Environment Agency (UBA) 2021
Excursus on particulate matter (PM10)
Although everyday particulate matter pollution is shows days with a high Saharan Dust Index6 during that
mostly determined by local and regional sources of time period. The areal PM10 maps also illustrate that
particulate matter, atmospheric transport processes this type of long-distance transport led to increased
over sometimes long distances also play an important PM10 levels here in Germany, despite being in the
role in this regard. This is not the case with NO2. One middle of the lockdown period. This example demon-
such transport process occurred at the end of March strates how possible lockdown-induced PM10 decreases
2020, when Saharan dust from North Africa reached can be outweighed by atmospheric influences to a
Germany: The DWD (German Meteorological Service) greater extent than for NO2.
0 10 20 30 40 >50 μg/m3
Daily mean values of particulate matter (PM10) from 26–29 March 2020 Source: German Environment Agency (UBA) 2021
6 Saharastaub-Index des DWD, Quelle: https://www.dwd.de/DE/forschung/
atmosphaerenbeob/zusammensetzung_atmosphaere/aerosol/inh_nav/
saharastaubindex_node.html
22V Current air quality conditions throughout Germany
Figure 16
Hourly NO2 levels in March and April 2020 for all stations close to traffic. Lockdown period marked
µg/m³
180
160
140
120
100
80
60
40
20
0
04.04.2020 02:00
01.03.2020 01:00
03.03.2020 01:00
05.03.2020 01:00
11.03.2020 01:00
13.03.2020 01:00
15.03.2020 01:00
07.03.2020 01:00
09.03.2020 01:00
17.03.2020 01:00
19.03.2020 01:00
21.03.2020 01:00
23.03.2020 01:00
25.03.2020 01:00
27.03.2020 01:00
29.03.2020 01:00
31.03.2020 02:00
02.04.2020 02:00
06.04.2020 02:00
08.04.2020 02:00
10.04.2020 02:00
12.04.2020 02:00
14.04.2020 02:00
16.04.2020 02:00
18.04.2020 02:00
20.04.2020 02:00
22.04.2020 02:00
24.04.2020 02:00
26.04.2020 02:00
28.04.2020 02:00
30.04.2020 02:00
Source: German Environment Agency (UBA) 2021
By contrast, road traffic accounts for a much smaller 2 NO2 Situation During the Spring Lockdown
share of total emissions of particulate matter in
Germany (see Fig. 15, right). Agriculture is another Concentration developing (01.03. to 30.04.2020)
significant source of emissions, especially in the Fig. 16 shows the hourly course of NO2 concentrations
spring: When fertilising the fields, particulate matter at all monitoring stations close to traffic for the
is formed from gaseous precursors, which is then also months of March and April 2020. At first glance, no
transported into the cities by the wind. Furthermore, decrease in concentrations during the marked lock-
particulate matter can also be of natural origin – for down period is discernible – contrary to expectations
example Saharan dust or as a result of soil erosion, based on the reduced traffic figures.
forest fires and bush fires – and can be transported
to Germany over long distances. Short-term reduc- Average diurnal variation
tions in only a few sources of particulate matter, On closer inspection, however, two particular
for example through the lockdown, can therefore features can be seen in the average diurnal variations
not be expected to lead to a significant reduction in (see Fig. 17 above) across all stations close to traffic
concentrations. Other sources of particulate matter throughout Germany:
may even contribute to such an extent that increased
concentrations of particulate matter may occur ▸▸ During the lockdown in spring, average concen-
despite reduced traffic volumes (see box “Excursus on trations in the early morning hours were above
particulate matter”). In the following evaluations of average.
the concentration data, particulate matter is therefore ▸▸ The average load in the afternoon hours
not considered further, the focus is instead placed on (13–18 hrs) was lower than throughout the rest of
NO2. the year.
These effects vary regionally and locally, as is seen
from the average traffic-related diurnal variations
per federal state (Fig. 17 below). The afternoon load
23V Current air quality conditions throughout Germany
during the lockdown was significantly below the ▸▸ Calculation of differences between data from
average for 2020, especially in Berlin, Bavaria, Lower background stations in close proximity to traffic
Saxony and Saxony. Conceivable causes for this heter- and urban stations with largely identical weather
ogeneous picture include different decreases in traffic conditions,
figures (see chapter “Changes in road traffic during ▸▸ Comparison of temporally offset station data
the lockdown period”) and differing meteorological measured under similar meteorological condi-
conditions in Germany throughout the year. tions,
▸▸ Use of the statistical correlation between weather
The assessment of the afternoon pollution on and concentration,
weekdays for all German stations close to traffic ▸▸ Modelling concentration data with chemistry
(i. e. average for 13–18 hrs, weekdays) reveals a clear transport models.
picture: at 42 percent of all stations close to traffic,
the average afternoon load during the lockdown Evaluations of the federal states
period (CW13–CW16; 23.03.2020–19.04.2020) was In Germany, responsibility for monitoring air quality
the lowest observed for the entire year (see Fig. 18). to protect human health is located at state level,
Almost 20 per cent of the stations registered their which means that 99 percent of German measuring
lowest afternoon load in the calendar weeks immedi- stations are operated by the state environmental
ately following the lockdown (CW17-CW20; 20.04.– administrations. They have detailed knowledge of
17.05), which still saw school/childcare closures. the conditions on site and can assess and interpret
concentration trends of individual stations. A number
Meteorological conditions during of different approaches were used in the state evalu-
the lockdown period ations.
It is not possible to quantify the effects of the Corona
measures on NO2 concentrations directly based on the ▸▸ Using the differences between neighbouring
measurement data, as meteorological conditions have stations, Berlin calculated that the local NO2
a major influence on the concentration of pollutants content originating from traffic decreased by
in addition to emissions. approx. 15 percent (BE2020).
▸▸ Evaluations in Hesse looked for days with the
A low-pressure weather pattern favouring the spread same or similar wind currents as those during the
of air pollutants with mainly westerly currents, a lot lockdown for the previous six months. The results
of wind and high precipitation characterised Febru- suggested that NO2 concentrations decreased
ary and the first weeks of March 2020. At almost the significantly from the lockdown onwards. The
same time as the lockdown, the weather situation average decrease across all monitoring sites in
changed from mid-March onwards: For the most close proximity to traffic was about 35 percent
part, unfavourable circulation conditions prevailed (HE2020).
due to high-pressure weather conditions with little ▸▸ Mecklenburg-Western Pomerania compared the
wind and low levels of vertical air exchange. This led NO2 values during lockdown with those from the
to a situation in many places during the lockdown identical period in 2019. On average, the values
period where the decrease in emissions resulting for March and April 2020 were below those of the
from a reduction in road traffic was compensated for previous year (MV2020).
by meteorological influences, with the effect varying ▸▸ A similar approach was taken in North
in time and location. It is only possible to draw direct Rhine-Westphalia, using identical time periods
conclusions about emission reductions and concen- from 2015–2019, the result being that weekday
tration reductions after a “weather adjustment”. NO2 concentration values were significantly lower
“Weather-adjusted” means that the meteorological than in 2015–2019 (NW2020).
effects are removed from the concentration changes. ▸▸ The evaluations of the measuring stations in
The following approaches, among others, are used for Rhineland-Palatinate show that, with a few excep-
that purpose: tions, there was a reduction in NO2 concentrations
in 2020 for the March/April compared to the same
24V Current air quality conditions throughout Germany
Figure 17
Average daily NO2 concentrations in close proximity to traffic for Germany and all federal states in 2020,
lockdown period in yellow
60
50 Germany
40
µg/m³
30
20
10
0
01:00
02:00
03:00
04:00
05:00
06:00
07:00
08:00
09:00
10:00
11:00
12:00
13:00
14:00
15:00
16:00
17:00
18:00
19:00
20:00
21:00
22:00
23:00
24:00
60
50
40
30
20
10 Brandenburg Berlin Baden-Wuerttemberg Bavaria
0
60
50
40
30
20
Mecklenburg-
10 Bremen Hesse Hamburg Western Pomerania
0
60
50
40
30
20
10
Lower Saxony North Rhine-Westphalia Rhineland-Palatinate Schleswig-Holstein
0
60
50
40
30
20
10 Saarland Saxony Saxony-Anhalt Thuringia
0
01:00
03:00
05:00
07:00
09:00
11:00
13:00
15:00
17:00
19:00
21:00
23:00
01:00
03:00
05:00
07:00
09:00
11:00
13:00
15:00
17:00
19:00
21:00
23:00
01:00
03:00
05:00
07:00
09:00
11:00
13:00
15:00
17:00
19:00
21:00
23:00
01:00
03:00
05:00
07:00
09:00
11:00
13:00
15:00
17:00
19:00
21:00
23:00
CW1–CW4 CW5–CW8 CW9–CW12 *CW13–CW16 CW17–CW20
CW21–CW24 CW25–CW28 CW29–CW32 CW33–CW36 CW37–CW40
CW41–CW44 CW45–CW48 CW49–CW52
Source: German Environment Agency (UBA) 2021
25V Current air quality conditions throughout Germany
Figure 18
Distribution of the lowest afternoon NO2 pollution levels (Mon–Fri, 13–18 hrs) at all traffic-related measuring
stations in Germany 2020
2% 3%
2% 2% 1%
2%
15%
42%
12%
19%
CW1–CW4 CW5–CW8 CW9–CW12 *CW13–CW16 CW17–CW20
CW21–CW24 CW25–CW28 CW29–CW32 CW33–CW36 CW37–CW40
CW41–CW44 CW45–CW48 CW49–CW52
Source: German Environment Agency (UBA) 2021
period in 2019, ranging between 1–7 µg/m3 and Evaluations by the German Environment Agency
greater at traffic measuring stations than at the To quantify the impact of the Corona effect on
urban and rural background stations (RP2020). springtime NO2 pollution, the relationship was used
▸▸ Lower Saxony investigations revealed signifi- that the total traffic-related pollution is composed of
cantly lower temperature decreases with altitude the pollution in the urban background (i. e. in typical
during the lockdown period during nighttime urban residential areas) plus the local traffic contribu-
hours, which is an indication of greater atmos- tion directly at the road (see Fig. 19).
pheric stability. The result is poor dilution of
pollutants during the night hours. That is reflected Stations in close proximity to traffic and background
in above-average NO2 levels during the early stations within the same city are subject to the same
morning hours (see Fig. 17). large-scale weather conditions, i. e. favourable or
unfavourable propagation conditions affect all loca-
When comparing with identical periods of the previ- tions equally. A study of the local traffic contribution
ous year, it should be noted that long-term measures together with the traffic-related pollution therefore
to reduce emissions (e. g. fleet modernisation) may provides an indication of whether a change in the
also have led to a decrease in concentration values. traffic-related pollution is emission-related or weath-
The observed improvement in air quality in March er-related. Fig. 20 illustrates that with an example:
and April 2020 is therefore also – but not only – due in this case, the NO2 concentrations in a city show
to the influence of the effects of Corona. a peak value in the morning and evening hours, in
keeping with rush-hour traffic. Traffic-related pollu-
tion is higher in the evening than in the morning,
but that is obviously not due to an increase in traffic,
26You can also read