Caring for the Air 2018 - Metro Vancouver
←
→
Page content transcription
If your browser does not render page correctly, please read the page content below
Caring for the Air
2018
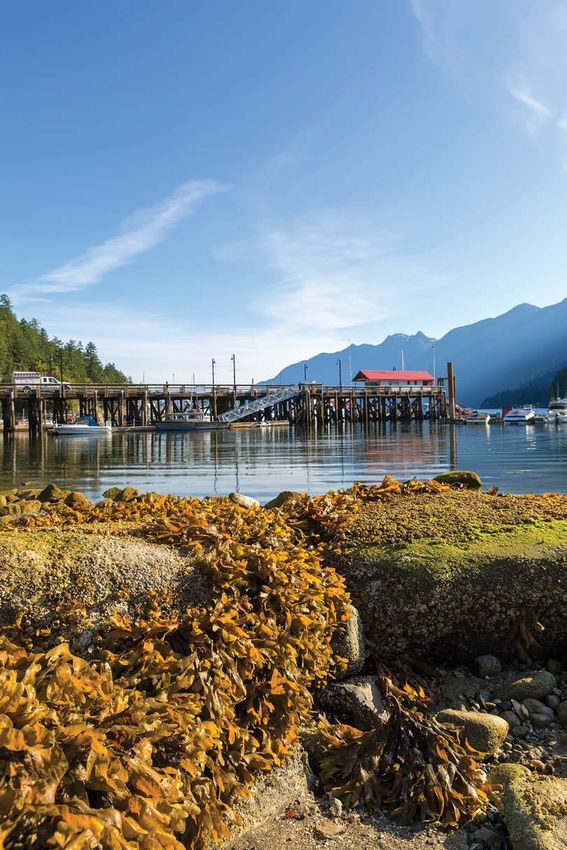
The Lower Fraser Valley airshed
Metro Vancouver is situated within the Lower Fraser Valley. Air pollution can freely cross our borders both from
and into the surrounding areas. These include the Fraser Valley Regional District to the east, Whatcom County
in the State of Washington to the south, Vancouver Island to the west and Howe Sound and the Sunshine Coast
to the north.

Managing air quality successfully requires effective collaboration with our neighbours and other levels of
government, and participation from businesses, public institutions, non-government organizations, and
residents. Many of the articles in this publication reflect these partnerships.

We would like to acknowledge the contributions made to this publication by:
City of North Vancouver
Climate Action; Public Opinion
In 2017 Metro Vancouver conducted a public opinion               •   Metro Vancouver residents generally have low
survey to understand the attitudes of Metro Vancouver                awareness of current actions being taken to address
residents towards both climate change and local                      climate change, particularly those taken by local
government responses to climate change. The research                 government.
explored residents’ opinions on the causes of climate
                                                                 Along with goals to protect air quality and public
change, the aspects of climate change that are of most
                                                                 health, Metro Vancouver’s Climate Action Committee
concern, people’s perception of the efforts of governments,
                                                                 provides advice and direction to minimize the region’s
businesses and individuals to address climate change, and
                                                                 contribution to global climate change. This survey shows
support for future actions to address climate change.
                                                                 that there is public support for further regional action on
The results of the survey support the development                climate change.
of a regional climate action plan, Climate 2050
                                                                 The Climate 2050 strategy will be an overarching climate
(see page 2). Metro Vancouver residents want to see
                                                                 action strategy for Metro Vancouver. It will outline Metro
more local action.
                                                                 Vancouver’s vision and goals to both reduce greenhouse
•   Metro Vancouver residents are highly aware of and            gas emissions and adapt to climate impacts. It will
    concerned about climate change, and the impacts in           also establish a framework to develop and implement
    our region.                                                  dynamic roadmaps for future climate action by Metro
                                                                 Vancouver, and facilitate learning and sharing of best
•   Metro Vancouver residents show strong support in
                                                                 practices with our members and others.
    principle for some authority, local government included,
    to take more initiative and develop actions to address
    climate change.

     LOCAL GOVERNMENTS CAN LEAD INITIATIVES TO ADDRESS CLIMATE CHANGE IN AREAS SUCH AS:

                                               engage on best
                                              practices to reduce
                                                GHG emissions

                                                               increase                           adhere to building
                                                         commitments to                            codes to reduce
                 prioritize energy                         clean energy                          GHG emissions from
              efficient infrastructure                                                           municipal buildings
             design and the delivery
                   of clean energy                                                        choose lower
                                                                                            emissions
                                                                                           vehicles for
    protect lands that
                                                                                         corporate fleets
    absorb climate
    impacts such as floods
    and droughts

                                                                                                            Caring for the Air 2018   1
Metro Vancouver’s Climate 2050 Strategy
                              CLIMATE 2050
                                                                   For nearly 20 years Metro Vancouver and local
                                                                   cities have been taking action on climate change,
                                                                   embedding effective climate actions into existing
                                                                   management plans. But we need to do more.
                                                                   Everyone stands to benefit from a coordinated and
                                                                   collaborative approach to maximize the benefits of
                                                 Climate 2050
                                                                   our climate initiatives.
                                             Discussion Paper
                                                      APRIL 2018
                                                                   To that end, Metro Vancouver is currently developing
                                                                   the Climate 2050 strategy. Climate 2050 will guide
                                                                   policy and actions across the Metro Vancouver region,
                                                                   using our resources efficiently to reduce carbon
                                                                   emissions and prepare for the unavoidable impacts
                                                                   of global warming. The strategy will apply a ‘climate
                                                                   lens’ to all policies and actions undertaken by Metro
                                                                   Vancouver, to inform climate change adaptation and
                                                                   prevention in coming years.

                                                                   Metro Vancouver is committed to an open decision-
                                                                   making process, and to setting goals that can be
                                                                   measured, reported, and evaluated. In addition to
                                                                   working closely with its member jurisdictions Metro
                                                                   Vancouver will engage businesses and residents, and
                                                                   coordinate with other orders of government and key
Climate change is both a global challenge and a
                                                                   agencies who have critical roles in achieving climate
local challenge – we are already feeling the impacts
                                                                   goals.
of climate change across the planet, including
here in Metro Vancouver. Meeting the climate                       You can find more information at metrovancouver.org,
challenge requires bold leadership, creative thinking,             search ‘Climate 2050’.
and extensive collaboration. Cities and regional
governments are at the forefront of global action on
climate change. Much of the region’s infrastructure,
as well as policies and initiatives that impact our
neighbourhoods and daily lives, are managed and
coordinated by cities and regions.

2   Caring for the Air 2018
AirAware –
Bringing Air Quality Monitoring Home
Metro Vancouver operates a world class air quality         AirAware is a new citizen science outreach project
monitoring network with 29 monitoring stations from        developed by Metro Vancouver to understand how
Horseshoe Bay to Hope. More than ten pollutants are        and why people are using these low-cost sensors.
measured throughout the network with high quality          Metro Vancouver will be looking for participants this
equipment that is strictly maintained. These data          summer (2018) to learn more about their sensors,
provide a ‘gold standard’ for accurately measuring         how they compare to Metro Vancouver’s instruments,
air quality.                                               and how they can fit in with the regional monitoring
                                                           network. Through collaboration with residents and
New sensor technology has led to the development of        other partners, such as Vancouver Coastal Health
low-cost air quality monitors that are readily available   Authority, this project will help us determine how we
to anyone and allow you to collect your own data           can all get the most out of this new technology.
anywhere you want. This is cool, but you might be
wondering “how good are the data”? There are               You can access data from the air quality monitoring
several things to consider.                                network at www.airmap.ca.

   Location Air quality is worse the closer you are to
   sources of air pollutants, so don’t put the sensor
   next to your BBQ – these data will not represent
   the air that you breathe most of the time.
   Consistency Metro Vancouver’s team of
   qualified technicians calibrate and audit air
   quality analyzers regularly to check they are
   performing correctly. Most low-cost sensors
   don’t let you do this.
   Quality Instruments costing tens of thousands
   of dollars offer accurate, precise and reliable
   measurements. Don’t expect that a sensor
   costing a few hundred dollars or less will
   match the performance of more sophisticated
   equipment.
   Data interpretation Many of the sensors on
   the market report instantaneous data collected
   every second. These measurements should
   not be compared with longer term (e.g. daily)
   health-based thresholds as several of the sensor
   websites do. You have to compare a 24-hour
   measurement with the 24-hour threshold.

                                                                                                Caring for the Air 2018   3
Where Air Emissions Come
      From in Metro Vancouver
      What is an emissions inventory?
      Every five years, Metro Vancouver compiles an inventory of air pollutant and greenhouse gas (GHG) emissions in the
      Lower Fraser Valley airshed (see map inside front cover). The inventory reports on air emissions from a broad range
      of sources: industrial facilities; commercial, institutional, residential, agricultural, and naturally occurring sources; and
      mobile sources, such as cars and trucks, non-road equipment, rail locomotives, aircraft and marine vessels.

                                                                                   2
      Here’s a snapshot of what we found.

                                                                                      Smog-forming pollutant emissions
                                                                                      still decreasing

1
                                                                                      In 2015, major sources of smog-forming
                                                                                      pollutants were chemical products, cars and
Modest decrease in GHG emissions                                                      trucks, marine vessels, non-road engines and
In 2015 we found that GHG               A business-as-usual forecast                  industrial sources.
emissions in Metro Vancouver had        projects that regional GHG
decreased compared to 2010 to           emissions will decrease by                    Emissions of smog-forming pollutants, such
about 15 million tonnes, which is       about one percent in 2035. GHG                as nitrogen oxides (NOx) and volatile organic
a 2% reduction. While a modest          emissions from cars and trucks are            compounds (VOC), have decreased since
decrease is encouraging, more           projected to fall by about 35% by             1995 thanks to improved engine emissions
needs to be done to meet                2035, due to emission regulations,            standards, vehicle repairs required through
regional targets (see page 2).          but this is offset by increases in            the former AirCare program, improved fuel
                                        GHG emissions from buildings                  and product formulation, and regulation of
Heating and cooling of buildings,       and industry because of regional              evaporative sources of VOC. This trend is
such as our homes or commercial         population and economic growth.               expected to continue to 2030, although VOC
buildings, require energy and are                                                     reductions are projected to slow as emissions
major contributors of regional          We also looked at the potential               from chemical products such as paints,
GHG emissions. Between 2010             effect of a quicker shift from                industrial solvents and coatings, adhesives,
and 2015 emissions from buildings       conventional cars and trucks to               and personal care products increase as the
decreased by more than 10%,             electric vehicles (EVs) as a way of           region grows.
thanks to reduced natural gas           achieving greater GHG emission
consumption, partly through             reductions in the region. We
improved efficiency of equipment.       found that strong EV policies
                                        could result in nearly 50% of new
GHG emissions from industrial           vehicle sales being EVs and plug-
sources increased between 2010          in EVs, providing a significant
and 2015, primarily because of          drop in GHG emissions. See page
economic growth in the cement           6 for the details.
and petroleum products sectors.
Vehicle traffic emissions also
increased due to growth in the
region’s population and economy.

      4   Caring for the Air 2018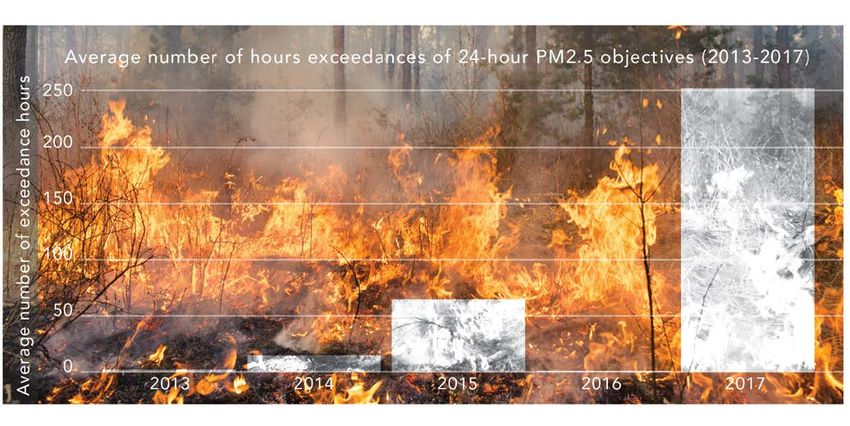
Proportion of GHG emissions by sector in 2015. GHG emissions overall totalled approximately 15 million tonnes.

                                                                                                                                  8%
                                                                                   17% INDUSTRIAL EMITTERS                        NON-ROAD
                                                                                                                                  ENGINES
      31%      CARS AND TRUCKS

                                                                                  7%                                         3%            3%
      26%
                                                                                                                                           WASTE
                                                                                  AIR, MARINE, RAIL                       AGRICULTURE
               BUILDINGS
                                                                                  5% HEAVY DUTY
                                                                                     VEHICLES

   How do we use an emissions inventory?
   The emissions inventory provides insights into key sources of air emissions in our region, and helps us examine
   the current state of and our impacts on the region’s air quality and climate.

   Emissions inventory forecasts allow us to assess the potential benefits of regulations and policies. Forecasts are
   also used to evaluate actions in regional climate action and air quality management plans, and to identify areas
   where emission reductions may be needed.

    3    Sulphur oxide emissions
                                                                4        Fine particulate matter
                                                                         emissions have
                                                                         decreased overall
         have decreased                                                  Fine particulate matter (PM2.5) emissions have been
                                                                         decreasing steadily since 1995, driven by reductions
         Sulphur oxide (SOx) emissions dropped
                                                                         in emissions from the wood products and petroleum
         more than 70% from 2010 to 2015, largely
                                                                         refining industries, as well as reduced vehicle
         because of implementation of the North
                                                                         emissions. However, significant sources of PM2.5 remain
         American Emission Control Area (ECA)
                                                                         in 2015, including residential wood burning, non-road
         in 2012. The ECA requires vessels to use
                                                                         engines, industrial sources and marine vessels.
         cleaner marine fuels, reducing marine vessel
         SOx emissions by about 95%. However, SOx                        In a business-as-usual forecast, transportation
         emissions are expected to increase slightly                     emissions are expected to continue decreasing,
         to 2035, primarily as marine traffic in our                     driven by increasingly stringent emission standards for
         region increases.                                               vehicles, non-road engines and marine vessels, and
                                                                         cleaner fuels.
         An article in Caring for the Air 2017
         (page 13) shows the benefit of the ECA                          With the longevity and slow replacement of wood
         on our air quality.                                             burning appliances, indoor wood burning is expected
                                                                         to be the most significant source of PM2.5 emissions
                                                                         to 2035. However, phasing out conventional fireplaces
                                                                         and uncertified inserts and woodstoves through
                                                                         regulatory and non-regulatory measures could reduce
                                                                         over 90% of PM2.5 emissions from indoor wood
                                                                         burning by 2035 compared to the business-as-usual
                                                                         scenario.
                                                                                                                 Caring for the Air 2018   5
Electric Vehicles and Regional Emissions
            The air quality and greenhouse gas emissions benefits                                Emissions forecasts were then derived for air pollutants
            of electric vehicles are often publicized, but what is                               and greenhouse gases (GHGs) from 2015 to 2035.
            the cumulative effect in an airshed?
                                                                                                 The results of the study show that a transition to
            As part of a recent analysis of emissions (the 2015                                  electric vehicles is projected to significantly reduce
            Lower Fraser Valley Emissions Inventory), Metro                                      GHG emissions (10% and 27% by 2035 in Scenarios
            Vancouver investigated possible future scenarios for                                 2 and 3, respectively) and have a measurable impact
            electric vehicle uptake in Metro Vancouver and the                                   on air pollutant emissions. For example, a 7% and
            Fraser Valley Regional District. Researchers at Simon                                18% reduction for PM2.5 by 2035 in Scenarios 2 and 3,
            Fraser University and Navius Research produced three                                 respectively.
            potential future scenarios that reflect different degrees
                                                                                                 Electrification is expected to have a greater impact
            of policy support for the electrification of light-duty
                                                                                                 on GHGs than air contaminants because federal
            vehicles. These included scenarios based on:
                                                                                                 standards on the latter are more stringent. Beginning
            (1) weak demand, (2) strong demand, and (3) strong
                                                                                                 in model year 2017, light-duty vehicles are subject
            supply and demand.
                                                                                                 to standards which effectively bring air emissions
          The scenarios were applied against the actual light-duty                               down to near-zero. Although Canada has adopted
          vehicle fleet for the Metro Vancouver region, taking                                   GHG standards for light-duty vehicles which tighten
Greenhouseinto account natural turnover, vehicle growth rates                                    between 2017 and 2025, they are far from near-zero.
          and actual vehicle kilometres travelled in this region.

                                          Effect of potential EV scenarios on emissions from light-duty vehicles

                                          6,000

                                          5,500

                                          5,000
                KILOTONNES OF EMISSIONS

                                          4,500

                                          4,000

                                          3,500

                                          3,000

                                          2,500

                                          2,000
                                                  1995      2000      2005         2010   2015     2020      2025     2030      2035

                                          Scenario 1     Scenario 2   Scenario 3

            6               Caring for the Air 2018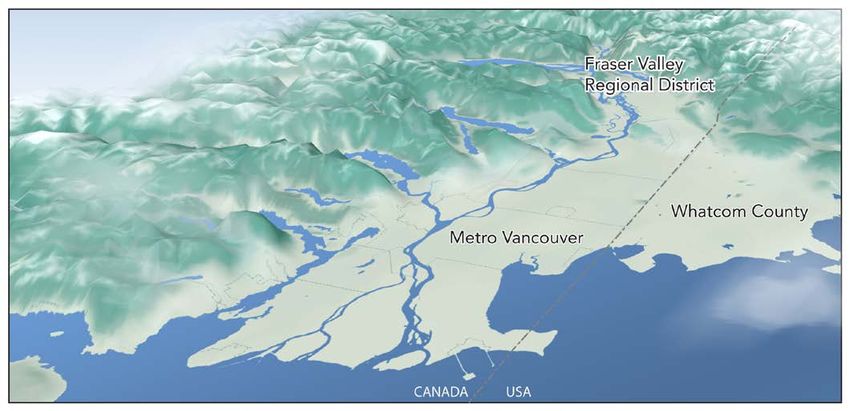
Vehicle Emissions in Focus

Individually, new vehicles are much cleaner than            Vehicle pollution can be reduced using many
20 years ago, but collectively the personal vehicle fleet   different approaches, including incentives to reduce
remains the dominant source of some pollutants in           emissions from older vehicles, more stringent engine
our region.                                                 standards for new vehicles, and shifting more travel
                                                            into other modes such as transit, cycling and walking.
Metro Vancouver’s 2015 emissions inventory shows            Jurisdictions around the world have implemented
that while there are many sources of emissions in           many approaches to reduce these air contaminants
our region, personal vehicles are the largest source        but what works in other jurisdictions may not work
of smog-forming pollutants and climate changing             as well in Metro Vancouver because of our size and
greenhouse gases (see page 4). In fact, a relatively        different regulatory structures.
small number of older vehicles produce a substantial
amount of smog-forming pollutants. Newer vehicles           A Metro Vancouver study will help identify benefits and
generate less smog-forming pollutants, but due to           trade-offs between different approaches that could
their large number, produce more greenhouse gases           be implemented in our region. The best approach
than older vehicles (see page 6).                           may consider issues such as housing affordability,
                                                            social equity, feasibility and alignment with related
Metro Vancouver is investigating how to reduce              initiatives including the Mobility Pricing Independent
the amount of air pollutants released from personal
                                                            Commission and federal Electric Vehicle Strategy.
vehicles such as cars and trucks. Vehicle emissions
                                                            The study will provide important information to
policies focussed on protecting human health and
                                                            support evidence-based policy making that will help
our environment need to address both air quality and
                                                            us reach air quality and climate goals.
climate change issues.

                                                                                                  Caring for the Air 2018   7
Have Your Say on Permit Applications
What’s the purpose of an air permit?                      How do I voice my concerns?
Metro Vancouver uses air permits to reduce the            Anybody who thinks they may be negatively affected
impacts of air contaminants emitted from businesses.      by an air permit application has the right to have their
                                                          concerns considered by the District Director during
                                                          the permitting process. A person has at least 30 days
Who decides whether a permit is issued?
                                                          after the last public notification to provide comments,
The District Director, a staff person appointed by        in writing. The applicant gets a chance to respond to
the Metro Vancouver Board, decides whether to             all comments.
issue a new permit or amendment after reviewing
an application from a business and hearing from           When deciding whether a permit should be issued,
concerned persons.                                        the District Director may consider relevant information
                                                          provided by the applicant, Metro Vancouver staff and
                                                          any others who have provided comments.
How does the public find out about an
application?
                                                          How will I know what has been decided and
When a business applies for major changes or a
new permit they must post a copy of the notice            what if I don’t like the decision?
(the application summary) at their site, and publish      Once the District Director makes a decision about
it in local newspapers and the BC Gazette.                a permit, the applicant, agencies and comment
                                                          providers are notified. Any person who may be
Metro Vancouver posts the notice on our website           affected by the decision can appeal to the BC
and notifies anyone who has complained about the          Environmental Appeal Board (www.eab.gov.bc.ca).
facility in the past three years or subscribed to our
notification list. Metro Vancouver also asks the host
municipality, local health authority and other agencies   Where can I find out more?
for comments on the application. The District Director    More information about Metro Vancouver’s
may require the applicant to organize meetings to         air permitting process is available at
provide information to the public.                        metrovancouver.org (search: apply permit).

Notification provides information to help the public
make informed comments about a permit application.

8   Caring for the Air 2018
Wood Changes Make Sense
Many people enjoy the ambience created by a wood
fire, but burning wood releases harmful pollutants
into the air we breathe. Wood smoke contains fine
particulate matter (PM2.5), which is made up of tiny
particles suspended in the air that can be inhaled
deep into our lungs. Exposure to PM2.5 can aggravate
heart and lung conditions and reduce life expectancy.
Wood smoke also contains a mixture of chemicals that
have other negative impacts on human health (see
Toxic Air Pollutants Risk Assessment).
Indoor residential wood burning is the largest source
of PM2.5 in the region. To help reduce wood smoke
emissions, Metro Vancouver runs an exchange
program which allows residents to apply for a rebate
when they replace their uncertified wood burning
appliance (e.g. fireplace or older wood stove) with
a new, lower emission unit. Funding is limited and
rebates are offered on a first come, first served basis:
• $400 if you exchange an uncertified wood-burning
appliance for a pellet stove, electric heat pump, or a
natural gas or propane appliance.
• $250 if you exchange an uncertified wood-burning
appliance for a CSA or EPA-certified wood-burning
appliance or electric insert.
The wood stove exchange program has been in place
since 2009 and over 500 exchanges have been made,
resulting in ongoing emissions reductions of over
9,000 kilograms of PM2.5 per year. This helps improve
air quality in neighbourhoods where people live, work
and play.
In 2017 and 2018 Metro Vancouver undertook
consultation and engagement on a phased approach
to adding regulatory mechanisms to manage indoor
residential wood burning emissions.
Replacing a fireplace or old wood-burning appliance
with a gas fireplace or new wood-burning appliance
will give you more efficient heating and help reduce
PM2.5 levels for everybody. To find out more about the
exchange program and qualifying appliances, visit:
metrovancouver.org (search: ‘wood stove exchange’).
Caring for the Air 2018 9Benefits From Retiring
Your Dirty Diesel Engines
Since 2012, Metro Vancouver’s Bylaw 1161 has encourage owners to retire older units and replace
regulated the oldest and dirtiest (Tier 0 and Tier them with cleaner engines. When an owner retires an
1) non-road diesel engines, such as those found in engine, they become eligible to receive a cash refund
construction and other heavy-duty equipment, to of up to 80% of the fees paid in the previous three
reduce the impacts of harmful diesel particulate years. Engine retirements also provide a healthier
matter on human health and the environment. More workplace for the operator, as well as a healthier
than 140 engines have been retired. Assuming each of overall environment for everybody in the region.
these was replaced with a Tier 2 or newer engine, the
If you own a ‘not in use’ Tier 0 or Tier 1 engine, apply
estimated diesel particulate reduction is almost 5,500
for a refund as soon as possible. A small amount of
kg, which is equivalent to taking 4,600 newer diesel
paperwork could mean hundreds of dollars in your
pick-up trucks off the road.
pocket. You have one year from the date of retirement
Metro Vancouver estimates that there are more than to apply for a refund.
600 Tier 0 and Tier 1 engines no longer being used
Our officers routinely inspect worksites so if you
that were registered but never formally retired. This
haven’t registered your Tier 0 or Tier 1 engine,
additional unconfirmed reduction in emissions means
we encourage you to do so as soon as possible or
a combined total of 30 tonnes of diesel particulate
risk fines. More information is available at
matter has been taken out of the air we breathe.
metrovancouver.org (search: ‘fee refund’ or
Owners of Tier 0 and Tier 1 engines pay fees to ‘register engine’).
operate in the region. Metro Vancouver currently
only charges fees for the most polluting engines, to
Annual Diesel Particulate Emissions
From Different Types of Diesel Engines
100
Tier 0
80
Tier 1
KILOGRAMS
(1996)
60
40
Tier 2 & 3
(2004/2007)
20 Diesel
Pickup
Truck Tier 4
(2010) (2014)
0
BASED ON 110 HP FORKLIFT
10 Caring for the Air 2018Health Impact Assessments:
Improving Our Future
When a ‘big project’ (such as a major construction Metro Vancouver has developed a guidebook and
project like a bridge replacement) is being considered toolkit to help with preparation of a Health Impact
in our region, it is common to engage the public to Assessment. Several large projects in our region
get feedback about issues and concerns. By involving have used this approach successfully in recent years.
the public, the social impacts of a project can be One example is the Georgia and Dunsmuir viaduct
considered in design alternatives. But what about replacement project. This will be a large demolition
potential health impacts, which may be less visible and construction project with the potential to impact
and more difficult for residents to anticipate? residents for an extended period of time. By using
HIA, public health has been assessed throughout a
A Health Impact Assessment (HIA) provides a project’s lifecycle.
standardized way of assessing both the bad and
good health impacts a project might have, ranging
from risk of injury to health risks associated with air
pollution and noise. By identifying potential impacts
at an early stage in a project planning process, it
is possible to find solutions and reduce long term
negative effects.
HEALTH INDICATOR PREDICTED HEALTH EFFECT REASON
Air Quality Neutral Emissions from the project will be relatively minor
compared to other sources in the area, and vehicle
traffic is predicted to decrease.
Noise Neutral The project will limit construction at night. Once the project
is completed, noise mitigation measures will include
earth berms, low-noise pavement, and upgraded sound
insulation at a nearby building that has been predicted to
be most significantly affected by project noise.
Active Transportation Positive The project includes improved walking and cycling
infrastructure.
Access to Green Spaces Positive The project includes an opportunity to expand a
nearby park.
Examples of how an HIA is used to look at the potential impacts of factors that can affect health.
From: City of Vancouver Georgia and Dunsmuir viaduct replacement Desktop Health Impact Assessment
Caring for the Air 2018 11Hot and Dry Conditions –
A Recipe for Bad Air Quality
Prolonged hot and dry conditions caused extreme fire risk and
led to intense wildfire activity in 2017.
In the summer of 2017 wildfires burned aggressively the smoke was detected at monitoring stations from
across the province, resulting in the largest burnt area Hope to Horseshoe Bay. Five air quality advisories
of B.C. ever being recorded in a season. The smoke were issued, totalling an unprecedented 19 days with
from these wildfires affected people throughout an advisory in effect. The longest continuous period
North America, including in Metro Vancouver and the under an advisory occurred from August 1st to 12th,
Fraser Valley Regional District. Metro Vancouver’s air when levels of fine particulate matter were high due
quality expertise was critically important in detecting to wildfire smoke. Ground-level ozone also became
the arrival of wildfire smoke in the Metro Vancouver elevated at times during hot sunny weather.
and Lower Fraser Valley airshed, and for getting
information out to the public and media. Metro Vancouver residents generally enjoy clean, clear
air, so the wildfire smoke impacts on the region for
When air quality becomes degraded, Metro Vancouver two of the last three summers is notable. These events
issues an air quality advisory in partnership with may provide a taste of how an increase in the severity
other agencies in the region. Air quality advisories and occurrence of wildfires caused by our changing
provide information about what is causing air quality climate could affect us more severely in the future.
degradation, the health effects associated with it,
Metro Vancouver has a goal of having zero days of air
and the actions people can take to protect themselves
quality advisories. Metro Vancouver has put policies
and others.
in place, such as the Regional Ground Level Ozone
Wildfire smoke in the summer of 2017 was more Strategy and the Non-Road Diesel Engine Program,
intense and lasted longer than ever previously to reduce the occurrence of advisories.
measured in our airshed. Fine particulate matter in
12 Caring for the Air 2018Air Quality in 2017
Although outdoor air quality in Metro Vancouver is generally good most of the time, occasionally air quality
objectives are not met. Wildfire smoke had significant impacts on air quality in the region in 2017 (see page
12). Hot, sunny weather also caused levels of ground-level ozone to increase at times. Both of these factors
resulted in exceedances of air quality objectives.
Metro Vancouver and other air quality agencies TREND IN FINE PARTICULATE MATTER
strive for continuous improvement in air quality
to protect health and the environment. As
6
additional information becomes available,
new, more protective objectives are adopted NEW
that require tighter standards to be met. New
federal standards for sulphur dioxide (SO2) were 5
added to the Canadian Ambient Air Quality
Standards (CAAQS) in 2016. In November
2017, Metro Vancouver adopted more stringent
objectives for SO2 of concentrations of 70 ppb 4
OLD
measured over one hour and 5 ppb averaged
over a year, which replaced the interim objective
adopted by Metro Vancouver in 2015.
Same air, same air quality, 3
Air Quality Trends just new measurements
PM2.5 CONCENTRATION (μg/m3)
The regional trends charts (right) illustrate the
AVERAGE LEVEL COMPARED TO 2006
2007 2008 2009 2010 2011 2012 2013 2014 2015 2016 2017
change in average air quality across the region
over time. Measurements from monitoring TRENDS IN GAS PHASE AIR POLLUTANTS
stations located from Horseshoe Bay to Hope
are averaged to represent the ambient (outdoor)
air quality typically experienced in the region.
Average trends for the region show that
improvements have been made over the last
1.4
decade for most air contaminants, even while
the region’s population has grown. The region’s 1.2
air quality improvements are a result of many GROUND LEVEL OZONE
emission reduction actions that have been 1.0
implemented (see pages 4 and 5). NITROGEN DIOXIDE
0.8
Peak ground-level ozone levels (not shown),
CARBON MONOXIDE
which occur during summertime hot and sunny 0.6
afternoons, are better now than in the 1980s and
0.4
early 1990s. However, despite lower levels of
pollutants that form ground-level ozone, average
0.2
levels of ground-level ozone are increasing SULPHUR DIOXIDE
slightly. This is partly due to an increase in ozone 0
formed outside Canada coming into our region.
Caring for the Air 2018 13Air Quality in 2017 - Data Summary
FINE PARTICULATE MATTER (PM2.5) IN 2017
Canadian Ambient Air Quality Standard – 24 hour (µg/m3)
32
28 Fraser Valley
27
Regional
District
15 22
23
24
23
16
23
24
Whatcom County
24 20 19
Metro Vancouver
25
24
17
17
20 15
28 µg/m3
Canadian Ambient Air Quality Standard
CANADA USA
The Canadian Ambient Air Quality Standard for fine particulate matter (PM2.5) was achieved for 2017 at all
monitoring stations with the exception of Hope (see map above). Levels were better than Metro Vancouver’s
annual objective at all stations with the exception of the Vancouver near-road monitoring station. Peak levels
at all stations were worse than the short-term objective (25 μg/m3 based on an average over 24 hours) in
August and September. This was due to wildfire smoke. Additional exceedances of the objective occurred
in July at Hope also due to wildfire smoke, in November and December in several locations thought to be
caused by local wood burning and two locations in October likely due to Halloween activities.
GROUND-LEVEL OZONE IN 2017
Canadian Ambient Air Quality Standard (ppb)
64
60
56 Fraser Valley
Regional
District
60 55
53
58
53
51
48 49
46 Whatcom County
47
55
40 45 42
44 Metro Vancouver
46
34
47
43
49
63 ppb
Canadian Ambient Air Quality Standard
CANADA USA
The map above shows that the Canadian Ambient Air Quality Standard for ground-level ozone was achieved
at all monitoring stations except Hope in 2017. Monitoring data also showed that peak levels were higher than
Metro Vancouver’s 8-hour objective (65 ppb) and 1-hour objective (82 ppb) on a few occasions in Burnaby,
Richmond, Pitt Meadows, Maple Ridge, Langley, Abbotsford, Mission, Chilliwack, Agassiz, and Hope in
August. It is unusual for ozone exceedances to occur in the west (i.e., Burnaby and Richmond) and it is thought
that wildfire smoke enhanced ozone production. Exceedances were also briefly observed in May, June and
July at a few stations.
14 Caring for the Air 2018Air Quality in 2017 - Data Summary
SULPHUR DIOXIDE IN 2017
Annual Average (ppb)
0.1
Fraser Valley
Regional
District
0.2
0.1
0.2
0.4
0.4 Whatcom County
0.9 0.3 Metro Vancouver
0.5 1.1
0.3
0.4 1.2
0.5
0.4 0.3 0.4
5 ppb
Annual Average Objective
CANADA USA
Average concentrations of sulphur dioxide for 2017 are shown above. All stations were better than Metro
Vancouver’s annual objective of 5 ppb. Peak levels were better than Metro Vancouver’s 1-hour objective of
70 ppb at all stations in 2017 except for at Capitol Hill, where exceedances occurred in February, March,
October and December for a total of six hours. Peak levels at Capitol Hill are mainly influenced by the
nearby oil refinery.
NITROGEN DIOXIDE IN 2017
Annual Average (ppb)
5
8
8
Fraser Valley
Regional
District
9
7
8
9
6
9
11 9
14 Whatcom County
17
7
13 12
14 Metro Vancouver
14
13 23
19
13
16
7
21 ppb
Annual Average Objective
CANADA USA
In 2017, nitrogen dioxide concentrations were better than Metro Vancouver’s 1-hour air quality objective at
all monitoring stations. Measurements averaged over the entire year were within Metro Vancouver’s annual
objective with the exception of at the near-road monitoring station on Clark Drive in East Vancouver
(shown above). The near-road station is heavily influenced by traffic emissions. The highest average
nitrogen dioxide concentrations in the region are measured in highly urbanized areas near busy roads.
Caring for the Air 2018 15SO2
CO
1 hr 24 hr
1 hr 8 hr
NO2
1 hr
Temperature
PM2.5 11°C Wind Health Index
1 hr 24 hr 6 km/hr 2
Adapting to Change
Embracing new technology, using Staying informed about weather trends
information about health impacts Weather conditions greatly affect air quality and
Many pollutants, such as fine particulate matter how pollution levels vary throughout the day, from
(PM2.5), are measured continuously by the air quality season to season, and across the region. Wind
monitoring network’s 29 long-term air quality speed, wind direction, temperature, rainfall and
monitoring stations, with data reported in near-real humidity measurements improve air quality forecasts,
time. Other pollutant samples, such as some toxic predictions of air quality advisories, environmental and
air pollutants, are collected on a regular schedule health assessments, and our response to air quality
for detailed analysis in a laboratory. Here’s how the complaints.
network is keeping up to date and responding to new
The important connection between weather and air
priorities and emissions sources.
quality means that meteorology is measured at most
Case 1: Health research tells us that smaller particles air quality stations in the network. There are also some
(less than 2.5 micrometres) cause the greatest health stations that only measure meteorology. Some of
effects. Increased monitoring of fine particulate matter these data are used by the provincial government’s
(PM2.5) and new instruments providing more complete Climate Related Monitoring Program to improve our
measurements of PM2.5 have been integrated into the knowledge about changing weather patterns in our
network in recent years. region. Understanding future climate projections
and impacts on the region helps when developing
As interest grows in measuring even smaller particles, the new Metro Vancouver climate action strategy
known as ultrafine particles, Metro Vancouver is (Climate 2050).
exploring how we can measure these effectively in the
region. To find weather or air quality data in your community,
check out AirMap.ca.
Case 2: A new instrument was acquired in 2017
to improve our ability to evaluate air toxics, such
as benzene, and to help assess the air quality
implications of industrial projects such as the Trans-
Mountain Pipeline expansion project.
16 Caring for the Air 2018Reducing Emissions from
Automotive Refinishing
Metro Vancouver is working to clear the air – and ensuring that all spray coating operations follow bylaw
reduce human health risks – by tackling air emissions requirements, since some operations conducting
from automotive refinishing facilities (commonly called similar work are currently not covered by the bylaw.
autobody shops). Automotive refinishing activities The requirements are designed to protect residents’
release air contaminants into the air, including volatile health and the environment. Other changes also
organic compounds, hazardous air pollutants and being considered would simplify bylaw enforcement
particulate matter. These pollutants are associated and clarify requirements for businesses who are
with adverse health and environmental effects. subject to the regulation.
Potential changes to the Greater Vancouver Regional
Metro Vancouver hosted a series of consultation
District Automotive Refinishing Emission Regulation
events between November 2017 and March 2018,
Bylaw No. 1086, 2008, which regulates emissions from
including three webinars and three stakeholder
these facilities, have been proposed.
meetings. The feedback received is being reviewed
The existing bylaw requires that most vehicles are and will be reported to the Metro Vancouver Board
spray coated in appropriate spray booths using later in 2018.
approved paints and cleaners. There are several
More information about the proposals and
key potential changes being considered, including
consultation events can be found on
modernizing the paint standards to meet or exceed
Metro Vancouver’s website (search: ‘Potential
national standards. Another potential change is
amendments to Bylaw 1086’).
Caring for the Air 2018 17Managing Odour in Metro Vancouver
Odorous air contaminants have the potential to • Specifying limits on the level of odour occurring at
cause everything from nuisance in residential the facility boundary or in the affected community;
neighbourhoods, to health concerns at elevated
• Emission limits for sources at facilities, designed to
levels. Requirements to control emissions from odour-
reduce odour impacts in nearby communities;
generating facilities can be included in air quality
permits and regulations. However, as residential, • Applying technology requirements to control odour;
industrial and commercial density increases in Metro
Vancouver, it is anticipated that odour concerns and • Requiring the use of best management practices for
complaints will continue to rise. new or existing facilities;
Metro Vancouver is responsible for managing • Employing economic instruments to encourage
and regulating air quality in our region. With an emissions reductions and allow administrative costs
increasing number of complaints from the public to be recovered from authorized sources of odorous
about unpleasant odours emanating from a variety air contaminants; and
of sources, including compost and food processing
• Changing existing bylaws to clarify provisions for
facilities, the current approach to odour management
managing the impacts of emissions of odorous air
needs to be improved to address current and future
contaminants.
needs. This has led Metro Vancouver to explore more
effective tools to reduce odour emissions across the These approaches could be applied, individually or
region. in combination, to reduce odour and offer a future
odour management framework the flexibility to find
Metro Vancouver is working with communities,
effective solutions for existing issues and prevent
businesses and government partners to revise its
new issues arising.
framework for managing odorous air contaminants in
a responsible manner that respects both community More information about the consultation can be
and business values. Approaches being considered to found at metrovancouver.org (search: ‘odorous air
improve how Metro Vancouver deals with odours are: contaminants’).
18 Caring for the Air 2018NOx, NOx, Whose Air?
New Air Quality Objectives for Nitrogen Dioxide
Nitrogen dioxide (NO2) and nitric oxide (NO) are by the federal government. In 2017, the federal
known collectively as nitrogen oxides (NOx). NOx are government established new CAAQS for NO2 when
formed when fuel is burned at high temperatures, for new science indicated that the previous national NO2
example, in an engine or a boiler. standards were no longer sufficiently protective. The
NO2 CAAQS take effect in 2020, and will be followed
Nitrogen dioxide is a highly-reactive, reddish- by even stricter requirements in 2025. Similar to the
brown gas with a pungent and irritating odour. It is process for SO2, Metro Vancouver is reviewing the
sometimes responsible for “brown haze” seen in the new CAAQS for NO2 for incorporation in the region.
air. It is linked to health effects such as decreased It’s expected that the 2020 CAAQS are achievable for
lung function and respiratory health problems, the region, but achieving the standards in 2025 will
particularly for children and adults with asthma. It also require further reductions in NO2 emissions.
plays a major role in ground-level ozone formation
and secondary particulate formation, which can affect
visual air quality in the region.
Transportation is a key source of NO2 emissions,
27%
19%
so it’s no surprise that areas near busy roads and
intersections, such as downtown Vancouver, tend
to have the highest concentrations of NO2. Lower
NITROGEN OXIDES
concentrations are often observed where there is less
traffic, such as eastern areas of Metro Vancouver.
Metro Vancouver sets outdoor air quality objectives
15%
13%
for air pollutants, including NO2, to protect human
health and the environment. NOx emissions in
INDUSTRY
the region have been decreasing since 1995,
10%
and concentrations of NO2 have followed suit.
Concentrations are generally better than objectives in
the region (see page 15).
8%
The setting of air quality objectives in Metro
Vancouver follows a principle of continuous
improvement, and in 2017, the Metro Vancouver
4%
Board adopted new, more stringent objectives for
sulphur dioxide (SO2), consistent with Canadian
Ambient Air Quality Standards (CAAQS) established
Caring for the Air 2018 19Stepping Up to Better
Building Energy Efficiency
Buildings contribute 27% of the region’s greenhouse
gas emissions and 7% of smog forming pollutants,
mostly from burning fossil fuels for heating. The North Shore Leads the Way
BC Energy Step Code is a new voluntary provincial The City of North Vancouver has worked with
standard that will improve the energy efficiency and the development industry to increase energy
carbon footprint of new buildings beyond current efficiency in buildings for many years.
minimum standards. In December 2017, the City became the first
local government in BC to enact the BC Energy
The Energy Step Code has five steps, each step Step Code in its zoning and construction
representing a higher standard of energy efficiency. regulation bylaws.
At the highest level (Step 5), a building will be “net- The Districts of North and West Vancouver
zero ready”. This means that if a renewable energy have followed suit, creating an “efficient new
technology is installed, the building will produce at home zone” from Horseshoe Bay to Deep
least as much clean energy as it consumes. Cove. From July 2018, all new low-rise condos,
town homes and houses built on the North
Added benefits of the Step Code are improved health Shore will be required to meet Step 2 of the
and comfort for building occupants as well as more Step Code and all new commercial buildings
affordable operating costs and consumer protection. will meet Step 1.
Step Code buildings are:
Moving early to adopt the Step Code in a
• Healthier, through better air circulation; coordinated way across the North Shore
has increased certainty for developers and
• ore comfortable, through better management
M provided time for them to respond to new
of ambient temperature; and energy efficiency requirements.
• Quieter, through better air sealing and insulation.
Many local governments are adopting the Step Code,
recognizing the benefits, and their role in contributing
to a growing effort to dramatically reduce building
emissions in the Metro Vancouver region. The BC
Energy Step Code is a vital tool for governments to
achieve greenhouse gas reduction goals.
The province hats set a goal of achieving net-zero energy ready
new construction in BC by 2032
20 Caring for the Air 201822 Caring for the Air 2018 www.metrovancouver.org
You can also read


