2012-2013 Environmental Sustainability - Hobsons Bay City Council
←
→
Page content transcription
If your browser does not render page correctly, please read the page content below
Hobsons Bay City Council
Environmental Sustainability
          Report
                    2012-2013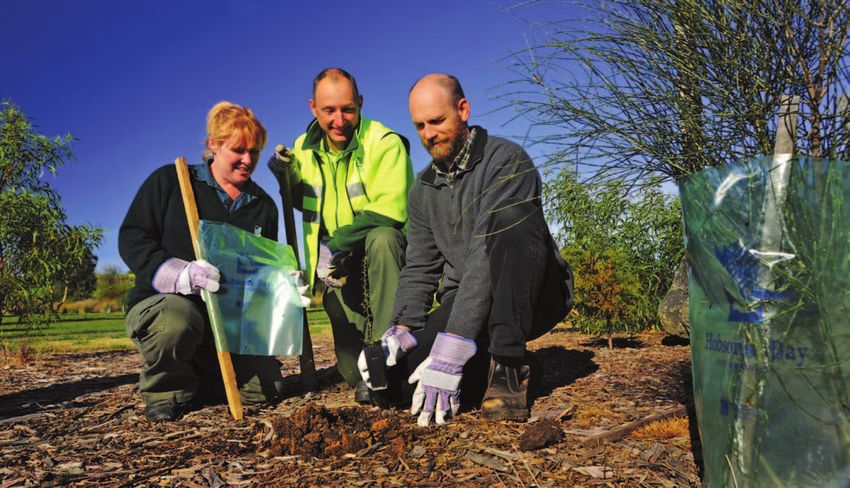
Contents
Environmental Sustainability
         Report 2012-2013

                                   1.   Introduction                           3

                                   2.   Greenhouse gas emissions               4

                                   3.   Water use                             10

                                   4.   Waste and litter                      12

                                   5.   Projects and activities 2012 - 2013   16

                                   6.   Strategy development 2012 - 2013      26

                                   7.   Regional initiatives                  28

                               2
Introduction
Environmental Sustainability
         Report 2012-2013

                         1
                                   This document is a report of the Council’s key
                                   environmental undertakings and the results of three
                                   years of measurement of greenhouse gas emissions
                                   and water use to the end of June 2013.
                                   The Council reviews its inventory of greenhouse gas
                                   emissions and water use annually based on available data.
                                   The results of these reviews are provided in this document.
                                   The Council also undertakes day-to-day activities and
                                   many projects to protect our biodiversity, manage waste,
                                   reduce our greenhouse gas emissions and manage water
                                   more wisely. Some activities are ongoing and some are
                                   discrete projects to address specific issues. These projects
                                   are outlined in this document.
                                   In addition, major strategies and plans are reviewed and
                                   developed to determine the allocation of resources. This
                                   strategic work is outlined in this document.

                               3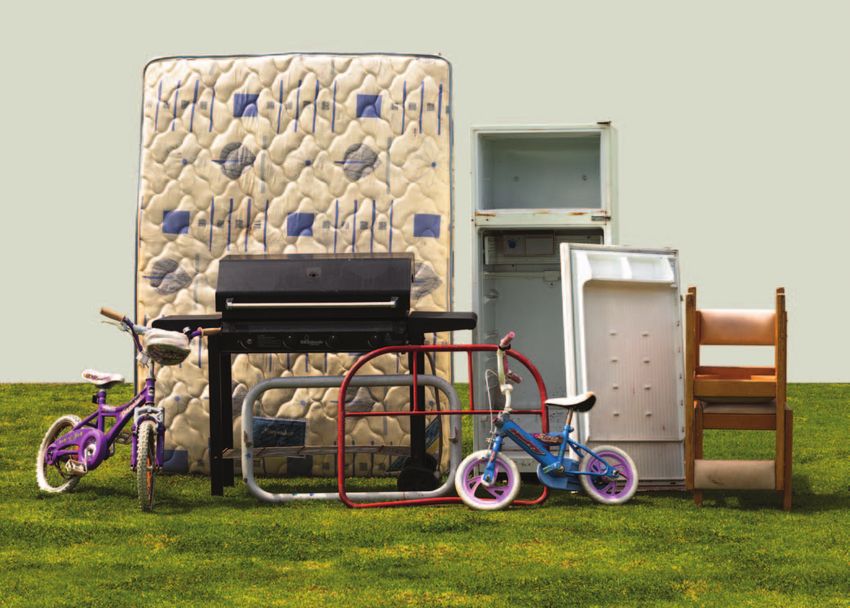
Greenhouse
                                Gas Emissions

                                                     2
                                                                   2.1 Overview
Overall greenhouse gas emissions have remained                     The National Greenhouse and Energy Reporting System
relatively stable over the last three years.                       (NGERS) legislation provides the central framework for the
However, there has been a 243 tonne increase in building           reporting of emissions and energy consumption within
emissions from 2011-2012 to 2012-2013, with emissions              Australia. Hobsons Bay City Council uses this framework.
rising steadily since 2010-2011 by approximately 340               The NGERS framework prescribes the emissions that are
tonnes. The increase in emissions over the previous                deemed to be within the Council’s control. This includes
12 months is partly attributable to the introduction of an         fuel use from Council fleet vehicles (i.e. Council depot
Environmental Reporting System, which provides more                vehicles), other corporate fleet vehicles (such as pool
accurate data reporting, as well as the opening of four            vehicles) and volunteer vehicles. It also includes natural
new buildings to the Council’s building portfolio during the       gas use, refrigerant gasses, electricity use for buildings
2012-2013 financial year. These buildings are:                     and non-street lighting (also referred to as metered
•   Williamstown Library;                                          lighting). In total, this accounts for approximately 5,000
                                                                   tonnes of greenhouse gas emissions in 2012-2013.
•   Laverton Community Hub;
•   Williamstown Cricket Ground Clubrooms; and                     It excludes items that are outside of the Council’s direct
                                                                   control. This includes community household and green
•   The Range Childcare Centre.                                    waste, electricity used for street lighting, air travel, taxi
It is anticipated that next year’s emissions will be reduced       travel and paper. It also does not include the extraction,
as a result of the Council more accurately defining its            production and transportation of energy for electricity,
actual ‘operational control’ of buildings and thus its             gas or fuel. However, as part of best practice reporting
Scope 1 and Scope 2 organisational boundary. That is,              standards, these emissions were measured as part of
those emissions which are our direct responsibility. In            our 2010-2011 overall inventory. In total, these items
addition, emissions reduction works in accordance with             account for 36,414 tonnes of greenhouse gas emissions.
the Council’s Corporate Greenhouse Strategy are                    This overall inventory is captured in Figure 1 and
envisaged, which will increase building operating efficiency       demonstrates the relatively small proportion that the
and reduce emissions.                                              Council is directly responsible for under the NGERS
                                                                   accounting format.
                                                                   Corporate waste is difficult to quantify with accuracy due
                                                                   to complex collection arrangements. However, it is
                                                                   estimated to be approximately 1 per cent of the Council’s
                                                                   total greenhouse gas emissions.

                                                               4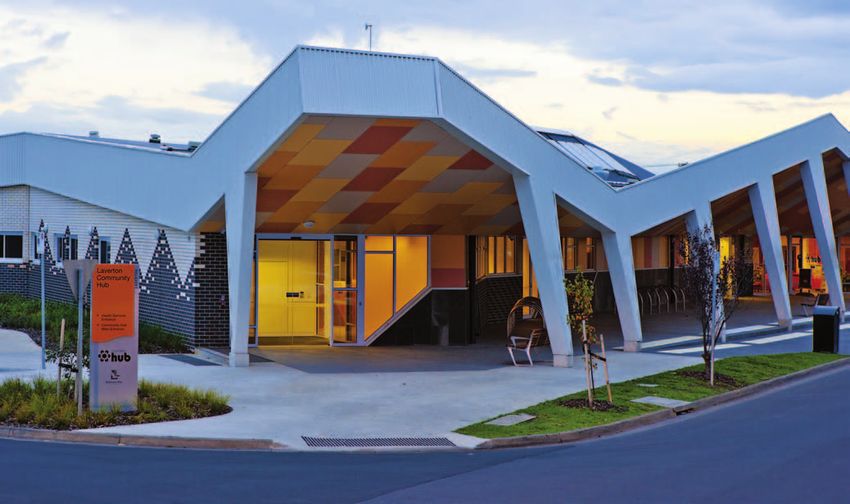
2.2 2012 - 2013 emissions
 Figure 1 Hobsons Bay City Council greenhouse               Table 1 and Figure 2 demonstrate, that emissions from
          gas emissions inventory 2010-2011                 the various types of fuel consumption, associated with
                                                            the Council’s corporate operations, account for more than
                                                            19 per cent of total emissions. It also demonstrates that
                                                            electricity from lighting and buildings accounts for more
Emissions that the Council
                                                            than 78 per cent of total emissions.
is directly responsible for
(Scope 1 and 2 emissions                                    Together, emissions from electricity use and fuel
under NGERS): 12%                                           consumption constitute nearly 98 per cent of the total
of total emissions                                          emissions for Hobsons Bay City Council. The remainder of
                                                            emissions, approximately 2.5 per cent, are from natural
                                                            gas consumption and refrigerant gas leakage from fridges
                                                            and vending machines.

                                                             Table 1     Hobsons Bay City Council
                                                                         total emissions 2012 - 2013
                                                             Emission sectors                 Greenhouse gas
             Natural Gas 0%                                                                   emissions (tonnes)

             Electricity (street lighting) 14%               Electricity (buildings and                   3,909.42
                                                             metered lighting)
             Corporate waste – municipal 1%
                                                             Fuel                                           960.41
             Community waste – green waste 4%
                                                             Natural gas                                    120.52
             Community waste – household waste 68%
                                                             Refrigerant gas                                  1.56
             Fuel consumption 4%
                                                             Total Council greenhouse                     4,991.91
             Electricity (lighting and buildings) 8%         gas emissions (tonnes)
             All measured emissions (Scope 1, 2 and 3
             under NGERS): 36,414 tonnes CO2-e

                                                        5
Greenhouse
                              Gas Emissions

                                                 2
                                                             2.3 Trends
Figure 2 provides a percentage breakdown of corporate        Measurements have been undertaken based on data for
emissions for 2012-2013. It can be noted that fuel and       the financial years of 2010-2011 to 2012-2013.
electricity use are the dominant emissions sources.          Table 2 demonstrates that during these years:
                                                             • Total buildings and metered lighting use has
 Figure 2 Hobsons Bay City Council greenhouse
                                                               increased by 369 tonnes;
          gas emissions 2012 - 2013
                                                             • Total fuel consumption has decreased significantly,
                                                               largely due to more accurate measurement. However,
                                                               this has offset the buildings and metered lighting
Natural gas 2%                                                 emissions increase; and
Fuel 19%                                                     • Natural gas emissions decreased by approximately
                                                               12 tonnes of greenhouse gas emissions.

Refrigerant gas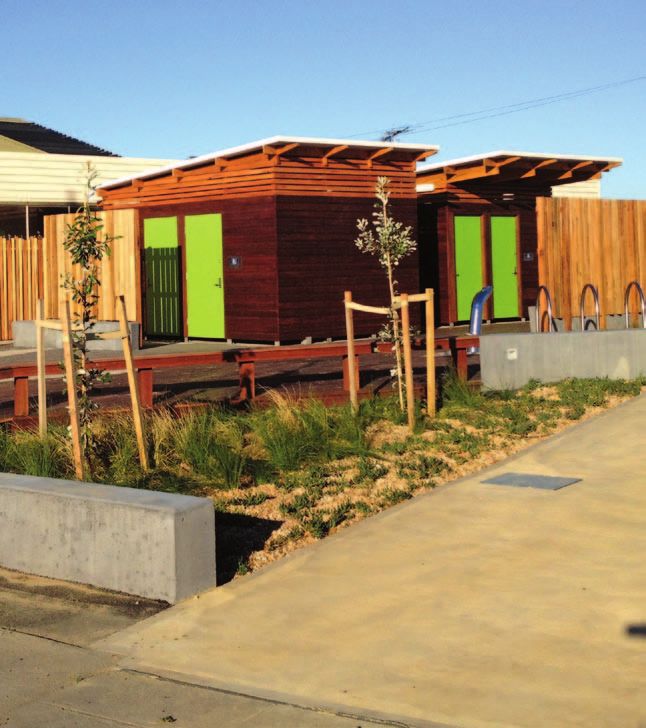
In total, there has been a decrease in the order of 64.14                Buildings and Metered Lighting
tonnes of greenhouse gas emissions over this period. This
equates to a percentage decrease of 1.26 per cent in                     As demonstrated in Table 2, electricity related emissions
overall corporate greenhouse gas emissions for the three                 for buildings and metered lighting have increased by
years. This is illustrated in Figure 3.                                  243 tonnes between 2011-2012 and 2012-13 or 6.6 per
                                                                         cent. This is illustrated in Figure 4.
  Figure 3 Total emissions by financial year
                                                                           Figure 4 Total buildings and metered lighting
                                                                                    electricity emissions by financial year
               6,000
                                                                                        4,000
               5,000
                                                                                        3,900
               4,000
                                                                                        3,800
Tonnes GHG-e

                                                                         Tonnes GHG-e

               3,000                                                                    3,700

               2,000                                                                    3,600

                                                                                        3,500
               1,000
                                                                                        3,400
                           2010-11        2011-12         2012-13
                                                                                                2010-11   2011-12     2012-13
                       Natural gas

                       Fuel
                       Electricity (Buildings and Public Lighting)
                       Refrigerant gas >1%

A breakdown in specific sectors of emissions follows.

                                                                     7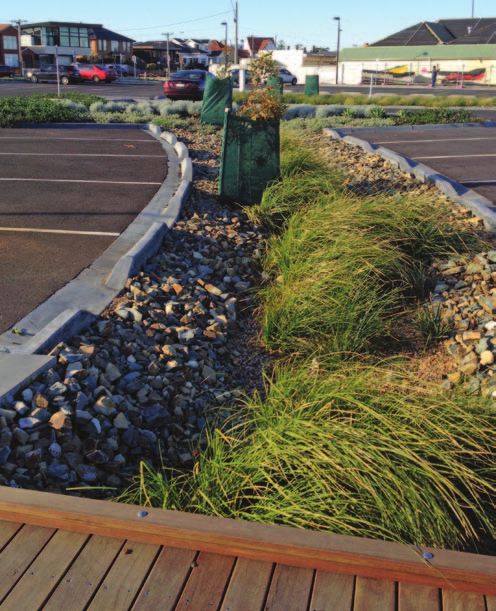
Greenhouse
                                 Gas Emissions

                                                  2
Transport                                                       Natural gas
As demonstrated in Table 2, there has been an estimated         As demonstrated in Table 2, there has been a decrease
increase in transport related emissions between 2011-2012       in natural gas related emissions between 2011-2012
and 2012-13 of 12.82 tonnes or 0.94 per cent. However,          and 2012-13 of 17.13 tonnes or 12.44 per cent. This is
this follows a significant decrease from 2010-2011 to           illustrated in Figure 6.
2011-2012. This is illustrated in Figure 5.
                                                                  Figure 6 Total natural gas emissions by
  Figure 5 Total fuel emissions by                                         financial year
           financial year
                                                                               140
               1,600

               1,400                                                           135

               1,200                                                           130
                                                                Tonnes GHG-e

               1,000
Tonnes GHG-e

                                                                               125
                800
                                                                               120
                600

                400                                                            115

                200
                                                                                     2010-11   20011-12    2012-13
                       2010-11   2011-12    2012-13

                                                            8
Refrigerant gas
As demonstrated in Table 2, refrigerant gas related
emissions have been estimated and carried over from
2010-11. It is a small proportion (less than 1 per cent) of
the overall emissions. This data will be updated in future
reports. This is illustrated in Figure 7.

  Figure 7 Total refrigerant gas emissions by
           financial year

               1.80
               1.60
               1.40
               1.20
Tonnes GHG-e

               1.00
               0.80
               0.60
               0.40
               0.20

                      2010-11   2011-12        2012-13

                                                              9
Water Use

                                                       3
3.1 Overview
The Council’s water use consists of both mains (drinking)              Figure 8 Hobsons Bay City Council water use
water and bore water. Mains water is used in buildings                          2012 – 2013
and the irrigation of parks and open space, largely being
recreation facilities. Bore water is used for the ‘top up’ of
Newport and Cherry lakes.
                                                                      Bore water 6%
3.2 2012 - 2013 results
Table 3 demonstrates that the Council used 309 ML of
mains water in 2012-2013. This equates to 94 per cent
of total water use. It also demonstrates that the Council             Mains water 94%
used an estimated 19.3ML of bore water in 2012-2013.
This equates to 6 per cent of total water use. This is further
illustrated in Figure 8.

 Table 3      Hobsons Bay City Council total water use by financial year
 Council water usage            2008-09             2009-10                 2010-11           2011-12            2012-13
 Source                               ML                  ML                      ML                ML                 ML
 Bore water                          66.1                16.5                   19.3              19.3*              19.3*
 Mains (drinking) water            184.8               154.1                   199.6             230.2              309.2
 Total                             250.9               170.6                   218.9             249.5              328.5
                                                                                                                   *Estimated.
Water – general comment                                               Bore water
The data for the previous two years included all sites,               Bore water is used to ‘top up’ Cherry Lake in Altona and
except Bayfit Leisure Centre which is outside the                     Newport Lakes. However, due to poor data availability
Council’s operational control and therefore not within its            regarding the use of bore water, the bore water use for
reportable boundary. This is consistent with reporting for            the previous two years has been estimated to be the
greenhouse gas emissions.                                             same as the use for 2010-2011.

                                                                 10
3.3 Trends
Mains (drinking) water It can be noted in Figure 9 that there has been a 34.3 per
cent increase in mains water use between 2011-2012 and
Water irrigation on parks, gardens and playing reserves 2012-2013. This has continued the trend of upward growth
has increased substantially over the last two years, in water use since 2009-2010. For mains water use, this
largely due to the lifting of water restrictions following has largely been a result of the lifting of water restrictions,
the drought. It is now possible to water all playing allowing resumption of irrigation regimes consistent with
reserves (rather than one in every four as per the seasonal demands. For bore water use, additional ‘top up’
drought restrictions), parks and gardens to a level water has been used for Newport and Cherry Lakes.
consistent with community demand. However, to ensure
that playing reserves are not over watered, the soil
moisture content is measured monthly for each of the Figure 9 Hobsons Bay City Council total water
playing fields that receives irrigation. use by financial year
It should be noted that adverse weather conditions,
including a dry spring and autumn over 2012-2013, 350
extended the watering season on playing reserves by
about eight weeks. This has caused a spike in use. 300
250
Recycled water
Millions of litres (ML)
The Council also procures class A recycled water from the 200
Altona Sewage Treatment Plant through City West Water.
Over the last two years approximately eight million litres 150
(ML) of recycled water has been used. This relatively low
figure is partly due to issues with the reliability of the supply 100
being delivered.
50
Table 4 Hobsons Bay City Council recycled
2008-09
2009-10
2010-11
2011-12
2012-13
water use 2012 – 2013
Council water usage 2011-12 2012-13
Source ML ML
Mains (drinking) water
Recycled water 4 4.1
Bore water
11Waste and Litter
4
4.1 Overview
The Council provides waste and litter services to its Table 5 Waste and Litter collection services
community via collection services to households, by tonnes 2012 - 2013
community organisations and businesses, community
education and engagement, enforcement of local laws, Waste or Tonnes Recycling
litter collections, street sweeping, stormwater management, litter service or disposal
beach cleaning and seaweed removal. location
The Council measures the amount of waste and litter
Garbage 17,970 Land filled
collected, disposed of and recycled through these services.
Recycling 9,923 Recycled
4.2 2012 - 2013 results Garden waste 7,550 Recycled
Table 5 demonstrates that in 2012-2013 there was Hard waste 1,197 70% Recycled*
17,970 tonnes of garbage, 9,923 tonnes of recyclables
and 7,550 tonnes of garden waste collected. Other large Litter bins 508 Land filled
waste streams were seaweed and dumped rubbish with
1,903 and 1,160 tonnes collected respectively. Housing commission 145 Land filled
Street sweeping 1,121 Land filled
Sand siftings 4 Land filled
Dumped rubbish 1,160 Land filled
and loose litter
Seaweed 1,903 Land filled
Stormwater traps 150 Land filled
*Approximately 70 per cent by volume is recycled
124.3 Trends – collection services
Figure 10 shows the amount of waste in tonnes collected In 2012-2013 the Council experienced a decrease in
in kerbside waste collection services. The graph highlights garbage, recycling and garden waste tonnes collected
that the waste generation in Hobsons Bay is increasing. from the previous year. Feedback from other metropolitan
councils suggests this is a common trend. Comparable
Figure 10 Total waste (tonnes) collected each data is only available until 2010-2011 from the Victorian
year 2001 - 2002 to 2012 - 2013 from Local Government Survey 2010-2011 published by
all municipal waste collection services Sustainability Victoria.
and from each waste stream During 2010-2011 there was a decrease in garbage
collected Victoria wide by 2.6 per cent. Although
inconclusive, this decrease could be a result of a better
45
educated community, improved packaging or
40 reduced consumption.
The slight reduction in the amount of garden waste
35
collected may be due to the return to relatively stable
30 weather conditions throughout the year.
Thousands of Tonnes
The increase in recycling and garden waste tonnes
25 collected shown in 2004-2005 data can be attributed to
20 the introduction of the fortnightly recycling and garden
waste services in February 2004 and the subsequent
15 increased use.
10 Figure 10 also shows the variation in the amount collected
in each type of service. From 2011-2012 to 2012-2013
5 overall waste collected decreased by 2.83 per cent.
Garbage decreased by 1.29 per cent, recycling by 3.65
per cent and garden waste by 6.44 per cent. The
2001-02
2002-03
2003-04
2004-05
2005-06
2006-07
2007-08
2008-09
2009-10
2010-11
2011-12
2012-13
amount of hard waste collected rose by 5.59 per cent.
The increase in hard waste collected can be attributed to
an increase in the number of hard waste collections
delivered in 2012-2013.
Total waste generation
Total garbage
Total recycling
Total greenwaste
Total hard waste
13Waste and Litter
4
Figure 11 illustrates the trend in solid waste generation The amount of recyclables and garden waste that is
and recovery relative to Hobsons Bay population changes recycled or recovered (diversion rate) for 2012-2013 for
and compares this trend to metropolitan Melbourne the Council was 46.64 per cent, a decrease of 1.79 per
councils. Data includes municipal solid waste only. cent than the previous year. Comparable data is only
available until 2010-2011 from the Victorian Local
Government Survey 2010-2011 published by
Figure 11 Trend in solid waste generation and
Sustainability Victoria. In 2010-2011 the Council was
recovery relative to Hobsons Bay and
ranked 26 out of 70 councils for diversion with 44 per
metropolitan Melbourne councils
cent diversion (recycling and garden waste). The average
for metropolitan Melbourne was 46 per cent.
0.50
Waste generated per person in Hobsons Bay is higher
0.45 than that of metropolitan Melbourne by approximately 30
Total waste per person (tonnes per year)
0.40 kilograms in 2010-2011. However the amount of waste
recovered for recycling by each person in Hobsons Bay
0.35 was approximately 10 kilograms higher than metropolitan
Melbourne for the same time frame.
0.30
Diversion rates are very difficult to compare across
0.25 councils. They can be influenced by the types of services
0.20 offered, whether garden waste services are compulsory,
the cost of voluntary garden waste services, the size of
0.15 garbage bins, if food waste is permitted in garden waste
0.10 bins and community demographics.
0.05 Note to Figure 11: The Australian Bureau of Statistics reviewed
methodologies during the 2011 census and as a result population of
Local Government Areas were adjusted. Waste generation and
2001-02
2002-03
2003-04
2004-05
2005-06
2006-07
2007-08
2008-09
2009-10
2010-11
2011-12
recovery rates are available up until 2010-2011. Hobsons Bay
population data is only available until 30th June 2012. Waste data
includes waste collected from commercial properties for Hobsons
Bay and possibly in most metropolitan councils.
Hobsons Bay waste generated
Hobsons Bay waste recovered
Metropolitan Melbourne waste generated
Metropolitan Melbourne waste recovered
144.4 Trends – litter collection
services
Figure 12 indicates the trends in tonnes collected through
Figure 12 Total litter (tonnes) collected
litter collection services for the last four years.
2009-2010 to 2012-2013 from litter
collection services The amount of litter collected through the different
means has largely remained stable since the previous
3500 year, with the exception of seaweed. The amount of
seaweed collected decreased by 43 per cent in 2012-2013
compared with the previous year. The amount of seaweed
3000 that is produced is affected by tidal movements, nutrient
sources, health of the seaweed and weather conditions.
2500 In 2012-2013 seaweed was land filled. The Council has
been working with a service provider to trial seaweed
2000 recycling using a rotating drum trommel to separate sand
Tonnes
from the seaweed. The trommel requires modifications
1500 before being fully operational.
1000 4.5 Tracking against targets
500 Previous state government waste policy set targets for
municipal waste diversion. The recently adopted Victorian
Waste and Resource Recovery Policy ‘Getting Full Value’
2009-10 2010-11 2011-12 2012-13 does not have targets. The Council did not adopt specific
targets for waste and litter management because at the
time the state government was reviewing its policy. If
Seaweed
targets are set in the future by the state government, the
Street sweepings Council will consider these in light of its Waste and Litter
Management Plan 2012-2017.
Dumped rubbish and loose litter
Litter bins
Stormwater
Sand siftings
Housing commission
15Projects and activities
2012-2013
5
The Council undertakes day-to-day activities and many
additional activities to protect the municipality’s biodiversity,
manage waste and reduce our greenhouse gas emissions
and water use. Some are ongoing and some are discrete
projects to address specific issues. Some of these
activities assist the Council to meet its policy obligations
for sustainability targets. Other activities assist the
community to take action on sustainability or biodiversity.
These projects and activities are guided by higher level
strategies (see section 6) to ensure that the Council has
a targeted approach to achieving its aims and objectives.
5.1 Buildings • water collection tanks that are designed to service
garden areas and toilet systems throughout; and
The Council has included significant sustainable design • the inclusion of an energy efficient lighting system
elements in recent building projects, such as the Newport and lighting control.
Gardens Early Years Centre, the Laverton Community
Hub, the Williamstown Town Hall refurbishment and the During the construction period, the Council achieved an
Williamstown Esplanade Public Amenities. expected waste recovery rate of 92 per cent - based on
the recycling of the materials, including aluminium,
Laverton Community Hub brick/concrete mix, clean concrete and asphalt.
In the Laverton Community Hub development, energy Newport Gardens Early Years Centre
modelling of annual electricity consumption indicates
expected consumption of 77 Kilowatt hour/m²/yr. This is In the Newport Gardens Early Years Centre development,
a 28 per cent improvement on Building Code of Australia the Council aimed to achieve at least 30 per cent less
2009 Section J energy requirements, or 28 per cent less carbon emissions than required by the National
carbon emissions compared to a building of a similar Construction Code. Some of the sustainable design
type and size designed to current regulatory standards. elements include:
Some of the sustainable design elements include: • an electric boosted solar hot water system. The solar
• thermal insulation to walls and ceiling space; contribution is expected to be greater than 80 per cent;
• design features include large glazed facades and • three rainwater tanks will be installed onsite and they
three light wells to maximise natural lighting; will jointly collect 30,000 litres of rainwater from the
building roof. The water collected to be used for
• openable windows throughout to help ventilation;
irrigation to landscaped areas;
• an underground thermal storage tank for heating/cooling;
16• rainwater from the car park will be collected and • motion sensors and timer controls fitted to lighting and
treated in a filtration stormwater pit prior to discharge ventilation within heritage toilets, supper room toilets,
into the main stormwater system; backstage and change room areas; and
• double glazed windows and doors; • during the re-construction of the new timber floor, the
• extra insulation in the internal and external walls, roof Council recycled 85 per cent of all timber material
and ceilings; removed from the site.
• natural ventilation including a night purge system
which includes low-level intake trickle vents and Williamstown Esplanade public amenities
high-level openable clerestory windows for maximum New public amenities have been provided on the
comfort to users; Williamstown Esplanade next to Williamstown Beach.
• a condenser boiler unit with 95 per cent efficiency; and The sustainable design elements include:
• installation of hydronic heating panels. • a solar hot water system for the indoor showers;
• one 2,000 litre rainwater storage tank for flushing
Williamstown Town Hall refurbishment the toilets and garden irrigation;
The Williamstown Town Hall refurbishment has been the • recycled ironbark deck timber;
recipient of sustainable design elements, including: • recycled ironbark external wall cladding;
• reconstruction of the thermal chimney to improve • recycled messmate feature timber slats;
air circulation; • recycled ironbark structural posts;
• construction of a thermal corridor within the roof space; • natural ventilation;
• installation of sub-floor insulation to contribute to • light sensors;
satisfying energy compliance;
• two raingardens designed to capture and treat runoff
• installation of more energy efficient boiler units, to from adjacent roof spaces and hard surfaces; and
provide heating to the grand hall and supper room;
• self closing tap ware.
17Projects and activities
2012-2013
5
5.3 Biodiversity
Conservation actions
The Council has undertaken revegetation of 15,920
indigenous plants across environmentally sensitive sites
throughout Hobsons Bay to increase biodiversity, reduce
pest plant infestation, assist in the restoration of
ecological function and enhance habitat connectivity/
de-fragmentation between existing sites. The
revegetation was completed by Council staff and as
partnership plantings with a range of local volunteer/
friends groups, school groups and various local industry
and resident groups.
As indicated in table six, over the last five years the total The Council secured grants for on-ground conservation
number of plants provided in conservation sites is 77,165. works (which have commenced), including:
• $10,000 with Friends of Williamstown Wetlands
Table 6 Plants provided to conservation sites through Communities for Nature for construction of
nature trail, bird hide improvements, revegetation, weed
Year Plantings control and an interpretive sign;
2008-2009 15,165 • $7,000 with Friends of Laverton Creek through
Melbourne Water’s Corridors of Green Community
2009-2010 14,735 Grants program for revegetation, weed control and
community planting days along Laverton Creek;
2010-2011 16,700
• $25,000 from Hyde Tank PTY LTD through Environment
2011-2012 14,645 Protection Authority Victoria Inspiring Environmental
Solutions Program for a nature trail, re-vegetation
2012-2013 15,920 and rehabilitation work at Altona Coastal Park;
• $4,500 with Friends of Skeleton Creek through
Total 77,165
Melbourne Water’s Corridors of Green Community
Grants program for revegetation, weed control and
community planting days along Skeleton Creek;
• $2,900 for engagement activities promoting wetlands
and birds through the Ramsar Project Group; and
• $2,000 for engagement activities in schools through
the Ramsar Project Group.
The Council has also continued with its annual ongoing
target to plant more than 1,400 street trees and 400
park trees.
18Vegetation management planning Smarter water management
The Council is developing vegetation management plans There are now 20 reserve sites with smart water meters,
for the Rifle Range Reserve, Truganina Explosives Reserve improving monitoring ability. An additional six major sites
and Altona Coastal Park. will have software to enable the water use to be monitored
and controlled remotely. This software is designed to
detect leaks and will shut down if a leak is detected.
5.4 Water
Other recreation reserve projects
Stormwater harvesting projects
Over the past 12 months, the Council continued to
Further to the Council’s 2009 Water Plan, the Council integrate sustainable design elements into a number of
has partnered with City West Water to undertake three projects, including road upgrades, playgrounds and new
stormwater harvesting schemes at Cyril Curtain Reserve public toilets.
Williamstown, Paisley Park Altona North and Laverton
Recreation Reserve. Works have been completed on stages 1, 2 and 3 of
Sugar Gum Drive and Blue Gum Drive roadway and car
The stormwater harvesting and reuse project at Paisley park in Altona to provide grassed swales, rather than kerb
Park, Altona North is now completed and operational, and channel, to help treat road runoff.
providing non-mains water to assist irrigation of the Altona
Lakes golf course. In full operation it will provide irrigation The Edwards Reserve, South Kingsville playspace design
water to both the Altona East and Altona Magic soccer clubs incorporated raingardens designed to capture and treat
and the Altona lacrosse fields. runoff from adjacent roof spaces and hard surfaces.
The Cyril Curtain Reserve and Laverton Recreation
Reserve schemes are almost complete. In total, these
three schemes will capture and treat 175ML of stormwater
per year for reuse on a range of sporting fields and ovals
reducing the reliance on mains (drinking) water. This is
equal to the average annual use of over 1,000 households
and will reduce pollution to the bay.
19Projects and activities
2012-2013
5
At McCormack Park, Laverton an ephemeral swale was Electronic waste recycling
developed adjacent to the Laverton Creek during 2012.
Stage 1 of the swale was undertaken to improve the flow Electronic waste (ewaste) is electronic appliances that
of surface run off in the central section of the park and are obsolete and of no use to their owners. This includes
treat runoff prior to it entering the creek. Plant species appliances that are powered by batteries or those that plug
used in the project were locally indigenous, native and into electric outlets. Most of these items can be refurbished
drought tolerant. for reuse or recycled.
All landscape designs, such as J. J. Ginnifer Reserve The Council conducted two ewaste recycling trials in
Play Space, Altona North, used responsible selection of September and November 2012. The trials were a success,
plant species with a focus on locally indigenous, native with over 1,500 residents enthusiastically recycling
and drought tolerant species which do not require approximately 80 tonnes of ewaste.
irrigation after establishment. In early 2013, the Council began preparing a business
The A.W. Langshaws Reserve Oval redevelopment, case for an ewaste recycling program. Along with
Altona North included the planting and establishment of information from the two trials, the business case would
new warm season grass. assess opportunities within the National Television and
Computer Recycling Scheme and the Council’s current
Car parks are now designed with the aim to maximise hard waste service and have consideration for illegal
large canopy shade tree planting to reduce heat dumping data and benchmarking with other councils’
emission from hard surfaces. ewaste recycling programs.
Kerbside waste, recycling and garden
5.5 Waste and litter waste collection services
projects and activities In February 2013, the Council commenced its new contract
The Council adopted its Waste and Litter Management with Transpacific Cleanaway for weekly collection of
Plan 2012-2017 in August 2012. There were eight waste, an alternate fortnightly collection of garden waste
projects or activities undertaken in 2012-2013 to and recyclables, the distribution and maintenance of bins
implement this plan. and the weekly collection of commercial bundled cardboard.
Improvements include geographic positioning systems
and the requirement for the contractor to report on
resources consumed. New collection vehicles were also a
requirement of the contract and have fewer emissions than
previous models and the fleet that have been in operation
for nine years.
20North West Organics Recycling Project
In 2012 the Council signed the contracts and memorandum
of understanding with the Metropolitan Waste Management
Group (MWMG), Veolia Environmental Services Australia
Pty Ltd for organics processing plants to be established
in Bulla and Wyndham. This project involves 11 councils
and began in 2009. It was accepted by the Council in
2010. The Council has been involved in implementation
through a user group established under the contract terms.
Advocacy
During 2012-2013 the Council was actively involved in
activities of the Metropolitan Waste Management Group
and the Local Governments’ Waste Forum, with a senior
Hard waste collection services officer being the chair of the Technical Advisory Reference
In March 2013, the Council reviewed its hard waste Group for two years and contributing to the development
collection service and began a tender process which of a draft organics strategy for metropolitan Melbourne.
sought to improve recycling in general but in particular The Council contributed to the development of the
take advantage of a national scheme for television and Victorian Waste and Resource Recovery Policy ‘Getting
computer recycling. The Council will award this tender in Full Value’, advocating to the state government and
October 2013. MWMG to invest in and research alternatives to landfill
and options for resource recovery providing funding from
Waste Service and Charge Policy the landfill levy.
In April 2013, the Council adopted a Waste Service and
Charge Policy. This policy details the levels of municipal
waste services provided by the Council, where fees and
charges do or do not apply and how they are calculated.
The policy was developed from a study of the number
and type of municipal waste services provided to non-
residential properties.
21Projects and activities
2012-2013
5
5.6 Community
Clean Up Australia Day My Smart Garden
The Council hosted its annual Clean Up Australia Day event My Smart Garden is a free joint program for residents of
at the Warmies, Newport on Sunday, 3rd March 2013. Hobsons Bay and Moonee Valley that promotes the use
Approximately 30 people helped collect almost half a of gardens as spaces to be utilised for climate change
tonne of rubbish. The Council also provided skips and adaptation, including:
collection services for community groups running their own • trees for shade, reducing the need for air conditioning;
events at 17 other sites across the municipality.
• food gardens, minimising household ‘food miles’;
Fluorescent tube and bulb • habitat gardens, encouraging native species and
lighting recycling enhancing local biodiversity;
• organics composting, reducing waste to landfill;
The Council recycled approximately 46 kilograms of lighting
through its lighting recycling partnership program with • water sensitive garden design, minimising potable
Bunnings Warehouse, Altona and Chemsal. In 2012-2013, water usage; and
the Council commenced a review of the program. • development of a web-based toolkit to assist continued
development and improvement of ‘My Smart Garden’.
This program helps instill a culture of gardening as a
valuable resource for dealing with climate change. The
practical, fun and social approach taken by this program
encourages a self-sustaining community which comes
together to transfer and extend skills and knowledge
obtained through participation.
A robust evaluation was undertaken of the My Smart
Garden program in December 2012 as part of the final
reporting process to the joint funder, Sustainability Victoria.
The evaluation covered the first two years of the program.
Some of the key results are provided below.
22My Smart Garden boasts 1,042 participating residents, with Since completion of this evaluation, a further six
619 of those members attending at least one gardening workshops have been undertaken with about 120 people
workshop throughout the year. attending these events.
The original aim was to deliver at least 12 workshops My Smart Garden has also helped many participants
throughout the program. The program actually delivered connect with other people through gardening and other
35 My Smart Garden events (gardening workshops, open community groups, thus creating new connections and
days, garden tours and an edible gardening working bee strengthening existing networks within the local
or ‘permablitz’), plus five smart gardening activities at community. A high portion (70 per cent) became aware
festivals. An average of 39 people attended each workshop. of other groups involved in sustainable gardening and 69
Overall, participants found the events highly valuable, per cent shared what they learnt with others. It is hoped
providing an average rating of nine out of 10. that through stronger connections in the community,
The majority of survey respondents (87 per cent) reported residents will feel motivated and supported by being part
that they are gardening more sustainably since being of a larger group of ‘smarter gardeners’.
involved in the My Smart Garden program. A similar In 2013, the City of Maribyrnong partnered with Moonee
number of people (84 per cent) reported that they now Valley City Council and Hobsons Bay City Council in the
better understand the environmental benefits of gardening. My Smart Garden program.
Based on a detailed survey of action taken by 182
respondents, it is estimated that My Smart Garden
achieved the following resource savings annually:
• at least 50 tonnes of organic waste (equivalent to 860
small wheelie bins);
• at least 80 tonnes of greenhouse gas emissions
(equivalent to the annual emissions of five average
Australian households); and
• at least 1,245 kilolitres of potable water (equivalent to
volume of 622 slimline rainwater tanks).
Additional resource savings are expected to have been
achieved by participants who did not undertake the survey.
23Projects and activities
2012-2013
5
Energy, water and climate change World Environment Day
community events Three community events were held by the Council to
Five events were held whose objectives were to offer celebrate World Environment Day, all of which were
businesses and residents within Hobsons Bay an well attended.
opportunity to become informed about practical, affordable The Mayoral Forum at Newport Substation, held on 5th
and realistic action they can take to reduce their June 2013, attracted 120 community members and
environmental footprint and, in many cases, reduce their community expo providers, including special guest
costs or learn about climate change. They also offered speakers: Professor Barbara Norman from the Australian
avenues of assistance that participants could utilise after National University’s Climate Change Institute; Gardening
the events. Australia’s Millie Ross; Nutritionist, Naturopath, Author
and gold medallist Lauren Burns; Rod May from
Small business events Captains Creek Organics; and Master of Ceremonies
With the introduction of the carbon price legislation on Vasili of Vasili’s Garden.
1st July 2012, local businesses were invited to a workshop The ‘Cooking for Sustainability’ and ‘Gardening for
held in August 2012 to learn how to reduce their costs Sustainability’ workshops were held at the Laverton
and become more environmentally friendly. Ralph Plarre, Community Hub on Thursday, 6th and Saturday, 8th June
owner of Ferguson Plarre Bakehouses, presented the 2013 and were both over-subscribed with a second
business case for environmental action. In addition, ‘Cooking for Sustainability’ workshop held to cater for the
Professor Neville Norman presented on how to achieve great interest.
significant cost savings and how the ‘Clean Energy Future’
package works and ways businesses can prosper in a National Tree Day
carbon-constrained economy.
The Council’s official Planet Ark National Tree Day event
In February 2013, Toyota Motor Corporation (Ltd), together was held at Truganina Park, Altona Meadows on 29th July
with the Council and the Victorian Chamber of Commerce 2012. Over 70 people from the local community attended
and Industry, provided local businesses with an the event and helped plant 3,200 plants on the day. The
understanding of the business case for energy efficiency Council also provided assistance to the Friends of Lower
and carbon reduction. Toyota Australia also presented Kororoit Creek who held their own National Tree Day
their environmental programs and led a tour of the celebrations along the creek. It was great to see so many
manufacturing plant, showcasing its environmental and volunteers out and about in Hobsons Bay on the day.
sustainability attributes.
Representatives of 63 local businesses attended these
two events.
24Witness King Tide Other community conservation events
The Witness King Tides program enables our coastal These included ‘Summer by the Sea’ program events
community to create a photographic record of our with community members and corporate and business
coastline over time. On Sunday, 26th May, 51 community days. The corporate days included planting, maintenance,
members met at Altona Beach with their cameras to help weeding and rubbish collection. Table eight indicates that
capture the changes that climate change will bring to 25 of these events were held in 2012-2013.
the coast. Whilst the tide was high, the waves were low.
These conditions were ideal for allowing participants to
Table 8 Community conservation events
capture good base line images for the future.
2009-10 2010-11 2011-12 2012-13
16 events 20 events 30 events 25 events
School events
These included incursions and excursions to conservation
sites, both hands-on environmental work and educational
sessions. Topics included Flora and Fauna in Hobsons Bay,
Biodiversity, Conservation Sites, What it’s like to be a
Conservation Ranger, I used to be a Landfill Site, Wetlands
and Waterway Health and Water Conservation. Table nine
indicates that 42 of these events were held in 2012-2013.
Friends group activities.
Table 9 School events
Friends group activities were run on weekends and
included activities like planting, weeding, walk and talks, 2009-10 2010-11 2011-12 2012-13
rubbish pick-ups and general maintenance at conservation
sites throughout the municipality. Table seven indicates 21 events 20 events 25 events 42 events
that 60 events were held in 2012-2013, more than one
every weekend.
Table 7 Friends group activities
2009-10 2010-11 2011-12 2012-13
55 events 56 events 59 events 60 events
25Strategy development
2012-2013
6
In 2012-2013, the Council adopted the Waste and Litter The policy stipulates the Council will:
Management Plan 2012-2017, reviewed the Sustainable • apply the precautionary principle to decision making
Design in Council Facilities Policy and procured a data when considering the potential implications associated
management system to help manage and monitor the with climate change;
Council’s environmental data. Looking forward, the
Council will soon adopt the Climate change policy 2013, • achieve corporate zero net greenhouse gas emissions
Climate change adaptation plan 2013-2018, Corporate by 2020;
greenhouse strategy 2013-2020, Environmental • undertake actions to reduce the community’s
engagement strategy 2013-2018 and the Community greenhouse gas emissions and lead the community
greenhouse strategy 2013-2030. towards achieving zero net greenhouse gas emissions
by 2030; and
• respond to the risks of climate change to council assets
6.1 Waste and Litter and services and assist the community to be more
Management Plan resilient to the effects of climate change.
2012-2017
The Council adopted its Waste and Litter Management Plan 6.3 Climate Change Adaptation
2012-2017 in August 2012. This plan sets the direction of Plan 2013-2018
waste and litter management for the municipality. The plan
has drawn from an Issues Paper, community feedback on Adaptation planning is a critical component of effective
this paper, government policy, and the Council’s operational risk management. The output of this project is a practical,
changes. The plan centres on the Council’s areas of implementable plan to guide the Council’s coordinated
responsibility and aims to address the waste and litter response to the identified risks posed by climate change.
management needs of Hobsons Bay over five years. The The plan is a ‘living’ document that will be continually
plan addresses waste and litter that the Council has direct updated. It will assist those accountable for adaptation
control over, or influence on, and includes kerbside waste at the Council to drive effective action and planning.
and litter collection.
6.4 Corporate Greenhouse
6.2 Climate Change Policy 2013 Strategy 2013-2020
The Climate change policy 2013 responds to the projected The strategy primarily addresses those emissions that
implications of climate change on Hobsons Bay’s social, the Council is operationally responsible for under the
environmental and economic sustainability. framework of Commonwealth legislation. This adopted
strategy provides the Council with a pathway for achieving
its zero net emissions by 2020 target.
266.5 Environmental Engagement previously adopted corporate energy and water
reduction and zero net emissions targets by 2020;
Strategy 2013-2018 • reduce the environmental impact of the construction
Development of this strategy was undertaken to identify key and use of Council buildings by embedding sustainable
environmental issues of concern to the local community design principles into existing policies and allocating
and provide various community engagement opportunities resources to address gaps in existing policies; and
which respond to these issues in a meaningful, positive • lead the community towards achieving zero net
and constructive way. The strategy defines the various emissions by 2030 by providing opportunities for
sectors of the community that the Council needs to engage public engagement with and access to inspiring
with and the goals and objectives to guide this engagement. sustainable buildings.
This policy is supported by a Strategy and Implementation
6.6 Community Greenhouse Plan which has largely been reviewed during 2012-2013.
Strategy 2013-2030 The review identified that the policy is well supported
but staff training is required to embed good practice
The strategy will provide the Council with a pathway for throughout the organisation.
achieving its community target of zero net emissions by
2030. The development of the strategy is informed by
research that was undertaken in 2011 into the attitudes 6.8 Data management
and perception of Hobsons Bay residents on climate The Council has committed to achieving challenging
change and greenhouse gas mitigation and an audit of targets for water use and greenhouse gas emissions
all Council strategies and policies. reduction. Consequently, the Council has procured a data
The strategy ties in with the Environmental Engagement management system and service in order to manage and
Strategy and addresses greenhouse gas emissions from monitor the Council’s environmental data.
the residential, commercial, industrial, transport and The system generates high quality information about water,
waste sectors. A number of ‘solutions’, which are relevant energy and greenhouse gas emissions available in a way
to local government control, are proposed in the strategy. that minimises the staff time required to manage the data,
The strategy also includes solutions for dealing with and maximises time to act on the data. The data is used
residual emissions to achieve the zero net target. for monitoring, project planning and evaluation, project
reporting, and annual reporting. The new Environmental
6.7 Sustainable Design in Reporting System has been operational since July 2012
and has improved data management and availability.
Council Facilities Policy
The Council has developed a Sustainable Design in Council
Facilities Policy. The objectives of this policy are to:
• reduce the environmental impacts and operating
costs of all Council-owned buildings while achieving
27Regional initiatives
7
7.1 Greening the West
Hobsons Bay City Council is a partner with City West
Water, local western councils and Victorian Government
organisations to create more liveable suburbs, a cleaner
environment and contribute to improved community
health. Greening the West aims to positively impact the
health status, climate and environment of Melbourne’s
west by increasing the tree canopy cover and vegetation
through its suburbs.
7.2 Western Alliance
for Greenhouse Action
Hobsons Bay City Council is an active member of the
Western Alliance for Greenhouse Action. This alliance
includes western suburb municipalities that work jointly
on regional climate change mitigation and adaptation
initiatives to reduce the potential impact and outcomes of
7.3 Association of Bayside
climate change. Municipalities
Hobsons Bay City Council is a member of the Association
of Bayside Municipalities. Hobsons Bay’s Mayor Cr Angela
Altair chaired the Association of Bayside Municipalities
(ABM) during 2012-2013. The ten Councils of the ABM
work together to actively manage and maintain the Port
Phillip Bay coast to achieve the highest levels of community
benefit by protecting and enhancing the social, economic
and environmental values of the bay.
28Hobsons Bay City Council 115 Civic Parade, Altona PO Box 21, Altona 3018 Telephone: (03) 9932 1000 NRS: 133 677 / quote (03) 9932 1000 Hobsons Bay Language Line 9932 1212 Email: customerservice@hobsonsbay.vic.gov.au Website: www.hobsonsbay.vic.gov.au The Hobsons Bay City Council is committed to protecting and enhancing our environment. This publication is printed with vegetable inks on recycled, non-chemically bleached stock. Published 2013
You can also read