International survey of fuel consumption of seagoing ships at berth - CNSS Work package 5, Quantfication of the current contribution of ships to ...
←
→
Page content transcription
If your browser does not render page correctly, please read the page content below
CNSS Work package 5,
Quantfication of the current contribution of ships to air pollution

International survey of fuel
 consumption of seagoing
       ships at berth

                               CNSS
                             March 2014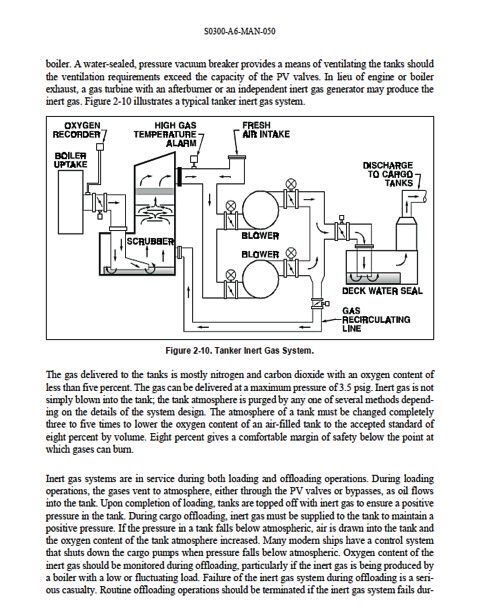
INTERNATIONAL SURVEY OF FUEL CONSUMPTION OF SEAGOING SHIPS AT BERTH

                                                           Contents

                                                           Section 1
                                                           International survey of fuel consumption of seagoing ships at berth    3

                                                           Section 2
                                                           Survey of fuel consumption of seagoing tankers at berth in Rotterdam   36
          Photo: www.mediaserver.hamburg.de/C. Spahrbier

2
International survey of fuel
               consumption of seagoing
                                  ships at berth

    Compiled by: ir. J.H.J. Hulskotte, TNO, ir. B. Wester and ing. A.M. Snijder, DCMR Milieudienst Rijnmond,
                                                dr. V. Matthias, HZG

Summary

On behalf of the INTERREG IVB Clean North Sea Shipping (CNSS) project a survey of energy consumption and
fuel use on board seagoing ships was performed in close cooperation with the Port of Hamburg and
Bremerhafen, the Port of Antwerp, the Port of Rotterdam and the Port of Bergen. The current understanding of
fuel consumption and associated emissions from seagoing ships at berth is based on a survey conducted in
2003. The aim of this latest survey was to provide an updated assessment of fuel consumption and emissions.
The survey produced a comprehensive dataset of information gathered from 175 ships, including fuel
consumption data, engine power, duration of usage and so on.

This report presents a first analysis of the survey data with respect to fuel usage at berth and the consequences
for emissions. The analysis has already resulted in new recommendations for the calculation of fuel consumption
at berth for nine ship types. In cases where the survey failed to produce sufficient data, combinations of existing
data were used. The fuel distribution over auxiliary engines and boilers has been partly revised based on the
results of the questionnaires. Compared with the 2003 survey, relatively less fuel seems to be used in boilers.
This change in fuel usage has resulted in a relative increase of NOx, VOC and CO emissions. As a result of
current EU regulations, 90 percent of fuel used on board of ships was proven to have a sulphur content of or
below 0,1%. This has resulted in a significant reduction of SO2 emissions and a stabilization of PM10 emissions.

Tankers are an important source of emissions for some large ports. However, as the available data for this
category of ship are of relatively poor quality, this report recommends a dedicated survey to assess tanker fuel
usage. Any new survey should consider the role and importance of the boilers during the entire berthing
procedure. Since the emission profiles of boilers and ship engines vary considerably, a detailed understanding
of relative fuel consumption is essential if emissions are to be estimated accurately.

Two other categories of ships that still lack sufficient fuel consumption data are ROPAX ships and Cruise ships.

                                                                                                                   3
INTERNATIONAL SURVEY OF FUEL CONSUMPTION OF SEAGOING SHIPS AT BERTH

Acknowledgements

The authors of this report would like to express their    Rotterdam Main Port University of applied sciences
gratitude and acknowledge the contribution of all those
who have assisted with this project.                      Students:
                                                          Inger van Vuuren, Timothy van Heest, Kasper Renes,
First of all we want to thank all the hard working        Michael Krul, Alex van den Berg, Oskar Dasselaar,
harbour staff who organised the ship visits at very       Daan Groenewegen,Chris Hanemaayer, Anya Koch,
short notice. Secondly, we would like to thank the        Sander Lohoff
students who boarded the ships to complete the
questionnaires and analysed the results. Finally, we      Teachers:
are grateful to the teachers who prepared,                Peter van Kluyven, Monique van der Drift, Aat Hoorn
accompanied and assisted the students during the
project.                                                  ........................................................................................

                                                          Wasserschutpolizei Hamburg
                                                          In general and in particular Thorsten Koops

                                                          ........................................................................................

                                                          Antwerp Maritime Academy
                                                          (Hogere Zeevaartschool Antwerpen)

                                                          Tom Moelans, Cedric Kegels, Stijn Andries, François
                                                          Requier, Amos Sebrechts, Nicolas Saintenoy

                                                          ........................................................................................

                                                          Hordaland County Council
                                                          Marte Steinskog

                                                          ........................................................................................

                                                          Port of Rotterdam Authority
                                                          in general and particularly

                                                          Martin Pastijn, Wachtchef Inspectie
                                                          Divisie Havenmeester (DHMR)

4
Table of contents

1   Introduction                                               6

2   Preparation                                                7

3   Data collection                                            8

4   Analysis of fuel consumption at berth                      10
    4.1    Hourly fuel consumption as a measure of emissions   10
    4.2    Calculation of hourly fuel consumption              10
    4.3    Selection of valid data                             11
    4.4    Results of hourly fuel consumption                  12
    4.5    Fuel distribution over engine types                 26
    4.6    Fuels and sulphur content                           27

5   Consequences of this research for emissions                30
    5.1    Activity data and emission factors                  30
    5.2    Reference emissions                                 31
    5.3    Emissions based on results of this study            31

6   Conclusions and recommendations                            33

7   References                                                 34

                                                                    5
INTERNATIONAL SURVEY OF FUEL CONSUMPTION OF SEAGOING SHIPS AT BERTH

1       Introduction

Ports suffer from air pollution not only as a result of     Antwerp, the Port of Rotterdam and the Port of Bergen.
ships arriving and departing but also as a result of        The survey was based on
emissions produced by ships during their time at
berth. A thorough assessment of ship emissions at           on a questionnaire designed and tested in 2003
berth is a crucial first step to understanding the impact   (referred to as EMS study) on behalf of the
of those emissions on air quality and public health in      Netherlands National Emission Inventory
harbour cities. In addition, the impact of abatement        (Hulskotte et al., 2003).
measures such as shore-side electricity and/or
restrictions in sulphur content for shipping fuel to be     Some parts of the questionnaire were modified to
used in ports must also be understood.                      clarify the answers, meet the goals of the CNSS project
                                                            and to collect information on any emission reduction
A survey of energy consumption and fuel use on board        technologies already installed on board the ships.
175 seagoing ships was undertaken in conjunction
with the Port of Hamburg and Bremerhafen, the Port of

6
2       Preparation

                  Before boarding the ships to complete the survey,           test, the sequence of questions was modified slightly
                  some preparatory work had to be undertaken. The first       and it was agreed that using a paper version of the
                  stage was to arrange access to the ships. After the         questionnaire would speed up the data collection
                  responsible organisations had been contacted, it            process and facilitate better communication with the
                  transpired that each harbour had its own conditions for     crew on board the ships being surveyed. The data
                  obtaining access to ships. The questionnaire had to be      would subsequently be transferred to digital format
                  modified for the current survey and to meet the             (MS Excel®) once the questionnaires had been
                  objectives of the CNSS project.                             completed, with all data fields named sequentially to
                                                                              facilitate the transfer process.
                  The partners of the CNSS project gave several
                  suggestions to modify the questionnaire that were           In final preparation for the survey, all interviewers were
                  incorporated in the version that is been used.              invited to attend a meeting, hosted by representatives
                                                                              from the CNSS project, during which the goals and the
                  Some initial data checks were performed on the digital      purpose of the project were explained. The meeting
                  version of the questionnaire (MS Excel® format).            also involved some instruction for the interviewers on
                  However, some of the students had access to different       how to complete the survey and some practical
                  versions of MS Excel® and some were unfamiliar with         recommendations on how to behave on board ship.
                  that particular software package. To avoid any              Each interviewer was also required to complete an
                  inconsistencies, a printed version of the questionnaire     online test.
                  was produced for on board data collection. The
                  decision to modify the survey procedure was made            Before beginning the survey, the captain of each ship
                  after testing the questionnaire in the “machinery           involved received a letter from the CNSS project
                  simulation room” of the Rotterdam Main Port University      advising them that any data collected would only be
                  of Applied Sciences. With one of the teachers acting        used for anonymous environmental research, and that
                  as the captain of a ship, a student tried to fill out the   no information about individual ships would be
                  questionnaire on a laptop computer. As a result of this     published.
Port of Antwerp

                                                                                                                                       7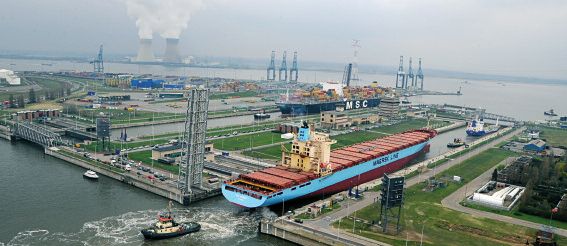
INTERNATIONAL SURVEY OF FUEL CONSUMPTION OF SEAGOING SHIPS AT BERTH

3            Data collection

On arrival on board the ships at berth, the               master who were able to read the metering instruments
questionnaires were completed by different individuals,   on the bridge and in the machinery room. Once the
recruited and trained in advance by the CNSS project.     paper versions of the questionnaires were completed,
In Hamburg and Bremerhaven the ships were visited         the data were transferred to MS Excel® format.
by officials from the “Wasserschutzpolizei”. The ship
visits in Antwerp, Rotterdam and Bergen were              The classification of ships was primarily based on
undertaken by students from the Maritime Academy          categories provided by the Maritime Connector
(Hogere Zeevaartschool Antwerpen) the Netherlands         website (http://maritime-connector.com/). The EMS
Maritime University (STC-NMU) and the University of       types (Hulskotte et al., 2003) were added manually,
Bergen, respectively.                                     partly based on information that was taken from
                                                          registered data records. In most cases this information
In most cases the answers for the questionnaires were     was available on the websites of ship classification
provided by the chief engineers and the captain or a      companies.

    Table 1 Classification of ships

    EMS shiptype              Type in Maritime Connector                Remark                   Number
    Bulk carrier              BULK CARRIER                                                       13
    Chem.+Gas tanker          CHEMICAL TANKER                                                    1
                              LPG TANKER                                                         1
                              OIL/CHEMICAL TANKER                                                21
    Container ship            CONTAINER SHIP                                                     66
    General Dry Cargo         CARGO                                                              11
                              GENERAL CARGO                                                      4
    Oil tanker, crude         CRUDE OIL TANKER                                                   5
                              OIL PRODUCTS TANKER                       crude                    3
    Passenger                 PASSENGERS SHIP                           ferry                    1
                              RO-RO/PASSENGER SHIP                      ferries                  2
    Reefer                    REEFER                                                             6
    RoRo Cargo / Vehicle      RO-RO CARGO                                                        5
                              RO-RO/PASSENGER SHIP                      Vehicle carriers         8
                              VEHICLES CARRIER                                                   8
    Tug/Supply                ANCHOR HANDLING VESSEL                                             15
                              MULTI PURPOSE OFFSHORE VESSEL                                      2
                              OFFSHORE SUPPLY SHIP                                               1
                              TUG/SUPPLY VESSEL                                                  2
    Grand Total                                                                                  175

8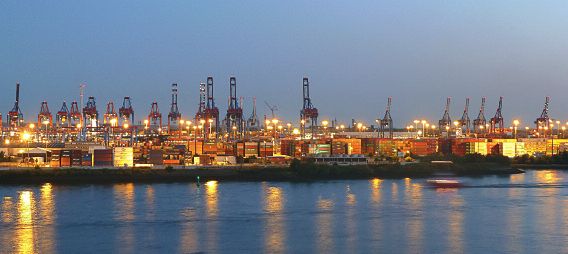
Table 2   Types of ships visited by harbour location, number

                                                 EMS shiptype            Antwerpen        Bergen     Bremerhafen Hamburg          Rotterdam     Grand Total

                                                 Bulk carrier                                                            10               3            13

                                                 Chem.+Gas tanker               1                                          6            16             23

                                                 Container ship                 7                             4          37             17             65

                                                 General Dry Cargo              5                                          9              1            15

                                                 Oil tanker, crude                                                         1              7             8

                                                 Passenger                                    2                                           2             4

                                                 Reefer                         2                                          3              1             6

                                                 RoRo Cargo / Vehicle                         3               5            9              4            21

                                                 Tug/Supply                                  20                                                        20

                                                 Grand Total                   15            25               9          75             51            175

                                                 The figures in Table 2 indicate that container ships were the most frequent visitors, followed by chemical and
                                                 oil product tankers and general dry cargo ships. Although crude oil tankers and passenger ships are under-
                                                 represented in the questionnaire, their possible share of emissions has been taken into account.
Photo: www.mediaserver.hamburg.de/C. Spahrbier

                                                                                                                                                                  9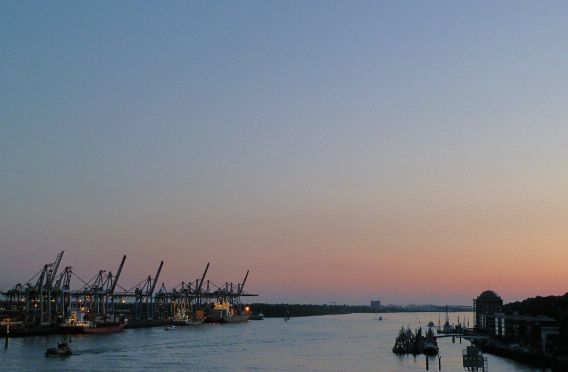
INTERNATIONAL SURVEY OF FUEL CONSUMPTION OF SEAGOING SHIPS AT BERTH

4       Analysis of fuel consumption at berth

4.1     Hourly fuel consumption as                          If information on time and fuel consumption per hour
        a measure of emissions                              per engine was available, the aggregated fuel
                                                            consumption based on individual engines was taken
The most generally applicable measure for estimating        as the total fuel consumption per call. If the usage time
ship emissions at berth is probably the hourly fuel         per engine was not known, the total time at berth was
consumption rate. A measure of energy consumption           used to estimate the fuel consumption of a particular
may be less applicable when specific fuel                   engine.
consumption has been shown to vary considerably.
                                                            [Total_FC] =∑1..x ([AEx_activeatberth_hours] *
The time spent at berth may also vary considerably          [AEx_fuelatberth_kgperhour])
between ships and harbours. Therefore the hourly fuel
consumption rate was chosen as the central focus of         When [AEy_activeatberth_hours] not filled in
the analysis.
                                                            [Total_FC] = [Total_time_at_berth_hours]*
                                                            [AEy_fuelatberth_kgperhour]) +
                                                            ∑1..x x ([AEx_activeatberth_hours] *
4.2    Calculation of hourly                                [AEx_fuelatberth_kgperhour])
       fuel consumption
In addition to other data collected in the questionnaire,   To calculate average hourly fuel consumption, the total
the following information about the usage of engines        hourly fuel consumption was divided by the total time
and power equipment at berth were collected.                at berth.

                                                            [FCh] = [Total_FC] / [Total_time_at_berth_hours]

Running hours              [AEx_activeatberth_hours]        In some special cases where no time data were
                                                            available (anchor handling vessels), the hourly fuel
Fuel rate                  [AEx_fuelatberth_kgperhour]      consumption was measured by adding all the hourly
                                                            fuel consumptions of different engines:
Actual power               [AEx_poweratberth]
                                                            [FCh] = ∑1..x([AEx_fuelatberth_kgperhour])
Measure of actual power [AEx_unitpower_berth]
                                                            To compare with previously published results
Estimated Load factor      [AEx_LF_berth]                   (Hulskotte et al,2003 and Hulskotte & Denier van der
                                                            Gon, 2010), hourly fuel consumption was divided by
Total hours at berth       [Total_time_at_berth_hours]      the gross tonnage (GT) times 1000.

Ships gross tonnage        [Grosstonnage_GT]

                                                            FCs = [FCh]/( [Grosstonnage_GT] * 1000)

The information above was collected for Main Engines
(when applicable), Auxilliary Engines (maximum three),
Gas turbines and Boilers (both when applicable).

10
4.3 Selection of valid data Oil tanker boilers were responsible for 33 percent of
the fuel consumption, whereas in the previous study
In preparation for further analysis, the validity of the they were responsible for 63 percent. This difference
data was assessed and a subset of deviating data was may be attributable to varying tanker fuel consumption
discarded, based on specific criteria. If the hourly fuel rates during their time in port. The timing of fuel
consumption divided by 1000GT (FCs) differed by consumption data collection may therefore have a
more than a factor of three from previous published significant influence on the results of the survey.
data (Hulskotte et al,2003 and Hulskotte & Denier van Further research will be necessary to clarify this.
der Gon, 2010) for the same ship type, the data were
discarded. It could be argued that selecting data by comparing
them to previous results is erroneous (Hulskotte and
Data were considered as deviant if van der Gon, 2010). To establish whether a more
[FCs]/[FCps]>3 or if [FCs]/[FCps]INTERNATIONAL SURVEY OF FUEL CONSUMPTION OF SEAGOING SHIPS AT BERTH
4.4 Results of hourly fuel (multiplied by 1000) will give an indication of the fuel
consumption consumption expressed as kg/GT*1000.hour. In the
EMS-protocol (Hulskotte et al., 2003) fuel consumption
This section will review the hourly fuel consumption was estimated by taking the total fuel consumption
results for the various ship types. By presenting hourly divided by total GT*1000.hour as the estimated value
fuel consumption values potted against ship volumes for total fuel consumption.
measured as gross ton (GT), it is possible to observe
whether there is a relationship between ship volumes
and the hourly fuel consumption of a certain ship type.
The slope of the regression lines in the graph 4.4.1 Container ships
Figure 1 Total hourly fuel consumption of container ships as a function of ship volume
Figure 1 indicates a strong relationship between fuel consumption and ship volume expressed in gross
tonnes (GT). It seems that smaller ships have relatively higher fuel consumption than bigger ships. By
drawing a regression line (see Figure 2) with the fuel consumption as a function of GT to a certain power
(power function) multiplied with a coefficient a higher value of R2 is obtained. This may indicate that a
power function is a better approximation of the relationship between GT and hourly fuel consumption of
container ships as was already shown by Hulskotte & Denier van der Gon, 2010.
12Figure 2 Total hourly fuel consumption of container ships as a function of ship volume (power function)
Table 3 Summarized results of fuel consumption of container ships
Parameter EMS This work
N=12 N=48
Total fuel/Total GT.h (kg/GT.h/1000) 5.0 6.0
Intercept (I) (kg) + Slope (S) (kg/GT.h/1000) I=134;S=4.3
Power function: Slope (S) and power (p) S=0.41; p=0.83
There is little difference between the EMS data There was always a risk that valid fuel consumption
(Hulskotte et al., 2003) and the data collected as part data could be excluded when the deviant data were
of this study. However, as the EMS results were only discarded. Therefore a parallel check was performed
based on the data collected from 12 ships, the data on the values of the SFOC of the first auxiliary engine
in this study (48 data samples) are probably are (see Table 4).
more representative and accurate.
13INTERNATIONAL SURVEY OF FUEL CONSUMPTION OF SEAGOING SHIPS AT BERTH
Table 4 Results of data filtering compared with check on SFOC values of container ships
Filter criteria number percentage SFOC OK1 SFOC X1
Deviant 17 26% 12% 82%
Not deviant 48 74% 85% 8%
65
1
When SFOC OC + SFOC X in the same row do not add to 100% alternative explanation for non-deviating
SFOC may be valid. However for clarity reasons this is not accounted.
Table 4 clearly indicates that there is an overwhelming SFOC value within the reasonable range. However, for
correspondence between deviant fuel consumption reason of transparency it was decided not to take
and SFOC values that lie beyond the reasonable these alternative calculations of SFOC into account. In
range. the following sections, this discrepancy will recur in
similar tables.
Where deviant data and out of range SFOC values
coincide, the hourly fuel consumption was probably 4.4.2 General dry cargo (GDC),
not recorded correctly in the questionnaires. A RoRo cargo and vehicle carriers
selection of valid data from the questionnaires, for all
ship types, was rechecked. In the analysis of fuel consumption data, merging two
EMS-types (general dry cargo and RoRo cargo) did
In Table 4 the SFOC percentages do not add up to not introduce any discrepancies when deriving
100 percent. There may be one or more ships with accurate fuel consumption values for ships within
alternative SFOC calculation(s), which explains the these categories.
Figure 1 Total hourly fuel consumption of container ships as a function of ship volume
Figure 3 Total hourly fuel consumption of general dry cargo and RoRo cargo ships as a function of ship volume
14Table 5 Summarized results of fuel consumption of general dry cargo and RoRo cargo ships
Parameter EMS This work
N=3 N=24
Total fuel/Total GT.h (kg/GT.h/1000) 5.4 6.1
Intercept (I) (kg) + Slope (S) (kg/GT.h/1000) I=18;S=5.6.
Comparing the EMS data (Hulskotte et al., 2003) to However, as the EMS study was only based on 3 ships
data collected in this study suggests there are no and the current study included 24 data samples, these
significant differences between the two datasets for latest results provide a more robust confirmation of the
general dry cargo and RoRo cargo ships. earlier results. Data used in this study are probably
more representative and accurate.
Table 6 Results of data filtering compared with check on SFOC values of general dry cargo
and RoRo cargo ships
Filter criteria Number percentage SFOC OK1 SFOC X1
Deviant 12 33% 42% 50%
Not deviant 24 66% 79% 17%
36
1
When SFOC OC + SFOC X in the same row do not add to 100% alternative explanation for non-deviating
SFOC may be valid. However for clarity reasons this is not accounted.
Table 6 shows that the majority (79%) of valid data has 4.4.3 Bulk carriers
a corresponding SFOC value that is within a
reasonable range. However 5 out of 12 deviant fuel In most cases bulk carriers don’t need special
consumption recordings (42%) also show SFOC values equipment for energy production, which explains why
within a reasonable range. their fuel usage at berth is relatively low. Although self-
unloading bulk carriers could be the exception to this
This may indicate that in reality fuel consumption observation, no such bulk carriers were part of this
figures may vary more widely than anticipated. survey.
15INTERNATIONAL SURVEY OF FUEL CONSUMPTION OF SEAGOING SHIPS AT BERTH
Figure 4 Total hourly fuel consumption of bulk carriers as a function of ship volume
Figure 3 Total hourly fuel consumption of general dry cargo and RoRo cargo ships as a function of ship volume
Table 7 Summarized results of fuel consumption of bulk carriers
Parameter EMS This work
Total fuel/Total GT.h (kg/GT.h/1000) 2.4 3.1
Intercept (I) (kg) + Slope (S) (kg/GT.h/1000) I=7;S=3.1
This study included eight valid bulk carrier data samples; the EMS study (Hulskotte et al.,2003) had 10 data
samples. The results of this study are not significantly different from EMS results.
16Table 8 Results of data filtering compared with check on SFOC values of bulk carriers
Filter criteria Number percentage SFOC OK SFOC X
Deviant 5 38% 40% 60%
Not deviant 8 62% 100% 0%
13
Table 8 shows that all not deviant fuel consumption 4.4.4 Oil tankers
data have SFOC values within reasonable range while
the majority of deviant fuel consumption data show There were a limited number of data samples for crude
SFOC values beyond reasonable range. The used data oil tankers collected as part of this study. As a result,
filter seems therefore to be justified. the data collected in this study (8 data samples) were
merged with EMS data (15 data samples).
Figure 5 Total hourly fuel consumption of crude oil tankers as function of ship volume
(green=this survey, n=8, blue/green=EMS-data, n=15)
Figure 5 (includes valid and deviant data) indicates of other ships (see other graphs). The EMS study
that the size and the relatively high fuel consumption (Hulskotte et al.,2003) contained 33% deviant data,
rate of oil tankers results in an hourly fuel consumption while this study included 50% deviant data.
rate that may be as much as 10 times higher than that
17INTERNATIONAL SURVEY OF FUEL CONSUMPTION OF SEAGOING SHIPS AT BERTH
Table 9 Summarized results of fuel consumption of crude oil tankers
Parameter EMS This work
N=15 (N=8)
Total fuel/Total GT.h (kg/GT.h/1000) 19.3 11.6
Intercept (I) (kg) + Slope (S) (kg/GT.h/1000) I=34;S=16.9
Intercept taken from
chemical tankers
Having obtained only eight new data samples, this survey does not provide a definitive insight into crude oil
tanker fuel consumption. The slope of the regression line in Figure 5 probably provides the best provisional
estimation of fuel consumption of crude oil tankers. A more thorough and dedicated survey of this type of ship
is recommended.
Table 10 Results of data filtering compared with check on SFOC values crude oil tankers
Filter criteria Number percentage SFOC OK SFOC X
Deviant 4 50% 75% 25%
Not deviant 4 50% 75% 25%
8
The lack of difference in plausibility of SFOC values between deviant and valid data was another reason for not
filtering data samples.
184.4.5 Oil products, chemical products percentage of deviant data and unrealistic SFOC
and gas tankers values, the latest data were merged with the original
EMS data (including valid data).
As the data for the group of oil products, chemical
products and gas tankers contained a relatively high
Figure 6 Total hourly fuel consumption of oil products/chemical and gas tankers as a function of
ship volume (green=this survey,n=12, blue/green=EMS-data,n=10)
Figure 6 indicates that in general the values collected in the latest survey are a little lower than in the
original EMS data (Hulskotte et al,2003).
Table 11 Summarized results of fuel consumption of Oil products/chemical and gas tankers
Parameter EMS This work+EMS
N=10 N=12
Total fuel/Total GT.h (kg/GT.h/1000) 17.5 14.5 combined
12.1 this work
Intercept (I) (kg) + Slope (S) (kg/GT.h/1000) I=34;S=13.8
In total, 12 data samples were collected for this survey in comparison to the 10 data samples collected for the
EMS project. As in the case of oil tankers, a more thorough and dedicated survey of this type of ship is
required. Because both ship types (oil products/chemical and gas tankers as well as crude oil tankers) require
inert gas production results of these types could be compared carefully to each other.
19INTERNATIONAL SURVEY OF FUEL CONSUMPTION OF SEAGOING SHIPS AT BERTH
Table 12 Results of data filtering compared with check on SFOC values
Filter criteria number percentage SFOC OK1 SFOC X1
Deviant 11 48% 36% 55%
Not deviant 12 52% 58% 25%
36
1
When SFOC OC + SFOC X in the same row do not add to 100% alternative explanation for non-deviating
SFOC may be valid. However for clarity reasons this is not accounted.
Table 12 shows that the majority of valid data had used to transport perishable commodities that require
SFOC values within a reasonable range and that the a temperature-controlled environment, such as fruits,
deviant data had more SFOC values beyond that meat, fish, vegetables, dairy products and other foods
reasonable range. However about 1/3 of deviant fuel (Wikipedia). The energy consumption required for
consumption data showed SFOC values that are within cooling means this type of ship uses relatively more
a reasonable range. energy than, for example, general cargo ships.
As only five valid reefer data samples were obtained in
4.4.6 Reefers this project, it was decided to merge the data with the
data of the EMS project. This produced 11 data
A refrigerated (or reefer) ship is a type of ship typically samples for analysis.
Figure 7 Total hourly fuel consumption of reefers as a function of ships volume
(green=this survey,n=5, blue/green=EMS-data, n=6)
20Table 13 Summarized results of fuel consumption of reefers
Parameter EMS This work
N=6 N=5
Total fuel/Total GT.h (kg/GT.h/1000) 24.6 19.6
Intercept (I) (kg) + Slope (S) (kg/GT.h/1000) I=41;S=18.8
Although according to the current study reefer fuel usage seems to be lower, no firm conclusions can be derived
due to the low number of data samples. The energy consumption of these ships is probably related to ambient
temperature. The EMS data (Hulskotte et al., 2003) were collected during the summer time while data in this
study were collected in autumn.
Table 14 Results of data filtering compared with check on SFOC values
Filter criteria number percentage SFOC OK1 SFOC X1
Deviant 1 17% 0% 100%
Not deviant 5 83% 80% 0%
6
1
When SFOC OC + SFOC X in the same row do not add to 100% alternative explanation for non-deviating
SFOC may be valid. However for clarity reasons this is not accounted.
4.4.7 RoPax ferries When the EMS data (Hulskotte et al.,2003) were re-
analyzed it emerged that of the 10 ships labelled as
As part of this study, passenger ships were split into 'Ferries/RoRo', only three could be considered as
different categories with two RoRo passenger ships RoPax ferries. To get the maximum number of RoPax
being designated as “RoPax ferries”. Data were ferries for the analysis, the data from this study (3
collected from only three RoPax ferries. The study ships) were merged with three selected ships from the
revealed that a large proportion of RoRo passenger EMS project.
ships in fact are pure car carriers (PCC), which were
classified under 'RoRo cargo/vehicle'. In the data
analysis this type of ships was reclassified under the
category “General Dry Cargo” (see 4.4.2).
21INTERNATIONAL SURVEY OF FUEL CONSUMPTION OF SEAGOING SHIPS AT BERTH
Figure 8 Total hourly fuel consumption of RoPax ferries as a function of ship volume
(green=this survey,n=3, blue/green=EMS-data,n=3)
Table 15 Summarized results of fuel consumption of RoPax ferries
Parameter EMS This work
(N=10) (N=6)
Total fuel/Total GT.h (kg/GT.h/1000) 6.9 8.9
Not comparable
Intercept (I) (kg) + Slope (S) (kg/GT.h/1000) I=91;S=7.6
With only six ships in the study, the database of RoPax When actual power was not collected as part of the
ferries is rather weak. Comparison with EMS data is questionnaire, the SFOC calculation for this ship type
further complicated because the ship categories are was performed using an alternative formula.
not the same. For RoPax ferries it is plausible that the
energy consumption rate may be very dependent on
the season; in summer air conditioning may contribute
to the energy consumption of these ships while in [SFOC] = [AEx_fuelatberth_kgperhour] / [AE_totalpower] *
winter space heating may be an important energy [AE1_LF_berth]/[Auxilliary_engines_Number]
consumer.
22The actual power of the auxiliary engine in these cases
was estimated by taking the average power of all
auxiliary engines and multiplying it with the load factor.
Table 16 Results of data filtering compared with check on SFOC values
Filter criteria number percentage SFOC OK SFOC X
Not deviant 3 100% 66% 33%
Two of three SFOC values were in a reasonable range. 4.4.8 Tug and supply ships
The only value that was out of range could be classed
as OK if the average power of the auxiliary engines The category of tug and supply ships is in fact a mixed
was considered. category of all kinds of ships serving various purposes.
As this is a heterogeneous group, results may also
vary considerably. Ships in this category included in
the survey were mostly service vessels that perform
various tasks in the Norwegian offshore industry.
Figure 9 Total hourly fuel consumption of tug and supply ships as a function of ship volume
23INTERNATIONAL SURVEY OF FUEL CONSUMPTION OF SEAGOING SHIPS AT BERTH
It should be noted that within the EMS project data samples are probably representative. It is not
(Hulskotte et al.,2003) only three data samples were clear whether the relationship between GT and fuel
available, whereas the latest study produced 14 new consumption is valid for dedicated tugs.
data samples. For the category of supply ships, the
Table 17 Summarized results of fuel consumption of tug and supply ships
Parameter EMS This work
Total fuel/Total GT.h (kg/GT.h/1000) 9.2 15.6
(other ships)
Intercept (I) (kg) + Slope (S) (kg/GT.h/1000) I=10;S=14.6
Where actual power was not available for tug and The actual power of the auxiliary engine in those cases
supply ships, the SFOC calculation was performed was estimated by taking the average power of all
with an alternative formula. auxiliary engines and multiplying it with the load factor.
[SFOC] = [AEx_fuelatberth_kgperhour] / [AE_totalpower] *
[AE1_LF_berth]/[Auxilliary_engines_Number]
Table 18 Results of data filtering compared with check on SFOC values
Filter criteria number percentage SFOC OK SFOC X
Deviant 6 30% 17% 83%
Not deviant 14 70% 64% 36%
20
Again it can be seen that most of the valid fuel values, whereas most deviant fuel consumption values
consumption values correspond to plausible SFOC have SFOC values beyond a reasonable range.
244.4.9 Summary
Table 19 lists the fuel consumption of all ship types
discussed in the preceding sections (4.4.1 to 4.4.8).
Table 19 Résumé of results of fuel consumption at berth
Ship type EMS This work This work: Regression line
Fuel Coefficient Slope Intercept
(kg/1000 GT.h) (kg/1000 GT.h) (kg/h)
Crude oil tankers 19.3 11.6 16.9 34
Chemical/gas tankers 17.5 14.5 13.8 34
Bulk carriers 2.4 3.1 3.1 7
Container ships 5.0 6.0 4.3 134
GDC/RoRo cargo 5.4 6.1 5.6 18
RoPax ships Mix: 6.9 8.9 7.6 91
Reefers 24.6 19.6 18.8 41
Tug/supply 9.2 Supply: 15.6 14.6 10
As was explained in paragraph 4.4.4 and 4.4.5, the included in this study include cruise ships and cruise
fuel consumption data of crude oil tankers and ferries. This omission was due to the fact that the study
chemical tankers have to be considered as provisional was undertaken outside the regular cruise ship
results. A better understanding of the fuel usage for season. Since the energy consumption of cruise ships
these ship categories would be desirable. is expected to be high, their inclusion in future studies
is considered a matter of importance.
In addition, the fuel consumption of RoPax ships
deserves more attention in the near future. Other
categories of passenger ships that have not been
25INTERNATIONAL SURVEY OF FUEL CONSUMPTION OF SEAGOING SHIPS AT BERTH
4.5 Fuel distribution over degassing procedure is performed in the last phase of
engine types the berthing procedure, when inert gas is produced. It
is possible that the degassing procedures, involving
The information that emerged from the questionnaires the use of boilers, did not take place during the
regarding fuel consumption in boilers was rather interviews and were therefore not recorded. These
limited. For this reason it is not possible to perform explanations may account for the lower boiler fuel
detailed analysis of fuel usage in boilers. usage percentages with respect to the EMS project
(Hulskotte et al.,2003).
Table 20 compares the share of fuel used in boilers of
this study with the results from the EMS project. The results of this project suggest changes for boiler
fuel usage at berth, but questions remain as to their
Table 20 indicates that the amount of fuel used in applicability. On the other hand the new data do not
boilers seems to be considerably lower than results appear to be completely realistic. For the emission
from the EMS study (Hulskotte et al.,2003). Several calculations, a percentage of fuel usage in boilers had
non-verified explanations are possible. One to be assumed as actual data seemed to be absent.
explanation is that ships are no longer allowed to use As a provisional solution, new values that represented
residual fuel at berth. As a consequence, it is possible a compromise between EMS data (Hulskotte et
that the day tank (filled with ready to use residual fuel) al.,2003) and the data gathered in this project are
is kept at lower temperatures. This in turn could mean proposed. Further dedicated research into tanker fuel
lower fuel usage by the boilers. usage in boilers will be necessary to provide better
data.
Another explanation for tankers is that the tank
Table 20 Share of fuel used in boilers
Ship type EMS This work Advice
Crude oil tankers 63% 33% 50%
Chemical/gas tankers 73% 32% 50%
Bulk carriers 36% 10% 10%
Container ships 54% 29% 30%
GDC/RoRo cargo 33% 11% 10%
RoPax ships 32% 0% 30%
Reefers 21% 6% 10%
Tug/supply 1% 0% 0%
26In contrast to the EMS data, the results from the of high quality, and the analysis of the data was
questionnaires indicate that main engines are seldom performed on all questionnaire responses as the
used at berth. Therefore an assumption of zero fuel differences between ship types would probably be
used by main engines at berth should be adopted random.
when calculating emissions.
For the purposes of this analysis, only complete data
from the questionnaires were used, i.e. data where the
amount of fuel, the type of fuel and the sulphur content
4.6 Fuels and sulphur content were recorded. Although this limits the amount of
The information derived from the questionnaires available data, it allows for further analysis.
regarding fuel types and sulphur content was generally
Table 21 Count of ships with answers with high and low fuel sulphur percentage
Engine type Low S (0.1% S) High S%
Main Engine 5 2 29%
Aux Engine1 118 14 11%
Aux Engine 2 37 10 21%
Aux Engine 3 6 7 54%
AE-total 161 31 16%
Boilers 62 4 6%
Table 21 shows that the vast majority of ships follow Some inconsistencies in the questionnaires were
the European Sulphur directive (Directive 1999/32/EC). identified with respect to fuel sulphur percentage and
It also shows that larger ships, with more auxiliary fuel types. When MDO (marine diesel oil) was
engines, seem to use fuels with high sulphur content. recorded as a fuel type, the sulphur percentage was
listed as 0,1 percent or below.
27INTERNATIONAL SURVEY OF FUEL CONSUMPTION OF SEAGOING SHIPS AT BERTH
Table 22Count of ships with answers with certain fuel types
Engine type Low S: High S: High S%
MGO;LSMGO IFO;HFO; MDO;
RMG380-10
Main Engine 4 3 43%
AE1 103 29 22%
AE2 33 14 30%
AE3 4 9 69%
AE-total 140 52 27%
Boilers 66 3 4%
This could indicate a misunderstanding of the word more which is improbable. To calculate SO2 emissions
MDO because the sulphur content of MDO in most the actual sulphur content of fuels must be known. For
cases is more than 0,1 percent. In some other, less the purposed of this analysis, it was assumed that the
frequent, cases when marine gas oil (MGO was sulphur percentages given in the questionnaires were
recorded it was given a sulphur percentage of 0,5% or correct.
28Table 23 Volume weighted average sulphur content of fuels, % S
Engine type Low S (0.1% S) Volume Count
weighted based
Average Average
Main Engine 0.03% 0.98% 0,27% 0,30%
AE1 0.09% 0.95% 0,15% 0,18%
AE2 0.08% 0.93% 0,28% 0,26%
AE3 0.07% 0.96% 0,56% 0,55%
AE-total 0.09% 0.95% 0,19% 0,23%
Boilers 0.09% 0.95% 0,11% 0,14%
Overall volume weighted average 0.19%
To keep the emission calculations simple and values recorded in the questionnaires. In a recent
transparent, it is advisable to assume that 90% of report (Bloor et al., 2013) it was confirmed that ship
MGO is used with an average sulphur content of 0.1 compliance with Directive 1999/32/EC is certainly not
percent and 10% of HFO with an average sulphur 100 percent. Furthermore it is advisable to assume that
content of 1 percent. The weighted average sulphur fuel used in all engines/machinery at berth has the
content then becomes exactly 0.19%, reflecting the same sulphur content.
Groningen Seaports
29INTERNATIONAL SURVEY OF FUEL CONSUMPTION OF SEAGOING SHIPS AT BERTH
5 Consequences of this research for emissions
5.1 Activity data and emission To establish a point of reference calculations were
factors performed on 2008 data, the last year for which data in
the correct format were available. Activity data of ships
Based on the fuel consumption data in Table 19, the at berth in Rotterdam for the year 2008 are presented
distribution of fuel usage between engines and boilers in Table 24.
in Table 20 and sulphur content in paragraph 4.6, new
emission calculations for the port of Rotterdam with the
EMS model for ships at berth have been performed.
Table 24 Activity data of ships at berth in Rotterdam in 2008
Ship type Visits GT (average) Total GT
Oil tankers (crude) 1668 53563 8,93E+07
Other tankers (chemicals, fruit juices) 5619 9412 5,29E+07
Bulk carriers 1044 53332 5,57E+07
Container ships 7207 28365 2,04E+08
General dry cargo (GDC) 6377 3673 2,34E+07
Ferries / RoRo 4048 31038 1,26E+08
Reefers 266 10271 2,73E+06
Other ships 630 4211 2,65E+06
Source: Statistics Netherlands
(Emission factors were taken from Oonk et al., 2003.) sulphur content of fuels of 0,1 percent sulphur for
Emission factors of SO2 and PM10 (Duyzer et al., MGO and 1 percent sulphur for all other fuels (see
2006) were adapted in accordance with the lowered paragraph 4.6).
Table 25 Emission factors for different fuels depending on engine type/machine,(g/kg fuel)
Substance MGO/MDO HFO
BOILER AE3 ME 4
BOILER AE3 ME4
VOC 0,76 2,5 2,7 0,76 2,5 2,7
SO2 21/202 21/202 21/202 20 20 20
NOx 3,5 68 90 4,1 68 90
CO 2 12 13 1,6 12 13
CO2 3173 3173 3173 3173 3173 3173
PM10 0,7 2,1 2,2 1,2 2,5 4,6
1
Marine Gas Oil (MGO), 2 Marine Diesel Oil (MDO), 3 Auxiliary Engine, 4 Main Engine
305.2 Reference emissions RoRo-cargo ships. The old category 'Ferries/RoRo'
contained more than the new category 'RoPax'. The
Comparing Table 24 with Table 19 highlights some old category 'Other ships'” is similarly much broader
mismatches between ship types. The old category than the new category 'Tug/Supply'. Despite these
'Other tankers (chemicals, fruit juices)' is a broader differences in definitions, provisional emission
category than 'Chemical/Gas tankers'. The old calculations using the data from table 24 have been
category 'General dry cargo' is contained in the new performed since no activity data are available for the
category 'GDC/RoRo cargo'”, which now also contains new ship categories.
Table 26 Emissions of ships at berth at Rotterdam based on EMS data (reference), ton/year
Ship type CO2 NOx SO2 PM10 VOC CO
Oil tankers (crude) 153213 1476 416 75 69 274
Other tankers (chemicals, fruit juices) 70486 476 141 23 27 99
Bulk carriers 22049 313 139 13 13 58
Container ships 68110 716 429 35 33 138
General dry cargo (GDC) 10033 147 46 5 6 27
Ferries / RoRo 66015 981 212 36 40 181
Reefers 6612 122 42 5 5 21
Other ships 3562 82 22 3 3 14
Totals 400080 4314 1447 195 196 812
In Table 26 reference emissions are presented for the multiplication of GT with the overall fuel coefficient.
EMS ship categories, which have been calculated with
existing EMS fuel consumption data, existing EMS fuel
distribution data and emission factors presented in
Table 25. Explained in formulas:
Fuel consumption = [Visits] * {[Intercept] + [average
GT/1000] * [Slope]} (formula 1), used for Table 27.
5.3 Emissions based on results of
this study Fuel consumption = [total GT] * [Fuel Coefficient EMS]
(formula 2), used for Table 26.
In Table 27 emissions are presented for the new ship
categories with new fuel consumption data and new Since the categories of ship activity data do not
fuel distribution data. The fuel consumption underlying completely match the new fuel consumption and new
the results in Table 27 is based on a function with non- fuel distribution data, the results are provisional and
zero intercept and slope, and not (as before) by should be used with caution.
31INTERNATIONAL SURVEY OF FUEL CONSUMPTION OF SEAGOING SHIPS AT BERTH
Table 27 Emissions of ships at berth at Rotterdam based on new data (this project), ton/year
Ship type CO2 NOx SO2 PM10 VOC CO
Crude oil tankers 139170 1572 91 55 71 302
Chemical/Gas tankers 70121 792 41 28 36 152
Bulk carriers 29682 577 36 19 22 104
Container ships 74893 1151 88 41 46 212
GDC/RoRo cargo 19508 379 16 12 14 68
RoPax ships 100759 1548 121 55 62 285
Reefers 6125 119 7 4 4 21
Tug/supply 6573 141 6 4 5 25
Totals 446831 6279 406 217 261 1170
Differences 12% 46% -72% 11% 33% 44%
Several reasons exist for the differences in emissions equal in Table 27 compared to Table 26, some NOx
between Table 27 and Table 26. As CO2 emissions emissions are higher. This applies to 'Crude oil
can be considered as a proxy for fuel consumption, tankers', 'Chemical/Gas tankers' and 'Container ships'
the first conclusion from the CO2 emissions is that total and is a result of much more fuel being used by
fuel consumption has risen by only 12%. Although auxiliary engines instead of boilers. Auxiliary engines
RoPax ships are responsible for the greatest increase have much higher NOx, VOC and CO emission factors
of fuel consumption, this increase is probably not (see Table 25). The same trends can be observed in
realistic since a large proportion of Ferries/RoRo visits, VOC and CO emissions.
as presented in Table 24, are more likely to be
'GDC/RoRo cargo' ships. The dramatic decrease of SO2 emissions is solely due
to compliance with the EU regulation (Directive
The increase of CO2 emissions in the category 1999/32/EC), which forbids the use of fuels with a
'GDC/RoRo cargo' is mostly due to the use of the non- sulphur percentage of more than 0,1 percent at berth.
zero intercept. Very small ships do not produce any In the EMS data (Hulskotte et al., 2003) greater
emissions according to formula 2, while many small amounts of HFO and MDO were found to be used at
ships can produce significant emissions according to berth, which explains the much higher SO2 emissions
formula 1. The increase of CO2 emissions in the in Table 26 compared to Table 27.
category 'Tug/Supply' is due to higher fuel
consumption, which may not be completely applicable The differences in PM10 emissions are a balance
to the corresponding category 'Other ships'. Also using between the differences in fuel consumption and the
formula 2 instead of formula 1 has probably resulted in differences in emission factors caused by both the fuel
the increase values reported. type and the engine/apparatus. Auxiliary engines have
higher emission factors than boilers but low sulphur
Differences in NOx emissions have to be compared fuels have lower emission factors than high sulphur
with differences in CO2 emissions. Although CO2 fuels both in engines and boilers.
emissions for some ship categories are lower or almost
326 Conclusions and recommendations
This new survey completed on behalf of the CNSS Since there is still scope to improve the data, a
project and involving several European ports, has dedicated survey of tanker fuel usage is
provided an updated and improved assessment of the recommended. A new study should focus on the fuel
fuel consumption of ships at berth. The data from the usage in auxiliary engines during the entire stay at port
survey has been used to produce a first tentative and all activities that require fuel, such as the role and
emissions calculation. importance of fuel usage in boilers for making inert gas
and other processes (pumping and warming) on
Although differences in fuel consumption by individual board.
ship types have been observed, overall the differences
in fuel consumption are small. This is reflected in the Other ship categories that lack sufficient fuel
fact that total CO2 emissions have not changed much. consumption data are RoPax ships and Cruise ships.
As expected, there has been a profound decrease in Before embarking on a survey of these ships, a
SO2 emissions. Minor quantities of high sulphur fuels literature research on studies about shore based
were still encountered. Emissions of NOx, calculated power supply may provide some insights on their fuel
from the survey results, are substantially higher consumption. Although some fuel may still be used in
because a lower amount of fuel is used in boilers than the boilers, this would not be recorded in this type of
was previously the case. study.
The amount of fuel used in tanker boilers (Crude oil
tankers and Chemical/Gas tankers) turned out to be
quite different to the previous study. Since more data
quality issues occurred for these specific data
samples, it was assumed that a boiler usage value that
lies in between the new data and the existing data. For
all other ship types, except RoPax ships, a boiler
usage value was derived from the new data.
33INTERNATIONAL SURVEY OF FUEL CONSUMPTION OF SEAGOING SHIPS AT BERTH 7 References Bloor, M., S. Baker, H. Sampson, and K. Dahgren, 2013: Effectiveness of international regulation of pollution controls: the case of the governance of ship emissions. Duyzer, J., Hollander, K., Voogt, M., Verhagen, H., Westrate, H., Hensen, A., Kraai, A., Kos, G., 2007. Assessment of Emissions of PM and NOx of Seagoing Vessels by Field Measurements. TNO-report 2006-A- R0341/B Hulskotte, J. H. J., H. A. C. Denier van der Gon, 2010: Fuel consumption and associated emissions from seagoing ships at berth derived from an on-board survey. Atmos.Environ., 44, 1229-1236. 34
Hulskotte, J., Bolt, E., Broekhuizen, D., November 2003. EMS-Protocol Combustion Emissions by Seagoing Ships
                  at Berth (in Dutch). Ministry of traffic and transport

                  Oonk, H., Hulskotte, J., Koch, R., Kuipers, G., Ling van, J., 2003. Emission Factors of Seagoing Ships on the
                  Purpose of Yearly Emission Calculation (in Dutch). TNO-report R 2003/438 version 2
Port of Antwerp

                                                                                                                                  35
SURVEY OF FUEL CONSUMPTION OF SEAGOING TANKERS AT BERTH IN ROTTERDAM
Survey of fuel consumption
of seagoing tankers at
berth in Rotterdam
Compiled by: ir. J.H.J. Hulskotte, TNO and dr. V. Matthias, HZG.
Summary
This report presents the results of an extensive survey of seagoing tanker fuel consumption and associated
emissions in the Port of Rotterdam in July 2013.
The study follows on from an earlier survey by Hulskotte et al., 2013, which indicated that data on seagoing
tankers were inconsistent.
The chief engineers of twenty seagoing tankers were interviewed on board by an experienced ships inspector
who questioned the engineers regarding fuel consumption by the tanker’s equipment during unloading or
loading and during hotelling. Due the excellent cooperation received from the crew, a survey response of 100
percent was attained.
The responses were initially recorded on paper questionnaires and subsequently transferred to MS Excel®
format by the interviewer within one week of the interview.
Together with specific data about fuel consumption, the details of each ship were requested and received in all
cases. Both sets of data, the questionnaire responses and ship details, were initially checked and corrections
made where necessary. Subsequent analysis of the data resulted in renewed recommendations for the
calculation of tankers hourly fuel consumption rates.
The consequences of the fuel consumption recommendations for crude oil tanker emissions in the Port of
Rotterdam were calculated and compared with published results. Finally conclusions about the application of the
results of this survey were added.
36Contents
1 Introduction 39
2 Preparation 39
3 Data collection and validation 40
3.1 Data collection 40
4 Analysis of fuel consumption at berth 41
4.1 Hourly fuel consumption as a measure of emissions 41
4.2 Data validation 41
4.3 Calculation of hourly fuel consumption 43
4.4 Unweighted fuel consumption per type of equipment 44
4.5 Recommendations for the calculation of hourly fuel consumption 49
5 Emissions from tankers in the port of Rotterdam 50
5.1 Activity data and emission factors 51
5.2 Conclusions and recommendations 52
6 References 53
Appendix Inertgas Systems 54
37SURVEY OF FUEL CONSUMPTION OF SEAGOING TANKERS AT BERTH IN ROTTERDAM Acknowledgements We gratefully acknowledge the kind cooperation of the Port of Rotterdam. In particular, the assistance of Martin Pastijn (wachtchef inspectie) was indispensible in the preparation of this project. Inspector Leen de Korte was able to elicit more information than expected due to his easy going but persistent and unflappable character. Inspector Leen de Korte ready to visit one of the tankers 38
1       Introduction

Ports suffer from air pollution not only as a result of     previously, and no credible explanation was provided
ships arriving and departing but also as a result of        to explain the discrepancies. The report recommended
emissions produced by ships during their time at            conducting an additional survey on tanker fuel
berth. A thorough assessment of ship emissions at           consumption.
berth is a crucial first step to understanding the impact
of those emissions on air quality and public health in      This report contains the results of the second survey,
harbour cities. In addition, the impact of abatement        undertaken in July 2013 by a ships inspector
measures such as shore-side electricity and/or              employed by the Port of Rotterdam, on 20 seagoing
restrictions in sulphur content for shipping fuel to be     tankers. Some sections of the questionnaire used in
used in ports must also be understood.                      the 2012 survey (Hulskotte et al., 2013) were modified
                                                            with the berth phase split into two phases—
In 2012 a survey of energy consumption and fuel use         unloading/loading and preparation for
on board 175 seagoing ships was undertaken by the           unloading/loading/leaving. In addition, the questions
Clean North Sea Shipping (CNSS) project. This built on      about the usage of oil-fired boilers were clarified and
work previously undertaken in 2003 (Hulskotte and           new questions regarding inert gas generators were
Denier van der Gon, 2010). The project involved close       added. A copy of the each ship's technical
cooperation with the Ports of Hamburg and                   specification was also requested; this was provided by
Bremerhaven, the Port of Antwerp, the Port of               all ships involved in the survey.
Rotterdam and the Port of Bergen. The results of this
survey were subsequently presented in a report
(Hulskotte et al., 2013). One of the conclusions in the
report noted that the information gathered for tankers
was at odds with data that had been collected

2       Preparation

Before starting the survey the contents of the              discussion, the questionnaire was adapted for usage
questionnaire were discussed with a colleague of the        on tankers.
ships inspector who would be conducting the
interviews. During this discussion the technical            As a final validation, the first author of this report
procedures of unloading and loading of tankers were         visited two tankers to assess the suitability of the
reviewed, with special attention paid to the usage of       questionnaire. In addition, an extract from a technical
steam driven cargo pumps, the production of inert gas       specification for inert gas systems was provided
by oil-fired boilers and inert gas generators and the       (Appendix A), detailing the process of inert gas
crude oil washing (COW) procedures. Concerns were           production and application in tankers.
raised about the inert gas status and overpressure in
the cargo rooms being maintained in all circumstances
to avoid any explosion risk. As a result of this

                                                                                                                  39
SURVEY OF FUEL CONSUMPTION OF SEAGOING TANKERS AT BERTH IN ROTTERDAM
3 Data collection and validation
3.1 Data collection the completion of the survey, the data for each ship
were transferred to MS-Excel® datasheets. In addition,
Twenty tankers at berth in the harbour at the Port of a paper version of the ship's technical specification
Rotterdam (14 crude oil tankers and 6 oil was requested; specifications for all 20 tankers were
products/chemical tankers) were visited in the second received.
week of July 2013 by an experienced ships inspector
employed by the Port of Rotterdam. During each visit, Table 1 provides an overview of the survey,
the purpose of the survey was explained to the captain documenting the ship types and volumes, the cargo
and a formal request for cooperation was made to the and the laytime at berth. The information provided
captain and the chief engineer. In addition a letter shows that dedicated crude oil tankers can generally
written by TNO was given to each captain, which accommodate more volume than oil products and
provided reassurances that any information provided oil/chemical tankers. Table 1 also suggests that there
would be treated confidentially and no data identifying are, at least in some cases, no fundamental restrictions
individual ships would be reported. to transporting crude oil in an oil/chemical tanker and
vice versa (a dedicated crude oil tanker can transport
On board the responses to the questionnaires were an oil product like kerosene).
initially captured on paper and within one week after
Table 1 Overview of ship types, cargo, ships volumes and time at berth in the survey
Shiptype*) Cargo Grosstonnage#) Time at berth (hours)
CRUDE OIL TANKER Ligt Crude 56200 24
CRUDE OIL TANKER Fuel Oil 57100 16
CRUDE OIL TANKER Crude Oil 57100 26
CRUDE OIL TANKER Crude oil 58100 14
CRUDE OIL TANKER Crude Oil 59600 26
CRUDE OIL TANKER Crude Oil 61300 36
CRUDE OIL TANKER Kerosene 61700 48
CRUDE OIL TANKER Crude oil 62300 10
CRUDE OIL TANKER Fuel 62400 26
CRUDE OIL TANKER Fuel oil 62800 60
CRUDE OIL TANKER Russian Blend 63500 28
CRUDE OIL TANKER Crude 83800 38
CRUDE OIL TANKER Fuel Oil 110400 36
CRUDE OIL TANKER Fuel Oil 160300 200+)
OIL PRODUCTS TANKER Crude Oil 26900 24
OIL PRODUCTS TANKER Fuel Oil 43100 30
OIL/CHEMICAL TANKER Crude Oil 13800 22
OIL/CHEMICAL TANKER Nafta 21300 26
OIL/CHEMICAL TANKER Fuel Oil 23200 28
OIL/CHEMICAL TANKER Gasoil 42000 24
Average 59300 29
*)
Ship type as indicated in Maritime Connector #) Gross tonnage rounded on hundreds
+)
Considered as outlier and disregarded in average
404 Analysis of fuel consumption at berth
4.1 Hourly fuel consumption as a possible in most cases by inspecting the ship's
measure of emissions specification, which listed the power and number of
individual auxiliary engines. By combining the
The most generally applicable measure for estimating estimated load factor, also collected in the
ship emissions at berth is probably the hourly fuel questionnaire, with the maximum power of the auxiliary
consumption rate. A measure of energy consumption engine, the actual used power value collected in the
may be less applicable when specific fuel questionnaire could be verified. In 7 of 20 cases the
consumption has been shown to vary considerably. actual used power number given in response to the
Also the time spent at berth may vary widely between questionnaire seemed to be the total power of one
ships and harbours (Palsson et al., 2008). As a result, auxiliary engine. By combining of total power and the
the hourly fuel consumption was initially chosen to be load factors of the auxiliary engines, actual used power
the central focus of the analysis. The fuel consumption could be recalculated for these seven cases. As a
of the boilers and inert gas generators in a tanker is result of this recalculation, the SFOC values reported in
directly related to unloading and loading cargo. A another six questionnaires were subsequently
tanker may remain at berth longer for various reasons considered plausible.
after completing unloading or loading. For this reason,
the current survey split the residence time at berth into Checks on fuel consumption reported in the
two phases (in contrast to previous surveys): questionnaires were less straightforward to validate but
in some cases mistakes were easily identified and
I. Unloading and loading time corrected. Two types of recalculations were applied:
II. Time before actual unloading or loading takes a. If different load factors were given for the two
place and the time after finishing unloading or phases but the reported fuel consumption for
loading before departure both phases was equal, the unreliable fuel
consumption was adapted linearly with the load
factor (3 cases);
4.2 Data validation b. In two cases the reported fuel consumption was
divided by the number of auxiliary engines and
in one case the total fuel consumption of all
4.2.1 Auxiliary engines
auxiliary engines was noted for each individual
Prior to starting the analysis, some data validation auxiliary engine. In these three cases fuel
checks were performed. With respect to the fuel consumption data were corrected.
consumption of the auxiliary engines, these checks
focused on the specific fuel oil consumption (SFOC). The changes in fuel consumption of these six cases
SFOC is calculated as the hourly fuel consumption rate resulted in another six questionnaires reporting
divided by the actual used power. As at least two plausible SFOC-values.
components are involved in calculating the SFOC, both
must be correct if the results are to be reliable. The For one ship the actual used power did not match with
checks revealed that only 7 out of 20 questionnaires total power of the auxiliary engines noted in the ship
reported plausible SFOC values between 0,18 and 0,3 specification and the load factor reported in the
kg/kWh. questionnaire. In this case the actual power was
recalculated with the total power reported in the
The questionnaire asked what the actual used power specification.
was. Independent checks on the responses were
41You can also read