Rural Facilities Survey 2012 - February 2013 - Part of the JSA family - Wiltshire Intelligence
←
→
Page content transcription
If your browser does not render page correctly, please read the page content below

Rural Facilities Survey
2012
February 2013

Maggie Rae, Corporate Director

Part of the JSA family
Rural Facilities Survey 2012                                  February 2013

Report prepared by:
Simon Hodsdon
Knowledge management
Telephone: 01225 718769
Email: simon.hodsdon@wiltshire.gov.uk
www.intelligencenetwork.org.uk

With considerable input from,
Sally Hunter
Matthew Sims

With grateful thanks to all the parish clerks who took part

Page 1 of 47
February 2013                                                                                Rural Facilities Survey 2012

Contents
Introduction ........................................................................................................................ 3
Methodology ...................................................................................................................... 3
Basic facilities..................................................................................................................... 7
Community facilities ......................................................................................................... 12
Communications and media technology ........................................................................... 17
Other facilities .................................................................................................................. 24
Timeline of Rural Facilities and services 1976-2012 ......................................................... 36
Conclusion ....................................................................................................................... 44

                                                                                                                     Page 2 of 47
Rural Facilities Survey 2012                                                 February 2013

Rural Facilities Survey 2012

Introduction
The Rural Facilities Survey (RFS) seeks to ascertain the extent of services and facilities
within the smaller settlements in Wiltshire County. In previous surveys information has
been gathered for a number of settlements within the Swindon borough council area.
However, it was decided that these settlements would no longer be recorded within
Wiltshire Council RFS. The RFS was first undertaken in 1964 and since 1976 has been
carried out at regular intervals – usually every 3 years. This has resulted in a comparative
database for around 229 settlements spanning 36 years.

Methodology

Much of the data for the RFS are gathered by means of a survey sent to parish clerks,
asking for the number of a range of different facilities within each settlement of interest.
The survey questionnaire is intended to remain as consistent with previous surveys as
possible, and has therefore deviated only slightly in content from that used in the previous
RFS in 2008. However, the design of the survey was updated to make completion easier.

From the 324 villages surveyed 10 villages were not accounted for from the responses
sent back by parish clerks. Wiltshire Council staff members were asked if they lived in
these settlements and would be happy to respond on behalf of the settlement. From this
request a further two settlements were reported. Finally, a sight survey was performed at
the remaining eight settlements by a member of the Knowledge management team and
supported by an internet search for details on the settlements. It is important to note that
the survey questionnaire relies on many different individuals for data collection purposes.
A consequence of this is that different interpretations of survey questions can arise. This
can lead to recording disparity within the data, between editions of the survey and within a
single survey year. To try and counteract this within the 2012 dataset a number of quality
assurance measures have been taken.

Page 3 of 47
February 2013 Rural Facilities Survey 2012
To support the survey a number of additional data sources have been employed:
Journey to work data – Wiltshire Council
Community transport data – Wiltshire Community Transport website and Connect2
Wiltshire website
Mobile library data – Wiltshire council website
Location of primary schools – Wiltshire Council
Recycling information – Recyclenow website
Information in location of ATMs – LINK network website
Broadband and mobile communications – SamKnows website and mobile phone
providers websites
Clubs and organisations- Wiltshire clubs and organisations directory
The RFS is intended to cover the facilities of individual consolidated rural settlements. It
therefore excludes towns and urban areas and also very small, dispersed settlements
which do not have a noticeable village focus or centre. While the RFS does not use a strict
numerical criteria for the inclusion and exclusion of settlements, the settlement database
consists mainly of settlements with a population of under 2,500, broadly conforming to the
national standards for small rural communities. The relatively large rural centres of
Downton, Mere, Tisbury and Purton are not included in the RFS as the services in these
areas are traditionally examined as part of the Town Centre Survey.
One particularly important criteria for inclusion or otherwise of a settlement is contiguity; a
village that is contiguous with a larger settlement will generally be excluded from the
survey as it is intended that the survey should focus on freestanding rural communities. On
this basis, Staverton has been excluded from the RFS 2012 following major house building
in the area between Staverton and Trowbridge. This is the only settlement within the
Wiltshire Council area to have been removed from the survey. The settlements within
Swindon Borough Council have also been removed from the survey.
A large number of the villages have been included in the RFS since 1976 and from this
historically continuous list a facilities and services timeline can be drawn. This comparative
dataset holds records for 229 settlements.
Page 4 of 47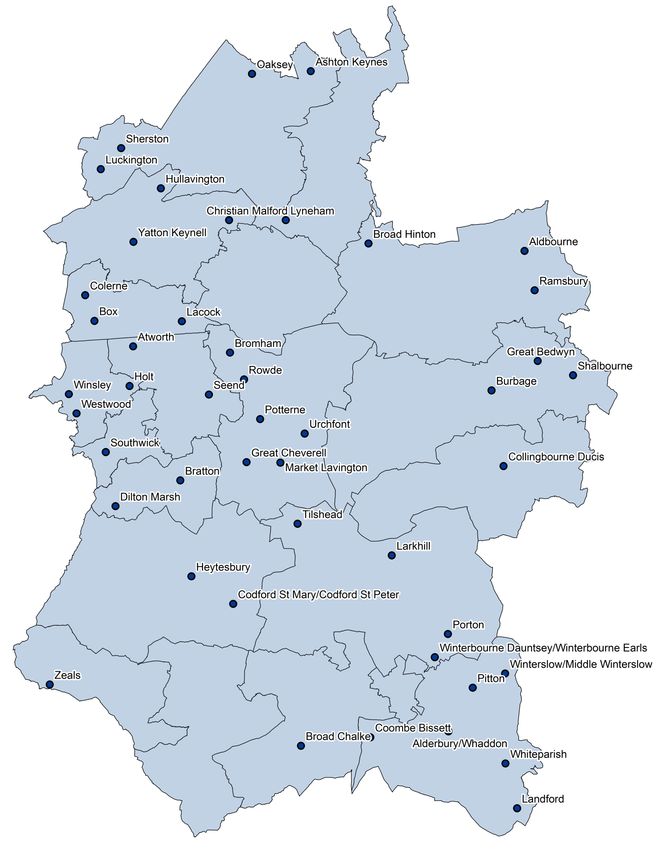
Rural Facilities Survey 2012 February 2013
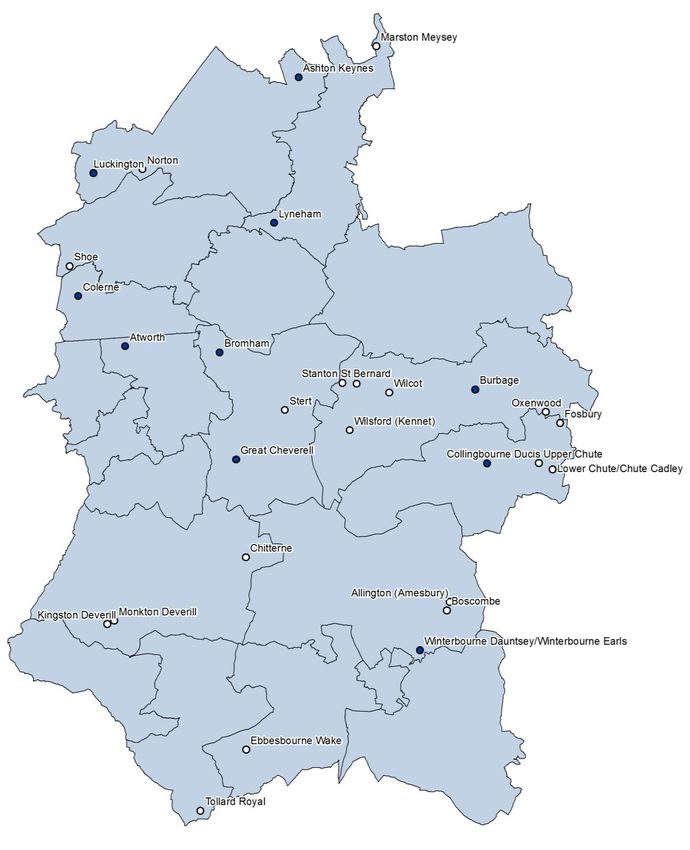
The settlements have been divided into three categories based on population size. Small
settlements can have a population from 1-250. A medium sized settlement requires a
population from 251 to 750. A settlement is defined as large when the population is greater
than 751 but less than 2,500. Table 2.1 shows how many settlements included in this
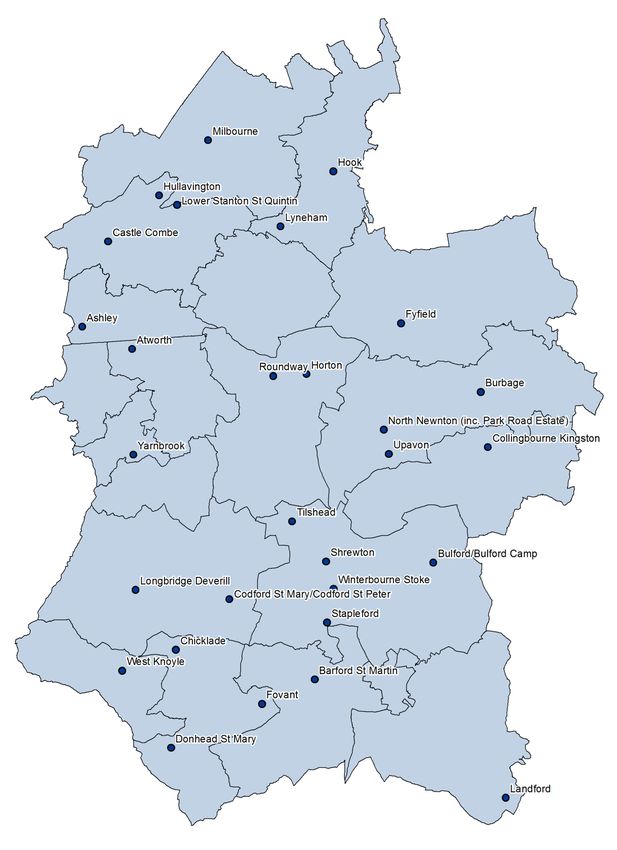
survey fall into a certain category. Figure 2.1 shows the locations of the settlements and
their settlement size.
Table 2.1 Size classification of rural settlements
Settlement Settlement Number of Percent
definition population size settlements (out of total of 324)
Small 1 - 100 83 26%
101 - 250 97 30%
Total Small 1 - 250 180 56%
Medium 251 - 500 72 22%
501 – 750 26 8%
Total Medium 251 – 750 98 30%
Large 751 – 1,000 11 3%
1,001 – 1,250 11 3%
1,251 – 1,500 10 3%
1,501 + 14 4%
Total Large 751 + 46 14%
When looking at settlement size and facilities and services a larger settlement size is often
an indication of a greater number of facilities and services. During this report settlement
size will be described for the majority of facilities and services. Though it is possible to
group the settlements by community area this report has not provided a community area
analysis. This is due to the varying levels of rurality of each community area offering little
equality in comparison. However, a breakdown of each community area can be found on
the intelligence network: www.intelligencenetwork.org.uk/community/.
Page 5 of 47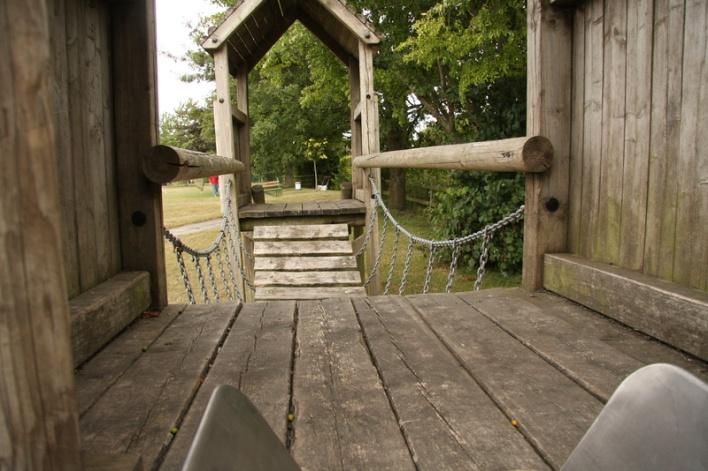
February 2013                                       Rural Facilities Survey 2012

Figure 2.1 Location and size of rural settlements

                                                             Small settlement

                                                           Medium settlement

                                                             Large settlement

                                                                    Page 6 of 47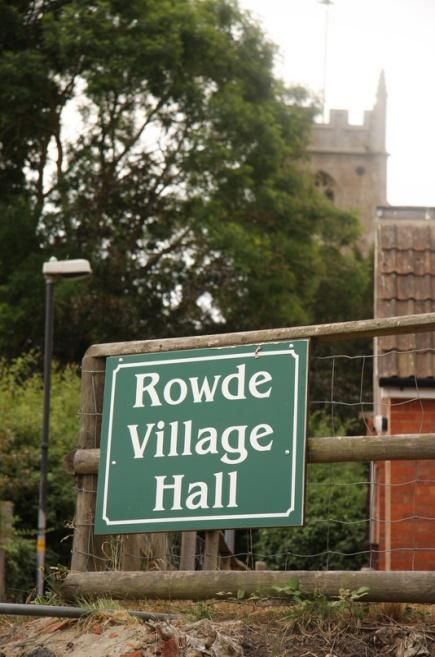
Rural Facilities Survey 2012                                                   February 2013

Basic facilities
There are four facilities that have often been the focus of important planning decisions and
the development of a village. With one exception they have been recorded in the rural
facilities survey since its inception. The four Basic facilities are: a primary school, a shop
selling a range of foods for daily needs, a post office and a journey-to-work public transport
service.

Journey-to-Work Public Transport

To find out if it is possible for an individual from a settlement in the surveyed area to reach
a town to shop or work a software programme called Accession was used. This software
contains all public transport data and is able to calculate the time involved in a journey. In
this survey the software was used to find the most accessible town (from a list of agreed
towns) for each settlement and the level of public transport obtainable for this route.

The destinations selected were based on a job threshold of 2,000 and did not have to be in
Wiltshire. The destinations are: Amesbury, Bradford-on-Avon, Calne, Chippenham,
Corsham, Devizes, Malmesbury, Marlborough, Melksham, Salisbury, Trowbridge,
Warminster, Westbury, Wilton, Royal Wotton Bassett, Swindon, Bath, Frome, Gillingham,
Shaftesbury, Fordingbridge, Romsey, Andover, Hungerford and Cirencester.

The journey started from the centre of the village and could include a walk of no more than
1km from this point. The journey could also include the transport stopping up to 1 km away
from the centre of the destination. The journey could use bus and/or train journeys but
could last no more than 1 hour.

The frequency of service available defines whether the settlement has access to a level of
service that can be included in the basic facilities category. There are two levels that can
be included in the basic facilities definition, Level 1 and Level 2.

A Level 1 service requires that one service departs between 07:00 and 08:00 in the
morning and another between 08:00 and 09:00. A return service must operate both
between 17:00 and 18:00 and between 18:00 and 19:00. A Level 2 service requires that
one service departs between 07:00 and 09:00 and a return service operates between
17:00 and 19:00. The other levels of public transport do not qualify as a basic facility and
have been included in the Other facilities section.

Page 7 of 47
February 2013                                                     Rural Facilities Survey 2012

114 (35%) settlements have a level 1 journey-to-work service, and a further 186 (57%)
settlements level 2 service. Overall 300 (93%) of the settlements have access to a level 1
or a level 2 journey-to-work service.

45 of the large settlements (98%), 94 of the medium settlements (96%) and 161 of the
small settlements (89%) have at least a level 2 journey-to-work service.

Post office

Nearly a quarter of the settlements surveyed have post offices located in them. 18 of these
are independent post offices, and 62 of these are linked with another business, most
commonly a general store.

Eight settlements report the presence of a non-standard form of delivery of Post Office
services. For example Horningsham reported Post office services are available at the
village hall on a Thursday afternoon. Due to the infrequent service provided by these non-
standard services they are not included in the basic facilities definition.

38 of the large settlements (83%), 31 of the medium settlements (32%) and four of the
small settlements (2%) have access to some sort of post office service.

Primary school

Just over a third (34%) of the settlements surveyed has a primary school within them.
Three settlements (Bulford, Rowde and Market Lavington) each have two schools. In total
114 primary schools where found in the surveyed area.

43 of the large settlements (93%), 54 of the medium settlements (55%) and 14 of the small
settlements (8%) have at least one primary school.

General food shop

The survey records 102 general food shops in 88 of the surveyed settlements. This figure
includes mixed businesses where, for example, a local petrol station or Post Office also

                                                                                  Page 8 of 47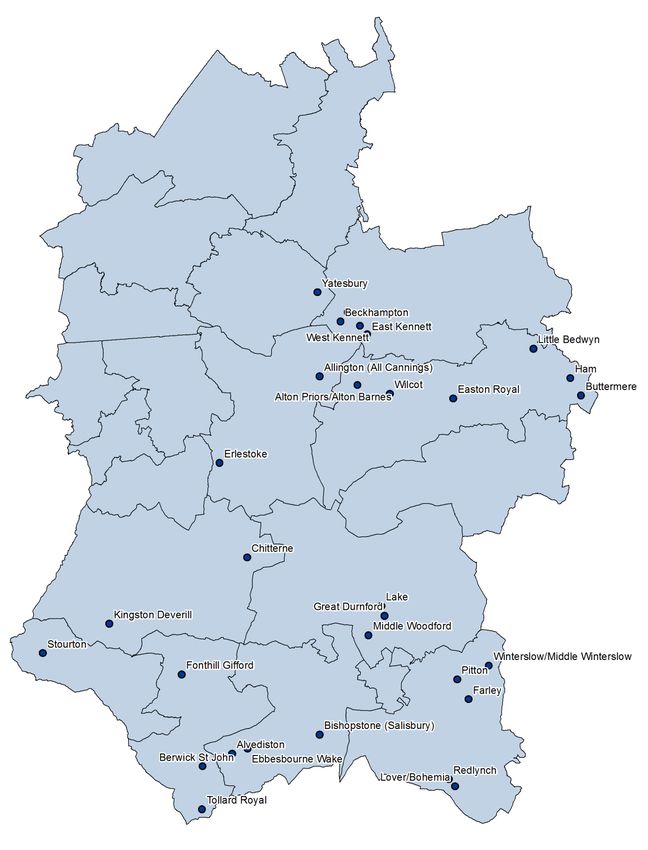
Rural Facilities Survey 2012                                                 February 2013

sells a range of basic foods. In Larkhill it was reported that there where 3 shops where
basic foods where sold.

38 of the large settlements (83%), 36 of the medium settlements (37%) and 14 (8%) of the
small settlements have at least one general food shop. Overall, 27% of Wiltshire
settlements have a general food shop.

Number of Basic facilities

As stated previously the basic facilities often form the focus of important planning
decisions and the development of a village.

In table 3.1 the number of basic facilities by the size of settlement is displayed. For the
purpose of this assessment a single establishment that contains both a shop and a Post
Office has only been counted once.

Table 3.1 Total basic facilities
Number of basic Small                        Medium        Large            All settlements
facilities      settlements                  settlements   settlements
0               17                           2             0                19
1               138                          32            0                170
2               23                           34            11               68
3               2                            27            28               57
4               0                            3             7                10

In total, 67 out of the 324 rural Wiltshire Council settlements (21%) recorded three or four
basic facilities. Two small villages (1%), 30 medium villages (31%) and 35 large villages
(76%) have at last three basic facilities.

Figure 3.1 depicts the villages reporting no basic facilities. These 19 villages appear to be
spread across Wiltshire. A small concentration appears to exist in the middle of Wiltshire in
the Pewsey vale. The villages with 4 basic facilities have also been displayed. Again these
appear to be spread out across Wiltshire.

Page 9 of 47
February 2013                                                Rural Facilities Survey 2012

Figure 3.1 Location of settlements with no basic facilities and 4 basic facilities

                                                                           No facilities

                                                                       4 basic facilities

                                                                            Page 10 of 47
Rural Facilities Survey 2012 February 2013
Summary
Table 3.2 summaries the Basic Facilities results. The 2008 figure has been provided for
comparison and has been adapted to include only the settlements covered in the 2012
survey.
When looking over the basic facilities it can be seen that level 1 and 2 Journey-to-work
was prevalent across all the different settlement sizes and is the most prevalent of the
basic facilities. Further, there has been a 6% increase in service compared to that reported
in 2008. Post Office service was the least prevalent service available and had the lowest
presence in small and medium settlements of any basic facility. The presence of Primary
schools in the survey has remained stable alongside the general food store and Post
Office service.
Table 3.2 Percentage of rural settlements containing basic facilities
Basic facility Small Medium Large All All
type settlements settlements settlements settlements, settlements,
RFS 2012 RFS 2008
Journey-to- 89% 96% 98% 93% 87%
work, Level 1 or
2
Post Office 2% 32% 83% 23% 23%
Primary School 8% 55% 93% 34% 32%
General store 8% 37% 83% 27% 27%
.
Page 11 of 47February 2013 Rural Facilities Survey 2012
Community facilities
This section aims to detail and discuss the numbers of, and levels of access to, community
facilities in rural Wiltshire. This is a broader category than the basic facilities discussed
before, and incorporates a range of what one might think of as ubiquitous and ‘traditional’
village amenities. The category of community facilities comprises eight individual services:
Journey-to-work public transport
Primary school
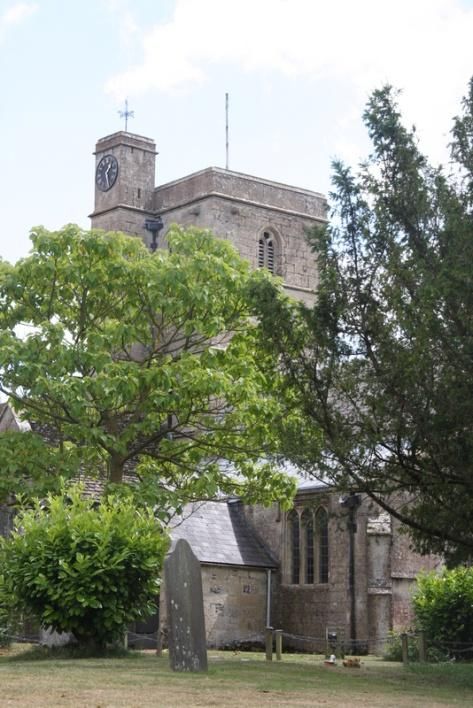
Church/place of worship
Hall where community activities can take place
Food shop (general or specialist)
Post Office
Pub
Recreation field
Churches/place of worship, Public Halls, Public houses and recreational fields will be
discussed in detail in this section. Journey-to-work, primary schools, Post Office and
general food store have been discussed in detail in the previous section.
Churches and Other Places of Worship
Since 1997 this category has included ‘place of worship’. Though traditional church
buildings form the vast majority, the classification is not restricted to them. Of the 328
places of worship 306 were churches.
259 (80%) of surveyed settlements contained a place of worship. 45 of the large
settlements (98%), 86 of the medium-sized settlements (88%) and 128 of the small
settlements (71%) contained a place of worship.
Public Halls
In addition to village halls, other halls available for public use are counted in this category.
These include both school and church halls, which are often available for evening classes
and community events.
Page 12 of 47Rural Facilities Survey 2012 February 2013 222 (67%) of the surveyed settlements contained a hall available to the public. In total, 318 halls were recorded. 24 settlements reported 3 or more public halls. 45 of the large settlements (98%), 82 of the medium-sized settlements (84%) and 95 of the small villages (53%) had access to a public hall. Public Houses 208 settlements contain between them 261 pubs. This means public houses cover 64% of the surveyed area. 8 settlements reported that more than 3 pubs existed within their area. The presence of four pubs where reported in both Bromham and Colerne. 45 of the large settlements (98%), 77 of the medium-sized settlements (79%) and 86 small settlements (48%) contained at least one public house. Recreation Fields Recreation fields represent a particular problem in terms of double counting of facilities. If a recreation field is considered as part of a parish or borders a number of settlements a single facility could be recorded several times by different settlements. To try and counteract this attempts were made to quality assure the reported figures. This was performed by looking at settlements where more than one recreational field was recorded and checking against mapping software. By using this quality assurance method 12 duplicate recreational fields where removed. 170 recreation fields were recorded in 152 (47%) of the settlements. 18 settlements reported 2 recreation fields. 44 of the large settlements, 66 medium sized settlements and 42 small settlements reported having access to at least one recreational field. Specialist Food shops A specialist food shop is one that does not sell a range of foods for daily needs, but rather one particular kind of produce. Greengrocers, bakers and butchers would all be examples of specialist food shops. 20 specialist shops were reported in 19 (6%) of the surveyed settlements. Southwick reported 2 specialist shops. 8 large settlements (17%), 6 medium sized settlements (6%) and 5 small settlements (3%) reported the existence of specialist shop. Page 13 of 47
February 2013                                                      Rural Facilities Survey 2012

Total Community Facilities

The community facilities category was created to assist the 1991 Structure Plan which
required a settlement to have most of the community facilities to be considered for limited
additional housing. Though this policy framework no longer exists, the community facilities
category remains very useful especially when comparing against the previous years. For
the purpose of this analysis a specialist food shop is only counted when a general food
store is not present in the village.

Table 4.1 shows the size and number of settlements with a given number of different
community facilities for 2012 and 2008. The 2008 figure has been provided for comparison
and has been adapted to include only the settlements covered in the 2012 survey.

Table 4.1 Total community facilities
 Number of       Small           Medium          Large           All              All
 community       settlements     settlements     settlements     settlements,     settlements,
 facilities                                                      RFS 2012         RFS 2008
 5               19              17              1               37               45
 6               5               26              5               36               32
 7               1               9               11              21               22
 8               0               17              29              46               37
 5 or more       25              69              46              140              136

When comparing the surveyed area of 2012 against the same settlements surveyed in
2008 it appears that a few more settlements reported containing 5 or more community
facilities. Further, more settlements reported having access to 8 community facilities than
in 2008. These changes are small and could be due to increased accuracy in recording.
Figure 4.1 shows the locations of the settlements with 8 community facilities. From this
map it can be seen that the south west of Wiltshire has very few villages with 8 community
facilities. Similar can be said for the area slightly north west of the centre of Wiltshire.

                                                                                    Page 14 of 47
Rural Facilities Survey 2012 February 2013 Figure 4.1 Settlements with 8 community facilities Page 15 of 47
February 2013                                                 Rural Facilities Survey 2012

 Summary

 Table 4.2 summarises the community facilities results for 2012 and 2008. A place of
 worship appears to have a high prevalence in all the different settlement sizes. Food
 shops do not appear to have a high presence in medium or small villages. When
 comparing 2012 to 2008 an increase can be seen in all the indicators except for public
 houses. All these increases are fairly small and could be partly due to increased accuracy
 in recording.

 Table 4.2 Percentage of rural settlements containing community facilities
Community          Small         Medium         Large         All             All
facility type      settlements   settlements    settlements   settlements,    settlements,
                                                              RFS 2012        RFS 2008
Place         of   71%           88%            98%           80%             77%
worship
Village hall       53%           84%            98%           69%             65%
Public house       48%           79%            98%           64%             64%
Recreation         23%           67%            96%           47%             43%
field
Food        shop   9%            38%            85%           29%             27%
(special     and
general)

                                                                              Page 16 of 47
Rural Facilities Survey 2012 February 2013
Communications and media technology
In the 2008 rural facilities survey an attempt was made to capture broadband access and
speed, mobile phone signal coverage and strength and digital coverage TV. Though digital
TV has not been included in the 2012 survey, effort has been made to provide data
regarding broadband and mobile phone coverage.
Broadband Access
Broadband is a loose term often used to describe a connection to the internet. The
principal form of broadband technology in the UK is ASDL (Asymmetric Digital Subscriber
Line), which provides internet access through the BT telephone exchanges and the
network of copper wire that traditionally carries landline phone signals. Unlike the previous
technology referred to as ‘dial up’, broadband does not take up the whole telephone line
allowing for calls to be made alongside internet browsing.
A growing alternative method of broadband provision in the UK is via a network of fibre-
optic cables. These cables produce faster (though often more expensive) access to the
internet. However, the availability of fibre optic cables is far from universal. Due to this the
measure of broadband has been made solely based on ASDL access.
Another growing method of accessing the internet is through mobile broadband. In a
recent Ofcom report1 it was found that 13% of a surveyed population use mobile
broadband. Mobile broadband offers a truly wireless option of internet access and uses
similar technology to the mobile phone network. However, as mobile broadband is used by
a still small section of the population no detailed analysis will be performed in this report,
though high level mobile phone coverage could be used as an approximation of mobile
broadband coverage.
Broadband Speeds in Rural Wiltshire
Broadband speed is measured in megabits per second (Mbps), which refers to the rate the
electronic data is transferred. A higher ‘bit rate’ (i.e. a higher figure for Mbps) means a
faster data transfer, and some kinds of electronic media (particularly film and audio
content) may not be used if the bit rate is too low.
1
Ofcom Communications Market Report 2012
Page 17 of 47February 2013 Rural Facilities Survey 2012
Two types of speed are discussed in reference to broadband, potential speeds and actual
speeds. Potential speeds refer to the maximum speed achieved on a line during the
course of the testing period. Actual speed refers to the data transfer rate achieved at a
given location at a particular time. To collect potential speed information a broadband
search tool freely available online was used (www.samknows.com). Actual speeds are
more difficult to collect and a recent actual speed figure could not be found for the
surveyed area. Ofcom produce a biannual report2 of national actual broadband speed and
one constant item in every publication is that actual speeds obtainable are much lower
than the potential speeds. Armed with this knowledge we can assume that similar is true
for Wiltshire.
For the surveyed area 80 settlements were recorded as having speeds below 2Mbps. This
included 2 large villages, 16 medium sized villages and 62 small villages. 244 of the
surveyed settlements could potentially achieve broadband speeds of 2Mbps or greater.
114 settlements appear to have an average potential speed of 5Mbps or greater. 32 of the
large villages, 39 of the medium sized villages and 43 of the small villages could achieve
broadband speeds of 5 Mbps or greater. Figure 5.1 shows the settlements with speeds
below 2Mbps across Wiltshire. The map appears to show that these areas are dispersed
over the Wiltshire Council area.
2
http://stakeholders.ofcom.org.uk/market-data-research/other/telecoms-research/broadband-
speeds/?a=0
Page 18 of 47Rural Facilities Survey 2012 February 2013 Figure 5.1 Rural settlements with broadband speeds below 2mbps Page 19 of 47
February 2013                                                  Rural Facilities Survey 2012

Telephone Communications

This heading includes two types of telephone communications, access to public phone
boxes and mobile signal coverage.

Public Phones in Rural Wiltshire

Since 2008 BT have been reducing the number of public phone boxes. This was agreed
by many local authorities although no phone boxes were to be removed when no other
phone boxes are within 400 metres. The most vocal opposition to this proposal has been
the rural areas. The requirement of phone box provision has been claimed by rural areas
due to poor mobile network coverage.

223 (69%) of the surveyed settlements reported the presence of a phone box, 169 of these
offering a full service. In total, 248 phone boxes were recorded. This is a reduction since
2008 when 79% of the surveyed area reported the existence of a phone box.

Mobile Phone signal Coverage and Strength

Mobile phone ownership is fast becoming omnipresent. In a recent Ofcom report3 92% of a
surveyed sample in the UK had a mobile phone. A new generation of mobile phones called
smart phones have started to take over from basic mobile phone models. These phones
offer efficient internet access through a mobile phone. Alongside the advanced handsets
this generation of technology requires a different signal type (often called 3G). To produce
the 3G signal, signal masts (or base stations) need to be updated to produce a 3G signal.
Not all masts in the UK have been updated, so though 2G signal might be obtained by a
mobile phone it does not guarantee a 3G signal can be achieved.

The strength of the signal a mobile phone receives depends largely on location factors
such as local topography, number of mobile phones accessing the network, thickness of
building walls etc. Unlike broadband, mobile phone coverage is provided by five networks
and coverage in an area can depend on the network being used.

3
    Ofcom Communications Market Report 2012

                                                                               Page 20 of 47
Rural Facilities Survey 2012 February 2013 Signal Coverage Data The information available regarding mobile phone coverage is solely provided by the five network providers. It is important to bear this in mind, especially given the fact that the relative level of signal coverage is a point of competition between these companies. The five network providers covered in this survey are T-Mobile, Orange, O2, Vodafone and Three. These networks provide directly or indirectly the provision of nearly all the mobile phone coverage in the UK. Other mobile phone companies (such as Tesco Mobile and Virgin media) use the networks provided by the mobile network companies. While all the networks reportedly aim to show accurate information, they often give caveats with regards to the accuracy. Often reporting the impact of local conditions and the large scale maps provided cannot guarantee service to a particular location. The information provided by the network companies should be classed as a guideline and not a guarantee and the data provided in this survey should be taken in the same way. A single method of reporting signal strength and coverage does not exist. O2 use three 5 point scales (but a three level coloured map) to depict coverage for 2G coverage, 3G and 3G900 (a currently faster version of 3G). For the purpose of this survey 3G900 was not included as few phones have the capabilities to reach this signal. T-mobile and Orange report 2G, 3G and mobile broadband each on a 5 point scale. Vodafone report calls and texts coverage (C&T), Internet and email coverage (Net) and extended internet and email coverage (ENet) each on a 3 or 4 point scale. Finally, Three network provide a two scale map showing outdoor only coverage and an indoor and outdoor coverage. To report mobile phone coverage in this survey each of these scales was converted into one scale. This process is described in part in table 5.1. Coverage level 0 implies that no coverage of any type could be found at the location. Level 1 and 1.5 indicate limited coverage allowing for text messages to be sent and received and that calls can be made however the quality and duration might be hindered. Level 2 provides adequate coverage for basic services to be used and on occasion will be able to allow access to 3G services. Coverage level 2.5 to 3 indicates that basic services should have very little issues in use and that 3G services can be used with limited disturbance. This is a similar scale to that used in 2008 to allow for comparison. Page 21 of 47
February 2013                                                      Rural Facilities Survey 2012

     Table 5.1 Mobile phone coverage scale converter
Mobile         0          1              1.5             2                      2.5               3
phone
network
O2             No         2G=4+4       2G+3G
               coverage                                  2G+3G=>3+3+3+
Rural Facilities Survey 2012 February 2013 Figure 5.2 Rural settlements with below adequate mobile network coverage Page 23 of 47
February 2013                                                     Rural Facilities Survey 2012

Other facilities

A wide range of other facilities are discussed in this section. These facilities provide an
important contribution to the fabric of rural life. This category is by its nature broad and
fluid, and new things can be included as service priorities change. Many of these facilities
have been recorded since the rural facilities survey began in 1976, providing a valuable
resource for time series comparisons. The fluidity offered in this category allows for the
addition of new measures as service priorities change.

To enable analysis of such a broad range of services, they have been grouped into
different categories, including commercial services, mobile services, sports and recreation
facilities, transport services, library services, recycling facilities and health services. Each
of these categories will be discussed.

Specialist shops

This category includes farm shops, tobacconists/newsagents and off-licenses. Other retail
premises that serve settlements are discussed in the commercial services category, or
else are encompassed by the categories of basic food shop and specialist food shop
discussed previously.

Farm shops were reported in 33 of the settlements covered in the survey. Bromham and
Sutton Mandeville were reported to have 2 farm shops. 10 large settlements, 10 medium
sized settlements and 13 small settlements contained at least one farm shop. This is an
increase compared to 2008 which reported 20 farm shops in 19 villages.

36 specialist shops were reportedly spread across 23 settlements in the survey area. 14
large villages, 4 medium sized villages and 5 small villages reported at least one specialist
shop.

Commercial services

This category covers all those commercial services and retail facilities that are not
discussed separately under their own heading.

                                                                                  Page 24 of 47
Rural Facilities Survey 2012 February 2013
It is intended to include only businesses that are provided principally for, and substantially
sustained by, the residents of an area. For example, a hotel would not be included but a
bar or restaurant located in the hotel would be. This distinction can often be difficult to
make. In instances where ambiguity exists a service has been included rather than
excluded. To allow for more detailed analysis this category has been divided into four
sections:
Food-related: including fish and chip shops and other take-aways, cafes and
restaurants
Garage repairs: including independent workshops not allied to a petrol filling
station.
Professional services: including solicitors, dentists, vets and chiropractors
Service trades: a wide category that includes hairdressers, video hire and electric
repairs, dressmakers and photocopying/printing services.
Over half the settlements (66%) surveyed have a commercial service, and several have
more than ten. In total the survey recorded 708 commercial services, in 213 settlements.
In 2008 for the same surveyed area 638 commercial services existed in 54% of the
settlements. 46 (100%) of the large settlements, 74 (76%) of the medium sized
settlements and 94 (52%) of the small settlements contain at least one commercial
service.
Over a third (37%) of the settlements in the surveyed area contained a food-related
commercial service. 178 food related commercial services are spread across 120
settlements; 14 of these have 3 or more. 35 (76%) of the large villages, 45 (46%) of the
medium sized villages and 40 (22%) of the small villages had access to food related
commercial services.
Just over a quarter (27%) of the settlements has a garage repair service. 83 vehicle
garage repairs in 71 locations. Lyneham has 3 garage repair services. 22 (48%) of the
large settlements 29 (30%) of the medium sized settlements and 19 (11%) of the small
settlements recorded the existence of at least one garage repair service.
61 settlements in the survey (19%) reported the presence of a professional service within
them. There are a total of 90 professional services recorded. Six of the settlements have
Page 25 of 47February 2013 Rural Facilities Survey 2012
more than 3 of these services. 19 (41%) of the large villages, 21 (21%) of the medium
sized villages and 21 (12%) of the small villages contained a professional service.
Under half of the settlements (42%) recorded a service trade. A total of 357 services were
reported in 135 settlements. Across this broad category three services appear to have a
much higher presence than the others. The survey reported 41 hair/beauty salons, 31
taxi/private hire services, and 28 cattery/dog kennels. 40 (87%) of the large settlements,
39 (40%) of the medium settlements and 56 (31%) of the small settlements recorded the
presence of a service trade.
Mobile Sales and services
This category aims to include facilities regularly brought to a given settlement, as opposed
to services established in permanent premises at a location within the settlement. A very
wide range of goods and services are provided across the county on this basis.
Four sections exist in the mobile sales and services category basic foods, supplementary
foods, services and supermarket delivery. Basic foods include sales of the more basic
foods such as fruit, vegetables, meat, fish and bread. Supplementary foods include more
ready to eat foods such as fish and chips, frozen foods and soft drinks. Services include
video hire, laundry services and pet food, newspaper and fuel deliveries. A greater attempt
was made to measure supermarket delivery services this year than previously.
Nearly two thirds of the settlements surveyed (61%) are visited by at least one mobile
service. 12 of the settlements reported more than 7 mobile services. 38 (83%) of the large
settlements, 58 (59%) of the medium sized settlements and 94 (52%) of the small
settlements contained some type of mobile service.
Just under half of the settlements (47%) reported the availability of a mobile basic food
service. Milk delivery services were the most prominent service with 133 recorded, 17
settlements report having more than 4 basic food mobile services. 30 (65%) of the large
villages, 50 (51%) of the medium sized villages and 72 (40%) of the small villages have a
basic mobile food delivery.
Mobile supplementary food services visit 51 of the settlements surveyed. Of the total
number of the mobile supplementary food services 58% were mobile fish and chips shops.
Page 26 of 47Rural Facilities Survey 2012 February 2013 22 (48%) of the large villages, 15 (15%) of the medium sized villages and 14 (8%) of the small villages report having a mobile supplementary food service. At least one mobile service trade was available in 42% of the surveyed settlements. 188 services were recorded across the surveyed area. Newspaper delivery was the highest service reported with 122 settlements receiving a delivery. 19 (41%) of the large settlements, 45 (46%) of medium sized settlements and 72 (40%) of the small settlements recorded access to a mobile service. To map available supermarket delivery large supermarkets where approached for data as to their delivery coverage in Wiltshire. Most of the supermarket responses advised that all the information in regards to their delivery service was available via their website. Using the websites available it was possible to map home delivery for four large food delivery services, Sainsbury, ASDA, Ocado and Waitrose. From these sites it was found that all four delivery services could reach 318 of the surveyed settlements and the remaining 6 villages had access to three of these delivery services. Information could not be gained from Tesco. Iceland was able to advise that their deliveries could reach villages within 10 miles of their shops. This implies that the delivery services offered by large food stores and supermarkets could be the most widely spread service available to the rural settlements of Wiltshire. Cash machines (ATMs) and Banks In 2001 banks disappeared from the rural settlements in Wiltshire. As banks and building societies continue to use call-centres and on-line banking to provide their services it is highly unlikely that rural settlements will see a return of the rural branch. The availability of ATMs (Automated Telling Machines, or cash points) has become an important monetary access point for rural communities. However, many rural shops are now offering card payments. This access to funds might in the future become a more important measure of monetary access than currently thought. No attempt was made to measure shop card payments in this survey but it may become an indicator in the future. Cash withdrawals can also be made at Post office branches, along with other banking services. Post office provision is discussed in detail under another section. The survey asked if a local cash point existed and whether it was free to use. To support this data was taken from the LINK network website (www.Link.co.uk). The LINK website Page 27 of 47
February 2013                                                   Rural Facilities Survey 2012

claims to record all of the cash points in the UK. It also provides additional information
such as whether mobile top up is offered and if an ATM charges how much the charge is.

There are currently 45 cash points in 35 of the settlements surveyed. Of these 16 do not
charge and these are spread across 13 of the settlements. Fees for withdrawal at ATMs in
the area ranged from £1 to £2.50.17 large villages, 12 medium sized villages and 6 small
villages contain an ATM.

If the post office counters are included with ATM provision 87 (27%) settlements are seen
to have access to funds. However, ATM access is provided 24 hours of the day but post
office branches have far more restricted opening times.

Public transport services

Public transport services have been divided into six levels. Table 6.1 shows the number of
settlements able to obtain each level. The highest two levels, journey-to-work level 1 and 2
have been discussed in the basic facilities section. The other four service levels are daily
service, weekly, demand responsive and none.

A daily service requires that at least one service runs every day, at least six days a week.
1 large village, 3 medium sized villages and 10 small villages have access to a daily public
transport service. A weekly service requires that at least one service runs per week. Only
two small villages have a maximum weekly service.

A demand responsive service level requires that no other service runs however there is a
request service available to transport a section of the public. This category does overlap
with the community transport demand responsive service measure. However, all public
transport service levels where created using ascension software where as the community
transport data was taken from a number of websites. This has lead to a slight discrepancy
between the two sources. Four small settlements were reported to have access to only a
demand responsive service according to the data provided by the Wiltshire Council
transport team. According to the community transport websites 2 additional settlements
Upper chute and Lower Chute/Chute Cadley have access to only a demand response
service. In table 6.1 we have provided the results as created by the transport team. Only
four small settlements were found to be without a level of public transport.

                                                                               Page 28 of 47
Rural Facilities Survey 2012 February 2013 Table 6.1 Journey to work Public transport level Number of settlements served % of settlements served Journey-to-work, Level 1 114 35% Journey-to-work, Level 2 186 57% Daily service 14 4% Weekly service 2 1% Demand responsive 4 1% None 4 1% Community transport schemes A wide variety of different community transport schemes are available in Wiltshire, provided through many different public, charitable and private organisations and partnerships. They fall into several broad categories: Community Minibus, Group/Community Transport, Demand Responsive Services, Dial-A-Ride services and Link Schemes. Most of the information has been taken from the Wiltshire and Swindon Community Transport website (http://www.wiltshirecommunitytransport.org.uk/) and the Connect2Wiltshire website (http://www.bookaride.net/) and community first have provided further information. In total, 322 (99%) of the surveyed settlements appeared to have access to a type of community transport scheme. Only Buttermere and Fosbury appeared to not have a community transport scheme. When comparing the public transport access and community transport scheme access it can be seen from this survey that Fosbury has neither form of transport available to residents. Community Minibus services are defined as a service that is available to the general public and follows a specific route, although this can change as requested by users. This service includes the Urchfont community bus and the Holt community minibus. 27 (8%) of the surveyed settlements were recorded to be served by five community minibus services. Group/Community transport provides transport to particular groups of people, often the elderly or people with mobility issues. They tend to pick up and deliver users to specific locations. This service includes Malmesbury & District Community Transport and Salisbury shopperbus. 210 (65%) of the surveyed settlements were recorded to be served by a group/community transport scheme. Page 29 of 47
February 2013                                                     Rural Facilities Survey 2012

Demand responsive services follow loose routes but are flexible in response to customer
bookings and they are usually available to the general public. Most of this service is
provided by connect2 lines. A number of these services go direct to hospitals including the
Great Western Hospital service and the Bath Royal United Hospital service. 176 (54%) of
the surveyed settlements were recorded to have access to a demand responsive service.

Dial-A-Ride services are provided for people with mobility difficulties. They operate a door
to door service. Only two services could be seen to operate in Wiltshire the combine bus
and the Swindon dial a ride. 14 settlements were recorded to be covered by the two
services.

Link schemes provide support (including transport) to the elderly, disabled or infirm. There
are many link schemes including Chalke Valley Link, Good Neighbour link and Dauntesy
Vale link. 318 settlements are served by a link scheme. It is the most prevalent community
scheme available.

Petrol filling stations

Due to the nature of rural areas petrol stations do provide an important service to rural
settlements. Only 29 settlements reported having a petrol filling station, 9% of the
surveyed settlements. Many of these offer other services such as food, sweets, and
repairs. 8 (17%) of the large settlements, 8 (8%) of the medium sized settlements and 13
(7%) of the small settlements have access to a petrol station. Figure 6.1 shows the
locations of the petrol stations across Wiltshire rural settlements.

                                                                                 Page 30 of 47
Rural Facilities Survey 2012 February 2013 Figure 6.1 Rural settlements with a petrol station Page 31 of 47
February 2013                                                   Rural Facilities Survey 2012

Health services

The category of Health Services includes doctor’s surgeries, health clinics and
pharmacies, whether independent or associated with a GP. Altogether, 28 of the surveyed
settlements (9%) have at least one of these facilities within them.

The survey recorded 27 doctor’s surgeries in 25 settlements (8%). Colerne and Shrewton
have 2 each. 20 (43%) of the large settlements and 5 (5%) of the medium sized
settlements contained a doctor’s surgery.

The survey recorded 27 health clinics, in 12 settlements (4%). 9 (20%) of the large
settlements and 3 (3%) of the medium sized settlements are visited by a health clinic.

Nine of the doctor’s surgeries have a pharmacy service on site. 6 of these are at large
villages and 3 at medium sized villages. Additionally, 3 large settlements recorded the
presence of an independent pharmacist.

Dentists were reported in only three settlements, Alderbury/Whaddon, Odstock and
Urchfont.

Library services

Library services in rural Wiltshire are provided in established library branches and through
mobile libraries which visit villages according to a schedule. To provide accurate data this
information was taken from the Wiltshire Council website.

Static libraries were shown in six locations. These are Aldbourne, Box, Lyneham, Market
Lavington, Netheravon and Ramsbury. These are all large settlements.

In the Wiltshire Council area four mobile libraries operate a fortnightly route. Mobile
libraries provide a service to 163 settlements in the surveyed area. 43 locations are visited
by the mobile library more than once per route. 38 large villages, 72 medium sized villages
and 53 small villages are visited by a mobile library.

                                                                               Page 32 of 47
Rural Facilities Survey 2012 February 2013 Recycling facilities This survey does not currently include recycling facilities provided by private companies and individuals, only those provided by the local authorities. Data on recycling collections have been submitted by parish clerks, along with details of other mobile services. Supporting information was taken from the RecycleNow website (www.RecycleNow.com), which allows for postcode-based searches of all local recycling facilities. The exact timetables and types of collection varied, but were generally on a fortnightly basis. The principal ‘black box’ recycling schemes collect four basic types of material; paper, cans, glass and textiles and was seen to collect from all settlements surveyed. In addition to the ‘black box’ collection, plastic bottles and cardboard is now collected on the same fortnightly basis. Garden waste is also available for all residents and is collected from the kerbside via an opt-in service. This service is provided fortnightly and can take a large majority of garden waste. In addition to doorstep collections, recycling facilities are provided by a large number of specific centres across Wiltshire. There are broadly two types of facility, Household Recycling Centres and Mini Recycling Centres. There are ten large-scale Household Recycling Centres in rural Wiltshire, three of which are close to rural settlements in the survey. They recycle all the basic materials (paper, cans, glass and textiles) in addition to vast variety of other things, including electrical goods, building waste and tyres. In the 2008 report three large-scale household recycling centres were described as in a surveyed settlement. However, two of these are some distance away from the recycling centre and for this reason have not been classed as in the rural settlement for 2012. Lower Compton was the only settlement classified as having the large recycling centre inside its boundaries. The mini recycling centres recycle a variety of items, depending on location. 80 (25%) of the surveyed settlements were seen to contain a mini recycling centre. Children’s facilities This category includes playgroups and private nurseries for pre-school children as well as children’s play areas. Primary schools are recorded as basic facilities and have been Page 33 of 47
February 2013                                                    Rural Facilities Survey 2012

discussed in the basic facilities section. Alongside the survey, data was taken from the
Wiltshire Council website and requested from the Children and Young people team.

Playgroups are present in 97 (30%) settlements. A total of 104 such facilities were
reported. 41 (89%) of the large settlements, 42 (43%) of the large settlements and 14 (8%)
of the small settlements contain a pre-school playgroup.

45 (14%) of the surveyed settlements were found to have a nursery. There were a total of
49 nurseries. 12 (26%) of the large settlements, 19 (19%) of the medium sized settlements
and 14 (8%) of the small settlements reported the presence of a nursery.

Children’s play areas were recorded in 181 settlements. This covers 56% of the surveyed
area. A total of 225 children’s play areas were recorded. 39 (85%) of the large villages, 82
(84%) of the medium sized villages and 54 (30%) of the small villages contained a
children’s play area.

Sports Facilities

Included under this heading are outdoor sports pitches, indoor sports facilities, outdoor
special activities and sports and social clubs. This covers a whole range of activities,
ranging from sporting to social. However, though recreation fields are an important part of
sports facilities they have been covered in the community facilities section and so have not
been reported here. Additionally children’s play areas have been included in the Children’s
facilities section. The possibility for double counting the outdoor sports pitches was noted
and so mapping software was used to quality assure the existence of a sports field when
discrepancies were seen since the 2008 report.

Outdoor sports pitches were reported in 102 (32%) of the settlements. In total 165 outdoor
sports pitches were recorded. 39 (85%) of the large villages, 36 (37%) of the medium
sized villages and 27 (15%) of the small villages reported an outdoor sports pitch.

98 (30%) of the surveyed settlements reported containing at least one indoor sports
facility. In total, 116 indoor sports facilities were recorded. 39 (85%) of the large villages,
36 (37%) of the medium sized villages and 23 (13%) of the small villages had access to an
indoor sports facility.

                                                                                 Page 34 of 47
Rural Facilities Survey 2012 February 2013 34 settlements reported a special outdoor facility such as a tennis court, a fishing area or a golf course. In total, 41 special facilities were recorded. 14 large settlements, 13 medium sized settlements and 7 small settlements had access to a special outdoor facility. Clubs and Social organisations The sports and social clubs that are available in these rural settlements cover a huge variety of activities. Some are local hobbies, while others are branches of regional, national or international organisations. They provide a measure of the vibrancy of community life in rural Wiltshire. It is possible many of the clubs and societies are shared between neighbouring rural settlements and so there is the potential for double counting. However, as the service would be available to both settlements it was decided to include all clubs reported. This category includes, but is not limited to, Sunday schools, cricket, football, rugby, tennis, badminton, swimming, darts and skittles clubs, keep fit classes including yoga and aerobics, the Women’s Institute, Scouts, Guides, Brownies, Cubs, youth clubs, pony clubs, local history organisations, music and dance groups, gardening and over 60’s clubs, the British Legion and the Young Farmers club. Overall, 1648 clubs and social organisations were recorded in 225 (69%) of the surveyed settlements. 46 (100%) large villages, 85 (87%) medium sized villages and 94 (52%) small villages reported at least one club or social organisation. Sports and keep fit clubs were reported in 57% (183) of the settlements. In total, 601 sports and keep fit clubs were recorded. 45 (98%) large villages, 76 (78%) medium sized villages and 62 (34%) small villages contained a sport and/or keep fit club. Other clubs such as women’s institute, gardening clubs and local history societies were reported in 204 settlements. In total, 1047 other clubs were recorded. 46 (100%) of the large settlements, 79 (81%) of the medium sized settlements and 79 (44%) of the small settlements contained at least one non sports/keep fit club. Page 35 of 47
February 2013                                                      Rural Facilities Survey 2012

     Timeline of Rural Facilities and services 1976-2012
     The rural facilities survey has been preformed every three to five years since 1976.
     Though the settlements included in the survey have changed over this period, 229
     settlements are present in all sample years. This provides an opportunity to compare the
     facilities and services available to these settlements across a 36 year period.

     It should be noted that though each entry is approached by the researcher with care and
     diligence the development of different resources (such as internet search engines) mean
     the accuracy of the survey should be increasing with each edition. This can lead to
     difference between the years that are not based on actually changes but changes in the
     accuracy of recording. The 1991 dataset is missing a number of entries for the settlements
     surveyed that year and so it has been excluded from analysis.

     It is only possible to compare the facilities and services that have been counted across the
     years. This allows for the trend analysis of ‘traditional’ rural village amenities. However,
     new services and facilities may have come into existence since the early surveys that
     perform similar functions as services that may have reduced in prevalence.

     Basic community facilities

     All the basic community facilities have been included in nearly all the previous surveys.
     The exception being 1976 as the software to create Journey-to-work data was not
     available at the time. Table 7.1 shows the number of settlements that contained at least
     one of these basic facilities over the last four editions of the survey.

     Table 7.1 Number of basic facilities during last 4 surveys
Basic facility   Number          of Number         of Number         of Number          of
type             settlements, 2001 settlements, 2005 settlements, 2008 settlements, 2012
General store    90                     77                      76                   80
Journey-to-      186                    198                     204                  215
work, Level 1
or 2
Post office      99                     91                      70                   69
Primary          111                    108                     99                   107
school
All four basic   63                     54                      50                   53
facilities

                                                                                       Page 36 of 47
Rural Facilities Survey 2012 February 2013
Figure 7.1
Basic facilities, 1976-2012
230
Number of settlements with at least one...
210
190
General store
170
150 JTW, level 1
or 2
130 Post office
110 Primary
school
90
70
50
1976 1983 1986 1989 1994 1997 2001 2005 2008 2012
From figure 7.1 it can be seen that most of the basic facilities have fallen since 1976. The
exception to this is the Journey-to-work level 1 and 2 which has risen across the years since
1989. The loss of most of the basic facilities has been considerable. The reduction in post
offices has been the most dramatic over this period.
Page 37 of 47February 2013 Rural Facilities Survey 2012
Community facilities
The community facilities like the basic facilities have been included in each survey since
1976. Table 7.2 shows the number of settlements that contained at least one of these
community facilities over the last four editions of the survey.
Table 7.2 Number of community facilities during last 4 surveys
Community Number of Number of Number of Number of
facility type settlements, 2001 settlements, 2005 settlements, 2008 settlements, 2012
Village hall 183 190 181 192
Place of 207 208 205 207
worship
Public house 179 176 172 171
Recreation 130 134 127 138
field
Figure 7.2
Community facilities, 1976-2012
230
210
Number of settlements with at least one...
190
Village hall
170
Place of
150
worship
130 Public
house
110
Recreation
90 field
70
50
1976 1983 1986 1989 1994 1997 2001 2005 2008 2012
Figure 7.2 shows a relatively stable depiction of most of the community facilities. Places of
worship and public houses have shown a slight reduction over the time period. Village halls
have seen a slow increase and recreation fields have seen a period of decline followed by
an increase in prevalence.
Page 38 of 47Rural Facilities Survey 2012 February 2013
Commercial and retail facilities
Some of the commercial and retail facilities have been included in each survey. These
include specialist shops, petrol stations, general food related shops, mobile sales/services
and personal/commercial services.
Figure 7.3
Commercial and Retail facilities, 1976-2012
250
General food
200
Number of settlements with at least one...
Specialist
shops
150
Mobile sales/
services
100 Petrol station
Personal/
Commerical
50
services
0
1976 1983 1986 1989 1994 1997 2001 2005 2008 2012
From figure 7.3 it can be seen that general food shops, petrol stations and specialist shops
have reduced in prevalence. Mobile sales/services and personal/commercial services
have increased for many years. However, in the last survey they have shown a
considerable decline.
Page 39 of 47You can also read