Assessment Report on the Availability of Oxygen and Biomedical Equipment in Health Facilities
←
→
Page content transcription
If your browser does not render page correctly, please read the page content below
Assessment Report on the
Availability of Oxygen and
Biomedical Equipment in Health
Facilities

City Province of Kinshasa, DRC, Facility Survey Report

April 2021
This report is based on research funded by the Bill & Melinda Gates Foundation. The findings and
conclusions contained within are those of the authors and do not necessarily reflect positions or
policies of the Bill & Melinda Gates Foundation.
The work described in this report was carried out as part of PATH’s COVID-19 Respiratory Care
Response Coordination project, which is a partnership between PATH, the Clinton Health Access
Initiative, and Every Breath Counts Coalition to support country decision-makers in the development
and execution of a comprehensive respiratory care plan to meet the demands of COVID-19. The
project is also pursuing strategies to help prioritize and improve access to oxygen therapy and other
essential equipment involved in respiratory care as an integral part of health systems strengthening,
beyond the pandemic response.
For more information, contact oxygen@path.org.

Mailing Address
PO Box 900922
Seattle, WA 98109 USA
Street Address
2201 Westlake Avenue
Suite 200
Seattle, WA 98121 USA
www.path.org

Suggested citation: PATH. Assessment Report on the Availability of Oxygen and Biomedical
Equipment in Health Facilities: City Province of Kinshasa, DRC, Facility Survey Report. Seattle:
PATH; 2021.
April 2021
Contents

EXECUTIVE SUMMARY ......................................................................................................................... I

BACKGROUND ...................................................................................................................................... 1

Data and demographics ...................................................................................................................... 1

Organization of the health system ..................................................................................................... 1

City/province of Kinshasa .................................................................................................................... 2

SURVEY SCOPE AND SAMPLING ....................................................................................................... 3

Overview ................................................................................................................................................ 3

Data collection methods....................................................................................................................... 5

Study teams ........................................................................................................................................... 5

Limits of the study ................................................................................................................................ 5

RESULTS................................................................................................................................................ 6

Facility characteristics ......................................................................................................................... 6
Services and staffing ............................................................................................................................... 6
Treatment beds ....................................................................................................................................... 7
Infrastructure ........................................................................................................................................... 9

Respiratory care treatment capacity ................................................................................................. 10
Oxygen provision .................................................................................................................................. 10
Oxygen equipment ................................................................................................................................ 11
Ventilators ............................................................................................................................................. 11
Pulse oximeters ..................................................................................................................................... 13
Patient monitors .................................................................................................................................... 16

Oxygen production and supply ......................................................................................................... 17
Overview ............................................................................................................................................... 17
Oxygen concentrators ........................................................................................................................... 18
Oxygen cylinders ................................................................................................................................... 20
PSA plants ............................................................................................................................................ 20
Liquid oxygen tanks .............................................................................................................................. 21
Oxygen consumables............................................................................................................................ 21

CONCLUSION ...................................................................................................................................... 23

REFERENCES ...................................................................................................................................... 24

APPENDIX A. BED COUNTS BY FACILITY AND TYPE .................................................................... 26

                                                                         i
Abbreviations
BMES Biomedical Equipment Survey
CM centre médical [medical center]
CME Centre Mère et Enfant [de Bumbu]
COVID-19 coronavirus disease 2019
CS centre de santé [health center]
DRC Democratic Republic of the Congo
DGOGSS Direction Générale de l’Organisation et de Gestion des Services et des Soins de
Santé [General Directorate for the Organization and Management of Health Care
Services]
ECG electrocardiogram
HGR hôpital général de référence [general reference hospital]
ICU intensive care unit
LPM liters per minute
MOH Ministry of Health
NGO nongovernmental organization
PSA pressure swing adsorption
TVC Tatete Vein Center
WHO World Health OrganizationExecutive summary
In response to the COVID-19 pandemic, PATH, in collaboration with the Democratic Republic of the
Congo (DRC) Ministry of Health, conducted a Biomedical Equipment Survey (BMES) in health
facilities in the DRC from October 2020 to April 2021. This initiative was carried out as part of the
COVID-19 Respiratory Care Response Coordination project, a partnership between PATH, the
Clinton Health Access Initiative, and Every Breath Counts Coalition to support country decision-
makers in the development and execution of a comprehensive respiratory care plan to meet the
demands of COVID-19 cases. The project is also pursuing strategies to help prioritize and improve
access to oxygen therapy and other essential equipment involved in respiratory care as an integral
part of health systems strengthening, beyond the pandemic response.
This report analyzes data from 93 health facilities in the city/province of Kinshasa, collected during the
first round of facility assessments.a The purpose of this work is to quantify existing oxygen delivery
and production equipment, consumables for administering oxygen therapy, and bed capacity, as well
as ascertain facility infrastructure characteristics. The BMES included a mix of public and private
health facilities of multiple levels, including primary (health posts and centres de santé [health
centers]), secondary (hôpitaux général de référence [general reference hospitals]), tertiary (general or
university hospitals), and treatment centers dedicated to COVID-19 / infectious disease treatment.
Intensive care treatment capacity is critical to providing respiratory care to patients with COVID-19
and other respiratory illnesses across disease areas. Data from facility assessments show that
proliferation of critical care services, oxygen, and respiratory care equipment is very limited in
health care facilities in Kinshasa. Only 55% of secondary health care facilities are equipped
with intensive care unit (ICU) beds, and more than one-third of ICU wards lack electricity.
Additionally, 40% of facilities lacked any pulse oximeters, and in the vast majority of facilities
where they were present, the quantity was proportionally low for the number of beds. Only 8
out of 47 facilities with ICU beds had as many patient monitors as ICU beds.
Oxygen supply systems were also limited. Only 2 facilities reported possessing on-site pressure
swing adsorption plants for continuous reliable oxygen delivery to patients. Fully 40% of facilities
indicated they did not offer any oxygen therapy, and the majority of the remaining facilities
that did offer it reported a limited supply of concentrators and cylinders. Only 136
concentrators were reported across the sample of 93 facilities, with most of these devices
located at a small number of larger facilities. Cylinder use was also not widely reported, with few
facilities keeping large stocks of cylinders to provide reliable supply. The reported weekly cylinder
capacity across all surveyed facilities was 277,960 L—equivalent to just 41 type “J” (6,800L)
cylinders.
An immediate next step is to compare the equipment totals with estimated equipment needs for
baseline and COVID-19 scenarios to determine the equipment gap and identify required procurement
needs. This can then be used to advocate to donors, partners, and other decision-makers to inform
policy responses and funding decisions that increase the availability of respiratory care equipment. In
the medium term, the data will be entered into District Health Information Software 2 to be used by
decision-makers. Furthermore, BMES data will inform equitable allocation and redistribution of
equipment to ensure that it is placed in facilities where it can be maximally utilized. It is important to
note that, since data collection was completed in October 2020, additional equipment has been
procured, and this will be taken into account when developing policy and procurement
recommendations.
a
.Data collection in Kinshasa took place in October 2020.
iBackground
Data and demographics
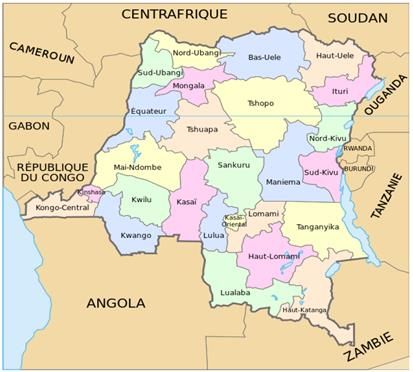
The Democratic Republic of the Congo (DRC) is the
second-largest country in Africa, spanning 2.3 million Figure 1. Map of the Democratic Republic of the
square kilometers.1,2 Located in the heart of Africa and Congo.
straddling the equator, the DRC comprises 26
provinces across two time zones (Figure 1). The
population totaled nearly 90 million in 2020, and the
annual growth rate was 3.2%.2 As of 2019, 45% of
people lived in an urban setting, and 55% lived in rural
areas.3,4 The DRC has had a tumultuous contemporary
history, with two major armed conflicts between 1996
and 2002 and continued latent unrest in the east
(primarily Nord-Kivu, Sud-Kivu, and Ituri Provinces)
and in Haut-Katanga Province.
Social, economic, and health indicators are as follows:
• In 2019, the DRC was ranked 175th out of 189
countries and territories in the Human Development Sources: Creative Commons/Moyogo; Office fédéral
Index and in the bottom one-third with regard to des migrations – Confédération suisse.
quality of health.5 The country has fallen
increasingly behind other sub-Saharan African nations, especially since the 1990s.5
• Gross national income per capita in 2019 was estimated to be US$530.00.6
• In 2018, 76.6% of the Congolese people lived on less than $1.90 a day (the international poverty
line as adopted by the United Nations Development Programme).5
• Infant mortality rate, as reported in 2019, is 66 per 1,000 live births.7
• Life expectancy in 2018 was estimated at 60 years, just below the 61.2-year average for sub-
Saharan Africa.8
Organization of the health system
The country’s health system is organized as a three-level pyramid, with health zones as the
operational base.12 Headed by a chief medical officer, each health zone covers a population of
approximately 100,000 to 150,000.12 Each of the 516 health zones in the DRC are stipulated to be
equipped with a general reference hospital (hôpital général de référence, or HGR), though currently
only about 76% possess one.12 Health zones are further subdivided into health areas which cover
5,000 to 10,000 inhabitants and are stipulated to have a primary health center (centre de santé, or
CS).12 Most recent data suggest that of the 8,504 health areas in the DRC, 8,266 possess a CS.12
The private (for-profit and nonprofit) sector operates roughly 40% of the country’s health care
facilities, including a significant proportion of CSs in Kinshasa.12,13
Challenges within the health sector include equipment shortages and infrastructure that does not
meet national standards. Nearly nine in ten (88%) of CSs have structural/infrastructure issues; only
11,006 (12%) of the 8,266 CSs are constructed of durable materials—and even then, some are in an
advanced state of disrepair.
Public facilities are “largely in a state of disrepair.” Many have little capacity in key areas: fewer than
1 in 100 HGRs has a full laboratory; two out of three have no running water; and fewer than one in
two possesses an X-ray machine.12
Barriers to amelioration of health care facilities include inadequate application of standards, lack of
maintenance and maintenance surveillance units, and noninclusion of maintenance costs in health
care investment projects by government and donors.
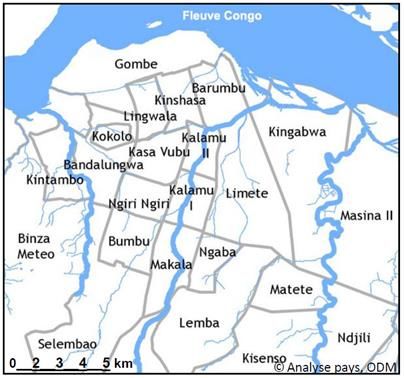
City/province of Kinshasa Figure 2. Map of Kinshasa.
The city/province of Kinshasa (Figure 2) is the capital of the
DRC and simultaneously its most populous city and province,
with an estimated population of 14.3 million in 2020. It is the
third-most populous city in Africa after Cairo and Lagos and the
largest Francophone urban area in the world.9
Economically, Kinshasa has the lowest incidence of poverty
among provinces in the DRC at 25.9% of households and 36.8%
of individuals in contrast to the national incidence of 54.2% and
63.4%, respectively.10 The most recent available estimate for
gross domestic product per capita for Kinshasa is $632.70
(2010).7
Source: Office fédéral des migrations –
Kinshasa is subdivided into 35 health zones. Health care human Confédération suisse.
resources in the city/province remain quite constrained. Per
2013 data, there were 2.2 physicians and 6.8 nurses per 10,000
inhabitants.11 This contrasts with an Organisation for Economic Co-operation and Development
average of 35 physicians and 88 nurses required per 10,000 inhabitants.12
2Survey scope and sampling
Overview
A cross-sectional study was conducted in tertiary-level hospitals, provincial hospitals, HGRs, and CSs
in Kinshasa as part of a nationwide Biomedical Equipment Survey (BMES) of health facilities in the
DRC that ran from October 2020 to April 2021.
The DRC Ministry of Health (MOH) provided PATH with a list of 12,050 health facilities, not including
health posts. A total of 1,343 health facilities were selected from the list using probabilistic random
sampling. Approximately 100 facilities were selected in Kinshasa and 50 on average for each of the
other 25 provinces. Distribution of the exact number of health facilities by province was weighted by
the total number of facilities in each province.
For Kinshasa, 93 facilities contributed data to the BMES. According to the Système National
d’Information Sanitaire (National Health Information System), 1,018 health facilities have been
identified in Kinshasa. This facility assessment covered 9% of the total number (93). Figure 3, Figure
4, and Figure 5 characterize the health facilities in the dataset by facility type, geographic distribution,
and management category.
Figure 3. Facilities surveyed, aggregated by facility type.
60
51 (55%)
50
40
32 (34%)
30
20
10
3 (3%) 3 (3%) 3 (3%)
1 (1%)
0
Primary (health Secondary Tertiary Specialized COVID-19 / Other
post, health (referral hospital) (general/university Hospital infectious
center) hospital) diseases
dedicated
treatment center
3Figure 4. Geographic distribution of facilities.
70
63 (68%)
60
50
40
29 (31%)
30
20
10
1 (1%)
0
Urban Peri-urban Rural
Figure 5. Facilities surveyed, aggregated by management category.
35
32 (34%) 32 (34%)
30
25
20
17 (18%)
15
10 8 (9%)
5
2 (2%) 2 (2%)
0
Government, Government, NGO Religious Private Other
public nonpublic (i.e.,
military)
Abbreviation: NGO, nongovernmental organization.
A summary of the figures is as follows:
• Figure 3 shows that, out of all facilities surveyed, secondary-level hospitals were the most
prevalent in the dataset, followed closely by primary health care facilities. All other facility types
(excluding “other”) were equally represented but comprised a small percentage of the overall total.
• Kinshasa is overwhelmingly urban and peri-urban, with the urban zone covering 600 sq. km (out of
9,965) and 43% of the population.11 Figure 4 shows that, of the total facilities surveyed, 63 were
designated as urban, 29 as peri-urban, and only 1 as rural.
• Figure 5 shows that public government facilities and private facilities make up the majority of
facilities surveyed, at 34% of the sample (32 facilities) each.
4Data collection methods
The World Health Organization (WHO) biomedical equipment for COVID-19 case management
inventory toolb was adapted by PATH for use in the DRC with support from the DRC MOH’s General
Directorate for the Organization and Management of Health Care Services (Direction Générale de
l’Organisation et de Gestion des Services et des Soins de Santé, or DGOGSS) and the DRC’s
National Program for the Fight Against Acute Respiratory Infections. The questions included in the
BMES were informed in part by the WHO list of priority medical devices for COVID-19 case
management.13 The BMES also included additional sections on COVID-19 and malaria, developed by
PATH at the request of the Ministry of Health.
PATH completed data collection in partnership with the DRC MoH/DGOGSS. The study collected
data through interviews with an administrative officer from the critical care department, an
administrative officer from the COVID-19 care unit (if present), a member of the biomedical
engineering department, and a member of the malaria management team at each health facility. In
small facilities, only one person (often a nurse) answered all questions, as they oversaw all aspects of
the facility’s operation.
Study teams
Data collection for the Kinshasa phase of the study was completed over a span of 15 days.
22 physicians, 2 biomedical engineers, and 1 managing director were recruited and trained for four
days as data collectors. The training consisted of two phases: one theoretical and one practical (in a
health facility). The aim of the theoretical was to familiarize the investigators with data collection
techniques and tools. This practical phase identified possible technical and logistical problems, which
were then discussed and corrected. Analysis and report writing were completed by the PATH team
under the supervision of DGOGSS director, Dr. Body Ilonga Bompoko, MD, MPH.
Limits of the study
Data collection for the Kinshasa phase of the study was completed in October 2020. Since then,
additional medical equipment has been purchased to strengthen the DRC’s health system and
COVID-19 response.
For a more comprehensive understanding of health care access and health system development in
the DRC, the 2016–2020 National Health Care Development Plan can be consulted, in addition to this
report.
b
The tool can be accessed at: https://www.who.int/publications/i/item/WHO-2019-nCov-biomedical-equipment-inventory-2020.1.
5Results
This section describes the scope of the facility assessments, key characteristics observed (e.g.,
intensive care unit [ICU] bed counts), and a discussion of other factors that could constrain respiratory
care treatment capacity. Observations on the current availability of oxygen delivery equipment,
oxygen production equipment, and consumables within health facilities are highlighted throughout the
report. Other devices described include ventilators, pulse oximeters, oxygen concentrators, pressure
swing adsorption (PSA) plants, and various types of oxygen masks and airways.c
Facility characteristics
Services and staffing
Services available at the facilities surveyed are detailed in Table 1.
Table 1. Percentage of surveyed facilities providing different services, by facility type.
COVID-19
All Specialized
Primary Secondary Tertiary treatment Other
Service type facilities hospital
(n = 32) (n = 51) (n = 3) center (n = 1)
(n = 93) (n = 3)
(n = 3)
Emergency 72% 50% 84% 100% 67% 100% 0%
Intensive care 40% 22% 45% 100% 33% 100% 0%
Resuscitation* 31% 9% 37% 100% 67% 67% 0%
Internal
89% 81% 98% 100% 33% 100% 0%
medicine
Pediatrics 89% 78% 96% 100% 67% 100% 100%
Surgery 90% 81% 98% 100% 33% 100% 100%
Gynecology 94% 97% 92% 100% 67% 100% 100%
Medical imaging 78% 56% 90% 100% 67% 100% 100%
Medical biology 87% 75% 94% 100% 100% 100% 0%
Other 22% 19% 24% 33% 33% 0% 0%
* Resuscitation and intensive care in health facilities in the DRC are distinct ward types.
As can be seen from the table, fewer than 50% of facilities at the secondary level and very few
facilities at the primary level provide critical care services (intensive care and resuscitation). This
could imply that a shortage of critical care exists in Kinshasa, with patients having to turn to tertiary
facilities.
c
The survey data used to inform these observations can be accessed upon request to PATH at oxygen@path.org.
6Percentage of surveyed facilities with available personnel, by type, is as follows:
• Specialist physician: 75%.
• Generalist physician: 98%.
• Nurse: 99%.
• Caregiver: 44%.
• Other: 10%.
• Staff with experience in basic resuscitation: 60%.
• Staff with experience in medical equipment installation and maintenance*: 35%.
* Only facilities which reported offering oxygen therapy were asked this question.
Treatment beds
Treatment capacity can be greatly constrained by the number of available beds (both general and
ICU). ICU beds are especially important for the treatment of severe and critical COVID-19 cases as
they are needed to provide consistent oxygen therapy at higher flow rates.d ICU bed requirements are
not standardized around the world, and health care worker perceptions about what constitutes an
intensive care bed can vary. In this survey, an ICU bed was defined as a bed capable of providing
mechanical ventilation and/or sustained oxygen for severe acute respiratory illness.e It is critical to
note that even if a bed may be capable of providing mechanical ventilation and/or sustained oxygen, a
facility may not have sufficient ventilators and/or oxygen supply to provide those services to patients.
The total number of beds across all 93 facilities surveyed in Kinshasa was 9,228. Table 2 below
shows summary statistics for the beds by facility type.
Table 2. Average number of beds in surveyed facilities, by facility type.
COVID-19
Specialized
Primary Secondary Tertiary treatment Other
hospital
(n = 32) (n = 51) (n = 3) center (n = 1)
(n = 3)
(n = 3)
Average # of total
35 109 680 50 112 30
beds
Standard deviation 28 144 552 53 85 N/A
There is significant variation in facility bed count within each of the different facility types, as
evidenced by the relatively large standard deviations. For instance, the largest secondary facility,
HGR Provinciale de Kinshasa, reported 1,000 beds, whereas the smallest, Centre Médical (CM) la
Colombe, only reported 15 beds.
Of the 9,228 total surveyed beds, 528 were identified by facilities as ICU beds. Table 3 below shows
the summary statistics for ICU beds by facility type. Just over 50% of facilities reported possessing
ICU beds. Tertiary facilities, on average, held the most ICU beds, followed by COVID-19 treatment
d
WHO defines oxygen requirements as 10 liters per minute for severe patients and 30 liters per minute for critical patients.
e
An additional survey question asking respondents to define ICU bed requirements will be implemented as part of data collection in the remaining
25 provinces.
7centers. Although individual tertiary facilities contain the largest counts of ICU beds, as can be seen in
Figure 6 6 below, the plurality of ICU beds are scattered among secondary facilities.
Table 3. Number of intensive care unit (ICU) beds, by facility type.
COVID-19
All Specialized
Primary Secondary Tertiary treatment Other
Facilities hospital
(n = 32) (n = 51) (n = 3) center (n = 1)
(n = 93) (n = 3)
(n = 3)
# (and %) of
facilities 47 10 28 3 2 3 1
reporting ICU (51%) (31%) (55%) (100%) (67%) (100%) (100%)
beds
Average # of
ICU beds in
6 1 5 45 1 21 10
facilities
reporting them
Figure 6. Total ICU bed counts, by facility type.
8% 52% 26% 1% 12% 2%
41 275 135 4 63 10
0% 10% 20% 30% 40% 50% 60% 70% 80% 90% 100%
Percentage of Surveyed ICU Beds
Primary Secondary Tertiary Specialized Hospital COVID-19 Treatment Center Other
Of surveyed ICU beds in Kinshasa, 54% are in public government facilities (see Figure 7). It is critical
to note that, of the 284 ICU beds in public government facilities, 125 (44%) are located in 2 tertiary
facilities (Cliniques Universitaires de Kinshasa and Hôpital du Cinquantenaire), with the remaining
159 split between 16 lower-level facilities. This underscores that there are limited public options for
intensive care in the city/province of over 14 million.f
f
Bed counts by facility are available in Appendix A.
8Figure 7. Total ICU bed counts by facility management.
54% 5% 2% 13% 26% 1%
284 28 8 66 139 3
0% 10% 20% 30% 40% 50% 60% 70% 80% 90% 100%
Percent of Surveyed ICU Beds
Government, public Government, nonpublic (i.e., military) NGO Religious Private Other
Abbreviation: ICU, intensive care unit; NGO, nongovernmental organization.
Infrastructure
While bed counts are extremely important for evaluating health facility treatment capacity, several
additional characteristics can impact effective provision of care. For instance, ICU beds that rely on
piped medical oxygen can be constrained by the number of wall units installed in the ward. Other
limitations that influence treatment capacity include type of electricity source, ability to provide power
to multiple wards, and the variety and number of clinical staff. Where these constraints are an issue, it
is especially important to have reliable alternative oxygen sources and medical devices readily
available, such as bedside cylinders, ventilators, and oxygen concentrators.
Key findings related to facility infrastructure characteristics are as follows:
• A total of 88 of the 93 facilities assessed (95%) report having access to running water.
• 91 of the 93 surveyed facilities (97.8%) report central grid access, either on its own or with
additional power sources, such as solar panels and/or generators.
• 7 of the 93 facilities (7.5%) report having a VSAT (very-small-aperture terminal) signal, a locally
relevant measure of Internet access.
The breakdown of electricity source type for surveyed facilities is as follows:
• Central electricity, generator, and solar panel: 18%.
• Central electricity grid and generator: 47%.
• Central electricity grid and solar panel: 13%.
• Central electricity only: 20%.
• Generator only: 2%.
Additionally, 81 (87%) of facilities had laboratories, albeit only 55 (59%) reported electrified
laboratories. Similarly, 67 (72%) of facilities reported providing emergency services, but only 44
reported electrified emergency wards (Figure 8).
9Figure 8. Wards by electrification status.
90
80
70 26
40
60
23 32
50
40
30 14 55
8
20 44 44 41
10 23 21 25
0
Emergency Intensive Resuscitation Surgery Neonatology Laboratory Imaging
Care
Facilities with Electrified Ward Facilities with non-Electrified Ward
Electrification of wards is a serious concern for many facilities in Kinshasa. For example, 38% of
reported intensive care wards and 28% of reported resuscitation wards lack electrification, which
could be a serious impediment to appropriately operating biomedical equipment like oxygen
concentrators.
Respiratory care treatment capacity
Oxygen provision
The overall provision of oxygen among surveyed facilities in Kinshasa is limited. Only 56 of the 93
facilities assessed (60%) reported use of oxygen. Figure 9 9 below shows that 13 of 47 facilities
(28%) with ICU beds (7 primary facilities, 5 secondary facilities, 1 specialized hospital) reported no
provision of oxygen therapy. This highlights that even if a facility may have beds set up for critical
care, it may not have oxygen to treat patients.
10Figure 9. Number of facilities with intensive care unit beds, by oxygen therapy provision and facility type.
50
45
40 13
35
30
25 5
20
34
15
23
10
7 3
5 1 1
3 3 1
0
All Facilities Primary Secondary Tertiary Specialized COVID-19 Other
Hospital Treatment
Center
Facilities providing oxygen therapy Facilities not providing oxygen therapy
Only 11 facilities reported piping infrastructure for oxygen, further underscoring the overall limited
access to oxygen in health care facilities in Kinshasa.
The breakdown of surveyed facilities regarding piped oxygen is as follows:
• No provision of oxygen therapy: 40%.
• No piping: 48%.
• Oxygen only: 7%.
• Oxygen, air, and vacuum: 3%.
• Oxygen and air: 2%.
Oxygen equipment
Existing functional and nonfunctional respiratory care equipment of various device types was
quantified, including ventilators, pulse oximeters, and patient monitors. Data on other respiratory care
equipment—such as continuous positive airway pressure, suction devices, high-flow nasal cannula,
and resuscitation devices—are available from PATH upon request.
Ventilators
Ventilators pump air with supplemental oxygen into patients’ airways in cases of severe respiratory
distress, during which they are unable to breathe on their own. Ventilators require intubation. These
devices are often key components of ICU beds. Facilities were assessed for three types of ventilators:
transport/portable, adult intensive care, and pediatric intensive care. Ventilators are in shortage in
medical facilities in Kinshasa. Only 15 of 93 facilities (16%) reported possessing ventilators. Critically,
34 facilities possessing ICU beds reported zero ventilators. Figure 10 quantifies reported ventilators
11by type and functionality, and Table 4 shows the distribution of ventilators across the 15 facilities in
Kinshasa that possess them. All current facilities with ventilators reported offering oxygen therapy.
Figure 10. Ventilators by type and functionality.
60
53
50
40
30
30 26
20
11
10 7
2
0
Portable/Transportable Adult Intensive Care Pediatric Intensive Care
Functional Non-Functional
Table 4. Distribution of ventilators in Kinshasa, by facility.
Staff trained Total #
Total #
# ICU in basic non-
Facility name Type Management functional
beds resuscitation functional
ventilators
practices ventilators
HGR Provinciale de
Secondary Government 13 Y 2 0
Kinshasa
Centre Hospitalier la
Secondary Religious 0 Y 1 0
Borne
Clinique Effort Primary Private 2 Y 3 0
Clinique Riviera Primary Private 0 Y 1 1
Centre Hospitalier
Secondary Private 5 Y 8 14
Nganda
Ngaliema Medical
Secondary Private 6 Y 14 0
Center
Specialized
TVC Medical Private 2 Y 5 0
hospital
Voici l'Homme
Secondary Private 12 Y 2 0
Hospitalier
Clinique Ngaliema Secondary Government 5 Y 1 2
Cliniques
Universitaires de Tertiary Government 25 Y 10 3
Kinshasa
Hôpital du
Tertiary Government 100 Y 15 0
Cinquantenaire
Hôpital de l'amitie
Secondary Government 8 Y 2 0
Sino-Congolaise
COVID-19
CM de Kinshasa Private 13 Y 29 0
treatment center
COVID-19
CM Diamant Private 5 Y 11 0
treatment center
COVID-19
HJ Hospitals Private 45 Y 5 0
treatment center
Kinshasa total 109 20
Abbreviations: CM, centre médical; HGR, hôpital général de référence; ICU, intensive care unit; TVC, Tatete Vein Center.
12The intensive care ventilator for adults was the predominant type across surveyed facilities, followed
by transport/portable ventilators. When comparing total ventilators to total ICU beds across all 93
facilities, only 109 functional ventilators were reported for 528 ICU beds—well below standard.
Furthermore, there was unequal distribution across health facilities as 3 facilities (CM de Kinshasa,
Hôpital du Cinquantenaire, and Ngaliema Medical Center) held 53% (58) of the functional ventilators.
As well, although most of the 15 facilities reported fewer ventilators than ICU beds, 5 private facilities
(Centre Hospitalier Nganda, Ngaliema Medical Center, Tatete Vein Center Medical, CM de Kinshasa,
and CM Diamant) possessed more ventilators than ICU beds.
In addition, 20 nonfunctional ventilators were reported. As shown in the table above, Centre
Hospitalier Nganda (which has a bed capacity of 100 general beds and 5 ICU beds) reported 14
nonfunctional ventilators (70% of the total). “No funds for maintenance” was the primary reason cited
for ventilators’ being nonfunctioning. Cliniques Universitaires de Kinshasa and Clinique Ngaliema also
reported “no funds for maintenance,” as well as “no spare parts” as reasons for nonfunctional
ventilators.
Pulse oximeters
Pulse oximeters are key to providing timely diagnosis of hypoxemia (low levels of oxygen in the blood)
and are extremely important for safe administration of oxygen therapy across various applications,
including but not limited to COVID-19 treatment, surgery, pediatric and adult pneumonia treatment,
and neonatal care. Ideally, oxygen therapy is always administered with pulse oximetry; therefore, it is
useful to compare pulse oximeter quantities to bed counts and other respiratory care equipment
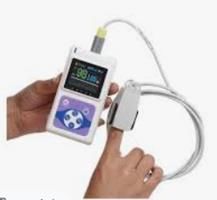
counts. BMES respondents reported use of three types of pulse oximeters: tabletop, handheld, and
fingertip (Figure 11).
Figure 11. Pulse oximeters: tabletop, handheld, and fingertip, respectively.
Pulse oximeters are in shortage across medical facilities in Kinshasa. Only 56 facilities (60%) reported
possessing any. Additionally, 13 facilities which reported use of oxygen therapy had no pulse
oximeters. A total of 402 functional oximeters were reported across the surveyed facilities, with
fingertip being the most common (Figure 122).
13Figure 12. Surveyed facilities’ reported availability of pulse oximeters, by type and functionality.
250
209
200
150
98 95
100
50 24
2 4
0
Tabletop Handheld Fingertip
Functional Non-Functional
The histogram below (Figure 13) shows the distribution of facilities by pulse oximeter functionality per
bed. Only 1 facility, CM de Matonge, a private eight-bed facility, reported having as many pulse
oximeters as beds.
Figure 13. Number of facilities by functional pulse oximeters per bed.
40 37
35
29
30
25
20
13 14
15
10
5
0
No Pulse Oximeters >0 - 0.05 >0.05 - 0.1 >0.1
Pulse oximeters per bed
Figure 144 below highlights the stark difference in availability between public government facilities (in
green), which had an average of 0.03 devices per bed, and private facilities (in beige), which had an
average of 0.09 devices per bed. Additionally, while all facility types have a shortage of devices,
tertiary facilities have the least number of devices proportional to their bed counts.
14Figure 14. Distribution of functional pulse oximeters, per bed by facility type.
Maximum
3rd Quartile
Mean
Median
1st Quartile
Note: “X” position indicates average number of devices per bed; “n” equals number of facilities for each facility category.
Pulse oximeter counts also fell short when compared to total ICU bed counts (528), pointing to an
unmet need for these devices in intensive care (see Figure 15). For example, 14 facilities with ICU
beds reported zero pulse oximeters. Data on individual facilities can be made available from PATH
upon request.
Figure 15. Number of facilities by functional pulse oximeters per intensive care unit (ICU) bed range.
20 19
18
16
14
14
12
12
10
8
6
4
2
2
0
No Pulse Oximeters >0 - 0.5 >0.5 - 1 >1
Pulse oximeters per ICU bed
Note: n = 47 facilities reporting ICU beds.
In total, 30 nonfunctional pulse oximeters were reported, of which 24 were fingertip. Voici l’Homme
Hospitalier reported 36% of the total nonfunctional devices. Reasons reported by facilities were “no
spare parts,” “no consumables” (cables, sensors), and no distributor in-country.
15Patient monitors
Similar to pulse oximeters, patient monitors provide important information on patient vitals, which is
needed to deliver oxygen therapy effectively. They are critical pieces of equipment for ICUs. The
types surveyed were monitors with and without integrated electrocardiogram (ECG). Figure 16
summarizes the patient monitors reported by surveyed facilities by their type and functionality status.
Monitors with ECG were far more prevalent in health facilities than those without ECG.
Figure 16. Patient monitors in surveyed facilities in Kinshasa, by type and functionality.
250
218
200
150
100
50 35
20
3
0
With ECG
Functional Nonfunctional
Abbreviation: ECG, electrocardiogram.
A total of 32 facilities (34%) in Kinshasa reported possessing functional patient monitors. Notably, 26
of 47 facilities with ICU beds reported possessing no functional patient monitors. In the remaining 21,
there was on average of one functional patient monitor per ICU bed (see Figure 17).
Figure 17. Functional patient monitors per intensive care unit (ICU) bed.
30
26
25
20
15
10
10 8
5 3
0
No Patient Monitors >0 - 0.5 >0.5 - 1 >1
Patient monitors per ICU bed
Note: n = 47 facilities reporting ICU beds.
16Similar to pulse oximeters, distribution of patient monitors per ICU bed by facility type (Figure 18)
showed that private facilities tended to have more functional monitors proportional to their ICU bed
count than public government facilities. Additionally, tertiary facilities had on average the least number
of monitors proportional to bed counts. These findings demonstrate a clear and vast unmet need for
patient monitors across facilities.
Figure 18. Distribution of functional patient monitors per bed, by facility type.
Note: “X” position indicates mean number of devices per bed; “n” equals number of facilities reporting ICU beds for each facility
category.
A total of 38 nonfunctional patient monitors were reported among surveyed facilities. Three facilities
accounted for 79% of these nonfunctional monitors, Hôpital de l’Amitie Sino-Congolaise (40%),
Clinique Ngaliema (26%), Centre Hospitalier Nganda (13%). Reported reasons for their being
nonfunctioning included “no spare parts,” “no consumables,” and “no funds for maintenance.” Bringing
these devices back to functionality would be an important start to improving provision of these critical
devices.
Oxygen production and supply
Overview
This subsection summarizes BMES data on equipment that can produce oxygen for patient care. This
includes oxygen concentrators and PSA plants, which can purify atmospheric oxygen for medical use,
as well as oxygen cylinders, which store medical oxygen.
Access to oxygen is limited in the surveyed facilities, with only 58% having some sort of oxygen
production or storage equipment. At the primary level, a mere 25% of surveyed facilities had oxygen
equipment. Furthermore, PSA plants are limited to two surveyed facilities, thus leaving the vast
majority of facilities reliant on cylinders and concentrators. Oxygen is essential not only to the
provision of critical care but also to many other applications, including surgery and maternal care.
Table 5 below summarizes the availability of oxygen equipment in the surveyed facilities.
17Table 5. Availability of oxygen by facility type.
COVID-19
Facility Specialized
Primary Secondary Tertiary treatment Other Total
characteristic hospital
center
Facility count 32 51 3 3 3 1 93
Facilities with
oxygen 8 (25%) 37 (73%) 3 (100%) 2 (67%) 3 (100%) 1 (100%) 54 (58%)
resources (%)
Facilities with
oxygen
6 (19%) 25 (49%) 2 (67%) 2 (67%) 3 (100%) 0 (0%) 38 (41%)
concentrators
(%)
Facilities with
oxygen 5 (16%) 23 (45%) 1 (33%) 1 (33%) 2 (67%) 1 (100%) 33 (57%)
cylinders (%)
Facilities with
0 (0%) 1 (2%) 1 (33%) 0 (0%) 0 (0%) 0 (0%) 2 (2%)
PSA plant (%)
Abbreviations: PSA, pressure swing adsorption.
Oxygen concentrators
Oxygen concentrators produce medical oxygen from atmospheric air. They are an inexhaustible
source of oxygen, assuming proper and routine maintenance and availability of needed consumables
and delivery devices (such as masks and tubing). WHO recommends high flow rates for severe and
critical COVID-19 patients (upward of 10 liters per minute [LPM]).14 Oxygen provided at lower flow
rates is critical for treatment of respiratory distress and other illness. Figure 19 below shows the
various flow rates of functional and nonfunctional concentrators in the facilities surveyed.
18Figure 19. Oxygen concentrators in surveyed facilities in Kinshasa by type, by functionality.
90
79
80
70
60
50
40 37
30
21
20 17
10
1 0 2 0 1 0
0
3 LPM 5 LPM 8 LPM 10 LPM >10 LPM
Functional Nonfunctional
Abbreviation: LPM, liters per minute.
Health facilities in Kinshasa have a severe shortage in oxygen concentrators. For 528 ICU beds and
9,228 total beds, a total of only 136 functional oxygen concentrators were reported. Only 38 facilities
(41%) held concentrators, and only 11 of those facilities owned high-flow concentrators with 10 LPM
or greater flowrate capacity—flowrates potentially necessary to treat COVID-19 patients. Among the
47 surveyed facilities with ICU beds, 11 reported owning no oxygen concentrators.
Oxygen concentrators were far more prevalent in a select few facilities, with 32% (43) of the reported
concentrators in just 3 facilities (see Figure 20): Ngaliema Medical Center (15%), Hôpital Saint Joseph
(10%), and Centre Hospitalier Roi Baudouin Premier (7%). These same facilities also carry 60% of
the reported high-flow concentrators (≥10 LPM). Whether patients are being referred or not to these
facilities for oxygen therapy is unclear.
Figure 20. Distribution of functional oxygen concentrators.
20, 15%
13, 10%
93, 68% 10, 7%
Ngaliema Medical Center Hospital Saint Joseph
Centre Hospitalier Roi Baudouin Premier Other facilities
A total of 22 nonfunctional concentrators were also reported across all facilities. The primary reported
reasons for their being nonfunctioning included “no spare parts,” “no consumables,” and “no funds for
maintenance.” Bringing these nonfunctional devices up to functional status would provide much
needed additional respiratory care capacity.
19Oxygen cylinders
Oxygen cylinders are metal canisters that must be refilled regularly and delivered to health facilities by
an oxygen supplier. They need minimal maintenance and no electricity, making them a suitable
oxygen source in some settings with poor infrastructure. However, like other oxygen delivery and
production devices, they are dependent on availability of oxygen consumables, such as refills, masks,
tubing, and cylinder assembly units to facilitate oxygen delivery. Table 6 shows the total quantities of
cylinders by size and connection type across the 93 facilities surveyed in Kinshasa.
Table 6. Oxygen cylinder sizes and connection types.
Size, connection type Total # From the dataset, it was observed that size “D” cylinders
were most often used across Kinshasa health facilities,
“D” (120 L), pin-index 350
particularly the 120 L pin-index and 340 L bullnose. Size
“D” (340 L), pin-index 20 “J” (6,800 L) pin-index cylinders were reported as the next
“D” (340L), bullnose 316 most common. Very few facilities in the dataset reported
buying more than one cylinder size. For example, the
“E” (680 L), pin-index 0
facilities reporting the largest numbers of cylinders
“E” (680 L), bullnose 0 consumed per week were CM de Kinshasa, Clinique
“F” (1,360 L), pin-index 0 Ngaliema, and HGR Provinciale de Kinshasa. All three
reported consuming an average of 100 cylinders per week
“F” (1,360 L), bullnose 2
and using only one kind of cylinder. Reported total costs
“G” (3,400 L), pin-index 3
per week for cylinders were different between the
“G” (3,400 L), bullnose 4 3 facilities, with CM de Kinshasa and HGR Provinciale de
“J” (6,800 L), pin-index 14 Kinshasa paying on average $1,500 per week and Clinique
Ngaliema paying $1,000. More data points on pricing
“J” (6,800 L), bullnose 0
would be helpful to better understand costs for cylinder
Note: Total weekly cylinder capacity =
procurement.
277,960 L (41 “J” cylinders).
Cylinder manifolds allow oxygen to be piped to various wards. They can hold multiple cylinders and
switch from depleted to full cylinders to maintain a steady oxygen flow. Only 2 facilities reported
having cylinder manifolds, HGR Provinciale de Kinshasa (one manifold) and Centre de Santé de
Référence Pere Nsadi (two manifolds). Both facilities’ manifolds are manual switch, two-cylinder
capacity.
PSA plants
PSA plants are health facility–based factories that use pressure to separate oxygen from the
atmosphere and purify it to medical grade oxygen. Two facilities reported having PSA oxygen plants:
Hôpital du Cinquantenaire and Clinique Ngaliema. Both facilities were piped for oxygen delivery to
bedside terminals. Details of plants are below.
Table 7. Surveyed PSA plants by facility.
Facility Facility Type Model Maximum production
capacity of the plant in
cubic meters per hour
Hôpital du Cinquantenaire Tertiary - -
Clinique Ngaliema Secondary - 40 Nm3/H
20Liquid oxygen tanks
Liquid oxygen tanks hold cryogenic liquid oxygen, which is vaporized into gaseous oxygen for medical
use. No facilities in Kinshasa reported use of liquid oxygen.
Oxygen consumables
Oxygen consumables refer to devices or oxygen delivery interfaces that facilitate administration of
oxygen therapy to the patient—typically single use, though some are reusable. Their life span is short
compared to medical devices, and they require different management practices. Because
consumables are not like capital assets, their availability can greatly fluctuate over time. For this
report, this means that quantities could be lower or higher than average for a facility, depending on
whether it had recently ordered new inventory. Table 8 shows how much variation there was in
consumable stock across facilities by reporting the average number of consumables and the standard
deviation in quantities reported. All measured consumables are in short supply in facilities in
Kinshasa. The majority of surveyed facilities report not having a stock of each consumable.
Table 8. Summary statistics of oxygen consumables reported across surveyed facilities.
Consumable type/category Facilities Total # Average # Standard
reporting across across facilities deviation
>0 units facilities reporting
consumables
Nasal cannula / prongs - Adult 13 648 38 44
Nasal cannula / prongs - Pediatric 11 477 28 37
Nasal cannula / prongs - Neonate 8 351 21 36
Nasal catheter - Adult 10 626 37 45
Nasal catheter - Pediatric 8 500 29 52
Nasal catheter - Neonate 7 505 30 55
Oxygen mask - Adult 13 511 30 39
Oxygen mask - Pediatric 14 566 33 54
Venturi mask - Adult 4 313 18 50
Venturi mask - Pediatric 2 205 12 34
Macintosh - Curved blade 36 259 7 17
Miller - Straight blade 18 192 5 19
Adult - Endotracheal tube and guide (stylet or bougie) 26 1,591 57 133
Adult - Laryngeal mask 20 630 23 39
Adult - Colorimetric end-tidal CO2 detector 6 40 1 4
Pediatric - Endotracheal tube / guide (stylet or bougie) 19 906 32 61
Pediatric - Laryngeal mask 14 379 14 29
21Consumable type/category Facilities Total # Average # Standard
reporting across across facilities deviation
>0 units facilities reporting
consumables
Pediatric - Colorimetric end-tidal CO2 detector 5 18Conclusion
The data collected through this BMES assessment yield new insight into the respiratory care
treatment capacity of health facilities in Kinshasa. This report provides a view into availability of
oxygen delivery equipment, oxygen production equipment, and consumables that are critical to
providing respiratory care treatment for COVID-19 and beyond. Understanding the availability of
respiratory care equipment is the first step in accurately estimating the gap in equipment supply and
understanding health facility capabilities and limitations for treating hypoxemic patients. An overall
scarcity of critical equipment and unequal distribution across surveyed facilities were observed in
Kinshasa. Equitable allocation of new equipment will be a complex task requiring more thoughtful
distribution than simply purchasing equipment to fill the gap and then dividing it between facilities.
Key recommendations for next steps are to:
• Perform a gap analysis and oxygen-need estimation to develop costed operational plans to
increase the availability of respiratory care equipment.
• Develop specific requests and advocacy directed to donors and partners to backstop potential
budget shortfalls for respiratory care equipment procurement and maintenance.
• Estimate long-term national oxygen need, inclusive of COVID-19 and non-COVID-19 respiratory
care, to contribute to the development of a national oxygen infrastructure development policy
(oxygen road map).
Ongoing data collection in the remaining 25 provinces of the DRC will add to this initial knowledge
base and provide insight into national-level needs for respiratory care.
23References
1. World Population Review website. Largest countries in Africa page.
https://worldpopulationreview.com/country-rankings/largest-countries-in-africa. Accessed January
25, 2021.
2. United Nations Statistics Division UNdata website. Democratic Republic of the Congo page.
http://data.un.org/en/iso/cd.html. Accessed January 25, 2021.
3. World Bank website. Urban population (% of total population) - Congo, Dem. Rep. page.
https://data.worldbank.org/indicator/SP.URB.TOTL.IN.ZS?locations=CD. Accessed January 25,
2021.
4. World Bank website. Rural population (% of total population) page.
https://data.worldbank.org/indicator/SP.RUR.TOTL.ZS. Accessed January 25, 2021.
5. United Nations Development Programme (UNDP). Human Development Report 2020: Congo
(Democratic Republic of the). New York: UNDP; 2020.
http://www.hdr.undp.org/sites/all/themes/hdr_theme/country-notes/COD.pdf.
6. The World Bank website. GNI per capita, Atlas method (current US$) – Congo, Dem. Rep [WDI
data file]. https://data.worldbank.org/indicator/NY.GNP.PCAP.CD?locations=CD. Accessed
[January 25, 2021].
7. United Nations Inter-agency Group for Child Mortality Estimation website. Democratic Republic of
the Congo: infant mortality rate - total page.
https://childmortality.org/data/Democratic%20Republic%20of%20the%20Congo. Accessed
January 25, 2021.
8. World Bank website. Life expectancy at birth, total (years) - Congo, Dem. Rep. page.
https://data.worldbank.org/indicator/SP.DYN.LE00.IN?locations=CD. Accessed January 25, 2021.
9. Bonnerot C. Kinshasa, mégapole magnetique [article]. Le Temps website. September 2020.
https://www.letemps.ch/grand-format/kinshasa-megapole-magnetique. When the Biggest Cities in
the World Will Be African series.
10. National Institute of Statistics. Rapport Global Final: Enquête 1-2-3: Resultats de l’Enquete sur
l’Emploi, le Secteur Informel, et sur la Consommation des Menages / 2012. Kinshasa: Democratic
Republic of the Congo, Ministry of Planning and Monitoring Implementation of the Revolution of
Modernity, National Institute of Statistics; September 2014. https://www.ins.cd/wp-
content/uploads/2021/01/Rapport-enquete-123.pdf.
11. Ministry of Public Health. Plan National De Developpement Sanitaire 2016-2020: Vers la
Couverture Sanitaire Universelle. Kinshasa: Democratic Republic of the Congo; 2016.
https://www.prb.org/wp-content/uploads/2020/06/RDC-Plan-National-de-Developpement-Sanitaire-
2016-2020.pdf.
12. Organisation for Economic Co-operation and Development (OECD). Health at a Glance 2019:
OECD Indicators. Paris: OECD Publishing; 2019. https://doi.org/10.1787/4dd50c09-en.
13. World Health Organization (WHO). Priority Medical Devices in the Context of COVID-19 [in Excel].
Geneva: WHO; April 9, 2020. https://www.who.int/publications/m/item/list-of-priority-medical-
devices-for-covid-19-case-management.
2414. World Health Organization (WHO). Oxygen Sources and Distribution for COVID-19 Treatment
Centres: Interim Guidance. Geneva: WHO; April 2020.
https://www.who.int/publications/i/item/oxygen-sources-and-distribution-for-covid-19-treatment-
centres.
25Appendix A. Bed counts by facility and type
Table 9. General and ICU bed counts, by facility.
Facility name All Beds ICU beds
BON BERGER 30 10
CENTRE DE SANTÉ DE REFERENCE BANGU 20 0
CENTRE DE SANTÉ PILOTE ET MATERNITE DE MASINA 50 3
CENTRE MEDICALE TELECOM/OMECO 14 0
CENTRE DE MEDECINE MIXTE ET D'ANEMIE SS 66 0
CENTRE DE SANTÃ ET MATERNITY D'AFRIQUE 15 1
CENTRE DE SANTÃ ET MATERNITY O.M.E.C.O 12 0
CENTRE DE SANTÉ DE REFERENCE PERE NSADI 32 8
CENTRE DE SANTÉ DE REFERENCE CASOP 30 3
CENTRE DE SANTÉ DE REFERENCE DES ANCIENS 84 0
COMBATTANTS
CENTRE DE SANTÉ ET MATERNITE BOMOI 80 8
CENTRE DE SANTÉ ET MATERNITE LISANGA 42 0
CENTRE DE SANTÉ ET MATERNITE SAINT VINCENT DE PAUL 18 0
CENTRE DE SANTÉ MATERNITE BINZA 78 0
CENTRE DE SANTÉ MATERNITE SAINT AMAND 29 0
CENTRE DE SANTÉ MIRIA 10 0
CENTRE DE SANTÉ DE REFERENCE VIJANA 50 2
CENTRE HOSPITALIER AKRAM 98 0
CENTRE HOSPITALIER CLÃMENCE 11 0
CENTRE HOSPITALIER DE BANDALUNGWA 14 0
CENTRE HOSPITALIER DE LA LEGION NATIONALE 67 0
D'INTERVENTION (LNI)
CENTRE HOSPITALIER DE REFERENCE KABILA 70 0
CENTRE HOSPITALIER D'ETAT DE NGIRI-NGIRI 53 0
CENTRE HOSPITALIER D'ETAT MAMA PAMELA 27 0
CENTRE HOSPITALIER DU MONT AMBA (CHMA) 100 20
CENTRE HOSPITALIER LA BORNE 50 0
CENTRE HOSPITALIER LEMBA MEDICAL CENTER 30 0
CENTRE HOSPITALIER LIZIBA LYA BOMOI 90 6
CENTRE HOSPITALIER MERE ET ENFANT DE NGABA 80 0
CENTRE HOSPITALIER NGANDA 100 5
CENTRE HOSPITALIER NGONDO MARIA 110 10
CENTRE HOSPITALIER ROI BAUDOUIN PREMIER 120 3
CENTRE HOSPITALIER SAINT GABRIEL 76 0
CENTRE HOSPITALIER YOLO MEDICAL 85 6
CM DE MATONGE CNSS 8 0
CM BETHANIE 20 0
CM DE KINSHASA 60 13
CM DIAMANT 65 5
CM OPERATIONNEL TYPE A 111EME BASE NAVALE 30 0
CENTRE MERE ET ENFANT DE BARUMBU 84 3
26CENTRE PEDIATRIQUE DEBORAH 10 2
CH DE LA PROVINCE SAINT-JOSEPH 50 0
CH KINGASANI 139 0
CH MIXTE ESCAPADE 42 7
CH MODERNE HONORABLA ATHU 40 0
CH RENE DE HAES 80 0
CLINIQUE LA CANDEUR 38 6
CLINIQUE BONDEKO 160 20
CLINIQUE DES ANGES 25 2
CLINIQUE EFFORT 12 2
CLINIQUE NGALIEMA 270 5
CLINIQUE RIVIERA 76 0
CLINIQUE RUTH 20 2
CLINIQUES DES ANGES/VIP 22 0
CLINIQUES UNIVERSITAIRES DE KINSHASA 500 25
CM KIKIMI 106 0
CM LA COLOMBE 15 0
CM MAMAN WA BOSAWA 14 0
CME DE BUMBU 120 0
CENTRE DE SANTÉ MATER DEI 12 0
CENTRE DE SANTÉ SAINT PAUL 8 0
FONDATION PEDIATRIQUE DE KIMBONDO MAMA KOKO 120 17
HÔPITAL GENERAL DE RÉFÉRENCE DE KINTAMBO 249 7
HOSPITAL PEDIATRIQUE DE KALEMBELEMBE 142 16
HÔPITAL GENERAL DE RÉFÉRENCE DE N'DJILI 165 5
HÔPITAL GENERAL DE RÉFÉRENCE MATADI MAYO 41 0
HJ HOSPITALS 210 45
HÔPITAL CENTRAL MILITAIRE KOKOLO 240 10
HÔPITAL DE LA RIVE 60 50
HÔPITAL DE L'AMITIE SINO-CONGOLAISE 188 8
HÔPITAL DE L'ONATRA 53 0
HÔPITAL GENERAL DE RÉFÉRENCE PROVINCIALE DE 1,000 13
KINSHASA
HÔPITAL GENERAL DE RÉFÉRENCE KISENSO 96 0
HÔPITAL GENERAL DE RÉFÉRENCE DE MAKALA 280 6
HÔPITAL GENERAL DE RÉFÉRENCE DE MALUKU 95 0
HÔPITAL GENERAL DE RÉFÉRENCE DE MATETE 95 5
HÔPITAL GENERAL DE RÉFÉRENCE DE MBANKANA 70 0
HÔPITAL GENERAL DE RÉFÉRENCE KABINDA 21 10
HÔPITAL GENERAL DE RÉFÉRENCE PIERRE FOKOM 30 3
HÔPITAL MEDICAL OPERATIONNEL TYPE A 111 BASE NAVAL 25 0
HÔPITAL MILITAIRE DE GANISON 50 10
HÔPITAL MILITAIRE TSHATSHI 65 8
HÔPITAL SAINT JOSEPH 300 12
HÔPITAL SAINT MICHEL 18 3
HÔPITAL DU CINQUANTENAIRE 1,300 100
MATERNITY ESENGO 100 0
27You can also read