Measuring the Outreach Efforts of Public Health Authorities and the Public Response on Facebook During the COVID-19 Pandemic in Early 2020: ...
←
→
Page content transcription
If your browser does not render page correctly, please read the page content below
JOURNAL OF MEDICAL INTERNET RESEARCH                                                                               Sesagiri Raamkumar et al

     Original Paper

     Measuring the Outreach Efforts of Public Health Authorities and
     the Public Response on Facebook During the COVID-19 Pandemic
     in Early 2020: Cross-Country Comparison

     Aravind Sesagiri Raamkumar1, BTech, MSc, PhD; Soon Guan Tan1, BSc; Hwee Lin Wee1,2, BSc, PhD
     1
      Saw Swee Hock School of Public Health, National University of Singapore, Singapore, Singapore
     2
      Department of Pharmacy, National University of Singapore, Singapore, Singapore

     Corresponding Author:
     Hwee Lin Wee, BSc, PhD
     Saw Swee Hock School of Public Health
     National University of Singapore
     MD1 #10-01
     12 Science Drive 2, National University of Singapore
     Singapore, 117549
     Singapore
     Phone: 65 65164975
     Email: ephwhl@nus.edu.sg

     Abstract
     Background: The coronavirus disease (COVID-19) pandemic presents one of the most challenging global crises at the dawn
     of a new decade. Public health authorities (PHAs) are increasingly adopting the use of social media such as Facebook to rapidly
     communicate and disseminate pandemic response measures to the public. Understanding of communication strategies across
     different PHAs and examining the public response on the social media landscapes can help improve practices for disseminating
     information to the public.
     Objective: This study aims to examine COVID-19-related outreach efforts of PHAs in Singapore, the United States, and England,
     and the corresponding public response to these outreach efforts on Facebook.
     Methods: Posts and comments from the Facebook pages of the Ministry of Health (MOH) in Singapore, the Centers for Disease
     Control and Prevention (CDC) in the United States, and Public Health England (PHE) in England were extracted from January
     1, 2019, to March 18, 2020. Posts published before January 1, 2020, were categorized as pre-COVID-19, while the remaining
     posts were categorized as peri-COVID-19 posts. COVID-19-related posts were identified and classified into themes. Metrics
     used for measuring outreach and engagement were frequency, mean posts per day (PPD), mean reactions per post, mean shares
     per post, and mean comments per post. Responses to the COVID-19 posts were measured using frequency, mean sentiment
     polarity, positive to negative sentiments ratio (PNSR), and positive to negative emotions ratio (PNER). Toxicity in comments
     were identified and analyzed using frequency, mean likes per toxic comment, and mean replies per toxic comment. Trend analysis
     was performed to examine how the metrics varied with key events such as when COVID-19 was declared a pandemic.
     Results: The MOH published more COVID-19 posts (n=271; mean PPD 5.0) compared to the CDC (n=94; mean PPD 2.2) and
     PHE (n=45; mean PPD 1.4). The mean number of comments per COVID-19 post was highest for the CDC (mean CPP 255.3)
     compared to the MOH (mean CPP 15.6) and PHE (mean CPP 12.5). Six major themes were identified, with posts about prevention
     and safety measures and situation updates being prevalent across the three PHAs. The themes of the MOH’s posts were diverse,
     while the CDC and PHE posts focused on a few themes. Overall, response sentiments for the MOH posts (PNSR 0.94) were more
     favorable compared to response sentiments for the CDC (PNSR 0.57) and PHE (PNSR 0.55) posts. Toxic comments were rare
     (0.01%) across all PHAs.
     Conclusions: PHAs’ extent of Facebook use for outreach purposes during the COVID-19 pandemic varied among the three
     PHAs, highlighting the strategies and approaches that other PHAs can potentially adopt. Our study showed that social media
     analysis was capable of providing insights about the communication strategies of PHAs during disease outbreaks.

     (J Med Internet Res 2020;22(5):e19334) doi: 10.2196/19334

     http://www.jmir.org/2020/5/e19334/                                                               J Med Internet Res 2020 | vol. 22 | iss. 5 | e19334 | p. 1
                                                                                                                    (page number not for citation purposes)
XSL• FO
RenderX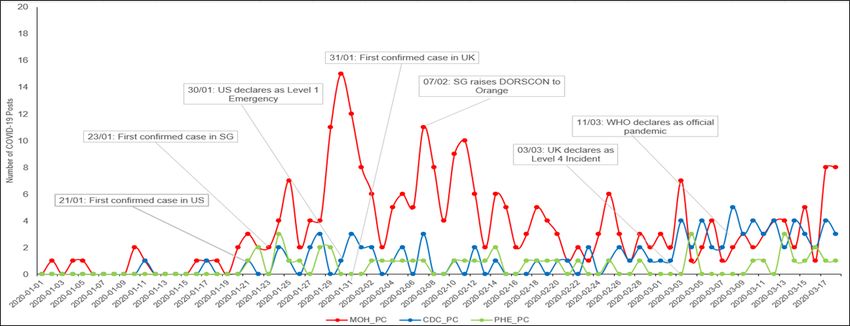
JOURNAL OF MEDICAL INTERNET RESEARCH                                                                           Sesagiri Raamkumar et al

     KEYWORDS
     COVID-19; sentiment analysis; emotion analysis; public health authorities; infectious disease; outbreak; public engagement;
     social media; public health; virus

                                                                         media outlets [19]. The advent of social media platforms such
     Introduction                                                        as Facebook and Twitter facilitated the instantaneous sharing
     Background                                                          of information during pandemics for both the health authorities
                                                                         and the general public. With widespread social media use and
     The coronavirus disease (COVID-19) was first identified in          the participatory web, PHAs must understand that health risk
     Wuhan, China in December 2019. It has since spread to 210           communication is no longer a linear process [20]. The public
     countries and territories, infecting 1,697,356 people and causing   can voice their sentiments and comments on the actions
     102,667 deaths as of April 11, 2020 [1]. Compared to the            undertaken by the government as events related to the pandemic
     previous outbreaks of severe acute respiratory syndrome (SARS)      unfold. The public themselves are also involved in content
     and Middle East respiratory syndrome, COVID-19 has caused           creation through blogs and forums. Citizen journalism and
     more infections and deaths, spreading from an infected person       propagation of information pertaining to a pandemic is made
     to 2-2.5 people on average [2]. Most countries started reporting    possible within their social networks.
     infections by the second half of January 2020. The United States
     reported its first case on January 20, 2020 [3], while England,     Existing research on social media has explored epidemics and
     under the United Kingdom, reported its first cases on January       pandemics such as Zika [21-23], H1N1 [24], and Ebola [25].
     31, 2020 [4]. Singapore reported its first case on January 23,      The scope of these studies includes descriptive analysis of
     2020 [5]. In an effort to contain the COVID-19 pandemic in          posting frequency [21], thematic analysis of post content [26],
     Singapore, multiple interventions have been implemented on          sentiment analysis of posts [23], and social network analysis
     both societal and health care system levels [6], and the country    [24]. Although the WHO has put forth guidelines for emergency
     shifted rapidly to Disease Outbreak Response System Condition       risk communication during epidemics [27], countries may adopt
     (DORSCON) orange, the second-highest level of alert for             different strategies when conveying health risks across social
     disease outbreaks in Singapore, on February 7, 2020 [7], just       media platforms. Currently, there is a lack of studies that
     15 days after the first case of COVID-19 infection was              compare the social media outreach efforts of PHAs from
     confirmed. The World Health Organization (WHO) declared             different countries and corresponding responses and interactions
     this disease as a pandemic on March 11, 2020, and is unable to      by the general public. Such studies might offer rich insights on
     ascertain the duration of the pandemic [8].                         how effectively platforms such as Facebook could be used for
                                                                         risk communication.
     Countries such as Singapore, Taiwan, and South Korea have
     taken the necessary precautions to handle this pandemic within      This Study
     their borders in January when the pandemic was largely confined     Amid the uncertainty of a health threat such as COVID-19, the
     to China [9]. On the international scene, Singapore has received    public have a greater demand for real time, transparent, and
     accolades from the WHO and several world leaders praising           consistent messaging. Government agencies run the risk of
     our efforts in containing the disease [10,11]. The Dean of the      losing the centralized control of the risk communication process
     Saw Swee Hock School of Public Health, National University          if they do not act swiftly to public sentiment and dispel
     of Singapore, has also been invited by several overseas             falsehoods and misinformation [18,28]. A confluence of factors
     universities to share Singapore’s experience in combating the       could lead to unintended behavioral outcomes among the public
     COVID-19 pandemic [12,13]. Unfortunately, precautionary             in the ongoing COVID-19 pandemic. The mismatch in perceived
     measures have been reported to be found wanting in other            threats as well as costs and benefits of certain health behaviors
     countries such as the United States and the United Kingdom          communicated by either mainstream media, government
     [14,15]. It is to be noted that such delays in preparation for      authorities, or alternative media could result in a distorted
     epidemics have also been seen in the past with Zika, influenza      understanding among the general public. Hence, it is crucial to
     A virus subtype H1N1, and Ebola [16].                               understand how the prevailing sentiments and narratives about
     Social Media Use During Pandemics                                   the pandemic were conveyed through the different
                                                                         communication channels and how it was received by the general
     Effective risk communication is essential in directing the public   public who have access to these channels. This will highlight
     to adopt certain desired behaviors such as social distancing and    the trigger points, allowing health authorities to fine-tune
     good hygiene habits in times of pandemics. Transparent and          messaging along the course of the pandemic to allay public fear
     consistent communication amidst the uncertainty of the              and panic.
     pandemic is also crucial in maintaining public confidence and
     trust [17,18]. Traditionally, the government and public health      Hence, in this study, we seek to answer four research questions
     authorities (PHAs) relied on websites, news media, print press,     related to Facebook use during a pandemic. First, how frequently
     and television as main platforms for the dissemination of           do the PHAs of Singapore, the United States, and England use
     pandemic-related news and information to the public. In contrast    Facebook for risk communication? Second, what were the
     to the 2003 SARS and 2009 H1N1 pandemic, present-day media          primary themes of the COVID-19-related posts by PHAs? Third,
     landscapes worldwide have evolved significantly, with a greater     what are the Facebook followers’ sentiments and emotions in
     presence of social media and alternative local and overseas         response to these COVID-19-related posts by PHAs? Fourth,

     http://www.jmir.org/2020/5/e19334/                                                           J Med Internet Res 2020 | vol. 22 | iss. 5 | e19334 | p. 2
                                                                                                                (page number not for citation purposes)
XSL• FO
RenderX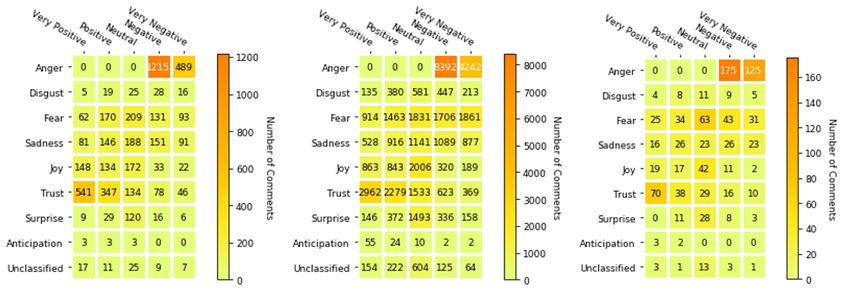
JOURNAL OF MEDICAL INTERNET RESEARCH                                                                          Sesagiri Raamkumar et al

     how common are toxic comments that may incite public unrest,       assigned to posts with more than one theme. The list of themes
     and do these toxic comments gain traction? We have selected        included situation update, preventive measures, appreciation,
     Singapore, the United States, and England for this study, as we    public reassurance, disease information, falsehood correction,
     intend to look at the findings from a cross-country perspective    face mask, research, testing and diagnosis, and miscellaneous.
     and these are developed countries that have English as their       For each of these themes, the number of constituent posts and
     official language.                                                 percentage of these posts to the total number of posts were
                                                                        reported.
     Methods                                                            Sentiment and Emotion Analyses of Comments to
     Data Extraction                                                    COVID-19 Posts
     Data for this study were extracted from three Facebook pages       To gain insights into the reactions and comments by Facebook
     using the tool Facepager [29] on March 19, 2020. The three         users on the posts by PHAs, we conducted sentiment and
     Facebook pages are officially managed by the Ministry of Health    emotion analyses on comments written in the English language.
     (MOH), Singapore [30], the Centers for Disease Control and         The sentiment polarity (SP) score for each comment was
     Prevention (CDC) in the United States [31], and Public Health      identified using the Vader algorithm [35] since the algorithm
     England (PHE) in England [32]. As of April 4, 2020, the            has been specifically conceptualized for ascertaining the
     followers count of the MOH, the CDC, and PHE are 212,453,          sentiment in short texts (eg, user comments on Facebook or
     2,636,072, and 336,935, respectively. Extracted data include       tweets from Twitter). The SP score value ranges from –1 to 1
     posts by PHAs, comments from Facebook users, and their             and was classified into five categories: verynegative
     corresponding reactions, a feature in Facebook where users can     (–1
JOURNAL OF MEDICAL INTERNET RESEARCH Sesagiri Raamkumar et al
toxic and comments with toxicity scores less than 0.75 are with 53 posts in the first 18 days of the month. The highest
nontoxic. We examined the number of likes and replies per number of posts published on a single day was on March 8,
toxic comment to determine if such toxic comments may have 2020, with 5 posts. The CDC started to post at least 1 COVID-19
any ripple effect. We compared this to the number of likes and post every day starting on February 25, 2020. The number of
replies per nontoxic comment as a reference. daily posts remained at low levels even after the United States
had declared a level 1 emergency on January 30, 2020. The
Results average number of daily posts increased only after the United
States declared COVID-19 as a level 1 emergency on January
COVID-19 Outreach Efforts of PHAs and Public 30, 2020, and rose again after the WHO declared a pandemic
Engagement on March 11, 2020.
In Table 1 and 2, the aggregated statistics related to the PHE had the lowest posting frequency with only about half of
Facebook posts from the MOH, the CDC, and PHE are listed posts being related to COVID-19 posts. Similar to the MOH,
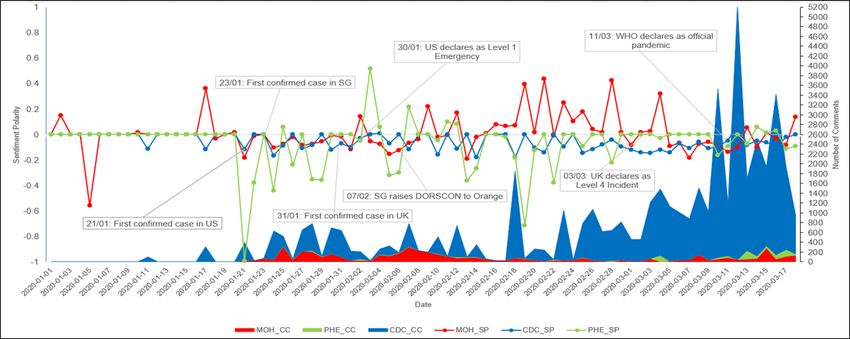
along with the public engagement metrics. In Figure 1, the February was the most active month with 19 COVID-19 posts
COVID-19 posts daily count values are plotted in a line graph. for PHE, and the highest number of posts on a single day (n=3)
In addition, the key dates on which the three countries reported was done on 3 days: January 24, March 4, and March 13, 2020.
their first COVID-19 cases and declared the outbreak as a Despite the United Kingdom declaring COVID-19 as a level 4
national-level pandemic (in national terminology) are incident on March 3, 2020, there were days when PHE had zero
highlighted in the figure. COVID-19 posts. PHE started posting at least one COVID-19
In the pre-COVID-19 phase (January 1, 2019, to December 31, post every day on March 13, 2020.
2019), the CDC had an average of 2 daily posts, while the MOH Compared to the pre-COVID-19 phase (Table 2), there was also
and PHE had an average of 1 daily post (Table 1). The MOH a considerable increase in the public engagement metrics in the
stepped up on the use of Facebook for public engagement during peri-COVID-19 time period. For instance, the MOH had a 7-fold
COVID-19. As of March 18, 2020, the MOH had published increase in CPP, with a higher average number of people
304 posts peri-COVID-19 (January 1, 2020, to March 18, 2020), commenting in 2020 compared to 2019. The CDC saw a 9-fold
which was nearly a threefold increase in their PPD from 1.35 increase in the mean RPP from 2019 to 2020 and close to a
to 4.34. The MOH had the highest frequency of postings among 10-fold increase in mean SPP from 2019 to 2020. In the case
the three PHAs with 304 posts, and the majority were related of PHE, the biggest rise is seen for SPP, with nearly a 5-fold
to COVID-19. The mean number of daily posts was 4.3, ranging increase from 2019 to 2020.
from 1 to 15 posts daily. February was the most active month
with 132 COVID-19 posts. Prior to the first locally confirmed We have also noted that Facebook users who read
case in Singapore on January 23, 2020, there was a limited peri-COVID-19 posts from the MOH were more likely to react
number of daily posts from the MOH (ranging from 1 to 3 daily to the post than to share or comment on the post, while Facebook
posts). However, the number of daily posts from the MOH users who read posts from the CDC and PHE were more likely
increased to 7 two days after the first confirmed case in to share the posts than to react or comment on the post. This
Singapore, and there have been at least 2 PPD ever since. observation was consistent in both pre- and peri-COVID-19
periods.
Of the total CDC posts, less than half were related to COVID-19.
It published the highest number of COVID-19 posts in March,
Table 1. Summary of COVID-19 Facebook outreach by the MOH, the CDC, and PHE during the periods of pre-COVID-19 (January 1, 2019, to
December 31, 2019) and peri-COVID-19 (January 1, 2020, to March 18, 2020).
Agency Outreach effort (pre-COVID-19a) Outreach effort (peri-COVID-19)
Total posts, n PPDb, mean (SD) Total posts, n PPD, mean (SD) COVID-19 posts, COVID-19 PPD Since first
n (%) reported case in each coun-
try, mean (SD)
MOHc 192 1.4 (1.09) 304 4.3 (3.5) 271 (89.1) 5.0 (3.6)
CDCd 599 2.1 (0.99) 232 2.1 (1.1) 94 (40.5) 2.2 (1.1)
PHEe 346 1.3 (0.56) 87 1.6 (0.8) 45 (51.7) 1.4 (0.7)
a
COVID-19: coronavirus disease.
b
PPD: posts per day.
c
MOH: Ministry of Health.
d
CDC: Centers for Disease Control and Prevention.
e
PHE: Public Health England.
http://www.jmir.org/2020/5/e19334/ J Med Internet Res 2020 | vol. 22 | iss. 5 | e19334 | p. 4
(page number not for citation purposes)
XSL• FO
RenderXJOURNAL OF MEDICAL INTERNET RESEARCH Sesagiri Raamkumar et al
Table 2. Summary of COVID-19 Facebook engagement by the MOH, the CDC, and PHE during the periods of pre-COVID-19 (January 1, 2019, to
December 31, 2019) and peri-COVID-19 (January 1, 2020, to March 18, 2020).
Agency Public engagement (pre-COVID-19a) Public engagement (peri-COVID-19)
RPPb, mean (SD) SPPc, mean (SD) CPPd, mean (SD) RPP_C19e, mean (SD) SPP_C19f, mean (SD) CPP_C19g, mean (SD)
MOHh 34.3 (26.3) 20.1 (100.3) 2.2 (4.5) 188.9 (201.4) 84.6 (279.7) 15.6 (20.7)
CDCi 230.7 (203.4) 240.9 (697.8) 43.1 (72.7) 2128.2 (4864.9) 2373.8 (3485.8) 255.3 (298.3)
j
PHE 52.4 (68.7) 102.6 (212.5) 4.3 (6.7) 101.5 (89.8) 478.9 (568.1) 12.5 (11.5)
a
COVID-19: coronavirus disease.
b
RPP: reactions per post.
c
SPP: shares per post.
d
CPP: comments per post.
e
RPP_C19: reactions to COVID-19 post.
f
SPP_C19: shares per COVID-19 post.
g
CPP_C19: comments per COVID-19 post.
h
MOH: Ministry of Health.
i
CDC: Centers for Disease Control and Prevention.
j
PHE: Public Health England.
Figure 1. COVID-19 posts frequency during the analysis period. CDC_PC: Centers for Disease Control and Prevention's number of posts; COVID-19:
coronavirus disease; DORSCON: Disease Outbreak Response System Condition; MOH_PC: Ministry of Health's number of posts; PHE_PC: Public
Health England number of posts; SG: Singapore; WHO: World Health Organization.
related to preventive measures. For the MOH, situation update
Thematic Analysis and preventive measures were the top two themes. Interestingly,
The themes appreciation, research, testing and diagnosis, and the CDC and PHE did not issue any post to correct false
miscellaneous were combined to the theme others to focus on information, while the MOH issued 16 of such posts. There was
six major themes. As shown in Table 3, the themes from the also no post from PHE and only 2 posts from the CDC to
MOH are more diverse, with no theme exceeding 30% of the reassure their Facebook followers, while the MOH issued 32
total posts. In contrast, the CDC and PHE posts were largely of such public reassurance posts.
http://www.jmir.org/2020/5/e19334/ J Med Internet Res 2020 | vol. 22 | iss. 5 | e19334 | p. 5
(page number not for citation purposes)
XSL• FO
RenderXJOURNAL OF MEDICAL INTERNET RESEARCH Sesagiri Raamkumar et al
Table 3. Thematic analysis of the public health authorities’ coronavirus disease outreach efforts.
Theme MOHa (n=271), n (%) CDCb (n=94), n (%) PHEc (n=45), n (%)
Preventive measures 60 (22.1) 50 (53.2) 18 (40.0)
Situation update 78 (28.8) 21 (22.3) 7 (15.6)
Disease information 16 (5.9) 17 (18.1) 17 (37.8)
Public reassurance 32 (11.8) 2 (2.1) 0 (0.0)
Falsehood correction 16 (5.9) 0 (0.0) 0 (0.0)
Others 69 (25.5) 4 (4.3) 3 (6.7)
a
MOH: Ministry of Health.
b
CDC: Centers for Disease Control and Prevention.
c
PHE: Public Health England.
while positive emotions (trust and joy) accounted for 33.0%
Sentiment and Emotion Analyses of Comments to (n=1655) of the comments. In the case of the CDC and PHE,
COVID-19 Posts negative emotions accounted for 63.0% (n=26,716/42,470) and
The number of CPP was highest for the CDC, which was 66.2% (n=647/977) of the comments, respectively, and positive
attributed to the high number of followers on their Facebook emotions accounted for 28.2% (n=11,987) and 26.0% (n=254)
page (Table 4). Although the MOH had fewer number of of comments, respectively. Since emotions have a direct effect
followers than PHE, the number of comments received for the on sentiments, the negative sentiments accounted for the
MOH’s COVID-19 posts were 5 times more than PHE. This majority of the comments (n=2431/5032, 48.3%;
observation can also be attributed to the high number of n=21,015/42,470, 49.5%; and n=491/977, 50.3% for the MOH,
COVID-19 posts for the MOH vs PHE’s COVID-19 posts. the CDC, and PHE, respectively). The MOH had a higher
Interestingly, the mean CPP of PHE was still higher than the percentage of positive sentiments (n=1725/5032, 34.3%)
MOH. The average SP scores of all three PHAs were close to compared to the CDC (n=12,256/42,470, 28.9%) and PHE
the neutral sentiment mark of zero with only the MOH being (n=277/977, 28.4%).
slightly positive. Correspondingly, the PNSR and PNER of the
The temporal trend analysis (Figure 3) provides more
MOH were much higher than the values for the CDC and PHE.
information compared to the snapshots provided in Table 4 and
However, since all these values were below 1, it is an indication
Figure 2. For instance, we observed that the number of
that there were more negative sentiments and emotions conveyed
comments increased significantly over time for the CDC posts,
in the comments. The CDC and PHE received predominantly
while the number of comments for the MOH posts appeared to
negative comments from their followers based on the low PNSR
have decreased over time. Among the three agencies, PHE had
and PNER values.
the highest degree of fluctuations in SP scores, with many
In Figure 2, the emotion categories are plotted against the negative and few positive spikes. The SP scores were mostly
sentiment categories, with a darker shade of the box reflecting negative for the CDC posts, while SP scores were positive for
a higher number of comments. We observed that most of the the MOH on several occasions, which contributed to an average
comments to the MOH posts were angry (n=1704, 33.9%), with SP that tends toward neutral. The MOH had the highest number
1215 being angry and negative and 489 being angry and very of days with positive sentiments, particularly the period between
negative. Anger is also the most prevalent emotion for the CDC February 16, 2020, and March 5, 2020, which could be due to
(n=12,634/42,470, 29.8%) and PHE (n=300/977, 30.7%) posts. a relatively high number of appreciation posts (n=9) during that
For the MOH, the negative emotions (anger, disgust, fear, and period.
sadness) account for 62.0% (n=3119/5032) of the comments,
http://www.jmir.org/2020/5/e19334/ J Med Internet Res 2020 | vol. 22 | iss. 5 | e19334 | p. 6
(page number not for citation purposes)
XSL• FO
RenderXJOURNAL OF MEDICAL INTERNET RESEARCH Sesagiri Raamkumar et al
Table 4. Emotion and sentiment analyses of COVID-19 Facebook comments.
Agency COVID-19a posts, n Comments, n CPPb, mean (SD) SPc, mean (SD) PNSRd, mean (SD) PNERe, mean (SD)
MOHf 271 5032 18.57 (30.04) 0.02 (0.25) 0.94 (2.11) 0.84 (1.79)
g
CDC 94 42,470 451.81 (529.09) –0.09 (0.06) 0.57 (0.16) 0.41 (0.12)
PHEh 45 977 21.71 (31.89) –0.14 (0.26) 0.55 (0.49) 0.44 (0.54)
a
COVID-19: coronavirus disease.
b
CPP: comments per post.
c
SP: sentiment polarity score.
d
PNSR: positive to negative sentiments ratio.
e
PNER: positive to negative emotions ratio.
f
MOH: Ministry of Health.
g
CDC: Centers for Disease Control and Prevention.
h
PHE: Public Health England.
Figure 2. Sentiment and emotions heat map for coronavirus disease Facebook comments (left: Ministry of Health; middle: Centers for Disease Control
and Prevention; right: Public Health England).
Figure 3. Temporal trend analysis for the number of comments and sentiment polarity. CDC_CC: Centers for Disease Control and Prevention's number
of comments; CDC_SP: Centers for Disease Control and Prevention's sentiment polarity score; DORSCON: Disease Outbreak Response System
Condition; MOH_CC: Ministry of Health's number of comments; MOH_SP: Ministry of Health's sentiment polarity score; PHE_CC: Pubilc Health
England's number of comments; PHE_SP: Public Health England's sentiment polarity score; SG: Singapore; WHO: World Health Organization.
http://www.jmir.org/2020/5/e19334/ J Med Internet Res 2020 | vol. 22 | iss. 5 | e19334 | p. 7
(page number not for citation purposes)
XSL• FO
RenderXJOURNAL OF MEDICAL INTERNET RESEARCH Sesagiri Raamkumar et al
Identification of Toxicity in Comments of COVID-19 the MOH. For the PHE page, toxic comments received more
Posts likes and replies from its followers as compared to nontoxic
comments. The mean LPTC for PHE was two times higher
The CDC had the highest number of toxic comments, followed
compared to nontoxic comments. Similarly, toxic comments
by the MOH and PHE (Table 5). PHE had the highest average
received more replies compared to nontoxic comments.
of likes per toxic comment (LPTC) compared to the CDC and
Table 5. Summary of coronavirus disease toxic comments.
Agency Total comments, n Toxic comments, n (%) LPTCa, mean LPNCb, mean RPTCc, mean RPNCd, mean
MOHe 5032 58 (0.01) 0.47 1.38 0.14 0.43
CDCf 42,470 728 (0.01) 0.89 1.99 0.13 0.71
PHEg 977 12 (0.01) 2.42 1.44 0.92 0.60
a
LPTC: likes per toxic comment.
b
LPNC: likes per nontoxic comment.
c
RPTC: replies per toxic comment.
d
RPNC: replies per nontoxic comment.
e
MOH: Ministry of Health.
f
CDC: Centers for Disease Control and Prevention.
g
PHE: Public Health England.
In our analysis of the PHAs’ post content, we restricted the
Discussion number of themes to six to focus on major themes, unlike earlier
Principal Findings studies where more themes were used with a meagre number
of posts for certain themes [26]. The posts from the MOH were
Among the three agencies, the MOH was the most active in more diverse with frequent updates on preventive measures,
using Facebook to reach out to its followers in terms of posting travel advisories, disease information, falsehood correction, and
frequency, with an average of around 4 posts daily, exceeding even appreciation for health care workers and other frontline
both the CDC and PHE. The MOH displayed a similar active staff. This was in contrast to the posts from the CDC and PHE,
outreach strategy during the previous Zika outbreak in 2016 by where the messages were mostly focused on preventive
ramping up engagement online with more frequent posting [21]. measures and sporadic situation updates. Falsehood corrections
The MOH COVID-19 posts received more attention from their are in need during this pandemic, as an earlier study identified
followers compared to the previous outbreak. For instance, the that misleading Facebook posts acquired more popularity than
average number of comments received per post was 3.6 for Zika accurate posts during the Zika outbreak in the United States
posts [21], while for COVID-19 posts, the average has increased [43]. On this point, we observed that the MOH has adopted
to 15.6. misinformation debunking as one of its community and social
The posting frequency of the CDC and PHE on matters measures for handling the COVID-19 situation [6]. The current
pertaining to COVID-19 was low in the initial peri-COVID-19 distribution of themes may reflect the different phases that the
phase; this was because a substantial number of posts were still three countries were going through during the time of our
dedicated to other public health topics (eg, mental health, food analyses. We anticipate that as the pandemic develops across
disease outbreak, chronic disease management). This may reflect each country the themes of the posts will continually evolve.
that both countries perceived the risk to be low or possibly that Nevertheless, there is a need to enhance awareness and not
the outbreak was still largely confined within Asia. At the time undermine the possibility of a serious outbreak during the
of analysis, the epicenter of the COVID-19 pandemic was precrisis period [22]. From our analyses, we did not identify
Wuhan, China with several other Asian countries, including much evidence to show attempts at such efforts from the CDC
Singapore. We observed that the volume of updates on and PHE in their official Facebook pages.
COVID-19 related to prevention from the CDC and PHE In previous disease pandemics, negative sentiments were
increased toward the end of the analysis period, which parallels generally prevalent in social media [23]. We made similar
the surge in case count in both the United States and England. findings in our analyses where the majority of the posts
Given the large number of followers on the CDC and PHE conveyed anger emotions and negative sentiments. For the
Facebook pages, it is a missed opportunity that the CDC and MOH, however, we noticed that over time (from mid-February
PHE did not engage with their followers more intensively using to the first week of March 2020), Facebook users began to be
Facebook. We observed that Facebook users who engaged with more positive about the government’s response to the pandemic.
the CDC or PHE posts were more likely to share rather than to This demonstrates that monitoring sentiments and emotions on
react or comment on the posts. Hence, Facebook may possibly social media can help PHAs gauge the effectiveness of their
be a useful platform for the CDC or PHE to disseminate public health education efforts on Facebook. Another
information for Facebook users to propagate to others. observation that supports the monitoring of sentiments and
http://www.jmir.org/2020/5/e19334/ J Med Internet Res 2020 | vol. 22 | iss. 5 | e19334 | p. 8
(page number not for citation purposes)
XSL• FO
RenderXJOURNAL OF MEDICAL INTERNET RESEARCH Sesagiri Raamkumar et al
emotions on social media is that the number of comments tend either as a resource for additional information or for reaching
to spike in conjunction with specific events. For example, our out to people who no longer follow traditional news and mass
data showed that the number of comments sharply rose in media channels. Another limitation of the study was that we
association with the first confirmed case in the United States have limited our analyses of the Facebook followers’ response
(January 21, 2020), when Singapore rose its DORSCON level to posts initiated by the PHAs. We have not, for instance,
to orange (February 7, 2020), when the United Kingdom analyzed the comments within private circles or closed groups
declared COVID-19 as a Level 4 incident (March 3, 2020), and that may be different in nature compared to publicly disclosed
when the WHO declared COVID-19 a pandemic (March 11, comments. Our paper has focused on the comparative analysis
2020). of how three PHAs have used Facebook for COVID-19
communications strategy. We did not evaluate if the PHAs’ use
The prevalence of toxic comments for all three Facebook pages’
of social media has improved over time as they gain experience
COVID-19 posts was fairly low. It is possible that the majority
from dealing with other infectious diseases such as the H1N1
of the toxic comments had been removed (for instance, the CDC
swine flu pandemic, Ebola epidemic, or Zika outbreak. As social
has a policy that profane and obscene comments can be deleted
media platforms become more prominent, its users and the
[44]), and what was analyzed were those that were not filtered.
interactions among its users evolve. Optimal use of these
The US President has repeatedly referred to SARS coronavirus
platforms for public health communications will benefit from
2 as the “Chinese virus,” and this may have led to anti-Asian
constant reflection and critical appraisal of what strategies have
sentiments [45]. This may explain why the CDC had the highest
worked and what have not. Finally, the thematic analysis may
number of toxic comments. Fortunately, the volume of such
be more robust if independent coding of the posts was
comments remained low, and the agreement with such toxic
conducted. However, the huge number of posts rendered this
comments was also low as reflected by the low average number
process time-consuming. Accordingly, the review and
of likes. PHAs should consider dedicating resources during a
confirmation of the themes from a second coder was sought as
pandemic to manage toxic comments as well as combat
an acceptable compromise.
falsehood. We observed that both the CDC and PHE did not
have any post to correct falsehoods, unlike the MOH. In contrast, Conclusions
social media platforms have been proactive in setting up The Facebook postings by the PHAs in this study provided some
centralized hubs dedicated to COVID-19 updates and insights into their governments’ COVID-19 broader
information such as the COVID-19 Information Center on communication strategy. Through our study, we identified
Facebook [46] or the COVID-19 Information and Resources differences in the Facebook-based outreach and engagement
collection on Google [47] to direct social media users to trusted efforts of three developed countries during the prepandemic
and reliable information. and peripandemic periods of COVID-19. The differences were
Limitations found in terms of both posting frequency and themes in posts.
The change in sentiments in response to specific outreach events
In this study, we analyzed data from Facebook only. However,
were also observed. On the whole, the MOH stepped up its
PHAs may have used other social media platforms such as
outreach efforts on Facebook more intensively compared to the
Twitter and YouTube to disseminate public health information
CDC and PHE. We hope that our findings will be of interest to
to their citizens. Thus, this study’s findings may not fully
PHAs and health science researchers who study pandemics in
represent the overall social media outreach efforts of PHAs
the context of social media. In our upcoming work, we intend
during the COVID-19 pandemic. In addition, the sentiments
to conduct studies in two related directions. In our first set of
captured on Facebook comments may not reflect the users of
studies, we intend to collect more data from the same three PHA
other social media platforms, as the user profiles of these various
Facebook pages and analyze the results with data segregated in
platforms are known to be different. Furthermore, PHAs may
three phases (pre-COVID-19, peri-COVID-19, and
currently still use traditional news and mass media channels to
post-COVID-19). In the second set of studies, we intend to
reach the public with information, updates, and guidance
analyze the outreach efforts of other countries during this
measures. Hence, PHAs’ outreach efforts in social media
COVID-19 pandemic to understand the effectiveness and
platforms is supplementary, and these platforms are considered
shortfalls of strategies used by different countries.
Acknowledgments
We would like to thank Miss Yu-Ting, CHEN (research assistant) for providing administrative support to submitting this manuscript.
ASR was hired under a grant from the National University Health System Strategic Funds titled “Phen-Gen Research Repository
and Pre-Emptive Pharmacogenomics.” During COVID-19, safe distancing measures prevented him from accessing data stored
in a dedicated workstation without internet access. He was thus reassigned to this study. The grantor had no role in the design
and conduct of the study; collection, management, analysis, and interpretation of the data; preparation, review, or approval of the
manuscript; or the decision to submit the manuscript for publication. This work was also supported by the Centre for Health
Services and Policy Research, a center under the National University Health Systems Pte Ltd and Saw Swee Hock School of
Public Health, National University of Singapore. We would like to thank the Perspective API team of Google for generously
extending the usage quota of their API service, which we used to measure the toxicity of Facebook comments for our research
study.
http://www.jmir.org/2020/5/e19334/ J Med Internet Res 2020 | vol. 22 | iss. 5 | e19334 | p. 9
(page number not for citation purposes)
XSL• FO
RenderXJOURNAL OF MEDICAL INTERNET RESEARCH Sesagiri Raamkumar et al
Authors' Contributions
H-LW conceptualized the study, interpreted the data, critically revised the manuscript for important intellectual content, and
provided supervision. ASR designed the study; acquired, analyzed, and interpreted the data; drafted the manuscript; and critically
revised the manuscript for important intellectual content. SGT analyzed and interpreted the data and critically revised the manuscript
for important intellectual content. All authors approved the final version of the manuscript.
Conflicts of Interest
None declared.
Multimedia Appendix 1
Emojis and the associated emotions.
[DOCX File , 16 KB-Multimedia Appendix 1]
References
1. Worldometer. 2020. Countries where COVID-19 has spread URL: https://www.worldometers.info/coronavirus/
countries-where-coronavirus-has-spread/ [accessed 2020-04-11]
2. Uras U. Al Jazeera. 2020 Apr 08. Coronavirus: comparing COVID-19, SARS and MERS URL: https://www.aljazeera.com/
news/2020/04/coronavirus-comparing-covid-19-sars-mers-200406165555715.html [accessed 2020-04-11]
3. Holshue ML, DeBolt C, Lindquist S, Lofy KH, Wiesman J, Bruce H, et al. First case of 2019 novel coronavirus in the
United States. N Engl J Med 2020 Mar 05;382(10):929-936. [doi: 10.1056/nejmoa2001191]
4. Moss P, Barlow G, Easom N, Lillie P, Samson A. Lessons for managing high-consequence infections from first COVID-19
cases in the UK. Lancet 2020 Mar 14;395(10227):e46 [FREE Full text] [doi: 10.1016/S0140-6736(20)30463-3] [Medline:
32113507]
5. Abdullah Z, Salamat H. Channel News Asia. 2020 Jan 23. Singapore confirms first case of Wuhan virus URL: https://www.
channelnewsasia.com/news/singapore/wuhan-virus-pneumonia-singapore-confirms-first-case-12312860 [accessed 2020-04-11]
6. Lee V, Chiew C, Khong W. Interrupting transmission of COVID-19: lessons from containment efforts in Singapore. J
Travel Med 2020 Mar 13:e [FREE Full text] [doi: 10.1093/jtm/taaa039] [Medline: 32167146]
7. Ministry of Health. 2020 Feb 07. Risk assessment raised to DORSCON orange URL: https://www.moh.gov.sg/
news-highlights/details/risk-assessment-raised-to-dorscon-orange [accessed 2020-04-11]
8. World Health Organization. 2020 Mar 11. WHO Director-General's opening remarks at the media briefing on COVID-19
- 11 March 2020 URL: https://www.who.int/dg/speeches/detail/
who-director-general-s-opening-remarks-at-the-media-briefing-on-covid-19---11-march-2020 [accessed 2020-04-11]
9. Barron L. Time. 2020 Mar 13. What we can learn from Singapore, Taiwan and Hong Kong about handling coronavirus
URL: https://time.com/5802293/coronavirus-covid19-singapore-hong-kong-taiwan/ [accessed 2020-04-10]
10. Teo J. The Straits Times. 2020 Mar 10. Coronavirus: WHO praises Singapore's containment of Covid-19 outbreak URL:
https://www.straitstimes.com/singapore/health/coronavirus-who-praises-singapores-containment-of-covid-19-outbreak
[accessed 2020-04-09]
11. The Straits Times. 2020 Mar 13. Covid-19 situation is serious but under control in Singapore: PM Lee URL: https://www.
straitstimes.com/singapore/covid-19-situation-is-serious-but-under-control-in-spore-pm-lee [accessed 2020-04-09]
12. Facebook. Facebook. 2020 Mar 31. Coronavirus: lessons learned from Singapore URL: https://www.facebook.com/
nus.sshsph/posts/2766847946771712?__tn__=-R [accessed 2020-04-09]
13. Facebook. 2020 Apr 08. COVID-19: lessons learned? What comes next? URL: https://www.facebook.com/nus.sshsph/
posts/2784851854971321 [accessed 2020-04-09]
14. Costello A. The Guardian. 2020 Mar 15. The UK’s Covid-19 strategy dangerously leaves too many questions unanswered
URL: https://www.theguardian.com/commentisfree/2020/mar/15/
uk-covid-19-strategy-questions-unanswered-coronavirus-outbreak [accessed 2020-04-10]
15. Biesecker M. Global News. 2020 Apr 05. U.S. ‘wasted’ months before preparing for COVID-19 pandemic: former health
secretary URL: https://globalnews.ca/news/6780562/coronavirus-covid-wasted-months/ [accessed 2020-04-10]
16. Hoffman SJ, Silverberg SL. Delays in global disease outbreak responses: lessons from H1N1, Ebola, and Zika. Am J Public
Health 2018 Mar;108(3):329-333. [doi: 10.2105/AJPH.2017.304245] [Medline: 29345996]
17. Holmes BJ. Communicating about emerging infectious disease: the importance of research. Health Risk Soc 2008
Aug;10(4):349-360. [doi: 10.1080/13698570802166431]
18. Vaughan E, Tinker T. Effective health risk communication about pandemic influenza for vulnerable populations. Am J
Public Health 2009 Oct;99(S2):S324-S332. [doi: 10.2105/ajph.2009.162537]
19. Wong JEL, Leo YS, Tan CC. COVID-19 in Singapore-current experience: critical global issues that require attention and
action. JAMA 2020 Feb 20:e. [doi: 10.1001/jama.2020.2467] [Medline: 32077901]
20. Vijaykumar S, Jin Y, Nowak G. Social media and the virality of risk: the risk amplification through media spread (RAMS)
model. J Homeland Secur Emerg Manage 2015:653. [doi: 10.1515/jhsem-2014-0072]
http://www.jmir.org/2020/5/e19334/ J Med Internet Res 2020 | vol. 22 | iss. 5 | e19334 | p. 10
(page number not for citation purposes)
XSL• FO
RenderXJOURNAL OF MEDICAL INTERNET RESEARCH Sesagiri Raamkumar et al
21. Vijaykumar S, Meurzec R, Jayasundar K, Pagliari C, Fernandopulle Y. What’s buzzing on your feed? Health authorities’
use of Facebook to combat Zika in Singapore. J Am Med Informatics Assoc 2017;24(6):1159. [doi: 10.1093/jamia/ocx028]
22. Lwin M, Lu J, Sheldenkar A, Schulz P. Strategic uses of Facebook in Zika outbreak communication: implications for the
crisis and emergency risk communication model. Int J Environ Res Public Health 2018 Sep 10;15(9):1974. [doi:
10.3390/ijerph15091974] [Medline: 30201929]
23. Mamidi R, Miller M, Banerjee T, Romine W, Sheth A. Identifying key topics bearing negative sentiment on Twitter: insights
concerning the 2015-2016 Zika epidemic. JMIR Public Health Surveill 2019 Jun 04;5(2):e11036. [doi: 10.2196/11036]
[Medline: 31165711]
24. de Araujo DHM, de Carvalho EA, da Motta CLR, da Silva Borges MR, Gomes JO, de Carvalho PVR. Social networks
applied to Zika and H1N1 epidemics: a systematic review. Springer, Cham 2019:679. [doi: 10.1007/978-3-319-96089-0_74]
25. Strekalova YA. Health risk information engagement and amplification on social media. Health Educ Behav 2017
Apr;44(2):332-339. [doi: 10.1177/1090198116660310] [Medline: 27413028]
26. Vijaykumar S, Nowak G, Himelboim I, Jin Y. Virtual Zika transmission after the first U.S. case: who said what and how
it spread on Twitter. Am J Infect Control 2018 May;46(5):549-557. [doi: 10.1016/j.ajic.2017.10.015] [Medline: 29306490]
27. World Health Organization. 2018 Jan 10. Communicating risk in public health emergencies: a WHO guideline for emergency
risk communication (ERC) policy and practice URL: https://www.who.int/risk-communication/guidance/download/en/
[accessed 2020-04-09]
28. Glik DC. Risk communication for public health emergencies. Annu Rev Public Health 2007;28:33-54. [doi:
10.1146/annurev.publhealth.28.021406.144123] [Medline: 17222081]
29. Jünger J, Keyling T. GitHub. 2019. Facepager URL: https://github.com/strohne/Facepager/ [accessed 2020-04-06]
30. Facebook. Ministry of Health, Singapore URL: https://www.facebook.com/sghealthministry [accessed 2020-05-08]
31. Facebook. CDC URL: https://www.facebook.com/CDC [accessed 2020-05-08]
32. Facebook. Public Health England URL: https://www.facebook.com/PublicHealthEngland/ [accessed 2020-05-08]
33. Ministry of Health. 2020 Jan 02. Precautionary measures in response to severe pneumonia cases in Wuhan, China URL:
https://www.moh.gov.sg/news-highlights/details/
precautionary-measures-in-response-to-severe-pneumonia-cases-in-wuhan-china [accessed 2020-04-10]
34. Erlingsson C, Brysiewicz P. A hands-on guide to doing content analysis. Afr J Emerg Med 2017 Sep;7(3):93-99. [doi:
10.1016/J.AFJEM.2017.08.001]
35. Hutto C, Gilbert E. VADER: a parsimonious rule-based model for sentiment analysis of social media text. AAI Publications,
Eighth International AAAI Conference on Weblogs and Social Media 2014:A [FREE Full text]
36. Plutchik R. Emotions: a general psychoevolutionary theory. In: Approaches to Emotion. London: Psychology Press; May
22, 2014:A.
37. Felbo B, Mislove A, Søgaard A, Rahwan I, Lehmann S. Using millions of emoji occurrences to learn any-domain
representations for detecting sentiment, emotion and sarcasm. 2017 Presented at: 2017 Conference on Empirical Methods
in Natural Language Processing; September 2017; Copenhagen, Denmark. [doi: 10.18653/v1/d17-1169]
38. Evers C, Adriaanse M, de Ridder DT, de Witt Huberts JC. Good mood food. Positive emotion as a neglected trigger for
food intake. Appetite 2013 Sep;68:1-7. [doi: 10.1016/j.appet.2013.04.007] [Medline: 23602962]
39. Al-Hajjar D, Syed A. Applying sentiment and emotion analysis on brand tweets for digital marketing. 2015 Dec 21 Presented
at: 2015 IEEE Jordan Conference on Applied Electrical Engineering and Computing Technologies (AEECT); 3-5 Nov
2015; Amman, Jordan. [doi: 10.1109/aeect.2015.7360592]
40. Daniulaityte R, Lamy F, Smith G, Nahhas R, Carlson R, Thirunarayan K, et al. "Retweet to pass the blunt": analyzing
geographic and content features of cannabis-related tweeting across the United States. J Stud Alcohol Drugs 2017
Nov;78(6):910-915 [FREE Full text] [doi: 10.15288/jsad.2017.78.910] [Medline: 29087826]
41. Cheng J, Bernstein M, Danescu-Niculescu-Mizil C, Leskovec J. Anyone can become a troll: causes of trolling behavior in
online discussions. 2017 Presented at: 2017 ACM Conference on Computer Supported Cooperative Work and Social
Computing; 2017; New York, NY p. 1217-1230. [doi: 10.1145/2998181.2998213]
42. Google. Perspective API URL: https://www.perspectiveapi.com/#/home [accessed 2020-04-06]
43. Sharma M, Yadav K, Yadav N, Ferdinand KC. Zika virus pandemic-analysis of Facebook as a social media health information
platform. Am J Infect Control 2017 Mar 01;45(3):301-302. [doi: 10.1016/j.ajic.2016.08.022] [Medline: 27776823]
44. CDC. Social media public comment policy URL: https://www.cdc.gov/socialmedia/tools/CommentPolicy.html [accessed
2020-05-08]
45. The Washington Post. 2020. Trump calling coronavirus "Chinese virus" encourages racism against Asian Americans,
experts say URL: https://www.washingtonpost.com/nation/2020/03/20/coronavirus-trump-chinese-virus/ [accessed
2020-04-09]
46. Facebook. Coronavirus (COVID-19) Information Centre URL: https://www.facebook.com/coronavirus_info/ [accessed
2020-04-10]
47. Google. COVID-19 information & resources URL: https://www.google.com/covid19/ [accessed 2020-04-13]
http://www.jmir.org/2020/5/e19334/ J Med Internet Res 2020 | vol. 22 | iss. 5 | e19334 | p. 11
(page number not for citation purposes)
XSL• FO
RenderXJOURNAL OF MEDICAL INTERNET RESEARCH Sesagiri Raamkumar et al
Abbreviations
API: application program interface
CDC: Centers for Disease Control and Prevention
COVID-19: coronavirus disease
CPP: comments per post
DORSCON: Disease Outbreak Response System Condition
LPTC: likes per toxic comment
MOH: Ministry of Health
PHA: public health authority
PHE: Public Health England
PNER: positive to negative emotions ratio
PNSR: positive to negative sentiment ratio
PPD: posts per day
RPP: reactions per post
SARS: severe acute respiratory syndrome
SP: sentiment polarity
SPP: shares per post
WHO: World Health Organization
Edited by G Eysenbach; submitted 13.04.20; peer-reviewed by G Nowak, A Dormanesh, A Natale, C Mather; comments to author
06.05.20; revised version received 11.05.20; accepted 12.05.20; published 19.05.20
Please cite as:
Sesagiri Raamkumar A, Tan SG, Wee HL
Measuring the Outreach Efforts of Public Health Authorities and the Public Response on Facebook During the COVID-19 Pandemic
in Early 2020: Cross-Country Comparison
J Med Internet Res 2020;22(5):e19334
URL: http://www.jmir.org/2020/5/e19334/
doi: 10.2196/19334
PMID:
©Aravind Sesagiri Raamkumar, Soon Guan Tan, Hwee Lin Wee. Originally published in the Journal of Medical Internet Research
(http://www.jmir.org), 19.05.2020. This is an open-access article distributed under the terms of the Creative Commons Attribution
License (https://creativecommons.org/licenses/by/4.0/), which permits unrestricted use, distribution, and reproduction in any
medium, provided the original work, first published in the Journal of Medical Internet Research, is properly cited. The complete
bibliographic information, a link to the original publication on http://www.jmir.org/, as well as this copyright and license information
must be included.
http://www.jmir.org/2020/5/e19334/ J Med Internet Res 2020 | vol. 22 | iss. 5 | e19334 | p. 12
(page number not for citation purposes)
XSL• FO
RenderXYou can also read