Gender inequality in COVID-19 times: evidence from UK prolific participants
←
→
Page content transcription
If your browser does not render page correctly, please read the page content below
Journal of Demographic Economics (2021), 1–27
        doi:10.1017/dem.2021.2

        R E S E A R C H PA P E R

        Gender inequality in COVID-19 times: evidence
        from UK prolific participants
        Sonia Oreffice1,2,3 and Climent Quintana-Domeque1,2,3,4*
        1
         Department of Economics, Business School, University of Exeter, Exeter, UK, 2Department of Economics,
        HCEO, University of Chicago, Chicago, IL, USA, 3IZA, Bonn, Germany and 4GLO, Essen, Germany
        *Corresponding author. E-mail: c.quintana-domeque@exeter.ac.uk

        (Received 10 July 2020; revised 18 January 2021; accepted 19 January 2021)

            Abstract
            We investigate gender differences across multiple dimensions after 3 months of the first
            UK lockdown of March 2020, using an online sample of approximately 1,500 Prolific
            respondents’ residents in the UK. We find that women’s mental health was worse than
            men along the four metrics we collected data on, that women were more concerned
            about getting and spreading the virus, and that women perceived the virus as more
            prevalent and lethal than men did. Women were also more likely to expect a new
            lockdown or virus outbreak by the end of 2020, and were more pessimistic about the
            contemporaneous and future state of the UK economy, as measured by their forecasted
            contemporaneous and future unemployment rates. We also show that between earlier
            in 2020 before the outbreak of the Coronavirus pandemic and June 2020, women had
            increased childcare and housework more than men. Neither the gender gaps in
            COVID-19-related health and economic concerns nor the gender gaps in the increase
            in hours of childcare and housework can be accounted for by a rich set of control
            variables. Instead, we find that the gender gap in mental health can be partially
            accounted for by the difference in COVID-19-related health concerns between men and
            women.

        Key words: Anxiety; charity giving; childcare; concerns; Coronavirus; employment; housework; inequity;
        mental health; perceptions; sex; time allocation; wellbeing
        JEL classification: H1; J1; J16

        1. Introduction
        We collected primary data on mental health, COVID-19-related health and economic
        concerns, time allocation to market and household production, protective behaviors and
        donations via an online survey of 1,500 Prolific respondents in the UK to study gender
        differences in COVID-19 times. Conditional on participating in our survey, respondents
        were chosen to be representative of the UK population by age, sex, and ethnicity. The
        data were collected on 19 June 2020, during the first minor easing of the first lockdown
        in the UK. The main findings of our study can be grouped into six blocks.
        © Université catholique de Louvain 2021. This is an Open Access article, distributed under the terms of the Creative
        Commons Attribution licence (http://creativecommons.org/licenses/by/4.0/), which permits unrestricted re-use,
        distribution, and reproduction in any medium, provided the original work is properly cited.

Downloaded from https://www.cambridge.org/core. IP address: 46.4.80.155, on 21 Apr 2021 at 02:08:13, subject to the Cambridge Core terms
of use, available at https://www.cambridge.org/core/terms. https://doi.org/10.1017/dem.2021.2
2       Sonia Oreffice and Climent Quintana‐Domeque

              First, women’s mental health in mid-June was worse than men along several
          dimensions: generalized anxiety disorder 7-item scale (GAD-7), depression, panic
          attacks, and loneliness. The relative gender gaps (% higher than men) in mental
          health problems were sizeable, going from 81% in having experienced an anxiety
          attack to 22% in feeling depressed. Although not directly comparable, Banks and Xu
          (2020) show that women’s mental health status in the UK in April 2020, as
          measured by changes in the General Health Questionnaire 12-item scale (GHQ-12)
          in the UK Household Longitudinal Study (UKHLS), deteriorated relative to that of
          men comparing pre-COVID-19 pandemic and during-COVID-19 pandemic data,
          and the magnitude was pretty large.1 Using the same dataset and measure, Davillas
          and Jones (2020) document that age and gender account for the largest share in
          explaining GHQ-12 differences in the COVID-19 period.
              Second, women exhibited more concerns about getting and spreading the virus (12%
          and 8% higher than men, respectively), consistent with Galasso et al. (2020) who found
          that women were more likely to see COVID-19 as a serious health problem. Moreover,
          we find that women perceived the virus as more prevalent and lethal than men did (31%
          and 39% higher than men, respectively). This is interesting because, on one hand,
          women make up more than half of the infected individuals in European countries
          [Lewandowski et al. (2020)], and where women participate more fully in the labor
          market, they might be more susceptible to COVID-19 than men [Adams (2020)]. On
          the other hand, mortality rates from COVID-19 are higher for men than women
          [SAGE (2020), Yanez et al. (2020)].
              Third, women’s expectations of a new lockdown or virus outbreak by the end of
          2020 were 0.18–0.20 standard deviations (SD) higher than those of men. Women
          were more pessimistic about the contemporaneous and future state of the UK
          economy, consistently predicting a higher unemployment rate in June 2020,
          December 2020, and June 2021. In particular, women’s forecasted unemployment in
          June 2021 was 15% (0.24 SD) higher than that for men. These disparities do not
          appear to be driven by misunderstandings of what the unemployment rate is or
          different levels of attention to the survey by gender.2
              Fourth, between earlier in 2020 before the outbreak of the Coronavirus pandemic and
          June 2020, women had increased their weekly time allocated to both childcare, between
          3.4 and 3.9 h, and housework, between 2.3 and 2.8 h, consistent with previous research
          [Andrew et al. (2020), Hupkau and Petrongolo (2020), Sevilla and Smith (2020)].3

              1
              The deterioration in women’s mental health relative to men’s mental health was of the size of the
          pre-COVID-19 mental health gender gap (as measured during the period January 2017–May 2019).
          Using the same data, Etheridge and Spantig (2020) document similar gender differences and Daly et al.
          (2020) find higher increases in mental health problems (GHQ-12 ≥ 3) for women. Still, using the same
          data, Proto and Quintana-Domeque (2021) document a drop in mental wellbeing by ethnicity and
          gender, showing that the gender gap in mental wellbeing has increased among White British
          individuals. Adams-Prassl et al. (2020a) use US data and the lockdowns across states in March and
          April to show that mental health decreased as a consequence of the “stay-at-home” lockdown, and
          highlight that this negative effect is entirely due to women, a 66% increase in the existing gender gap in
          mental health.
             2
              Following the setup of Andre et al. (2019), respondents were provided with the definition of the
          unemployment rate, and also with its March 2020 level. Moreover, individuals did not exhibit different
          attention levels or survey experience by gender.
             3
              Del Boca et al. (2020) find that in Italy the additional workload in the household falls on women.
          Similarly, Farré et al. (2020) document that most of the burden fell on women in Spain.

Downloaded from https://www.cambridge.org/core. IP address: 46.4.80.155, on 21 Apr 2021 at 02:08:13, subject to the Cambridge Core terms
of use, available at https://www.cambridge.org/core/terms. https://doi.org/10.1017/dem.2021.2
Journal of Demographic Economics 3
We do not find statistically significant gender gaps in the changes in hours of work and
the incidence of job loss or furloughing, consistent with the findings in Hupkau and
Petrongolo (2020) using UKHLS data, although our estimated gaps are somewhat
similar in size to those reported by Adams-Prassl et al. (2020b, 2020c) using real-time
surveys.
Fifth, the COVID-19 pandemic is likely to affect people’s donations because of both
(a) changes in government policy and (b) changes in uncertainty about future health/
economic outcomes (Scharf, 2020). In this regard, we find that women donated to food
banks 5 out of 50 pence (31% or 0.31 SD) more than men.
Finally, neither the gender gaps in COVID-19-related health and economic concerns
nor the gender gaps in the increase in hours of childcare and housework can be
accounted for by a rich set of control variables including number of children living
in the house (by age category), number of “seniors” living in the house (individuals
aged 60 or plus), full-time job indicator, healthcare worker indicator, and
employment shocks (having being furloughed due to the coronavirus pandemic,
having suffered a job loss due to coronavirus pandemic). Instead, we find that the
gender gap in mental health can be partially accounted for by the gap in
COVID-19-related health concerns between men and women, but not by differences
in economic concerns due to the pandemic.
Our empirical analysis provides a dramatic picture within 3 months after the
beginning of the COVID-19 pandemic. The gender dimension of COVID-19 should
be on the radar of policy-makers, and join Adams (2020), Alon et al. (2020),
Hupkau and Petrongolo (2020) and Lewandowski et al. (2020), amongst others, to
call for more COVID-19 gender-related research and policy analysis. Women
represent half of the population, they are key to family structure and early human
capital accumulation, and they are more vulnerable to domestic violence, poverty,
and single parenthood. The gender gaps after 3 months of the first lockdown that we
document in this paper are worrisome for the UK economy and deserve further
scrutiny.
The next section provides a description of how we obtained our primary data, how it
compares to a nationally representative dataset, and the main characteristics of our
respondents. Section 3 describes our methodology. Section 4 presents and discusses
our estimated unadjusted and adjusted gender gaps. Section 5 investigates additional
factors that may explain the adjusted gaps. Section 6 concludes.
2. Data description
2.1. Collected dataset: BIDCOFU survey
We collected a sample of approximately 1,500 UK respondents in Prolific, an online
platform that connects researchers with participants, who get paid cash for taking
part in the research.4 Conditional on participating in our survey, the sample is
representative of the UK population with regards to age, sex and ethnicity.5
We launched our survey on 19 June 2020, at 10:40 am (GMT + 1). The survey was
announced with the title “BIDCOFU Survey” and the following brief summary:
4
We paid £1.50 to each respondent for a completed survey. The median duration was 12 minutes.
5
Prolific allows for the possibility of obtaining representative samples for an extra fee by cross-stratifying
on sex (male or female), age (18–27, 28–37, 38–47, 48–57, or 58+) and ethnicity (Asian, Black, Mixed,
Other, or White).
Downloaded from https://www.cambridge.org/core. IP address: 46.4.80.155, on 21 Apr 2021 at 02:08:13, subject to the Cambridge Core terms
of use, available at https://www.cambridge.org/core/terms. https://doi.org/10.1017/dem.2021.24 Sonia Oreffice and Climent Quintana‐Domeque
This study is conducted by researchers from the University of Exeter. Participants
will be asked to answer a set of questions on demographic patterns. This includes
questions that may be sensitive, including but not limited to questions related to
Coronavirus.
When restricting the attention to representative samples, the maximum number of
respondents that Prolific can provide in a given day is approximately 1,500, and this
was our targeted sample size. In practice, we ended up collecting data on 1,503
respondents. After dropping observations whose gender did not match the one
provided by Prolific (7), whose age was older or at least 2 years younger than that
provided by Prolific (33), or whose answers to their geographical location of residence
(asked twice in the survey) differed (4), our maximum sample size becomes 1,461 (757
women, 704 men). Due to connectivity and/or logistic reasons, 3 respondents could
not complete the survey. This means that for some questions located towards the end
of the survey we have responses for 1,458 respondents. We also note that some
variables have a smaller number of observations because they are based on questions
asked conditional on the answer to previous questions.6 The questionnaire, data, and
replication files are available online.7 A full description of the main variables used in
this article is available in Supplementary Material Appendix A.
2.2. Comparison with other datasets: BIDCOFU vs. UKHLS Covid-19 study
Table B1 in Supplementary Material Appendix B compares the average characteristics
of our respondents (N = 1,461) in our June 2020 survey (BIDCOFU) against those of
the respondents (N = 14,021) in the June 2020 Covid-19 study (UKHLS), which
provides a large and representative sample of the UK population, and is available
from the UK data service.8
The fraction of women is essentially the same in both samples, 0.52 in our sample
compared with 0.53 in the UKHLS sample. The fraction of white individuals is about
5 percentage points (pp) smaller in BIDCOFU than in the UKHLS (0.86 vs. 0.91,
p-value < 0.01). The age distributions across datasets are different: the fraction of
individuals 65 and plus is 10 pp smaller in our sample compared to the nationally
representative sample (0.14 vs. 0.25, p-value < 0.01). In terms of geographical location,
the distribution of respondents is quite similar across both datasets, the largest difference
being in London, reflecting both the age and ethnicity differences across samples.
Exploring household characteristics, we find small differences in terms of household
size (2.6 in BIDOCFU vs. 2.8 in UKHLS) and the fraction of individuals living with a
partner (0.64 vs. 0.62), and no differences in the fraction of individuals with children in
the household (0.28 vs. 0.27).
Regarding time allocation in the labor market and housework, we find that the
fraction of employed individuals in our sample is 3 pp larger than that in the
6
For instance, the question on concerns of getting coronavirus was not asked to the seven people who
had answered that they tested positive to the virus in the previous question. For more details, see the
questionnaire.
7
https://sites.google.com/site/climentquintanadomeque/covid-19-data
8
University of Essex, Institute for Social and Economic Research. Understanding Society: COVID-19
Study, 2020. [data collection]. 4th Edition, 2020. UK Data Service. SN: 8644, http://doi.org/10.5255/
UKDA-SN-8644-4. N=14,021 because we focus on individuals aged 18 and above. Without the age
restriction, N = 14,123.
Downloaded from https://www.cambridge.org/core. IP address: 46.4.80.155, on 21 Apr 2021 at 02:08:13, subject to the Cambridge Core terms
of use, available at https://www.cambridge.org/core/terms. https://doi.org/10.1017/dem.2021.2Journal of Demographic Economics 5
UKHLS dataset (0.63 vs. 0.60, p-value < 0.05), reflecting the differences in the age
distributions across datasets. The average number of weekly hours of work is 22.8 in
BIDCOFU and 26.5 in the UKHLS dataset, a gap of 3.7 h (p-value < 0.01). Regarding
childcare and housework, we find that the average time allocated to childcare
activities per week is 10.4 h in our sample vs. 13.0 h in the UKHLS sample (p-value
< 0.01), and the average time allocated to housework per week is 24.9 h in our
sample vs. 11.6 h in the UKHLS sample (p-value < 0.01).9
Finally, regarding loneliness, which was asked in exactly the same way in both
surveys, it appears that our BIDCOFU respondents report to feel lonely more often
than the respondents in the June Covid-19 study, the former being 5.8 pp more
likely to report feeling lonely some of the time or often than the latter (p-value < 0.01).
2.3. Average characteristics of BIDCOFU respondents
Table B2 in Supplementary Material Appendix B summarizes the main sociodemographic
and economic characteristics of our sample by gender. Men and women are similar along
several dimensions: there are no gender gaps in the fraction of non-white individuals in
the sample, in the distribution of age groups, in the distribution of the geographic location
of residence, in the fraction living in urban areas, or in the distribution of educational
categories.10
No differences are observed regarding household composition, in terms of living with
a partner or with others (any other person in the household but the respondent), but
remarkable gender gaps appear when focusing on employment status and the income
distribution. Of the total, 44.6% of men are employed working from home, while this
figure is 5.6 percentage points lower for women, 39% (p-value = 0.029). Also, 33% of
women are not in the labor force, while this percentage is 10 pp lower for men, 23%
(p-value = 0.000). These June monthly figures compared with 27.9% for women and
20.9% for men based on the quarterly employment rates from June to August 2020
[Office for National Statistics, ONS (2020a)].
Finally, the fraction of women with the lowest income category (Less than £15,000)
is 32% while among men is 19% (p-value = 0.000), and the fraction of women with
income between £45,000 and £49,999 is 7% while among men is 14% (p-value =
0.000). The average income in 2019 is £30,049 among men and £27,031 among
women, an average income gap of £3,018 (p-value = 0.000).11 This 10% gender gap
9
While we report several differences in the allocation of time to labor market and household activities, it
is important to acknowledge that there are differences in the way these variables are constructed or
measured in the two surveys. In the UKHLS, hours of work are only asked to individuals who reported
being employed (sempderived= 1, 2, 3), while they are asked to everybody in our Prolific survey. In the
UKHLS, hours of childcare are only asked to individuals who report having children up to age 18
(hhcompa > 0 OR hhcompb > 0 OR hhcompc > 0), while they are asked to everybody in our Prolific
sample. Finally, the maximum number of hours of childcare and hours of housework in the UKHLS is
capped at 144, while in our Prolific survey is capped at 168.
10
The only two exceptions are the non-statistically significant difference in the higher fraction of women
aged 55–64 (25.4%) than of men (21.7%), and the statistically significant higher fraction of men with a
trade/technical/vocational training (12%) than that for women (7.5%).
11
We construct our (discrete) income measure by assigning the midpoint value of each interval for
intervals other than the top and the bottom. For the bottom and the top intervals, we take the
maximum value (of the bottom interval) and the minimum value (of the top interval). The intervals are
as follows: less than £15,000, £15,000–£19,999, £20,000–£24,999, £25,000–£29,999, £30,000–£34,999,
£35,000–£39,999, £40,000–£44,999, £45,000–£49,999, and more than £50,000.
Downloaded from https://www.cambridge.org/core. IP address: 46.4.80.155, on 21 Apr 2021 at 02:08:13, subject to the Cambridge Core terms
of use, available at https://www.cambridge.org/core/terms. https://doi.org/10.1017/dem.2021.26 Sonia Oreffice and Climent Quintana‐Domeque
in total income before tax in 2019 compares with the gender pay gap among all
employees of 17.4% [ONS (2020b)].
3. Methodology: short vs. long regressions
We compute unadjusted (b S) and adjusted (b L) average gender gaps, obtained from
estimating “short” and “long” linear regressions by means of ordinary least squares.
The “short” regression is given by:
yi = aS + bS Fi + eSi ,
where yi is the outcome for respondent i, Fi is a female indicator ( = 1 if respondent i is
female, = 0 if respondent i is male), and eSi is the regression residual of this “short”
regression. The “long” regression is given by:
yi = aL + bL Fi + cXi + eLi ,
where Xi is a vector of standard sociodemographic control variables (age, ethnicity,
education, family structure, income in 2019, current employment status, place of
residence and rural-urban area) and eLi is the regression residual of this “long”
regression.12 We report estimates of the absolute gender gap b S (resp. b L) and the
relative gender gap, defined as b S (resp. b L) divided by the mean of yi among men in
%, and the robust to heteroskedasticity p-values for both b S and b L, which contain
information against the null hypothesis of no gender gap (b S = 0 and b L = 0,
respectively). We discuss both statistical significance and economic relevance.
4. Unadjusted vs. adjusted gender gaps
Before diving into the main results of our paper, we briefly report that we also
investigated average gender differences in the degree of patience13, duration in
minutes (to complete the survey), attention to the survey questions14, and
participation in Coronavirus-related surveys so far. There is no gender gap in the
average degree of patience (1.6%, p-value = 0.225), average duration (−1.2%, p-value
= 0.734), and attention to the survey (−0.7%, p-value = 0.521). However, women
appear to have completed on average about 1 fewer Coronavirus-related studies than
12
The actual list of control variables is as follows: an indicator for ethnicity other than white, five age
indicators (18–24, 25–34, 35–44, 55–64 and 65+), eleven geographic location indicators, one indicator of
area of residence (urban/rural area), seven education indicators, one indicator of living with a partner
(married or cohabiting), one indicator of living with other people in the household, log of income in
2019, and three indicators on the current employment situation (working outside home, working from
home, being unemployed). For work-related variables, we only include a control for the current
employment situation (working outside/from home) and drop the age indicator 65+ since our focus is
on individuals aged 18–64. See Appendix A for the details on the control variables.
13
Based on the item 2 question from the time discounting module in Table 4 of Falk et al. (2016). See
also Falk et al. (2018).
14
Attention to the survey is measured by checking whether the individual remembers a piece of
information given in the survey. In particular, in the last block of questions individuals are told the
unemployment rate in March (3.9%). Then, a few questions later, they are asked about that same
unemployment rate in a multiple choice question (2.9%, 3.9%, 4.9%, 5.9%, 6.9% and 7.9%). 95% of the
respondents choose 3.9% and are considered to pay attention to the survey.
Downloaded from https://www.cambridge.org/core. IP address: 46.4.80.155, on 21 Apr 2021 at 02:08:13, subject to the Cambridge Core terms
of use, available at https://www.cambridge.org/core/terms. https://doi.org/10.1017/dem.2021.2Journal of Demographic Economics 7
men (11%, p-value = 0.007). We have also investigated whether there were gender
differences about the perception of how the UK government handled the UK
Coronavirus crisis and the Brexit negotiations, failing to find any (results available
upon request). Thus, it does not appear that women had more negative views than
men in general. All of these differences are essentially the same, in sign and
magnitude, after adjusting for control variables.
4.1. Wellbeing: mental and physical health
This subsection focuses on mental and physical wellbeing. In Table 1, we investigate
gender gaps in mental health measures—GAD-7,15 depression indicator based on
item two of the PHQ-9,16 anxiety/panic attack indicator17—and a loneliness
indicator.18 Women reported worse levels of mental health in the last 2 weeks than
men and a higher degree of loneliness in the last 4 weeks.
First, women’s GAD-7 (0–21) average anxiety score was 5.32, 1.07 units above (or 25%
higher than) that of men. The GAD-7 gap in SD is 0.22, which compares with a gap of
approximately 0.28 SD in the GHQ-1219 among respondents to the June wave of the
Covid-19 study (UKHLS).20 Second, the average female indicator on feeling down,
depressed or hopeless (0–3)—from 0 (not at all) to 3 (nearly every day)—was 0.86,
0.16 units (0.19 SD) above (or 22% higher than) that of males. Third, 25.8% of
women reported having had an anxiety attack (suddenly feeling fear or panic), while
this percentage decreases to 14.2% among men. Hence, women were 11.6 pp (81%)
more likely than men to have had an anxiety attack. Last but not least, women also
seem to feel lonely more frequently than men, scoring 0.09 units (0.14 SD) above (or
6% higher than) that of men in the loneliness indicator (1–3). If anything, this
difference is smaller than the 0.17 units gender gap based on the June wave of the
Covid-19 study (UKHLS): 1.57 (among women) vs. 1.40 (among men), p-value < 0.001.
The GAD-7 appears to be highly reliable as judged by its Cronbach’s alpha, which is
0.92. Its validity, as measured by its Pearson correlation coefficients with the other
indicators in Table 1, is high as well. The correlation coefficient between the GAD-7
and the depression indicator (item 2 of the PHQ-9) is 0.75 (p-value = 0.000),
15
The Generalized Anxiety Disorder 7-item scale (GAD-7) is a validated diagnostic tool designed for use
in the primary care setting. It follows the DSM-IV diagnostic criteria for generalized anxiety disorder and is
sensitive to the presence of social phobia, panic disorder, and post-traumatic stress disorder [Spitzer et al.
(2006)]. The GAD-7 screener is available at: https://www.phqscreeners.com/images/sites/g/files/g10060481/
f/201412/GAD-7_English.pdf
16
The PHQ-9 is the depression module of the PHQ (Patient Health Questionnaire), a reliable and valid
measure of depression severity [Kroenke et al. (2001)]. The second item of the PHQ-9 asks: “Over the last 2
weeks, how often have you been bothered by feeling down, depressed or hopeless? Not at all (0), several
days (1), more than half the days (2), and nearly every day (3).” The PHQ-9 screener is available at:
https://www.phqscreeners.com/images/sites/g/files/g10060481/f/201412/PHQ-9_English.pdf.
17
Based on a question from the online NHS mood self-assessment questionnaire: https://www.nhs.uk/
conditions/stress-anxiety-depression/mood-self-assessment/.
18
Based on the question sclonely_cv from UKHLS: https://www.understandingsociety.ac.uk/
documentation/covid-19/dataset-documentation/variable/sclonely_cv.
19
A well-known self-report instrument for evaluating mental health [Goldberg and Williams (1988)].
20
University of Essex, Institute for Social and Economic Research (2020). Understanding Society:
COVID-19 Study, 2020. [data collection]. 5th Edition. UK Data Service. SN: 8644, http://doi.org/10.
5255/UKDA-SN-8644-5
Downloaded from https://www.cambridge.org/core. IP address: 46.4.80.155, on 21 Apr 2021 at 02:08:13, subject to the Cambridge Core terms
of use, available at https://www.cambridge.org/core/terms. https://doi.org/10.1017/dem.2021.28 Sonia Oreffice and Climent Quintana‐Domeque
Table 1. Mental health and wellbeing
GAD-7 Depressed Anxiety Loneliness
(0–21) (0–3) (0–1) (1–3)
Mean for Men 4.257 0.707 0.142 1.523
N for Men 704 704 704 704
Mean for Women 5.322 0.863 0.258 1.616
N for Women 757 757 757 757
Mean difference 1.065 0.155 0.116 0.093
Adjusted mean difference 1.040 0.148 0.108 0.092
% Mean difference 25.0% 21.9% 81.3% 6.1%
% Adj. mean difference 24.4% 20.9% 76.0% 6.0%
p-value mean difference 0.000 0.000 0.000 0.008
p-value adj. mean diff. 0.000 0.001 0.000 0.006
N (without controls) 1,461 1,461 1,461 1,461
N (with controls) 1,458 1,458 1,458 1,458
Note: p-values robust to heteroscedasticity. Difference is computed as the coefficient on a female indicator on a
regression of the outcome on each column against a female indicator and a constant. Adjusted difference is computed in
the same way after including the following control variables: ethnicity indicator (1 if non-white, 0 if white), age
indicators, education indicators, couple indicator, living with others indicator, log of income in 2019, employment status
indicators, rural/urban indicator, geographical location of residence indicators.
between the GAD-7 and the anxiety indicator is 0.54 (p-value = 0.000), and between the
GAD-7 and the loneliness indicator is 0.47 (p-value = 0.000).
The gender gaps are robust to adjusting for standard sociodemographic control
variables: ethnicity, age, education, living with a partner, living with others, log of
income in 2019, current employment status, living in a rural/urban area, and
geographical location of residence.
In Table B3 in Supplementary Material Appendix B we investigate gender gaps in
physical health—e.g., self-reported health status, underlying health condition—and
health-related behaviors—e.g., smoking, flu vaccine. Three statistically significant and
sizeable differences, which are robust to adjusting for standard sociodemographic
characteristics, stand out, regarding obesity, drinking alcohol, and going out.
First, women’s obesity rate was estimated at 26.3%, while the one for men at 18.8%,
so that women were 7.5 pp (40%) more likely than men to be obese (body mass index
⩾30). While the figure for women is 2.7 pp below to the 29% figure from the Health
Survey for England (HSE) 2018, the one for men is more than 10 pp below the 26%
figure from the HSE 2018 [HSE (2020)]. Part of this discrepancy might be explained
by reporting issues.21
Second, women were 5 pp (19%) less likely than men to drink alcohol: 31.7% of
women reported not drinking alcohol compared with 26.6% of men. This 5.1 pp gap
21
We constructed the body mass index variable based on self-reported weight and height. Weight and
height were asked in the metric system: How tall are you (in centimetres)? How much do you weigh (in
kilograms)? However, some of the respondents struggled reporting in this system rather than the
imperial one. We gathered this information from the last question of the survey, which asked
participants to provide any comments or feedback on the survey.
Downloaded from https://www.cambridge.org/core. IP address: 46.4.80.155, on 21 Apr 2021 at 02:08:13, subject to the Cambridge Core terms
of use, available at https://www.cambridge.org/core/terms. https://doi.org/10.1017/dem.2021.2Journal of Demographic Economics 9
compares with a 4.5 pp gap based on 2017 data from the Opinions and Lifestyle Survey
[ONS (2018)], where the fraction of women reporting being teetotal was 22.6% while
that of men was 18.1%.
Third, women were 10 pp (31%) more likely than men to have not gone out of their
home the day before the survey: 42% of women compared with 32% of men.
We do not find statistically significant or economically important gender differences
in the average self-reported health status (1 if good or very good, 0 otherwise), in the
prevalence of chronic conditions, in having had the flu vaccine this season, or in
having had fever or cough in the last days. Women were 4 pp (26%) less likely than
men to smoke (similar to the 3.4 pp gap based on 2019 data from the ONS (2020c)
using the Annual Population Survey), but the difference is not statistically significant
at the 5% level after adjusting for control variables.
4.2. Expectations about COVID-19: health risks and economic concerns
In this subsection, we investigate gender gaps in perceptions, concerns, and expectations
regarding health risks and economic concerns related to COVID-19. Table 2 focuses on
COVID-19-related health concerns and risks (e.g., concerns on getting infected, risk of
being positive) and shows that women were more concerned and had more negative
perceptions about COVID-19-health-related risks than men.
First, women were more concerned of getting coronavirus than men, scoring 0.6
units (0.26 SD) above (or 12% higher than) men in the indicator of being concerned
about getting coronavirus (1–10). Second, women were more concerned of spreading
coronavirus than men, scoring 0.5 units (0.19 SD) above (or 8% higher than) men in
the indicator of being concerned about spreading coronavirus (1–10). Third,
women’s perceived coronavirus prevalence was about 4 pp (0.22 SD or 31%) higher
than that of men. Finally, women’s perceived Coronavirus lethality was about 1.5 pp
(0.15 SD or 39%) higher than that of men.
In Table 3 we shift our attention to COVID-19-related economics concerns. In
particular, we focus on the gender differences in expectations on a new lockdown being
necessary before the end of 2020, on another Coronavirus outbreak before the end of
2020, and unemployment rate forecasts. We find that the average level of agreement
that a new lockdown would be necessary before the end of 2020 was larger among
women than men. Female’s average agreement score was 2.95 on a scale of 1 to 4, while
the male’s one was 2.81. This is a difference of 0.14 units (0.18 SD) or 4.8%. Indeed,
there was the second lockdown in the UK from 5 November to 2 December 2020.22
Women were also more likely to think that there would be another Coronavirus outbreak
before the end of 2020. Female’s average agreement score was 3.14 on a scale of 1 to 4, while
the male’s one was 3.0. This is a difference of 0.14 units (0.20 SD) or 4.6%. Once again, there
was a peak in the number of people tested positive on 12 November [Public Health England,
PHE (2020a)], while the number of deaths is still rising [PHE (2020b)].
Regarding economic prospects, women’s perceptions were also more negative than
those of men. Women’s forecasted unemployment rates for June 2020, December
2020, and June 2021 were 0.5, 0.9, and 1.1 percentage points (0.13 SD or 0.8%, 0.20
SD or 10%, 0.24 SD or 15%) larger than those forecasted by men.23 Note that the
22
Pubs, restaurants, gyms and non-essential shops were closed during the lockdown. However, unlike the
restrictions during the first lockdown, schools, colleges and universities remained open.
23
The unemployment rate answer was restricted in the range 0–20% given the historical evolution of the
unemployment rate in the UK: Bank of England, Unemployment Rate in the United Kingdom
Downloaded from https://www.cambridge.org/core. IP address: 46.4.80.155, on 21 Apr 2021 at 02:08:13, subject to the Cambridge Core terms
of use, available at https://www.cambridge.org/core/terms. https://doi.org/10.1017/dem.2021.210 Sonia Oreffice and Climent Quintana‐Domeque
Table 2. COVID-19-related health concerns and risks
Concerned Concerned Prob. Prob.
Getting Spreading Positive Dying
(1–10) (1–10) (0–100) (0–100)
Mean for Men 5.688 6.121 12.733 4.916
N for Men 701 704 704 704
Mean for Women 6.345 6.617 16.613 6.402
N for Women 753 757 757 757
Mean difference 0.658 0.496 3.880 1.485
Adjusted mean difference 0.616 0.496 4.361 1.601
% Mean difference 11.6% 8.1% 30.5% 30.2%
% Adjusted mean difference 10.8% 8.1% 34.2% 32.6%
p-value mean difference 0.000 0.000 0.000 0.004
p-value adj. mean difference 0.000 0.001 0.000 0.002
N (w/o controls) 1,454 1,461 1,461 1,461
N (w/ controls) 1,451 1,458 1,458 1,458
Note: p-values robust to heteroscedasticity. Difference is computed as the coefficient on a female indicator on a
regression of the outcome on each column against a female indicator and a constant. Adjusted difference is computed in
the same way after including the following control variables: ethnicity indicator (1 if non-white, 0 if white), age
indicators, education indicators, couple indicator, living with others indicator, log of income in 2019, employment status
indicators, rural/urban indicator, geographical location of residence indicators.
official estimates of the UK unemployment rate were 4.1% for April–June and 4.8% for
July–September [ONS (2020d)].
Our survey questions on concerns and perceptions were inspired by Fetzer et al.
(2020). While these authors show that the evolution of beliefs about the severity of the
crisis and economic worries does not vary by gender, they do not investigate gender
gaps in participants’ beliefs about either Coronavirus mortality or its contagiousness.
Finally, we note that the difference in the expectation about the COVID-19 vaccine
being found in a year or never was 3 percentage points and not statistically significant.
4.3. COVID-19 and time allocation: labor market and household tasks
In this subsection, we focus on time allocation in the labor market and the household.
Before analyzing the allocation of time in the labor market, it is important to
understand what are (if any) the gender gaps in employment and job characteristics.
4.3.1. COVID-19, employment and job characteristics
Table B4 in Supplementary Material Appendix B displays gender gaps in employment
and job characteristics, focusing on individuals aged 18–64 who reported being
employed in January–February 2020 following Hupkau and Petrongolo (2020).24
[UNRTUKA], retrieved from FRED, Federal Reserve Bank of St. Louis; https://fred.stlouisfed.org/series/
UNRTUKA, June 18, 2020.
24
Hupkau and Petrongolo (2020) focus on individuals aged 16–64, but Prolific participants must be at
least 18 years old: https://www.prolific.co/assets/docs/Participant_Terms.pdf.
Downloaded from https://www.cambridge.org/core. IP address: 46.4.80.155, on 21 Apr 2021 at 02:08:13, subject to the Cambridge Core terms
of use, available at https://www.cambridge.org/core/terms. https://doi.org/10.1017/dem.2021.2of use, available at https://www.cambridge.org/core/terms. https://doi.org/10.1017/dem.2021.2
Downloaded from https://www.cambridge.org/core. IP address: 46.4.80.155, on 21 Apr 2021 at 02:08:13, subject to the Cambridge Core terms
Table 3. COVID-19-related economic concerns and risks
Covid vaccine Lockdown again Covid again UR June 2020 UR Dec 2020 UR June 2021
(0–1) (1–4) (1–4) (0–20) (0–20) (0–20)
Mean for Men 0.232 2.814 2.997 6.957 8.376 7.262
N for Men 704 703 703 703 703 703
Mean for Women 0.260 2.950 3.136 7.487 9.238 8.379
N for Women 757 755 755 755 755 755
Mean difference 0.029 0.136 0.139 0.530 0.863 1.117
Adjusted mean difference 0.030 0.135 0.129 0.548 0.949 1.175
Journal of Demographic Economics
% Mean difference 12.4% 4.8% 4.6% 7.6% 10.3% 15.4%
% Adjusted mean difference 13.0% 4.8% 4.3% 7.9% 11.3% 16.2%
p-value mean difference 0.203 0.001 0.000 0.012 0.000 0.000
p-value adj. mean difference 0.186 0.001 0.001 0.011 0.000 0.000
N (w/o controls) 1,461 1,458 1,458 1,458 1,458 1,458
N (w/ controls) 1,458 1,458 1,458 1,458 1,458 1,458
Note: p-values robust to heteroscedasticity. Difference is computed as the coefficient on a female indicator on a regression of the outcome on each column against a female indicator and a
constant. Adjusted difference is computed in the same way after including the following control variables: ethnicity indicator (1 if non-white, 0 if white), age indicators, education indicators,
couple indicator, living with others indicator, log of income in 2019, employment status indicators, rural/urban indicator, geographical location of residence indicators.
1112 Sonia Oreffice and Climent Quintana‐Domeque
Several important features are worth emphasizing in Table B4, first regarding the
direct impact of the COVID-19 pandemic, and second regarding the type of sector
and job characteristics. In total, 9.5% of women reported having lost their job
because of the Coronavirus pandemic, while the figure for men is 4.1%. Thus,
women were about 5.4 percentage points (133%) more likely than men to have lost
their jobs because of the Coronavirus pandemic. Using UKHLS data from April to
May 2020, Hupkau and Petrongolo (2020) report that 4.4% of men and 4.1% of
women have ever lost their job since January–February 2020. Thus, they do not find
differences between men and women. However, once we control for sociodemographic
characteristics, the gap decreases to 2.1 pp, similar to Adams-Prassl et al. (2020b), and
it is not statistically significant.
Table B4 also shows that 22.3% of men compared with 27.6% of women reported
having been furloughed under the Coronavirus Job Retention Scheme because of the
Coronavirus pandemic.25 Hupkau and Petrongolo (2020) estimate that 30.1% of men
and 27.1% of women have ever been furloughed since January–February 2020. Thus,
they report a −3 pp gap, and we report a 5.5 pp. While Adams-Prassl et al. (2020c)
report an adjusted gender gap of 2.8 pp (p-value < 0.05), our estimated gap is not
statistically significant at the 5% level.
In terms of the type of job and sector, we find that 9% of women reported being
healthcare workers, while the figure for men is 4.6%: Women were 4.3 pp (94%) more
likely than men to be healthcare workers. In all, 7.5% of women reported working for
the NHS, while the percentage for men is 3.3: a gender gap of 4.2 pp (127%).
In terms of full-time vs. part-time employment, 63.2% of women reported working
full-time, while the figure for men is 85.9%. Women were about 23 pp (26%) less
likely than men to work full time. These figures can be compared with the
percentages of full-time employment in 2019 for women and men reported by
Francis-Devine and Foley (2020): about 60% and 90%, respectively, so that the
corresponding gap is 30 pp.
Regarding job characteristics, working women had more physically close to other
people jobs than men. On a scale of 1 (“don’t work near people”) to 5 (“very close
(near touching)”), the index average was 3.77 for women and 3.36 for men, a
difference of 0.41 units (0.35 SD) or about 12%.
The fraction of key workers among men and women was also similar (25.2% among
men and 27.7% among women), and not statistically different.26 Finally, we note that
women reported a higher index of being frequently exposed to disease or infection in
their jobs than men do, but the difference is not statistically significant. The
magnitude of this gender gap is large, 14% (or 0.19 SD/16%, when adjusted), but not
statistically “detectable” (p-value > 0.05) on account of the smaller sample size
(restricted to employed individuals working outside home). The 95% confidence
interval (−0.03, 0.83) is compatible with women facing higher risks in their
workplaces [Adams (2020), Lewandowski et al. (2020)].
25
The Coronavirus Job Retention Scheme in the UK was launched by the government on 20 April 2020.
It allows employers to furlough workers for a minimum of 3 weeks, with the government contributing 80%
of employees’ salaries [Adams-Prassl et al. (2020c)].
26
According to the Institute for Fiscal Studies, 26% of women are key workers compared with 18% of
men: https://www.ifs.org.uk/publications/14763.
Downloaded from https://www.cambridge.org/core. IP address: 46.4.80.155, on 21 Apr 2021 at 02:08:13, subject to the Cambridge Core terms
of use, available at https://www.cambridge.org/core/terms. https://doi.org/10.1017/dem.2021.2Journal of Demographic Economics 13
4.3.2. COVID-19 and time allocation in the labor market
We now focus on time allocation in the labor market. Table 4 focuses on the gender
differences in hours of work in June 2020, in hours of work earlier in 2020 before the
outbreak of the Coronavirus, and the change in hours of work. The table also displays
the fraction of men and women who suffered an income loss. As before, we focus on
individuals aged 18–64 who reported being employed in January–February 2020.
Men and women in our sample reported currently working 36.48 (SD = 29.99) and
27.13 (SD = 28.19) weekly hours, while they reported having worked 43.52 (SD = 25.46)
and 38.08 (SD = 23.65) weekly hours earlier in the year, before the outbreak of the
Coronavirus pandemic.27 Taken altogether, these figures reveal that both men and
women had reduced their weekly hours of work between June 2020 and before the
outbreak of the Coronavirus pandemic. When trying to assess a potential differential
drop in hours of work by gender, we found this to be stronger among women: −3.9 h
(56% reduction). However, adding sociodemographic controls makes the gap
decrease to −2.9 h (41% reduction) and lose statistical significance (p-value > 0.05).
Our −3.9 h unadjusted gap compares with the +2.8 h in Hupkau and Petrongolo
(2020), however, their gap drops to +1.4 (p-value > 0.05) when adding additional
covariates, including controls for children and work-from-home indicators. Finally,
in terms of income loss, 49% of men compared with 53% of women reported a loss
in gross household income because of the Coronavirus pandemic.
4.3.3. COVID-19 and time allocation in household production
We now shift our attention to gender differences in the allocation of time to household
production, including childcare (or home schooling), housework (cooking, cleaning,
laundry) and caring for disabled, elderly or sick adult.
Table 5 reveals substantial changes across childcare and housework tasks, but not for
caring activities. We estimate the gender gap in hours spent on childcare and home
schooling in June at about 8 h a week. Focusing on individuals living in a couple and
with children aged 15 and younger, Hupkau and Petrongolo (2020) show that the
gap oscillates between 12 and 10 h approximately, without and with control
variables.28 We report a gender gap before the pandemic of 4.5–5 h. Thus, we
document a higher increase in the hours allocated to childcare among women: the
gender gap increases by 3.5–3.9 h. This compares with the 2.5-h increase estimated
by Hupkau and Petrongolo (2020), comparing 2014–2015 (UK Time Use Survey)
and April–May 2020 (Covid-19 Study).
In terms of housework in the last month, we find that women spent on activities
such as cooking, cleaning, and laundry an average of 29.3 h a week (SD = 31.5), 9.2
weekly hours (46%) more than men. This compares to the 6-hour gap computed in
Hupkau and Petrongolo (2020) using data from April–May 2020 (Covid-19 Study).29
Before the COVID-19 pandemic, women spent on housework an average of 22.5 h a
week, 7 weekly hours (45%) more than men. Thus, women had increased their time
27
According to Hupkau and Petrongolo (2020), the number of hours of work from the UK Quarterly
Labour Force Survey January–March 2020 is 35.95 (SD = 16.54) for men, and 27.36 (SD = 16.54) for
women; from UKHLS (Covid-19 Study) January–February 2020 is 38.22 (SD = 11.20) and 30.56 (SD =
12.60), respectively.
28
Note that our sample focuses on all individuals. Restricting our analysis to individuals living in a
couple with children (aged 15 and younger) would decrease our samples for men and women to 74 and
65 observations, respectively.
29
Note that they focus on individuals living in a couple.
Downloaded from https://www.cambridge.org/core. IP address: 46.4.80.155, on 21 Apr 2021 at 02:08:13, subject to the Cambridge Core terms
of use, available at https://www.cambridge.org/core/terms. https://doi.org/10.1017/dem.2021.214 Sonia Oreffice and Climent Quintana‐Domeque
Table 4. Time allocation in the labor market and income loss among individuals who were employed in
January–February 2020, 18–64
Hours of Hours of work Change in Income loss
work before COVID hours of work (0–1)
Mean for Men 36.481 43.519 −7.038 0.494
(SD for Men) (29.99) (25.46) (21.97)
N for Men 480 480 480 480
Mean for Women 27.131 38.081 −10.949 0.530
(SD for Women) (28.19) (23.65) (24.44)
N for Women 472 472 472 472
Diff. −9.350 −5.438 −3.912 0.036
Adj. diff. −6.952 −4.061 −2.891 0.014
% Diff. −25.6% −12.5% 55.6% 7.3%
Adj. % diff. −19.1% −9.3% 41.1% 2.8%
p-value diff. 0.000 0.001 0.010 0.268
p-value adj. diff. 0.000 0.018 0.070 0.679
N (w/o controls) 952 952 952 952
N (w/ controls) 950 950 950 950
Note: p-values robust to heteroscedasticity. Difference is computed as the coefficient on a female indicator on a
regression of the outcome on each column against a female indicator and a constant. Adjusted difference is computed in
the same way after including the following control variables: ethnicity indicator (1 if non-white, 0 if white), age
indicators, education indicators, couple indicator, living with others indicator, log of income in 2019, employment status
indicators, rural/urban indicator, geographical location of residence indicators.
allocated to housework between the last month and before the COVID-19 pandemic
more than men: 2.2 h (48%) gap.30
Finally, the gender gap in the weekly number of hours spent on caring for disabled,
elderly or sick adult did not change between the last month and before the COVID-19
pandemic.
4.4. COVID-19, protective behaviors, NHS perceptions, and charity giving
This subsection focuses on protective behaviors: in general, when going out, and on the job.
In terms of general protective behaviors, Table B5 in Supplementary Material Appendix B
shows that: first, almost 90% of women reported having hand sanitizer gel at home, and
they were 8.5 pp (11%) more likely than men to have it; second, almost 60% of women
reported having disposable face masks at home, and they were 7.4 percentage points
(11%) less likely than men to have them; third, both men and women were equally
likely to have disposable gloves at home, with a prevalence of 62%; fourth, women
appeared to be more likely to socialize outdoors than men: 78% of women vs. 71% of
men; finally, around 3.5%, for both men and women, appeared to have met 7 people or
more in violation to the lockdown rules at the time of the survey.
30
Interestingly, comparing the gap in April–May 2020 with that in 2016–2017, Hupkau and Petrongolo
(2020) find evidence that the gender gap, if anything, decreases to −1.5 h.
Downloaded from https://www.cambridge.org/core. IP address: 46.4.80.155, on 21 Apr 2021 at 02:08:13, subject to the Cambridge Core terms
of use, available at https://www.cambridge.org/core/terms. https://doi.org/10.1017/dem.2021.2of use, available at https://www.cambridge.org/core/terms. https://doi.org/10.1017/dem.2021.2
Downloaded from https://www.cambridge.org/core. IP address: 46.4.80.155, on 21 Apr 2021 at 02:08:13, subject to the Cambridge Core terms
Table 5. Time allocation in household production
Hours Hours Hours
childcare Change housework Change in caring Change
Hours before in hours Hours before hours Hours before in hours
childcare COVID childcare housework COVID housework caring COVID caring
Mean for Men 5.99 4.23 1.77 20.13 15.50 4.63 2.56 2.17 0.399
(SD for Men) (18.55) (14.54) (15.07) (24.42) (18.66) (14.91) (13.47) (10.79) (6.73)
N for Men 704 704 704 704 704 704 704 704 704
Mean for Women 14.42 9.21 5.22 29.31 22.47 6.84 3.42 3.12 0.304
(SD for Women) (37.77) (27.26) (22.06) (31.51) (25.30) (21.74) (14.96) (13.18) (6.37)
N for Women 757 757 757 757 757 757 757 757 757
Diff 8.421 4.973 3.448 9.177 6.965 2.212 0.859 0.954 −0.095
Journal of Demographic Economics
Adj. diff. 8.320 4.451 3.869 8.712 5.919 2.793 0.422 0.473 −0.052
% Diff. 140.4% 117.5% 195.1% 45.6% 44.9% 47.8% 33.5% 44.1% −23.8%
% Adj. diff 138.7% 105.2% 219.0% 43.3% 38.2% 60.4% 16.5% 21.8% −13.0%
p-value 0.000 0.000 0.000 0.000 0.000 0.023 0.249 0.129 0.781
p-value adj. diff. 0.000 0.000 0.000 0.000 0.000 0.004 0.569 0.477 0.872
N (w/o controls) 1,461 1,461 1,461 1,461 1,461 1,461 1,461 1,461 1,461
N (w/ controls) 1,458 1,458 1,458 1,458 1,458 1,458 1,458 1,458 1,458
Note: p-values robust to heteroscedasticity. Difference is computed as the coefficient on a female indicator on a regression of the outcome on each column against a female indicator and a
constant. Adjusted difference is computed in the same way after including the following control variables: ethnicity indicator (1 if non-white, 0 if white), age indicators, education indicators,
couple indicator, living with others indicator, log of income in 2019, employment status indicators, rural/urban indicator, geographical location of residence indicators.
1516 Sonia Oreffice and Climent Quintana‐Domeque
In Table B6 in Supplementary Material Appendix B the focus is on gender differences
in behaviors when going out: 95% of women reported washing their hands as soon as
they got home. This fraction is 4.4 pp (5%) higher than the one for men. However,
we do not find either statistically significant or sizeable differences between men and
women in the reported use of face-covering (34% vs. 36%) or disposable gloves (19%
vs. 17%), or in observing social distance (95% vs. 96%)31, in spite of anecdotal
evidence in the media suggesting women’s higher face covering usage rates.
In Table B7 in Supplementary Material Appendix B we investigate protective
behaviors on the job. Differences in social distancing at work and the use of
face-covering or disposable gloves at work are not statistically significant. While the
difference in the prevalence of social distancing and the use of face-covering at work
is not large in magnitude, the difference in the use of disposable gloves at work does
not appear to be negligible, between 7 and 10 pp or 16% and 23% difference.
In Table B8 in Supplementary Material Appendix B, we investigate differences in the
views regarding the effectiveness of masks and some statements regarding masks. We
do not find differences between men on women with regards the perceived
effectiveness of masks in not getting coronavirus (2.50 vs. 2.44) or not spreading
coronavirus (3.37 vs. 3.36), or the perceived use of masks by people in enclosed
spaces (2.74 vs. 2.75). However, the average agreement score was higher for “masks
effective in not spreading” than for “masks effective in not getting”.
The average level of agreement that “if everybody wears a face mask, everyone is
protected from Coronavirus” was higher among women than men. Female’s average
agreement score was 2.43 on a scale of 1–4, while the male’s one was 2.34. This
represents a difference of about 0.10 SD (p-value < 0.05) or 4%. Moreover, the
average level of agreement that the UK government encourages wearing a
face-covering in enclosed spaces was higher among women than men. Female’s
average agreement score was 3.21 on a scale of 1–4, while the male’s one was 3.09.
This represents a difference of about 0.15 SD (p-valueJournal of Demographic Economics 17
Table 6. NHS perceptions and charity giving
NHS is Food charity NHS charity Amount not
crucial donation donation donated
(1–4) (0–50p) (0–50p) (0–50p)
Mean for Men 3.805 17.760 20.661 11.579
N for Men 703 703 703 703
Mean for Women 3.868 23.200 19.074 7.726
N for Women 755 755 755 755
Mean difference 0.062 5.440 −1.587 −3.853
Adjusted mean difference 0.056 5.130 −1.130 −3.999
% Mean difference 1.6% 30.6% −7.7% −33.3%
% Adjusted mean difference 1.5% 28.9% −5.5% −34.5%
p-value mean difference 0.008 0.000 0.086 0.000
p-value adj. mean difference 0.020 0.000 0.229 0.000
N (w/o controls) 1,458 1,458 1,458 1,458
N (w/ controls) 1,458 1,458 1,458 1,458
Note: p-values robust to heteroscedasticity. Difference is computed as the coefficient on a female indicator on a
regression of the outcome on each column against a female indicator and a constant. Adjusted difference is computed in
the same way after including the following control variables: ethnicity indicator (1 if non-white, 0 if white), age
indicators, education indicators, couple indicator, living with others indicator, log of income in 2019, employment status
indicators, rural/urban indicator, geographical location of residence indicators.
was 5 pence (0.31 SD or 31%); third, on average, women’s allocation to the “no donation”
option was 4 pence (0.20 SD or 33%) smaller than that of men.
5. Accounting for the “adjusted” gender gaps
The previous section has documented gender gaps along multiple dimensions including
mental health, COVID-19-related health and economic concerns, time allocation to
market and household production, and charity giving. Many of these gaps cannot be
explained by ethnicity, age, education, living with a partner, living with others in the
household, income in 2019, current employment status, living in a rural (vs. urban)
area, or geographical location. In this section, we go one step further and add to the
previous list of controls the following:
• Children & seniors living in the house:
o Number of children by age category (number of children aged 0–5, number of
children aged 6–15, number of children 16–18)
o Number of individuals aged 60 and above
• Employment characteristics:
o Working full-time vs. part-time
o Being a healthcare worker
• Employment shocks:
o Having being furloughed because of COVID-19
o Having lost their job because of COVID-19
Downloaded from https://www.cambridge.org/core. IP address: 46.4.80.155, on 21 Apr 2021 at 02:08:13, subject to the Cambridge Core terms
of use, available at https://www.cambridge.org/core/terms. https://doi.org/10.1017/dem.2021.218 Sonia Oreffice and Climent Quintana‐Domeque
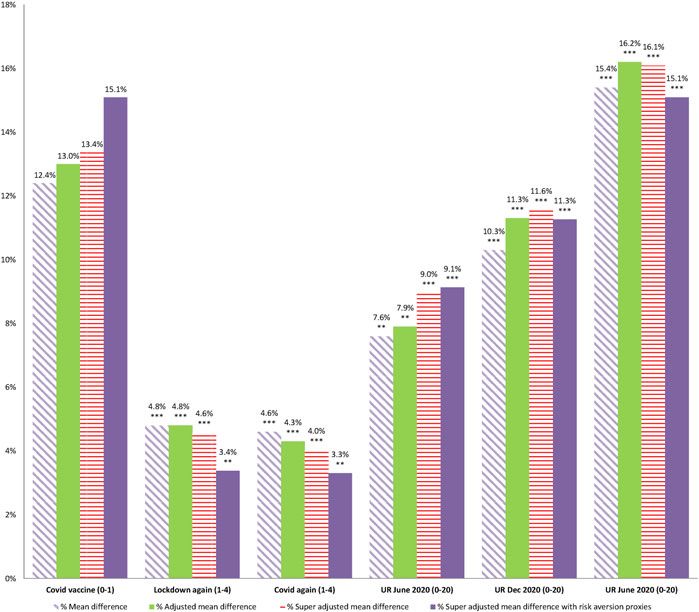
Figure 1. % Mean gender gap in COVID-19-related health concerns.
Note: **p-value < 0.05, ***p-value < 0.01. p-value of the mean difference in each column.
Figures 1 and 2 compare the findings in Tables 2 and 3, with unadjusted (without
controls) and adjusted (with standard sociodemographic controls) gender gaps, with
those in Tables B9 and B10 in Supplementary Material Appendix B, with “super
adjusted” (adding the new list of controls: children & seniors, employment
characteristics, and employment shocks) and “super adjusted with risk aversion
proxies” gender gaps. In order to account for differences in risk aversion between men
and women in explaining the gender gap in COVID-19-related health and economic
concerns, we have also included the following controls variables: a time preference
measure (1–10), from Falk et al. (2016, 2018) —see footnote 15— and three measures
of risky behaviors—obesity indicator (0–1), number of alcoholic drinks (0–10), and
smoking indicator (0–1).
While none of these variables is a perfect substitute for a direct measure of risk
aversion, we believe they get us closer to control for risk attitudes. Thus, we think
that they are useful in accounting for potential differences in risk aversion between
men and women when measuring the gender gap in COVID-19-related concerns.
The findings in Figures 1 and 2 (and Tables B9 and B10) show that the addition of
new controls cannot account for the unexplained gender gap in COVID-19-related
health and economic concerns.
Downloaded from https://www.cambridge.org/core. IP address: 46.4.80.155, on 21 Apr 2021 at 02:08:13, subject to the Cambridge Core terms
of use, available at https://www.cambridge.org/core/terms. https://doi.org/10.1017/dem.2021.2You can also read