Radar-derived convective storms' climatology for the Prut River basin: 2003-2017
←
→
Page content transcription
If your browser does not render page correctly, please read the page content below
Nat. Hazards Earth Syst. Sci., 19, 1305–1318, 2019
https://doi.org/10.5194/nhess-19-1305-2019
© Author(s) 2019. This work is distributed under
the Creative Commons Attribution 4.0 License.

Radar-derived convective storms’ climatology for the
Prut River basin: 2003–2017
Sorin Burcea1 , Roxana Cică2 , and Roxana Bojariu2
1 Radar   and Nowcasting Department, National Meteorological Administration, Bucharest, 013686, Romania
2 Climate   Section, National Meteorological Administration, Bucharest, 013686, Romania

Correspondence: Roxana Cică (cicadianaroxana@yahoo.com)

Received: 24 November 2018 – Discussion started: 27 November 2018
Revised: 12 May 2019 – Accepted: 21 June 2019 – Published: 3 July 2019

Abstract. Weather radar measurements are used to study the        1   Introduction
climatology of convective storms and their characteristics in
the transboundary Prut River basin. The Storm Cell Identi-
fication and Tracking (SCIT) algorithm was used to process        Weather events associated with convective storms have a
the volumetric reflectivity measurements, in order to identify,   large impact on society and natural systems and can lead to
characterize, and track the convective storm cells. The storm     loss of life and property. For instance, large rivers or small
attribute table output of the algorithm was used to separate      catchment flash floods can cause landslides, while urban ar-
the convective from the stratiform storm cells, by applying       eas can be heavily affected if the capacity of the sewer sys-
a simple selection criterion based on the average vertically      tems is exceeded. During the past decades, heavy rainfall has
integrated liquid (VIL) values. The radar-derived character-      led to loss of life and caused significant damage in various
istics of convective storms were used to document the spa-        areas of Romania. To mitigate the effects of such hazards
tial and temporal distributions and storm properties in terms     and to improve the local adaptation to climate-change-related
of duration, distance travelled, movement direction, and in-      natural hazards by increasing the awareness and prepared-
tensity. The results show that 94.3 % of all convective storm     ness of both individuals and stakeholders, knowledge about
cells were detected during May–August, with the peak in           the spatio-temporal distribution of convective storms is of the
July. The peak time for convective storm cells’ occurrence        utmost importance.
was in the afternoon and evening hours between 10:00 and             A specific challenge is the high variability in time and
18:00 UTC. The median duration of a convective storm was          space of convective weather. Also, regional variations in to-
42 min, the median distance travelled was 23 km, and the          pography, local-scale flow, and mesoscale flow can also sig-
median movement speed was 7.7 m s−1 . The average move-           nificantly affect the convective storms’ development. Conse-
ment of storms varied with months, but overall most con-          quently, high-resolution spatio-temporal datasets are needed
vective storms move from the south-west and south–south-          to perform detailed statistics.
east. Also, the analysis shows that the longer-lasting convec-       Remote sensing of the atmosphere is nowadays performed
tive storms were the most intense. The spatial distribution       on a large scale, with instruments like ground-based weather
of the convective cells reveals yearly variation patterns and     radars providing high-resolution observations of weather
hotspots but also highlights the limitations of radar measure-    systems. Weather radar measurements represent a valuable
ment at longer distances. Reanalysis data suggest that low        supplement for thunderstorm and convective events’ clima-
values of sea level pressure over the Black Sea can act as a      tology and mapping (Peter et al., 2015; Goudenhoofdt and
dynamical driver of convective storms in the analysed area.       Delobbe, 2013). Thunderstorm identification and tracking
                                                                  using weather radars are a key tool for severe weather fore-
                                                                  casting and warning and have become, lately, an asset for
                                                                  convective storms’ climatology as well. Compared to point
                                                                  measurements (i.e. weather stations), the intensity, swath,

Published by Copernicus Publications on behalf of the European Geosciences Union.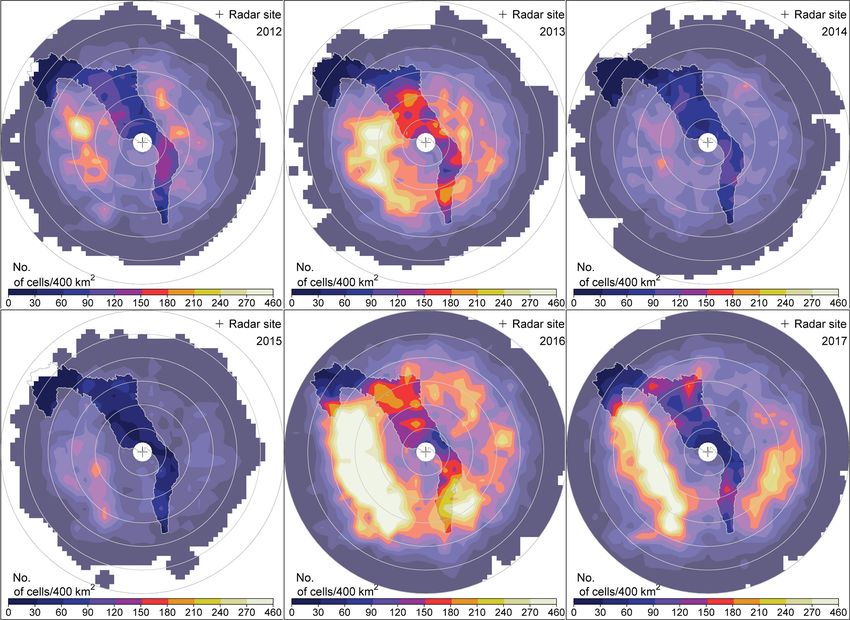
1306                  S. Burcea et al.: Radar-derived convective storms’ climatology for the Prut River basin: 2003–2017

and spatial extent of the convective events can be derived         periods of time. For example, assessing the severe hailstorm
from radar data.                                                   and hail risk of a total of 52 hail events that occurred in
   Lately, based on weather radar data, studies on the statis-     May 2013 in southern Romania, using weather radar data,
tical characteristics of convective storms around the world        Cică et al. (2015) found that the areas where hail and dam-
have been performed. For instance, thunderstorm climatol-          age were reported are well captured by the footprints and
ogy in Hungary, using Doppler radar data, has been devel-          magnitude of the radar variables considered in the study. Se-
oped by Seres and Horvath (2015). The study was performed          vere weather situations that occurred in south-eastern Ro-
over the period 2004–2012, finding that most storm days oc-        mania during 2003–2007 were investigated by Cărbunaru et
curred in the late spring and summer of 2007 and 2010, with        al. (2013), using weather radar data, their results revealing
the daily frequencies peaking in the late afternoon. Statistical   various Doppler velocity field configurations associated with
characteristics of convective storms in Belgium were stud-         the intensity of the tropospheric flow, while each configura-
ied by Goudenhoofdt and Delobbe (2013), using volumet-             tion of Doppler velocity field was found to be associated with
ric weather radar observations over a 10-year period (2002–        various characteristics of severe convective cells. Lemon et
2011). Their main findings can be summarized to the fact that      al. (2003) document the strong, long-track tornado (F3+)
the probability to observe a high number of storms reaches         that occurred in August 2003, in south-eastern Romania, re-
a maximum in June and in the early afternoon, and the mo-          lying on weather radar data for storm characteristics’ assess-
tion of convective storms is slower in summer and in the af-       ment.
ternoon, while regions with slightly higher convective ini-           Therefore, even some recent studies on convection and the
tiation are related to orography. Over north-western Italy, a      associated weather events in Romania have been performed,
6-year warm season (2005–2010, April–September) radar-             but catchment- to regional-scale radar-based statistics and
based analysis of convective storms revealed that storms are       mapping of convective storms were not derived. The aim of
more frequent and intense in July and August and during the        this paper is to derive a climatology of convective storms
afternoon hours (Davini et al., 2012). Also, the spatial distri-   in the area of Prut River basin, based on a 15-year weather
bution of convective initiation highlights that the most suit-     radar dataset, to better understand the spatio-temporal char-
able regions for the generation of convective cells are located    acteristics of convective storms that occurred in this partic-
in the proximity of hills or mountains, suggesting an active       ular area, which includes the second largest water reservoir
role of the topography in triggering storms.                       in Romania (at the Stânca-Costeşti hydropower station). In
   In Asia, Wang et al. (2014) studied the statistical char-       the summer of 2008, this reservoir reached 98 % of its ca-
acteristics of convective initiation in the Beijing–Tianjin re-    pacity due to a historical flow, which was generated by high
gion, using radar data over the period 2008–2013. Results          amounts of rainfall recorded in the Prut River basin (Ro-
showed that there are dense convective initiation activities       manescu et al., 2011). A similar situation happened in the
around 200 m elevation, meaning that convective storms are         summer of 2010 (Romanescu and Stoleriu, 2017), raising
more easily triggered over foothills; the highest convective       the issue of better monitoring and understanding the climate
initiation density was found in urban areas, while the sec-        variability of convective systems in the Prut area. Hopefully,
ond highest convective initiation density was found in the         the outcomes of our study will contribute to the assessment
forest-type land cover areas. Radar-derived statistics of con-     of precipitation-related hazards and associated risks in the
vective storms and their concomitant changes with thermo-          context of basin-integrated water management and to the cli-
dynamic variability in South-east Queensland, Australia, was       matology of storms in Europe.
performed by Peter et al. (2015), concluding that convec-             This article is structured as follows. The study area and
tive storms are found to form and maintain along elevated to-      datasets are described in Sect. 2, and the methodology is pre-
pography, westerly regime storms occur less frequently and         sented in Sect. 3. Results are detailed within Sect. 4, followed
have shorter lifetimes, and westerly regime storms are pri-        by the concluding remarks in Sect. 5.
marily driven by large-scale forcing, whereas northerly and
trade wind regime storms are more responsive to surface
characteristics. Mohee and Miller (2010) derived a clima-          2   Study area and data
tology of thunderstorms for North Dakota, using radar and
surface thunderstorm data over the 2002–2006 period. It was        The Prut River begins from the forested Carpathian Moun-
found that convective storm cells peak in June and July and in     tains in Ukraine and flows into the Danube River, in Roma-
the late afternoon to early morning. Also, their results reveal    nia. The Prut River is 967 km long, and its catchment area
that the average movement of storm cells varied with months,       is 27 540 km2 , with an overall drop of the river of approxi-
and the storms moved toward the north, the north-east, and         mately 1500 m. The basin of the Prut River is transboundary
the east.                                                          and is located in the territory of three countries: Ukraine, Re-
   For Romania, radar-based convective storms’ identifica-         public of Moldova, and Romania, with corresponding area
tion, observation, and their associated damage were also           percentages of 33 %, 28 %, and 39 % respectively (Fig. 1).
studied but considering only particular storm events or small      On the Prut River, the Stânca-Costeşti Dam (located between

Nat. Hazards Earth Syst. Sci., 19, 1305–1318, 2019                         www.nat-hazards-earth-syst-sci.net/19/1305/2019/
S. Burcea et al.: Radar-derived convective storms’ climatology for the Prut River basin: 2003–2017                             1307

                                                                        Although the analysis performed by Johnson et al. (1998)
                                                                     revealed that SCIT detected more than 90 % of all storm cells
                                                                     correctly, the algorithm has limitations. The most obvious
                                                                     among these is poor cell detection close to the radar site be-
                                                                     cause of the cone of silence and at greater distances because
                                                                     of low vertical resolution (beam spreading). Nevertheless, it
                                                                     is beyond the scope of this paper to perform an evaluation of
                                                                     the SCIT algorithm.

                                                                     3   Methodology

                                                                     The radar data covering the 15-year period considered in
                                                                     this study were extracted from the archive, which starts on
                                                                     1 May 2003, and then processed in several steps. For each
                                                                     of the 15 years, the days with missing data were identified.
                                                                     The missing days are due to both technical failures of the
                                                                     radar system or to maintenance intervals. One may assume
                                                                     that there is no convective activity during the maintenance
                                                                     intervals, as the radar was shut down for maintenance dur-
                                                                     ing the days with clear sky. Also, if during a day more than
Figure 1. Map of the study area, showing the Prut River basin
(white polygon), Bârnova WSR-98D radar location (“+” sign),          10 % of data were missing (∼ 2 h), then the day was flagged
orography, and borders. The range rings around the radar are 50 km   as missing and excluded from the analysis.
apart, extending to 300 km.                                             The number of days with valid radar data, selected using
                                                                     the above criterion, within each year, is illustrated in Fig. 2.
                                                                     The year 2003 has the smallest number of selected days, as
Stânca, Romania, and Costeşti, Republic of Moldova) was             the radar data were available starting from May. The number
built in the 1970s for the lake to serve as a reservoir for a        of selected days per year varies for the interval 2004–2017,
hydropower station. However, the main goal of building the           being approximately constant for the last 3 years of the pe-
dam was to protect villages down the river from floods.              riod. Thus, from the total number of days excluded from the
   The Prut River basin is covered by the Weather Surveil-           analysis (13.7 % from all calendar days), 3.9 % are days with
lance Radar – 98 Doppler (WSR-98D) located at Bârnova,               no data, and 9.8 % are days with more than 10 % data miss-
Iaşi County, Romania (the “+” sign in Fig. 1). The radar is         ing. After this step, 4624 days were chosen for the analysis,
a single-polarization S-band system, operating Nexrad Vol-           with approximately 1.1 million scans processed to extract the
ume Coverage Pattern 21 (VCP21), performing a complete               storm attribute tables.
volume scan every 6 min at nine different elevation angles.             After extraction of the storm attribute tables, the storm
Small parts of the basin, in the south and north-west, are cov-      cell selection was performed. The performance of the SCIT
ered by another two WSR-98D radars, but the distance from            algorithm is affected by the distance to the radar; storms
the radar location to these areas exceeds 200 km. Hence, only        located at close ranges are likely to be missed because of
data from Bârnova WSR-98D were chosen for this study.                the cone of silence, while at greater distances only storms
   The data used in this study are the output of the Storm Cell      characterized by large vertical development will be identi-
Identification and Tracking (SCIT) algorithm (Johnson et al.,        fied. To have a full coverage of the Prut River basin, storm
1998), covering the period 2003–2017. The SCIT algorithm             cells located within the 20–300 km range interval were kept
is a centroid-based storm cell algorithm that processes vol-         for further processing, even though according to Johnson et
umetric reflectivity to identify, characterize, track, and fore-     al. (1998) there is some indication that storms located more
cast the short-term movement of storm cells identified in the        than 150 km from the radar site are more likely to be missed.
coverage area of the weather radar. The algorithm uses seven            After the above selection criteria were applied, a total
reflectivity thresholds (30, 35, 40, 45,50, 55, 60 dBZ) and a        number of just over 2.2 million storm cells resulted, for the
series of adaptable parameters to identify the storm cell cen-       whole study period and for the whole radar coverage area
troid. The SCIT runs operationally after each volume scan,           within 20–300 km from the radar. Given the azimuth and
resulting in tabular, alphanumeric, and graphic products. In         range of each of the storm cells detected, the geographical
this study, the storm attribute table was used, a table that con-    coordinates (i.e. longitude and latitude) were calculated and
tains storm features like storm ID, azimuth and range, cell          included in the storm attribute table to facilitate the mapping
movement direction and speed, and maximum reflectivity.              process and the extraction of the storm cells within the Prut
                                                                     River basin area. After extracting the storm cells detected

www.nat-hazards-earth-syst-sci.net/19/1305/2019/                            Nat. Hazards Earth Syst. Sci., 19, 1305–1318, 2019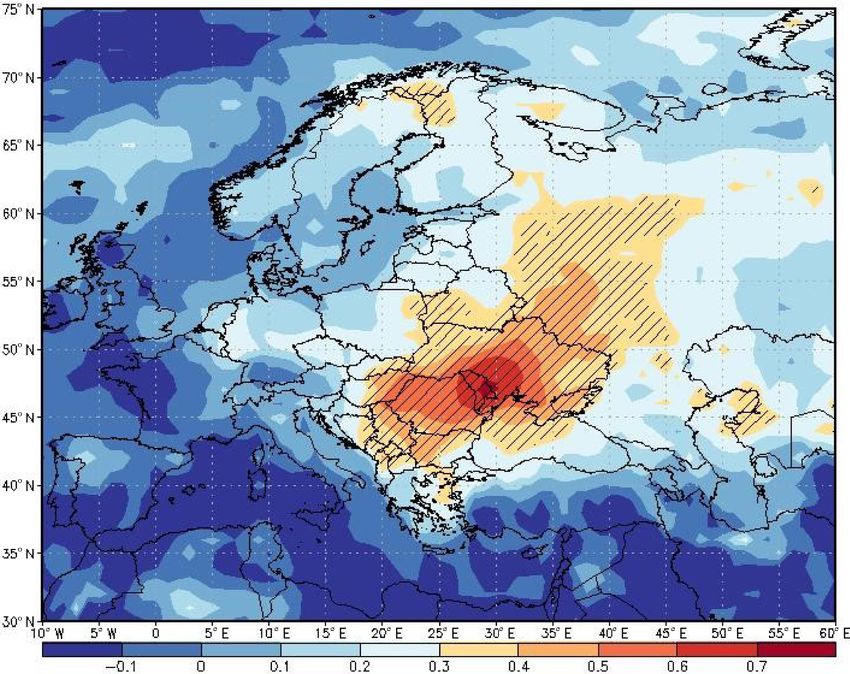
1308                  S. Burcea et al.: Radar-derived convective storms’ climatology for the Prut River basin: 2003–2017

                                                                     and this parameter is correlated with updraft strength. Zhang
                                                                     and Qi (2010) used a single VIL threshold of 6.5 kg m−2 ,
                                                                     found through subjective analysis of a large number of
                                                                     cases, to separate convective from stratiform rainfall, while
                                                                     Qi et al. (2013) used the same VIL threshold but within a
                                                                     more complex convective–stratiform segregation algorithm.
                                                                     Within this study, a VIL threshold of 10 kg m−2 was used to
                                                                     separate convective from stratiform storm cells. This value
                                                                     was obtained also through subjective analysis, by arbitrarily
                                                                     checking the storm cell characteristics from different seasons
                                                                     and years. Smaller values of VIL were observed for strati-
                                                                     form cells, shallow isolated single cells, and for high reflec-
                                                                     tivity cores (> 45 dBZ) within stratiform precipitation sys-
                                                                     tems, where the radar beam intersects the bright band region,
                                                                     while greater values of VIL (> 10 kg m−2 ) were observed for
                                                                     convective storm cells. Therefore, if for a unique storm (ID),
                                                                     the average VIL value for its entire lifetime was greater than
                                                                     or equal to the threshold value, the storm was retained for
Figure 2. Number of days per year, within the period 2003–2017,      analysis, and if the average VIL value was smaller than the
with valid data selected for the analysis. The number of selected    threshold value, the storm was discarded. Consequently, a fi-
days between May and August is also depicted, the dotted line rep-   nal number of 9507 unique convective storms associated with
resenting the number of days (i.e. 123 days) between 1 May and       just over 84 000 storm cells were considered for the analysis
31 August.                                                           for the area of the Prut River basin and during 2003–2017.
                                                                        The mapping of the spatial distribution of the convective
                                                                     storm cells was performed on a 20 km resolution grid, by
within the Prut River basin, a number of around 336 000 en-          counting the number of convective storm centroids within
tries resulted.                                                      each grid cell. The monthly (hourly) convective cells’ fre-
   In order to keep only the convective storm cells, further se-     quency is equal to the average detections in a given month
lection criteria were applied. When SCIT identifies a storm          (hour) over the whole 15-year period. Based on the final
cell for the first time, a unique name (ID) consisting of letter–    convective storm attribute table, 2-D histograms comparing
number combinations is assigned (e.g. A0), and for the whole         radar-derived storm attribute speed, direction of movement,
time the algorithm detects and tracks that particular ID, and        and day of the convective season were obtained. For each
the storm attribute table is updated. So, during its lifetime,       day, and for each direction (i.e. from 1 to 360◦ ), the num-
a unique storm has associated multiple storm cells which             ber of convective storm cells was counted and plotted on a
are found under the same ID within the table. By looking             2-D histogram of 10◦ × 3 d resolution. A direction of 180◦
at the storm attribute tables, we noticed that the algorithm         (plotted as south) represents a convective storm cell mov-
identifies many storms during one or a few consecutive vol-          ing from south to north. The storm speed as a function of
ume scans. According to the American Meteorological Soci-            the direction of movement was plotted on a 2-D histogram
ety glossary (2018), ordinary convective cells last from 20 to       of 5 knots × 10◦ resolution, illustrating the number of con-
30 min but often more when forming other types of convec-            vective storm cells moving with a certain speed in a given
tive storms (e.g. multi-cell). To exclude the underdeveloped         direction.
and fast decaying cells, the condition that a unique storm              In addition, the mapping of the spatial distribution of the
had a lifetime of at least approximately 20 min was applied          convective storm cells was also performed on a 10 km res-
as a further selection criterion. For this, all the unique IDs       olution grid to match the gridded precipitation data over
were identified in the attribute tables, and it was checked if       the Prut basin, for comparison purposes. We correlated the
the storm was identified in at least four consecutive scans.         monthly number of convective systems in the river basin with
To ensure that all the storms within the Prut River basin are        the basin-averaged precipitation amounts. Then, we analysed
captured well, the storms that initiated outside the basin, but      the correlation coefficients linking the monthly number of
during their lifetime at least four consecutive scans were de-       convective systems in the Prut basin with sea level pressure
tected inside the basin, were retained for analysis.                 (SLP), convective available potential energy (CAPE), and to-
   Based on the cell vertically integrated liquid (VIL)              tal column water to identify the large-scale drivers of stormi-
(Greene and Clark, 1972), a supplemental selection was per-          ness in the area of interest. SLP, CAPE, and total column wa-
formed to get the final convective storms attribute tables. The      ter were extracted from the ERA 5 reanalysis product (Coper-
VIL (kg m−2 ) output of SCIT is the radar estimate of the to-        nicus Climate Change Service, 2017) to cover the Atlantic–
tal amount of liquid in the column, for a given storm cell,          European sector.

Nat. Hazards Earth Syst. Sci., 19, 1305–1318, 2019                          www.nat-hazards-earth-syst-sci.net/19/1305/2019/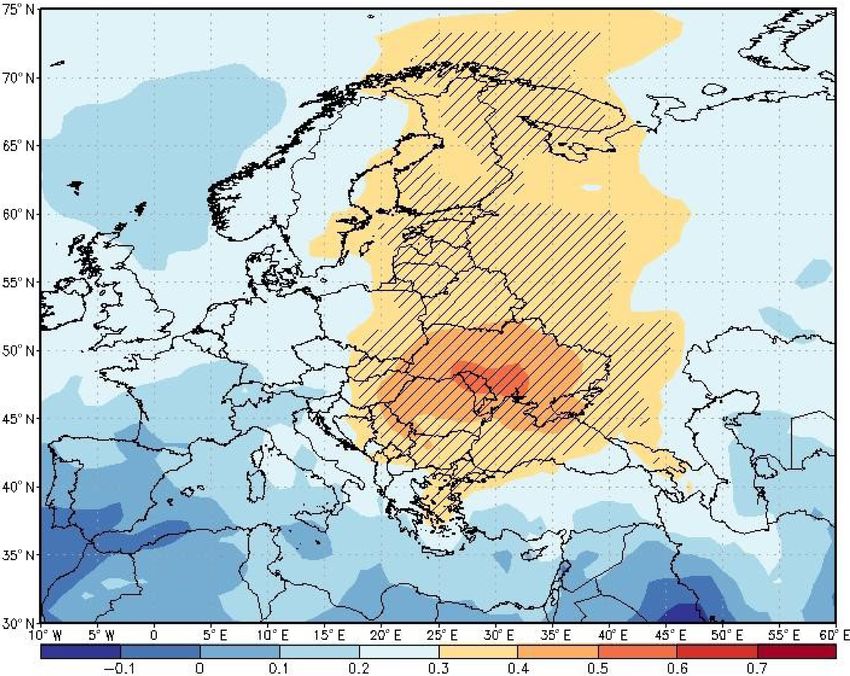
S. Burcea et al.: Radar-derived convective storms’ climatology for the Prut River basin: 2003–2017                           1309

                                                                  Figure 4. Monthly distribution of the mean number of convective
Figure 3. Annual distribution of the number of convective storm   storm cells in the Prut River basin, for the period 2003–2017.
cells in the Prut River basin, for the period 2003–2017.

4     Results

4.1    Yearly, monthly, and hourly distribution

The annual distribution of the number of convective storm
cells detected by the weather radar, within the Prut River
basin area, from 2003 to 2017, is depicted in Fig. 3, revealing
an inter-annual variation. However, no clear trend is observ-
able, but there is a small decrease of the number of convective
cells during 2014–2015, followed by an abrupt increase in
2016 when the largest number of convective cells (9766) was
detected. The smallest number of cells (2746) corresponds to
year 2003, and even if the radar data were available starting
from May, we speculate that this number would be repre-
sentable of this particular year.
   The monthly variation of the mean number of the convec-
tive storm cells (Fig. 4) detected within the Prut River basin    Figure 5. Hourly distribution of the mean number of convective
area, during the 15-year period, reveals that convection oc-      storm cells in the Prut River basin, for the period 2003–2017.
curs predominantly during the warm season, the frequency
being extremely low in the cold season. The convection pre-
vails during May–August, when 94.3 % of the total number          4.2   Spatial distribution
of convective storms cells were detected, reaching a maxi-
mum in July (30.7 % of the total number of convective cells).     Given the results of the monthly distribution of convective
   The mean number of convective storm cells in the Prut          storm cells within the study area, and over the 15-year pe-
River basin, for the period 2003–2017, was plotted against        riod considered for the analysis, the spatial distribution of the
UTC hours to investigate the diurnal variation of convective      convective storm cells was derived for the warm season only
cells’ occurrence (Fig. 5). The majority of convective storm      (May–August). The mapping of the detected convective cells
cells (72.3 %) occur in the afternoon and evening hours,          was performed on the entire coverage area of the weather
being detected between 10 UTC (13:00 LT) and 18:00 UTC            radar, to capture the regions more prone to convection within
(21:00 LT), while the rest of the cells were detected within      the Prut River basin but also to highlight the limitations of
the 19:00–10:00 UTC (22:00–13:00 LT) interval. One can            the radar measurements.
also note that during the night hours, convection occurs more        The spatial distribution of the convective storm cells is il-
frequently than in the morning.                                   lustrated in Figs. 6 and 7 for each active season from 2003 to

www.nat-hazards-earth-syst-sci.net/19/1305/2019/                         Nat. Hazards Earth Syst. Sci., 19, 1305–1318, 2019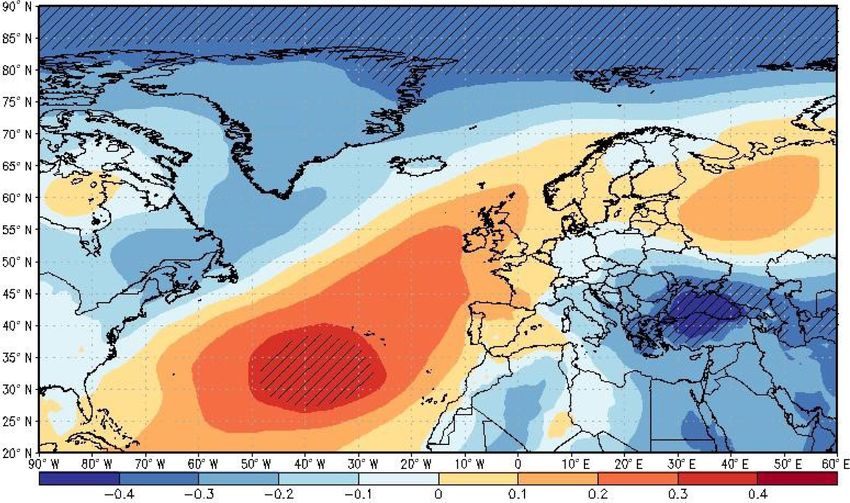
1310                  S. Burcea et al.: Radar-derived convective storms’ climatology for the Prut River basin: 2003–2017

Figure 6. Spatial distribution of the convective storm cells in the study area, for the period May–August, for each year between 2003 and
2011. The year is denoted in the upper right corner of each panel, starting from top to bottom and from left to right.

Nat. Hazards Earth Syst. Sci., 19, 1305–1318, 2019                             www.nat-hazards-earth-syst-sci.net/19/1305/2019/
S. Burcea et al.: Radar-derived convective storms’ climatology for the Prut River basin: 2003–2017 1311
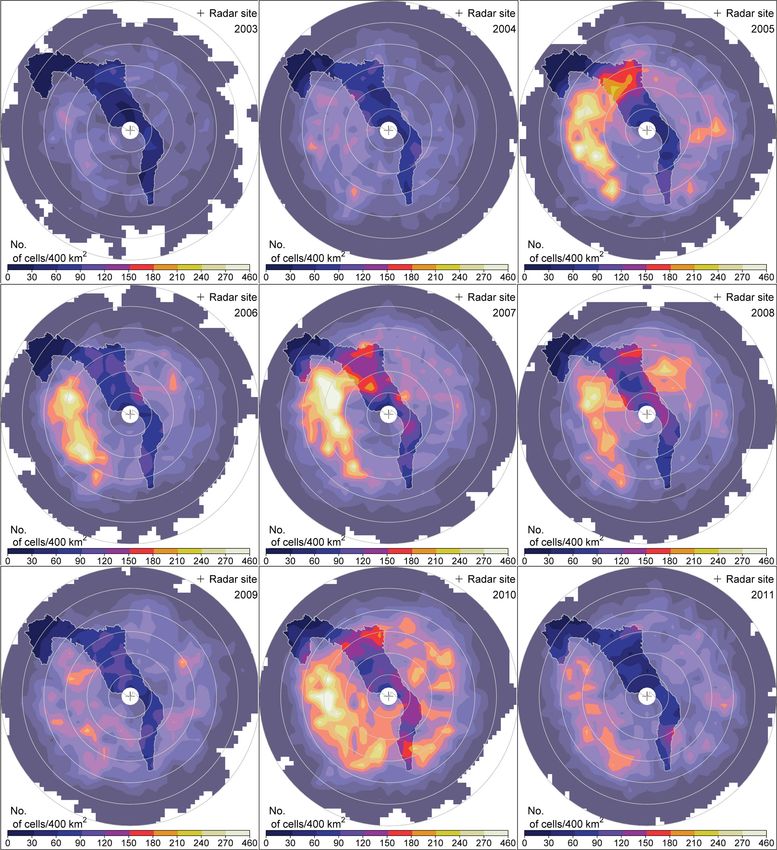
Figure 7. Same as Fig. 6 but for the period 2012–2017.
2017. In these maps, the area of the Prut River basin is high- are depicted over the north-western part of the basin. This
lighted. For plotting reasons, the distribution was smoothed. pattern could be explained by the limitation of detection at
The annual variability of the number of convective cells de- longer distances from the radar location, where only the very
tected within the Prut River basin is revealed, the spatial dis- intense and strong vertical developed storms are detected.
tribution showing various patterns of convection occurrence.
Although convective cells were detected over the whole area 4.3 Storm properties
of the basin, there are regions where convection occurred
more frequently in some years. The spatial distribution is rel- Various storm characteristics have been deducted from the
atively uniform during 2003, 2004, 2009, 2014, and 2015. analysis of the convective storms detected within the Prut
Although the distribution follows the same pattern for 2006, River basin between May and August 2003–2017. The storm
2011, and 2012, larger values of the number of convective parameters considered herein are the storm duration, distance
cells are observed in the eastern edge and southern, north- travelled, movement speed, maximum reflectivity, and VIL.
eastern, and western parts of the basin, respectively. Con- As these characteristics are not normally distributed, a me-
vection occurred more frequently in southern, central, and dian estimator was used to measure the central tendency, be-
northern parts of the basin during 2007, 2008, 2010, and ing more robust than the average (Wilks, 2006). The yearly
2017, while in 2005 large values are observed in its north- median values of the above parameters are shown in Table 1.
ern part. The largest values of the number of convective cells For the whole studied period, the median duration of a con-
are observed in the southern, central, and northern areas of vective storm was found to be 42 min. Also, one observes
the basin during 2013 and 2016. For the entire 15-year pe- that a small yearly variation exists, the median storm dura-
riod, the smallest values of the number of convective storms tion being smaller during 2004, 2008, 2012, and 2017. The
overall median values for the other storm characteristics are
www.nat-hazards-earth-syst-sci.net/19/1305/2019/ Nat. Hazards Earth Syst. Sci., 19, 1305–1318, 2019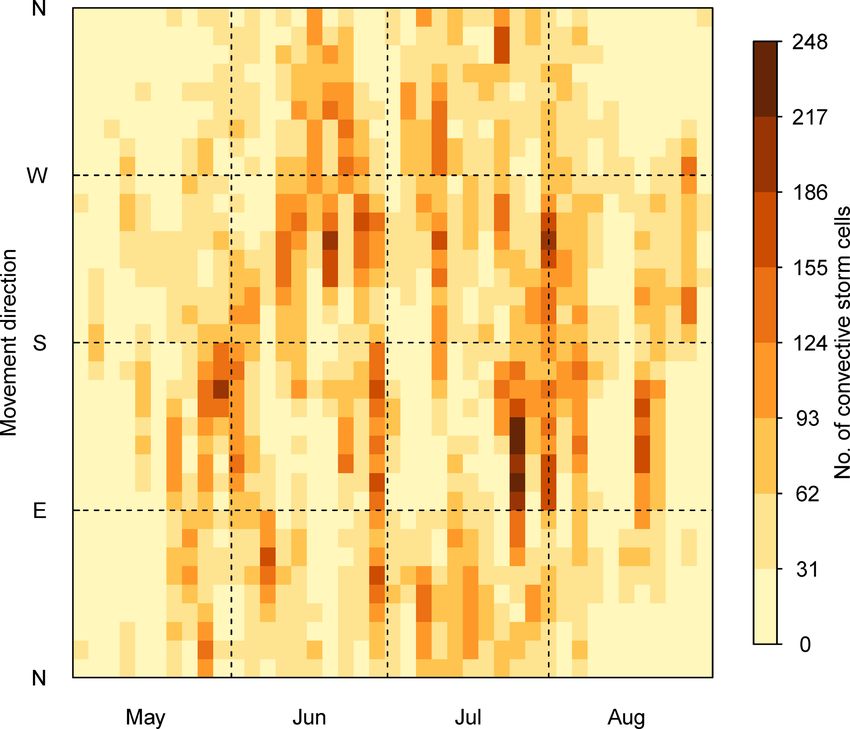
1312                   S. Burcea et al.: Radar-derived convective storms’ climatology for the Prut River basin: 2003–2017

Table 1. Characteristics of convective storms in the Prut River
basin, for different years of the 2003–2017 period.

                                  Median
  Year   Duration   Distance    Movement     Maximum             VIL
           (min)    travelled       speed    reflectivity   (kg m−2 )
                        (km)      (m s−1 )        (dBZ)
  2003         42       21.3          6.8             51          14
  2004         37       23.8            8             53          17
  2005         42        21           6.6             53          17
  2006         43       23.2          7.1             53          17
  2007         42       25.2          8.4             52          18
  2008       37.5       27.8         11.2             54          19
  2009         43       23.2          8.2             53          18
  2010         42       21.8          7.9             52          16
  2011         43        22             7             52          16
  2012         37        23           8.3             53          17
  2013         42       21.2          7.2             55          19
  2014         42       23.2          7.3             52          14
  2015         42       20.5          7.1             53          16
  2016         42       21.5          6.8             55          20
  2017         37       22.1          8.1             54          20    Figure 8. Distribution of parameters of convective storms as a func-
                                                                        tion of their percentages.

23 km, 7.7 m s−1 , 53 dBZ, and 17 kg m−2 for distance trav-             had a duration of 36 min and 12.1 kg m−2 , while those with
elled, movement speed, maximum reflectivity, and VIL, re-               median reflectivity > 55 dBZ had a duration of 43 min and
spectively. A small yearly variation is observable for these            27.9 kg m−2 . Consequently, a relation between the storm du-
parameters as well.                                                     ration and storm intensity exists, the longer-lasting storms
   While the median duration of a convective storm was                  being more intense.
found to be 42 min, for all the storms with a duration greater             The frequency of occurrence is related to the intensity of
than this value, the median was found to be 66 min, and for             severe weather events, approximately following a log-linear
all the storms with a duration of more than 1 h, the median             decrease with increasing intensity (Brooks and Doswell,
was discovered to be 79 min. The longest-lasting convective             2001; Brooks and Stensrud, 2000). Based on this approach,
storm, detected within the basin, had a duration of 368 min             the characteristics of storms, detected between May and Au-
(6 h 8 min) and was recorded in August 2016. The duration               gust 2003–2017, were divided into groups (Table 2) and plot-
of the longest-lasting convective storm in a particular month,          ted against their percentages from the total number of con-
between 2003 and 2017, was found to be 242, 215, 235, and               vective storms (Fig. 8). For example, the graph shows a de-
368 min in May, June, July, and August, respectively. Of all            crease of the number of convective storms with increasing
the convective storms, it was found that 65.86 %, 26.9 %, and           reflectivity. Of the total number of convective storms de-
3.2 % had a duration of more than 30, 60, and 120 min, re-              tected between May and August 2003–2017 (8984), 69.95 %
spectively.                                                             (6284 storms) are associated with maximum reflectivity be-
   For all storms, the median distance travelled was found              tween 40 and 55 dBZ, and 25.24 % (2268 storms) are asso-
to be 23 km, while the longest track was 224 km. Of all                 ciated with maximum reflectivity between 55 and 60 dBZ,
the storms, only 10.6 % were both more than 60 min in du-               while 4.81 % (432 storms) of all convective storms had a
ration and more than 50 km in distance travelled. The me-               maximum reflectivity equal to or greater than 60 dBZ. This
dian maximum reflectivity and VIL values of these convec-               behaviour is characteristic of all the investigated parameters
tive storms were 53.8 dBZ and 19.0 kg m−2 , respectively, be-           of convective storms, their distribution revealing that the fre-
ing not much larger than the overall median of 53 dBZ and               quency of occurrence of intense convective storms tends to
17 kg m−2 , respectively. These storms have a median move-              follow an approximately log-linear decrease with increasing
ment speed of 10.2 m s−1 , which was higher than the overall            intensity, implying that weaker convective storms occur more
median of 7.7 m s−1 . For storms that lasted more than 60 min           often than stronger convective storms. This finding is consis-
and travelled more than 100 km, the median maximum re-                  tent with the results of other studies (e.g. Goudenhoofdt and
flectivity and VIL values were 54.8 dBZ and 21.3 kg m−2 ,               Delobbe, 2013; May and Ballinger, 2007).
respectively, which were larger than the overall median val-               The 2-D histogram comparing the radar-derived direction
ues. Their median movement speed is 12.9 m s−1 , higher than            of movement of storm cells and the day of the convective
the overall median above. From this analysis, it also resulted          season (between May and August 2003–2017), for the Prut
that the convective storms with median reflectivity < 50 dBZ            River basin (Fig. 9), shows that the direction of movement

Nat. Hazards Earth Syst. Sci., 19, 1305–1318, 2019                              www.nat-hazards-earth-syst-sci.net/19/1305/2019/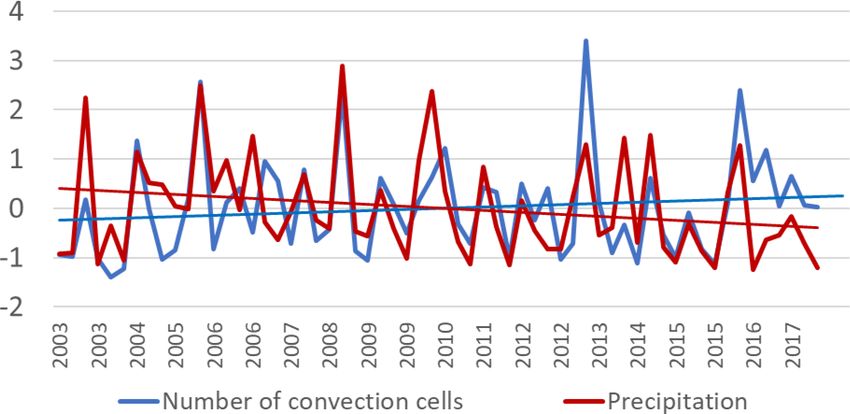
S. Burcea et al.: Radar-derived convective storms’ climatology for the Prut River basin: 2003–2017 1313
Table 2. Radar-derived parameters of convective storms, range of values, and their associated percentages from the total number of convec-
tive storms detected within the Prut River basin.
Group no. Group 1 Group 2 Group 3
Reflectivity (dBZ) Values range 40 ≤ dBZ < 55 55 ≤ dBZ < 60 ≥ 60 dBZ
Percent 69.95 % 25.24 % 4.81 %
VIL (kg m−2 ) Values range 10 ≤ kg m−2 < 20 20 ≤ kg m−2 < 40 ≥ 40 kg m−2
Percent 60.47 % 34.74 % 4.79 %
Duration (min) Values range 20 ≤ min < 60 60 ≤ min < 120 ≥ 120 min
Percent 71.05 % 25.63 % 3.32 %
Speed (m s−1 ) Values range 0 ≤ m s−1 < 10 10 ≤ m s−1 < 20 ≥ 20 m s−1
Percent 68.10 % 29.63 % 2.27 %
Distance (km) Values range 0 ≤ km < 30 30 ≤ km < 60 ≥ 60 km
Percent 65.44 % 26.99 % 7.57 %
varies each month. Moreover, the histogram reveals that there
are daily intervals within a month when a great number of
storm cells travel in preferential directions. In May, the great-
est number of convective storms cells occurred during the
second half of the month, the largest number of storm cells
moving from the south–south-east. During June, convec-
tive storms occurred, overall, throughout the month, the max-
imum number of storm cells moving from the south-west.
July is characterized by the greatest number of convective
storm cells, as depicted by the monthly distribution as well
(Fig. 4), the largest number occurring during the last third of
the month. In this case, the preferred direction of movement
was from the south-east, east–south-east, and south-west. In
August, the majority of convective storms cells occurred dur-
ing the first days and at the beginning of the second half of
the month. For the former period, the movement of most of
the cells was from the south-west and east–south-east, while
for the latter period the movement was preferentially from
the south-east. Figure 9. The 2-D histogram of the number of convective storm
Overall, during May–August, from the total number of cells as a function of month and movement direction, for the Prut
unique convective storms (8984), 12.2 % (1099 storms) had River basin, between 2003 and 2017 (May–August).
an average movement direction from the south-west (be-
tween 210 and 240◦ ), and 10.8 % (967 storms) had an aver-
age movement direction from the south–south-east (between in a general direction from the north-east and south-west had
140 and 170◦ ). The maximum of 4.72 % (424 storms) was a movement speed between 3 and 9 m s−1 , while those mov-
found in the direction between 230 and 240◦ , while the min- ing in a general direction from the south-east had a move-
imum of 0.36 % (33 storms) was found in the direction be- ment speed between 6 and 12 m s−1 . The largest number of
tween 0 and 10◦ . convective storm cells with a moving speed between 12 and
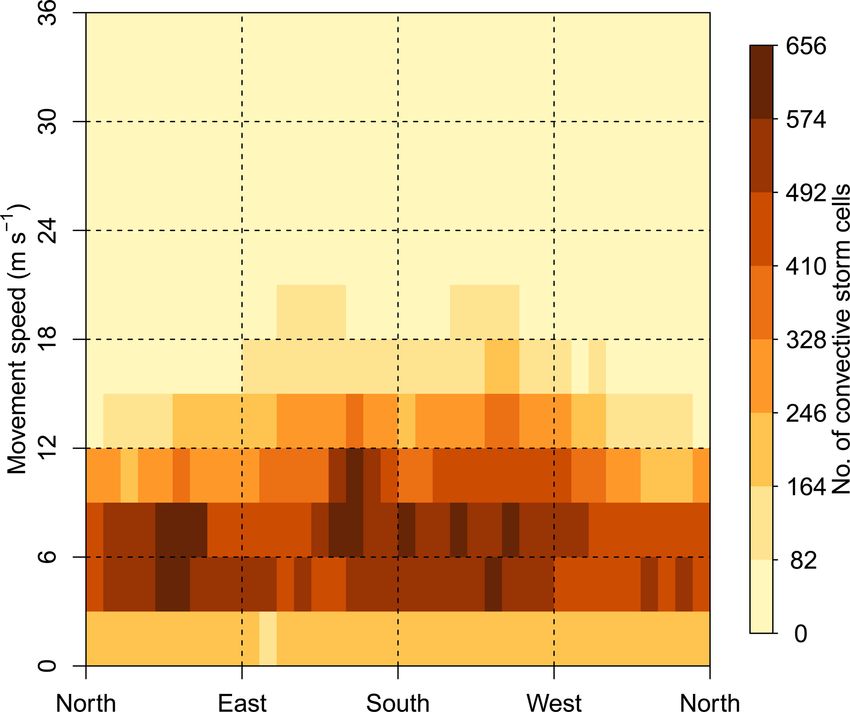
The 2-D histogram comparing the radar-derived direction 18 m s−1 were travelling from southerly directions.
of travel of storm cells and the average storm cells speed
(Fig. 10) is consistent with the histogram in Fig. 9 in terms 4.4 Large-scale drivers of convective storms in the Prut
of storm cells’ movement direction, revealing that the low- River basin
est number of storm cells had a movement direction gener-
ally from the north-west. From all the convective storm cells Gridded daily and monthly precipitation at 10 and 1 km
detected within the Prut River basin, between May and Au- spatial resolution, developed for the Prut River basin
gust (2003–2017), 80.4 % had a movement speed less than or (http://imdroflood.meteoromania.ro/geoportal/, last access:
equal to 12 m s−1 . Most of the convective storm cells moving 12 May 2019), were used to test the relation between the
www.nat-hazards-earth-syst-sci.net/19/1305/2019/ Nat. Hazards Earth Syst. Sci., 19, 1305–1318, 20191314 S. Burcea et al.: Radar-derived convective storms’ climatology for the Prut River basin: 2003–2017
Figure 11. Basin-averaged standardized anomalies of the number of
storm cells and precipitation amounts for the months of the active
season (May to August) in the period 2003–2017. The precipita-
tion amounts averaged over the Prut basin are computed from the
gridded dataset with 10 km resolution in latitude and longitude. The
correlation coefficient is 0.60.
Figure 10. The 2-D histogram of the number of convective storm the high convective activity appears in a larger-scale context
cells as a function of movement direction and storm speed, for the
by mapping the correlation of monthly number of convec-
Prut River basin, between 2003 and 2017 (May–August).
tive systems in the Prut basin and the CAPE (Fig. 13). The
correlation map between the monthly number of convective
systems in the Prut basin and total column water in the Eu-
radar-derived data and observations. The correlation coef- ropean regions is also illustrated in Fig. 14. The area of high
ficients between the basin-averaged number of convection positive correlations shown in Figs. 13 and 14 supports the
cells and observed precipitation amounts are positive and hypothesis that extratropical cyclones passing the Black Sea
statistically significant for both gridded datasets reaching a are the main large-scale dynamical drivers of convection in
magnitude of around 0.6 (Fig. 11). the Prut River basin. The patterns of atmospheric circula-
Even though the time interval is limited to 60 convective tions which can lead to the presence of low SLP over the
months (15 seasons), it is interesting to note the upward trend Black Sea are those identified by Surkova et al. (2013) us-
in the number of convective cells associated with a down- ing clustering analysis. The first SLP pattern in the paper of
ward trend in precipitation amounts (Fig. 11). Several phys- Surkova et al. (2013) shows an atmospheric trough extend-
ical mechanisms shape the extreme precipitation response ing from Scandinavia and the Baltic Sea to the Black Sea.
to thermodynamic and dynamic factors. The thermodynamic In this case, high atmospheric pressure prevails to the west
contribution is relatively well understood, but theoretical un- of the Black Sea region. The second SLP pattern shown by
derstanding of the microphysical and convective-related dy- Surkova et al. (2013) reveals an atmospheric trough spread-
namical contributions is still under development (O’Gorman, ing from the eastern Mediterranean towards the Black Sea,
2015). It is not the purpose of our study to analyse such issues which is blocked to the north by a high-pressure field. Our
in depth. However, we want to highlight here the importance correlation map linking the monthly number of convective
of integrating radar measurements with other types of meteo- systems in the Prut basin with the SLP (Fig. 12) can be inter-
rological data to better document the risks related to extreme preted as a linear superposition of the above-mentioned pat-
precipitation drivers in the context of climate variability and terns. Furthermore, the maps of monthly number of convec-
change. tive systems in the Prut basin correlated to CAPE (Fig. 13)
In this context, monthly values of sea level pressure (SLP), and total column water (Fig. 14) show a consistent picture
convective available potential energy (CAPE), and total col- with the patterns identified by Surkova et al. (2013).
umn water were extracted from ERA 5 reanalysis to identify
the large-scale drivers of local convective storms from the
Prut River basin. The reanalysis data span the common ac- 5 Conclusions
tive seasons.
We performed a correlation analysis using the monthly The characteristics of the convective storms within the trans-
number of convective systems in the Prut basin and SLP over boundary Prut River basin have been analysed over a 15-year
the Atlantic–European region. The correlation map (Fig. 12) period (2003–2017). The analysis is based on radar data,
suggests that low atmospheric pressure over the Black Sea and the SCIT algorithm has been used to detect and track
region can be a dynamical driver of convective storms in the convective storms in successive 6 min volumetric scans. For
analysed river basin. Furthermore, the statistical signature of the whole study period, more than 2.2 million storm cells
Nat. Hazards Earth Syst. Sci., 19, 1305–1318, 2019 www.nat-hazards-earth-syst-sci.net/19/1305/2019/S. Burcea et al.: Radar-derived convective storms’ climatology for the Prut River basin: 2003–2017 1315 Figure 12. Correlation coefficients between the monthly number of storms in the Prut River basin and monthly means of sea level pressure (SLP) for the active season (May to August) in the period 2003–2017. The SLP data are from the ERA 5 reanalysis (the deterministic dataset). Hatched areas illustrate correlation coefficients statistically significant at confidence levels higher than 99 %. Figure 13. Correlation coefficients between the monthly number of convective storm in the Prut River basin and monthly means of convective available potential energy (CAPE) for the active season (May to August) in the period 2003–2017. The CAPE data are from the ERA 5 reanalysis (the deterministic dataset). Hatched areas illustrate correlation coefficients statistically significant at confidence levels higher than 99 %. www.nat-hazards-earth-syst-sci.net/19/1305/2019/ Nat. Hazards Earth Syst. Sci., 19, 1305–1318, 2019
1316                  S. Burcea et al.: Radar-derived convective storms’ climatology for the Prut River basin: 2003–2017

Figure 14. Correlation coefficients between the monthly number of storms in the Prut River basin and monthly total column water for the
active season (May to August) in the period 2003–2017. The SLP data are from the ERA 5 reanalysis (the deterministic dataset). Hatched
areas illustrate correlation coefficients statistically significant at confidence levels higher than 99 %.

were detected in the coverage area limited to between 20 and          the northern, central, and southern parts of the basin. The
300 km from the radar. A simple selection criterion, based on         north-western part of the basin has been identified as the re-
the average VIL values, has been used to separate convective          gion where the smallest number of convective cells were de-
from stratiform storm cells. A number of 9507 convective              tected, but this could be explained by the limitations of radar
storms with a duration of at least approximately 20 min have          measurements at long distances. Nevertheless, despite the in-
been identified in a study area. These were associated with           herent limitations of radar measurements, this type of analy-
just over 84 000 storm cells.                                         sis offers one of the most complete sources of information on
   From the analysis of the results in this study, a few mat-         the convective storms’ characteristics in the coverage area.
ters of the climatology of convective storms in the Prut River           Considering the convective storms that occurred between
basin have become clear. Interannual variation of the convec-         May and August (2003–2017), their radar-derived character-
tive activity was observed, with the largest number of convec-        istics have been analysed. The median duration of a convec-
tive cells detected in 2016. The monthly variation revealed           tive storm was found to be 42 min, while the median dis-
that the convection prevails during May–August, when more             tance travelled was found to be 23 km. The median speed
than 90 % of the convective cells were identified. According          of a storm was 7.7 m s−1 , increasing to 12.9 m s−1 for the
to the same analysis, the peak was registered in the month            convective storms that lasted more than 60 min and travelled
of July, when close to one-third of the total number of con-          more than 100 km. It was also found that the longer-lasting
vective cells were detected. The majority of convective storm         convective storms were more intense, and their frequency of
cells occurred in the afternoon and evening hours (between            occurrence approximately follows a log-linear decrease with
10:00 and 18:00 UTC), while during the night, convection              increasing intensity.
occurred more frequently than in the morning. These charac-              The convective storms’ movement direction and speed
teristics are associated with the seasonal and diurnal cycles         analysis highlighted the fact that there are intervals within
of temperature in the analysed area.                                  a given month when a great number of storm cells travel
   Although the spatial distribution of the convective cells          in preferential directions. An important number of convec-
shows convection developing throughout the whole basin                tive storms had a southerly track (12.2 % from the south-
area, interannual spatial variations in finer-scale patterns are      west and 10.8 % from the south–south-east). Also, the largest
also observed. The analysis revealed convection hotspots in           number of convective storms moving with higher speeds (be-

Nat. Hazards Earth Syst. Sci., 19, 1305–1318, 2019                            www.nat-hazards-earth-syst-sci.net/19/1305/2019/
S. Burcea et al.: Radar-derived convective storms’ climatology for the Prut River basin: 2003–2017                                    1317

tween 12 and 18 m s−1 ) came from the southerly directions.           Financial support. This research has been supported by the Ro-
The above-mentioned statistics are consistent with the corre-         manian National Authority for Scientific Research and Innovation
lation analysis performed using the monthly number of con-            (UEFISCDI) and ERA-NET Cofund WaterWorks2014 (grant no.
vective systems in the Prut basin and large-scale SLP. The            81/2016).
monthly number of convective systems in the Prut basin is
best correlated with low values of SLP over the Black Sea,
which is situated southward of the area of interest. The Black        Review statement. This paper was edited by Chris Reason and re-
                                                                      viewed by two anonymous referees.
Sea seems to act as an additional source of atmospheric hu-
midity feeding in the atmospheric low systems, with trajec-
tories passing over it and enhancing atmospheric instability
in the area of interest.
   This study, based mainly on radar data, offers perspec-            References
tive for the better understanding of convective storm activity,
which is of paramount importance in assessing the risks asso-         American Meteorological Society: Cell, Glossary of Meteorology,
ciated with severe weather episodes in the context of climate            available at: http://glossary.ametsoc.org/wiki/Cell (last access:
                                                                         12 May 2019), 2018.
variability and change. Given the study region and the den-
                                                                      Brooks, H. E. and Doswell, C. A.: Some aspects of the international
sity of radar sites, additional observations from neighbour-             climatology of tornadoes by damage classification, Atmos. Res.,
ing radars should be included to improve the quality of the              56, 191–201, https://doi.org/10.1016/S0169-8095(00)00098-3,
observations in the overlapping areas. Supplemental storm                2001.
properties could be analysed by including other datasets like         Brooks, H. E. and Stensrud, D. J.: Climatology of heavy rain events
lightning, satellite measurements, reanalysis, and ground ob-            in the United States from hourly precipitation observations, Mon.
servations. The latter could be also used to assess the per-             Weather Rev., 128, 1194–1201, https://doi.org/10.1175/1520-
formance of the convective storm identification and tracking             0493(2000)1282.0.CO;2, 2000.
algorithm, and, through this, to derive comprehensive and             Cărbunaru, D., Stefan, S., Sasu, M., and Stefănescu, V.: Analysis of
high-resolution climatology of weather events such as ex-                Convective Thunderstorm Split Cells in South-Eastern Romania,
treme precipitation and hailfall. Our study reveals the fea-             International Journal of Atmospheric Sciences, 2013, 162541,
                                                                         https://doi.org/10.1155/2013/162541, 2013.
sibility of integrating radar measurements with other types
                                                                      Cică, R. , Burcea, S., and Bojariu, R.: Assessment of severe hail-
of meteorological observations and reanalysis to better doc-
                                                                         storms and hail risk using weather radar data, Met. Apps., 22,
ument the risks related to extreme meteorological events in              746–753, https://doi.org/10.1002/met.1512, 2015.
the context of climate variability and change.                        Copernicus Climate Change Service (C3S): ERA5: Fifth gener-
                                                                         ation of ECMWF atmospheric reanalyses of the global cli-
                                                                         mate, Copernicus Climate Change Service Climate Data Store
Data availability. Because of the data policy, raw radar data and        (CDS), available at: https://cds.climate.copernicus.eu/cdsapp\
radar products are not publicly available.                               T1\textbackslash#!/home (last access: 10 May 2019), 2017.
                                                                      Davini, P., Bechini, R., Cremonini, R., and Cassardo, C.: Radar-
                                                                         based analysis of convective storms in Nortwestern Italy, Atmo-
Author contributions. All the authors contributed equally to the         sphere, 3, 33–58, https://doi.org/10.3390/atmos3010033, 2012.
manuscript.                                                           Goudenhoofdt, E. and Delobbe, L.: Statistical Characteristics of
                                                                         Convective Storms in Belgium Derived from Volumetric Weather
                                                                         Radar Observations, J. Appl. Meteor. Climatol., 52, 918–934,
Competing interests. The authors declare that they have no conflict      https://doi.org/10.1175/JAMC-D-12-079.1, 2013.
of interest.                                                          Greene, D. R. and Clark, R. A.: Vertically Integrated Liq-
                                                                         uid Water – A New Analysis Tool, Mon. Weather
                                                                         Rev.,       100,       548–552,     https://doi.org/10.1175/1520-
                                                                         0493(1972)1002.3.CO;2, 1972.
Special issue statement. This article is part of the special issue
                                                                      Johnson, J. T., MacKeen, P. L., Witt, A., Mitchell, E. D., Stumpf, G.
“Hydroclimatic extremes and impacts at catchment to regional
                                                                         J., Eilts, M. D., and Thomas, K. W.: The Storm Cell Identification
scales”. It is not associated with a conference.
                                                                         and Tracking Algorithm: An Enhanced WSR-88D Algorithm,
                                                                         Weather Forecast., 13, 263–276, https://doi.org/10.1175/1520-
                                                                         0434(1998)0132.0.CO;2, 1998.
Acknowledgements. The study was financially supported by the          Lemon, L. R., Stan-Sion, A., Soci, C., and Cordoneanu, E.: A
IMDROFLOOD project under the ERA-NET Cofund Water-                       strong, long-track, Romanian tornado, Atmos. Res., 67–68, 391–
Works2014. We thank our colleagues Alexandru Dumitrescu and              416, https://doi.org/10.1016/S0169-8095(03)00063-2, 2003.
Sorin Dascălu, from the National Meteorological Administration       May, P. T. and Ballinger, A.: The Statistical Characteris-
(Bucharest, Romania), for their help in processing gridded precipi-      tics of Convective Cells in a Monsoon Regime (Dar-
tation datasets for the Prut River basin.                                win, Northern Australia), Mon. Weather Rev., 135, 82–92,
                                                                         https://doi.org/10.1175/MWR3273.1, 2007.

www.nat-hazards-earth-syst-sci.net/19/1305/2019/                             Nat. Hazards Earth Syst. Sci., 19, 1305–1318, 2019
1318 S. Burcea et al.: Radar-derived convective storms’ climatology for the Prut River basin: 2003–2017 Mohee, F. M. and Miller, C.: Climatology of Thunderstorms for Seres, A. T. and Horváth, Á.: Thunderstorm climatology in Hun- North Dakota, 2002–06, J. Appl. Meteor. Climatol., 49, 1881– gary using Doppler radar data, Quarterly Journal of the Hungar- 1890, https://doi.org/10.1175/2010JAMC2400.1, 2010. ian Meteorological Service, 119, 185–196, 2015. O’Gorman, P. A.: Precipitation Extremes Under Cli- Surkova, G. V., Arkhipkin, V. S., and Kislov, A. V.: At- mate Change, Curr. Clim. Change Rep., 1, 49–59, mospheric circulation and storm events in the Black Sea https://doi.org/10.1007/s40641-015-0009-3, 2015. and Caspian Sea, Centr. Eur. J. Geosci., 5, 548–559, Peter, J. R., Manton, M. J., Potts, R. J., May, P. T., Collis, S. M., https://doi.org/10.2478/s13533-012-0150-7, 2013. and Wilson, L.: Radar-Derived Statistics of Convective Storms Wang, Y., Han, L., and Wang, H.: Statistical characteristics of in Southeast Queensland, J. Appl. Meteor. Climatol., 54, 1985– convective initiation in the Beijing-Tianjin region revealed 2008, https://doi.org/10.1175/JAMC-D-13-0347.1, 2015. by six-year radar data, J. Meteorol. Res., 28, 1127–1136, Qi, Y., Zhang, J., and Zhang, P.: A real-time automated convec- https://doi.org/10.1007/s13351-014-3061-3, 2014. tive and stratiform precipitation segregation algorithm in na- Wilks, D. S.: Statistical Methods in the Atmospheric Sciences, Sec- tive radar coordinates, Q. J. Roy. Meteor. Soc., 139, 2233–2240, ond Edition, Academic Press, San Diego, USA, 627 pp., 2006. https://doi.org/10.1002/qj.2095, 2013. Zhang, J. and Qi, Y.: A Real-Time Algorithm for the Correction of Romanescu, G. and Stoleriu, C. C.: Exceptional floods in the Brightband Effects in Radar-Derived QPE, J. Hydrometeor., 11, Prut basin, Romania, in the context of heavy rains in the 1157–1171, https://doi.org/10.1175/2010JHM1201.1, 2010. summer of 2010, Nat. Hazards Earth Syst. Sci., 17, 381–396, https://doi.org/10.5194/nhess-17-381-2017, 2017. Romanescu, G., Stoleriu, C. C., and Romanescu, A. M.: Water reservoirs and the risk of accidental flood occurrence. Case study: Stanca–Costeşti reservoir and the historical floods of the Prut river in the period July–August 2008, Romania, Hydrol. Pro- cess., 25, 2056–2070, https://doi.org/10.1002/hyp.7957, 2011. Nat. Hazards Earth Syst. Sci., 19, 1305–1318, 2019 www.nat-hazards-earth-syst-sci.net/19/1305/2019/
You can also read