Assessment of the Overtourism Phenomenon Risk in Tunisia in Relation to the Tourism Area Life Cycle Concept
←
→
Page content transcription
If your browser does not render page correctly, please read the page content below
sustainability

Article
Assessment of the Overtourism Phenomenon Risk in
Tunisia in Relation to the Tourism Area Life
Cycle Concept
Monika Widz * and Teresa Brzezińska-Wójcik
 Department of Regional Geography and Tourism, Faculty of Earth Sciences and Spatial Management, Maria
 Curie-Sklodowska University, al. Kraśnicka 2d, 20-031 Lublin, Poland; tbrzezin@poczta.umcs.lublin.pl
 * Correspondence: monika.widz@umcs.pl; Tel.: +48-81-537-6852

 Received: 30 January 2020; Accepted: 3 March 2020; Published: 5 March 2020

 Abstract: Tunisia is a destination where organised mass tourism has prevailed since 1985. This trend
 is still being observed, despite the unstable geopolitical situation in North Africa. Current reports
 from booking portals indicate that this country will be one of the most popular tourist destinations in
 2020. Therefore, the aim of the study was to determine the prospects for sustainable development
 in Tunisia in 2020–2025 as means to prevent the negative effects of overtourism. The research was
 conducted in three stages: (1) analysis of the phases of tourism development in Tunisia from 1960 to
 2019 in relation to the Tourism Area Life Cycle concept, (2) identification of the destination’s evolution
 in 2015–2019 with the method of trend function exploration, and (3) an attempt to assess the risk of
 overtourism in Tunisia in light of Tourism Carrying Capacity on the basis of the Tourism Intensity
 Index and Tourism Density index. The study results revealed three phases of development in Tunisia,
 i.e. exploration, involvement, and development. The verification of the trend function indicated that
 Tunisia would enter the consolidation phase in 2020. The highest risk of overtourism is estimated for
 three governorates—Tunis, Sousse, and Monastir.

 Keywords: tourism area life cycle model; tourism carrying capacity; tourism intensity index; tourism
 density index; overtourism

1. Introduction
      Tunisia, which is regarded as a “3S” destination, has been one of the most popular destinations
for years chosen by international tourists due to its diverse tourist offerings. Tourism services and
investments not only generate jobs, but also influence regional and local development.
      In every area, tourism, like most types of economic activity, is associated with measurable profits
and losses that should be assessed. An important element is the available area and other features of
the region as well as their response to tourist traffic. When “the impact of tourism on a destination
or parts thereof excessively influences perceived quality of life of citizens and/or quality of visitors’
experiences in a negative way”, the phenomenon can be referred to as overtourism [1]. As formulated
by Peeters et al. [2], “overtourism describes a situation in which the impact of tourism, at certain times
and in certain locations, exceeds physical, ecological, social, economic, psychological, and/or political
capacity thresholds”. As emphasised by Dodds and Butler [3], this is a new term for an old problem,
i.e. the presence of an excessive number of tourists in a certain area, which may exert a negative impact
on the place. The literature on this issue has been reviewed by Dodds and Butler [4], Milano et al. [5]
and Kruczek [6].
      The phenomenon of overtourism has been documented primarily in urban areas (e.g., Kraków,
Poland—Kruczek [7]) and in protected areas, especially in national parks (e.g., Cinque Terre National

Sustainability 2020, 12, 2004; doi:10.3390/su12052004                     www.mdpi.com/journal/sustainability
Sustainability 2020, 12, 2004                                                                        2 of 13

Park, Italy—Faccini et al. [8]), on coasts (e.g., Maya Bay—Phi Phi Leh, Thailand—Dodds [9]), on entire
islands (e.g., Mallorca, Spain—Garcia and Servera [10]), and in rural areas (e.g., Bled, Slovenia—Mihalič
et al. [11]). However, the problem has been assessed with different methods so far, including qualitative,
e.g., Koens et al. [12], and quantitative methods based on the tourism carrying capacity model, e.g.,
Bertocchi et al. [13]. A review study of overtourism in as many as 41 countries (the selection was
based on a set of criteria including one case per EU country, an even distribution over the four types
of destinations—rural, urban, coastal and islands, heritage and attractions, and 12 iconic non-EU
destinations) was conducted by Peeters et al. [2], who proposed a conceptual model of this phenomenon.
The importance of studies conducted by Manera and Valle [14] who carried out a comparative analysis
of the overtourism phenomenon in all countries of the world, should be emphasised as well.
       The overtourism phenomenon in an area requires an immediate response from entities involved in
tourism. This activity is usually strongly associated with the concept of sustainable tourism. It ensures
the use of geographical environment resources in such a way that future generations may benefit from
them. Therefore, overcrowding of the tourist areas or damage to their natural, cultural, recreational,
and specialist assets should be prevented. It is essential that the touristic area does not become a tourist
slum or lose its tourist function completely [15]. It is therefore important to determine the current stage
of tourism development in a destination and to plan its further development.
       The tourism planning process is gradual; it is characterised by continuity and comprehensiveness
and focuses on achievement of sustainable development [16]. Its goal is to generate income and
jobs on one hand and to protect resources ensuring tourist satisfaction on the other [17]. The space
planning process for the needs of tourism development in compliance with the concept of sustainable
development is becoming increasingly important in view of long-term prospect and attempts to
maintain harmony between the natural environment, local community, and economic development.
It is highly important that the Tourism Carrying Capacity should be defined in this process [2,14,18].
Excessive concentration of tourist traffic in a given area not only leads to overcrowding in attractive
sites, but also reduces the level of aesthetic sensations experienced by tourists and results in natural
environment degradation [7].
       The concept of carrying capacity in tourism originates in the 1960s [19,20], although the problem
(carrying capacity) was mentioned for the first time in 1936 [21]. Many definitions of the tourism
carrying capacity (TCC) have been proposed e.g., [22], but the most comprehensive one has been
formulated by the World Tourism Organization [23], i.e. tourism carrying capacity is “the maximum
number of people that may visit a tourist destination at the same time, without causing destruction of
the physical, economic, socio-cultural environment and an unacceptable decrease in the quality of
visitors’ satisfaction”. The definition of the tourism carrying capacity concept gave rise to the search
for a method to calculate an indicator [14] that facilitates determination of threshold values as the key
factor for sustainability and preserve environment’s good condition [24].
       Studies on this problem in Tunisia (e.g., [25,26]) emphasised the need to plan sustainable
tourism development in this country. This is associated with the documented problems in
sustenance/preservation of natural resources, especially in the coastal zone (e.g., [27,28]). However,
the phenomenon of overtourism was not documented. One of the recent studies highlighting this
phenomenon [14] has demonstrated that Tunisia belongs to the group of countries with a moderate
value of the tourism intensity index (422—mean value calculated for 1995–2015). This is important, as
many reports based on data from booking portals [29,30] show that this country will be one of the
most popular tourist destinations in 2020. The number of bookings made in this country by British
people alone has increased by as much as 96.1% [29].
       The main aim of the study is to assess the risk of overtourism in Tunisia based on the allowable
volume of tourist traffic. The assessment is supported by analysis of three specific issues: (1) phases
of tourism development in relation to the tourism area life cycle model with identification of the
current tourism phase in this country (2) determination of the tourism carrying capacity for each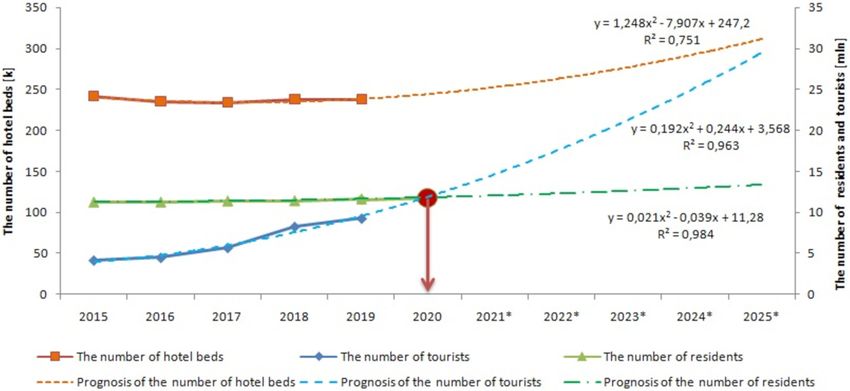
Sustainability 2020, 12, 2004                                                                         3 of 13

governorate with using selected indicators, and (3) identification of governorates that are most exposed
to overtourism risk and possibilities to prevent this phenomenon.

2. Materials and Methods
     The assessment of the risk of overtourism in the analysed area is a complex issue. Therefore,
it was divided into three basic stages: diagnosis, prognosis, and assessment of the overtourism risk
(Figure 1).

                                Figure 1. Scheme of the research design. Source: own study.

     The first stage of the study (Figure 1) consisted of data analysis and phases identification for tourism
development in Tunisia vs. the concept of the tourism area life cycle (TALC) [31], taking into account
the diagnosis of the tourist area definition proposed by Alejziak [32]. The TALC model assumes that
there are seven phases of tourist area evolution: exploration, involvement, development, consolidation,
stagnation, decline, or rejuvenation. Although it originates from the concept of the tourist product cycle,
the model can be suitable for analysis of a “3S” destination, such as Tunisia, as a recreational area (in the
subtropical and tropical climate zone). As distinguished by Rak, Pstrocka-Rak [33], this destination is
included in the group of two-generation tourist reception areas (the first generation—tourists arriving
by rail during the tourist centers heyday in the 19th century, the second one—tourists arriving by plane
in the second half of the 20th century). The TALC model facilitates determination of the relationship of
an increase in the number of tourists and hotel beds with the number of residents over a specified
time [34]. The identification of the development phases in Tunisia as a tourist reception area using the
TALC model in 1960–2019 included the number of international tourists, and the number of hotel beds.
     The second stage of the research (Figure 1) consisted of an attempt to determine the evolution
phase in Tunisia in 2020–2025 using the trend function exploration method. The method facilitates
the prediction of the tourist traffic volume should trends towards development and unintended
fluctuations in time series occur [35]. This stage was focused on establishment of a hypothetical but
most likely scenario for the future tourist traffic.
     The choice of the analytical model, i.e. the trend function (linear, logarithmic, power, exponential,
and polynomial) was based on calculated values of the determination coefficient (R-squared) for
2015–2019 for the following variables: the number of international tourists, the number of hotel beds,
and the number of residents. The coefficient shows how some changes in the dependent variable are
explained by changes in the explanatory variable. This facilitates assessing which of the analysed
models is well fitted [36] (p. 209). The prognosis for the evolution of Tunisia as a tourist destination
was based on a trend line analysis.
     The third stage of the study (Figure 1) was an attempt to assess the risk of overtourism in
the governorates of Tunisia. In the literature, the pre-evaluation stage consists of the tourism
carrying capacity determination [2,14], which is usually measured with the two most frequently used
indicators—the tourism intensity index (TII) and tourism density (TD) (Figure 2).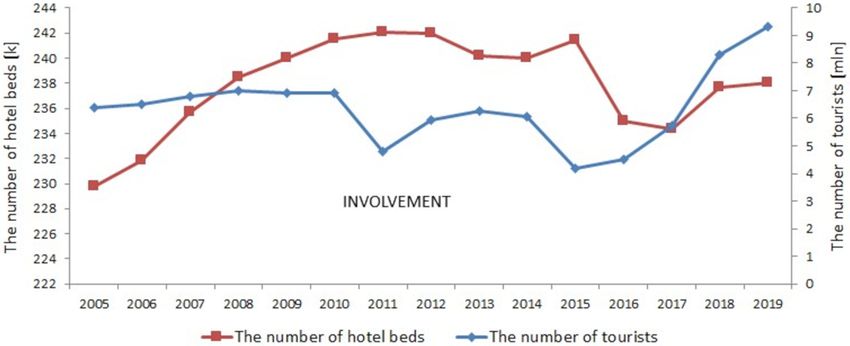
Sustainability 2020, 12, 2004                                                                                         4 of 13

      Figure 2. Tourism Carrying Capacity model in view of overtourism. Source: Own analysis based on
      Manera and Valle [14], Peeters et al. [2].

     Different variables are used for these indicators in the literature. For example, Manera and
Valle [14] used the following variables to calculate TII: the number of tourists, population, tourism
revenue, gross domestic product (GDP) for a specific country, and GDP for the world, whereas TD in
a given country was defined as the number of tourists per km2 . In turn, Peeters et al. [2] used two
variables, i.e. bed-nights and inhabitants, for calculation of TII and bed-nights per km2 for TD. In the
present study, the definitions and classification of TII and TD follow those proposed by Peeters et al. [2].
The variables proposed by these authors are best suited to the analysis of Tunisian administrative units.
     The tourism intensity index (TII) is the ratio of nights spent at tourist accommodation
establishments relative to the total resident population of the area:

                                   bed − nights
                                                TII = bed − nights/inhabitants
                                   inhabitants

      The Tourism Density index (TD) is defined as the annual number of bed-nights per km2 :

                                        bed − nights
                                                       TD = bed − nights/km2
                                             km2
     Next, for governorates classified at the high and highest risk of the overtourism phenomenon
according to the TII and TD indicators (Table 1), we formulated recommendations for the further use
of their tourist potential and the possibility to divert tourist traffic to the lowest risk or low risk areas.

      Table 1. Classification of the overtourism risk based on the tourism intensity index and tourism
      density index.

                          Indicator Values
                                                                    Degree of Risk           Interpretation of Risk
       Tourism Intensity Index           Tourism Density
                   9.58                         5                     Highest risk
             Source: Own analysis based on Peeters et al. [2], Eurostat [37], Peeters [38], World Bank Group [39].

    The study involves secondary data sources usage. In the first stage (preparation of the TALC
model), data from 1960–2019 were analysed. The figures were provided by two sources: (1) the Institut
National de la Statistique (INS) [40]—the “number of hotel beds” variable and (2) the Office National du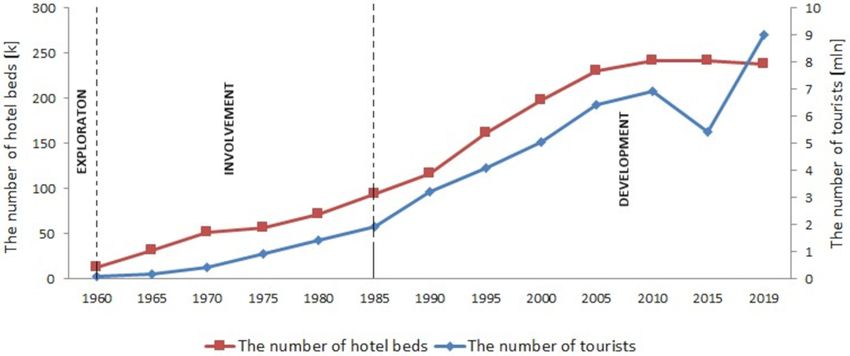
Sustainability 2020, 12, 2004                                                                            5 of 13

Turisme Tunisien (ONTT) [41]—the “number of international tourists” variable (information obtained
in person).
     The second stage of the study (prognosis for the next phase of Tunisia evolution as a tourist area)
was based on two data sources as well: 1) the Office National du Turisme Tunisien [41]—the “number of
international tourists in 2005–2019” variable (information obtained in person) and the Institut National
de la Statistique [40,42,43]—the “number of hotel beds and number of residents” variables.
     The third stage of the study (assessment of the overtourism risk phenomenon in Tunisian
governorates based on the tourism intensity index and tourism density) was conducted using 2018
data from all governorates. They were obtained from the reports of the Institut National de la
Statistiques [42,43] and Commissariat Général de Développement Régionale (CGDR) [44]. These were
data on the area, number of residents, and number of bed-nights in each governorate.

3. Results

3.1. Evolution of Tunisia as A Tourist Reception Area in 1960–2019
     Three phases of Tunisia development, i.e. exploration, involvement, and development,
were identified from the curve constructed in accordance with the TALC model proposed by Butler [31]
(Figure 3).

      Figure 3. Tunisia evolution phases as a tourist reception area in 1960–2019. Source: Own analysis of
      ONTT data.

      The first phase, exploration, lasted in Tunisia until the 1960s, i.e. before the appearance of stable
tourism investments. This period was characterised by a relatively small number of the explorer-type
tourists ranging from several thousand to 94,000 in 1960 (Figure 3). This type of tourists chose their
travel destination based on the desire to meet local people and explore natural and cultural resources,
to experience adventure, and to rest in a remote isolated and undiscovered area, which was not affected
by the lack of a tourist base [33]. At this phase of area development, the presence of tourists exerts a
relatively low impact on the economic and social life of residents [45].
      The involvement phase (1960–1985) was characterised by a substantial increase in the number of
tourists in Tunisia, i.e. 1.8 million in 1985, which was almost 20-times higher than in 1965. During this
period, a 10-year tourism development plan for the country was implemented to provide 35,000 hotel
beds. At that time, the first tourist areas were established near coastal towns, e.g., Tunis, Hammamet,
Nabeul, Sousse, Monastir, and Djerba [46]. Additionally, the Office National du Turisme Tunisien
(ONTT) was established to develop and promote tourism and to ensure high quality of tourism
services. The Société Hôtelière et Touristique de Tunisie (SHTT) was created to supervise and manage
the construction of national hotels. Consequently, 15,000 workplaces were created in the tourism
industry [47].
Sustainability 2020, 12, 2004 6 of 13
The mass-scale development of tourism noted after 1985 initiated the development phase in
Tunisia (Figure 3). In this phase, the number of hotel beds was increased to over 93,000 in 1985 and
40,000 jobs were created in the tourism sector [48]. Over the next 10 years (1990–2000), the number of
hotel beds doubled (197,500) as well as the number of jobs (79,000) [49]. The development of the hotel
base and economic changes, especially in 1987 [46], contributed to an increase in the tourists’ number.
In 1990, it reached over 3 million visitors and increased significantly to approximately 5 million tourists
within the next 10 years (1990–2000) [49].
A noticeable increase in tourist traffic was reported at the turn of the 20th and 21st centuries.
This generated increasing tourism-related income and development of infrastructure. Despite the
global crisis and the concern about H1N1 influenza worldwide, an increase in the number of tourist
arrivals was noted in Tunisia, especially in 2008 (approx. 7 million) (Figure 4).
Figure 4. Tunisia evolution phase as a tourist reception area in 2005–2019. Source: Own analysis of
ONTT data.
In 2011–2015, there were two sharp declines in the number of visitors to Tunisia (Figure 4). The first
was reported during the first three months of 2011 when the number of tourist arrivals decreased by
as much as 44% compared to 2010, and the tourism industry losses amounted to over 620 million
USD. Another decrease was noted in August 2015 when only 4.2 million tourists came, which was 24%
less than in the corresponding period of 2014, and the number of tourists from Europe decreased by
50% [47]. The decline in the tourist traffic resulted in a reduction of the number of hotels beds from
242,100 to 240,000 in 2013 and from 241,400 in 2015 to 235,000 in 2016 (Figure 4).
In 2018, the number of tourists increased again to reach 8.3 million, and the number of hotel beds
increased to 237.600 (Figure 4). Even higher tourist traffic (9.4 million visitors) was recorded in Tunisia
in 2019; it accounted for a 13.6% increase compared to 2018. This was mainly associated with the
greater number of tourists coming from European countries—an increase by almost 2.8 million (15.9%)
and from North African countries—by almost 5 million (15.5%) [50].
3.2. Prognosis for the Next Phase of Tunisia Evolution as A Tourist Area
The verification of the trend function models for the 2015–2019 time series (Table 2) at the level
of the coefficient of determination R-squared demonstrated the highest values of the polynomial
function for the analysed variables—number of tourists (R2 = 0.963), number of residents (R2 = 0.958),
and number of hotel beds (R2 = 0.751).
Therefore, the prognosis for the future phase of Tunisia evolution (2020–2025) was based on the
2nd order polynomial trend line. Given the values of the determination coefficients close to 1.0, it can
be concluded that the function accurately describes the development trend for the analysed variables.Sustainability 2020, 12, 2004 7 of 13
Table 2. Coefficients of determination R-squared in 2015–2019.
Values of Coefficients of Determination R-Squared for Variables
Trend Function
Number of Tourists Number of Residents Number of Hotel Beds
Linear 0.938 0.882 0.055
Logarithmic 0.809 0.727 0.193
Power 0.854 0.730 0.190
Exponential 0.955 0.884 0.053
Polynomial 0.963 0.958 0.751
Source: Own analysis of ONTT data.
In the analysed time series, an upward development trend was noted for all variables, i.e. the
number of hotel beds, tourists, and residents, starting in 2015. The intersection of the trend lines for the
“number of residents” and “number of tourists” variables will be observed in 2020 (Figure 5). This may
indicate that Tunisia is entering the next phase of the tourism area evolution referred to as consolidation.
It is characterised by an equal or higher number of tourists than the number of residents [31].
Figure 5. Prognosis for the next phase of Tunisia evolution in time series 2015–2025. Source: Own
analysis of ONTT data.
3.3. Assessment of the Overtourism Risk Phenomenon in Tunisian Governorates Based on the Tourism Intensity
Index and Tourism Density
The prognosis for the phase of Tunisia evolution as a tourist area in 2015–2019 determined by
the trend function models verification for the time series was the basis for identification of the tourist
carrying capacity and potential overtourism in all governorates.
Given the criteria for classification of the overtourism risk based on the value of the Tourism
Intensity Index (Table 1), it should be underlined that the highest risk (5) was demonstrated for three
out of the 24 Tunisian governorates analysed, i.e. Tunis, Sousse, and Monastir. Some governorates
were assigned the following levels of risk: Nabeul—high risk (4), Medenine—medium risk (3), and
Mahdia—low risk (2). The other 18 governorates were identified as the lowest-risk areas (Figure 6).
As shown by the criteria for classification of the overtourism risk based on the value of the Tourism
Density index (Table 2), the highest risk (5) was identified in two governorates—Medenine and Sousse.
Two administrative units, Monastir and Nabeul, were assigned medium risk (3) and low risk (2) was
detected in one governorate, i.e. Mahdia. As indicated by the TD values, the other 19 governorates
should be classified in the category of the lowest risk (Figure 7).Sustainability 2020, 12, 2004 8 of 13
Figure 6. Overtourism risk in Tunisia based on the tourism intensity index. Source: own study.
Figure 7. Overtourism risk in Tunisia based on the tourism density index. Source: own study.Sustainability 2020, 12, 2004 9 of 13
4. Discussion
The interpretation of the TALC curve obtained for the 1960–2019 data from Tunisia (Figure 3)
raises no doubts as to the first two phases—exploration (before 1960) and involvement (1960–1985).
In contrast, the development phase, especially in 2010–2019, may seem disputable. The reported
reduction in the number of tourists and hotel beds in 2011 and 2015 followed by an increase in these
parameters should not be interpreted as the decline and rejuvenation phases. Firstly, Tunisia has
not yet reached either the consolidation or the stagnation phases that precede the decline phase.
Secondly, the decrease in the tourist traffic did not result from deterioration of the services’ quality
or attractiveness of the offer. As emphasised by Zmyślony [51], the cause of the “developmental
anomalies” in both cases was the strong impact of internal developmental determinants.
The cause of the sharp decline in the tourist traffic in 2011 was the “Jasmine Revolution”,
which induced social and economic changes in the country and abroad. Consequently, the changing
geopolitical situation brought serious repercussions on the tourist markets of almost all North African
and Middle East countries. This resulted in a change in destinations and structure of tourist traffic.
In Tunisia, this led to cancellation of most of the tourist events booked for the 2011 season, although
the revolution lasted less than a month (from 17 December 2010 to 14 January 2011). The collapse
of the tourist traffic in 2015 was caused by the terrorist attacks at the Bardo National Museum
in Tunis (18 March 2015) and on the beach in Sousse (26 June 2015). Therefore, one should agree
with the suggestion made by Mika [52] that all manifestations of social and political tensions are
immediately reflected by reduction of the tourist traffic volume in countries affected by such unrest.
Thus, the geopolitical stability of Tunisia as a tourist region and tourists’ safety are of key importance
for the modern tourist market development.
The development phase implies that the tourist market is well defined. As emphasised by some
authors [53,54], residents in this phase lose control over the development of the tourism market and
local services are replaced by external investors associated mainly with hotel services. Additionally,
the local authorities involvement in the development of tourism declines, as the design and area
development takes place at the regional and national levels. Resident antagonisms may also be
sometimes observed.
The next stage in the development of Tunisia may be the consolidation phase. Its characteristic
feature is an increasing number of tourists, who may exceed the number of residents over time [41].
The involvement of residents proceeds through joining the business activity for tourists or focusing
services mainly or even exclusively on visitors [53].
The subjective selection of the 2015–2019 time series for the prediction process was prompted
by the visual assessment of the graph (Figure 4). It presented an upward development trend and
random fluctuations of the analysed variables. The reduction of the hotel beds number and tourists
recorded in 2011 and 2015 was caused by factors unrelated to tourism phenomena. As in the case of the
TALC curve for 1960–2019, the fluctuations may have affected the trend function analysis and exerted
a negative effect on the interpretation. Therefore, it was reasonable to carry out the prediction process
for 2020–2025 based on the trend function models for the time series 2015–2019, which reflects the
current and real dynamics of tourism in Tunisia. It revealed that Tunisia would enter the consolidation
phase in 2020. Furthermore, the number of tourists may be twice as high as the number of residents in
2025 (Figure 5), which may lead to overtourism in this area. Therefore, it is important at this stage to
take appropriate actions in governorates threatened with the greatest risk of this phenomenon.
As demonstrated by the tourism intensity index and tourism density, the phenomenon of
overtourism threatens the governorates of Sousse (the highest risk), Monastir, and Madanin. All these
areas are located on the east coast of Tunisia on the Mediterranean Sea. Currently, the Sousse and
Madanin governorates specialise in long-term seven-night stays, which are typical of only 20% of the
area of Tunisia.
What attracts tourists to these governorates? In addition to its recreational values, Sousse (also
called the “Pearl of the Sahel”) has unique cultural assets, e.g., the Medina of Sousse (kasbah, ramparts,Sustainability 2020, 12, 2004 10 of 13
medina, the Great Mosque, Bu Ftata Mosque, ribat), included on the UNESCO World Heritage List [55].
This area has an extensive tourist infrastructure, especially in Port El Kantaoui, where a yacht port,
golf courses, and numerous hotels can be found [56].
The Madanin Governorate covers a geographically diverse area. Tourist traffic is typically
concentrated on Djerba Island and Matmata-Dahar Plateau. Djerba Island, located in the Gulf of
Gabes, is an important recreational area attracting tourists with its sandy beaches and numerous
thalassotherapy centers. A great attraction on the Matmata-Dahar Plateau, famous for its “bad land”
loess landscape [57] known as “lunar” landscape, is the culture of Berber descendants [58] called
troglodytes. The “lunar landscape” near Matmata was the location for some scenes in the “Star Wars”
movie series [56]. Monastir attracts tourists mainly with the Monastir-Skanes seaside resort with
luxury hotels along sandy beaches [59,60].
It should be emphasised that, although they visit attractions or do sightseeing, most tourists
stay in the coastal zone in the three governorates. The tourist traffic overload of the coastal area
(overtourism) and the related problems (water stress, excess waste, shore line developments), especially
in Hammamet Bay and on Djerba island, are part of research focused on the deteriorating quality of
the natural environment (e.g., [28]) and the negative impact of tourism on the natural environment
(preservation of biodiversity and the natural character of the coast, fresh water supplies for tourists,
wastewater treatment, electricity consumption) and society (e.g., [26,27]).
5. Conclusions
Using the TALC model, three development phases were identified in Tunisia – exploration (before
1960), involvement (1960–1985), and development (1985–2019).
The prognosis carried out using the trend function models indicates that the next phase of Tunisia
evolution as a tourism area will be the consolidation phase. It will begin in 2020. The number of tourists
will increase significantly and gradually exceed the number of residents. As predicted, the number of
tourists in 2025 may be twice as big as the number of residents, which implies the risk of overtourism
in the analyzed area. The consolidation stage was a premise to take measures to investigate the degree
of overtourism in this destination.
The increasing tourists’ number strengthens the tourism function of the area and has a positive
effect on economic development at the regional level on the one hand, but can exert a negative impact
on the natural environment and, consequently, worsen the recreational conditions on the other hand.
It can also lead to the buildup of social tensions at various levels.
At present, however, the values of the tourism intensity index and tourism density, which reflect
the tourism carrying capacity, indicate the risk of overtourism in three governorates: the highest in
Sousse (TII 5, TD 5) and high in Monastir (TII 5, TD 3) and Madanin (TII 3, TD5).
The research procedure adopted in the present study yields a diagnosis of the overtourism problem
in the analysed area. However, it brings preliminary results, which diagnose the problem based on
a limited number of variables and represent entire governorate areas. In future, the phenomenon
of overtourism should be analysed taking into account a greater number of variables, e.g., the TCC
phenomenon. It is also important to diagnose overtourism in basic administrative units within the
governorates, which may be difficult due to the limited possibility of acquiring relevant data.
In compliance with the principles of sustainable development, specific measures should be
undertaken to prevent the phenomenon of overtourism in Sousse, Monastir, and Madanin and, in the
near future, also in Tunis and Nabeul. Some of them are highlighted by Halioui and Schmidt [26],
UNWTO [1], and Kruczek [6]. Actions that may limit the negative effects of overtourism should include
the following steps: 1. creation of new attractions and tourist routes in neighboring governorates
in order to disperse visitors in space and time; 2. adjustment of legal provisions for organization
and management of tourism in the governorates; 3. providing the local community with the benefits
from tourism.Sustainability 2020, 12, 2004 11 of 13
Author Contributions: Conceptualization, M.W.; methodology, M.W. and T.B.-W.; validation, M.W.; formal
analysis, M.W. and T.B.-W.; investigation, M.W. and T.B.-W.; resources, M.W. and T.B.-W.; data curation,
M.W.; writing—original draft preparation, M.W. and T.B.-W.; writing—review and editing, M.W. and T.B.-W.;
visualization, M.W.; supervision, T.B.-W. All authors have read and agree to the published version of the manuscript.
Funding: This research received no external funding.
Conflicts of Interest: The authors declare no conflict of interest.
References
1. Overtourism? Understanding and Managing Urban Tourism Growth beyond Perceptions. UNWTO. 2018.
Available online: https://www.e-unwto.org/doi/pdf/10.18111/9789284420070 (accessed on 21 November 2019).
2. Peeters, P.; Gössling, S.; Klijs, J.; Milano, C.; Novelli, M.; Dijkmans, C.; Eijgelaar, E.; Hartman, S.; Heslinga, J.;
Isaac, R.; et al. Research for TRAN Committee—Overtourism: Impact and Possible Policy Responses; European
Parliament Policy Department for Structural and Cohesion Policies: Brussels, Belgium, 2018; Available online:
http://www.europarl.europa.eu/thinktank/en/document.html?reference=IPOL_STU(2018)629184 (accessed
on 5 November 2019).
3. Dodds, R.; Butler, R. The phenomena of overtourism: A review. Int. J. Tour. Cities 2019, 5, 519–528. [CrossRef]
4. Dodds, R.; Butler, R. (Eds.) Overtourism: Issues, Realities and Solutions; De Gruyter: Berlin, Germany; Boston,
MA, USA, 2019.
5. Milano, C.; Cheer, J.M.; Novelli, M. (Eds.) Overtourism: Excesses, Discontents and Measures in Travel and
Tourism; CABI: Wallingford, UK; Boston, MA, USA, 2019.
6. Kruczek, Z. Ways to Counteract the Negative Effects of Overtourism at Tourist Attractions and Destinations.
Ann. Univ. Mariae Curie-Skłodowska 2019, LXXIV, 45–57. [CrossRef]
7. Kruczek, Z. Turyści vs mieszkańcy. Wpływ nadmiernej frekwencji turystów na proces gentryfikacji
miast historycznych na przykładzie Krakowa/Tourists vs. Residents. The Influence of Excessive Tourist
Attendance on the Process of Gentrification of Historic Cities on the Example of Kraków. Tur. Kult. 2018, 3,
29–41. Available online: http://turystykakulturowa.org/ojs/index.php/tk/article/view/956/810 (accessed on 10
June 2019).
8. Faccini, F.; Raso, E.; Malgarotto, C.; Antonielli, G. Rockfall Risk Assessment and Management Along the
“Via dell’Amore” (Lovers’ Lane) in the Cinque Terre National Park (Italy). Eng. Geol. Soc. Territ. 2015, 2,
1979–1983.
9. Dodds, R. Koh Phi Phi: Moving Towards or Away from Sustainability? J. Tour. Res. 2010, 15, 251–265.
[CrossRef]
10. Garcia, C.; Servera, J. Impacts of tourism development on water demand and beach degradation on the
island of Mallorca (Spain). Geogr. Ann. 2003, 85, 287–300. [CrossRef]
11. Mihalič, T.; Šegota, T.; Knežević Cvelbar, L.; Kuščer, K. The influence of the political environment and
destination governance on sustainable tourism development: A study of Bled, Slovenia. J. Sustain. Tour.
2016, 24, 1489–1505. [CrossRef]
12. Koens, K.; Postma, A.; Papp, B. Is overtourism overused? Understanding the impact of tourism in a city
context. Sustainability 2018, 10, 4384. [CrossRef]
13. Bertocchi, D.; Camatti, N.; Giove, S.; van der Borg, J. Venice and Overtourism: Simulating Sustainable
Development Scenarios through a Tourism Carrying Capacity Model. Sustainability 2020, 12, 512. [CrossRef]
14. Manera, C.; Valle, E. Tourist Intensity in the World, 1995–2015: Two Measurement Proposals. Sustainability
2018, 10, 4546. [CrossRef]
15. Butler, R.W. Challenges and opportunities. Worldw. Hosp. Tour. Themes 2018, 10, 635–641. [CrossRef]
16. Inskeep, E. Tourism Planning: An Integrated and Sustainable Development Approach; Van Nostrand Reinhold:
New York, NY, USA, 1991.
17. Gunn, C. Tourism Planning: Basics, Concepts, Cases, 3rd ed.; Taylor and Francis: London, UK, 1994.
18. Kowalczyk, A. Koncepcje teoretyczne bliskie idei turystyki zrównoważonej/Theoretical concepts close to
sustainable tourism. In Turystyka Zrównoważona/Sustainable Tourism; Kowalczyk, A., Ed.; PWN Publishers:
Warsaw, Poland, 2010; pp. 44–55.
19. Coccossis, H.; Mexa, A. (Eds.) The Challenge of Tourism Carrying Capacity Assessment: Theory and Practice;
Ashgate Publishing Ltd.: Aldershot, UK, 2004.Sustainability 2020, 12, 2004 12 of 13
20. Pstrocka, M. Issues Concerning Tourist Carrying Capacity in the English Language Literature. Turyzm
Tourism 2004, 14, 91–103.
21. Manning, R.E. How Much is Too Much? Carrying Capacity of National Parks and Protected Areas.
In Proceedings International Conference on Monitoring and Management of Visitor Flows in Recreational and
Protected Areas; Arnberger, A., Brandenburg, C., Muhar, A., Eds.; Bodenkultur University Vienna: Vienna,
Austria, 2002; pp. 306–313. Available online: http://mmv.boku.ac.at/downloads/mmv1-proceedings.pdf
(accessed on 16 February 2020).
22. Saarinen, J. Traditions of sustainability in tourism studies. Ann. Tour. Res. 2006, 33, 1121–1140. [CrossRef]
23. Tourism Congestion Management at Natural and Cultural Sites; World Tourism Organization: Madrid, Spain, 2004;
Available online: https://www.e-unwto.org/doi/pdf/10.18111/9789284407637 (accessed on 12 October 2019).
24. Regel, S. Chłonność obszarów turystyczno-wypoczynkowych/The capacity of tourist and leisure areas.
Zesz. Nauk. Inst. Tur. 1975, 2, 109–117.
25. Jaziri, R.; Boussaffa, A. The future of tourism in Tunisia, Sustainability and responsibility of stakeholders.
In Proceedings of the International Conference “Global Sustainable Tourism”, Nelspruit, South Africa, 15–19
November 2010; pp. 15–19.
26. Halioui, S.; Schmidt, M. Participatory Decision-Making for Sustainable Tourism Development in Tunisia.
In Tourism, Culture and Heritage in a Smart Economy; Springer: Cham, Switzerland, 2017; pp. 323–338.
27. Chapoutot, J.M.M. Profil de Durabilité dans Quelques Destinations Touristiques Méditerranéenes—La Destination
Jerba en Tunisie; Plan Bleu: Sophia Antipolis, France, 2011.
28. Agoubi, B.; Kharroubi, A.; Abida, H. Hydrochemistry of groundwater and its assessment for irrigation
purpose in coastal Jeffara aquifer, southeastern Tunisia. Arab. J. Geosci. 2013, 6, 1163–1172. [CrossRef]
29. Hampson, L. The Top Travel Trends for 2020, According to Experts. 2019. Available online: https:
//www.standard.co.uk/lifestyle/travel/travel-trends-for-2020-a4323191.html (accessed on 15 January 2020).
30. Łysik, M. Podróżnicze Plany Polaków na rok 2020—Analiza Przedsprzedaży Wycieczek w Serwisie
FLY.PL/Travel Plans of Poles for 2020—Pre-Sale Analysis of Tours at FLY.PL. 2020. Available online: https:
//fly.pl/komunikaty/trendy-wakacyjne-2020-analiza-przedsprzedazy-wycieczek-w-serwisie-fly-pl/ (accessed
on 5 January 2020).
31. Butler, R.W. The concept of a tourist area cycle of evolution. Can. Geogr. 1980, 24, 5–12. [CrossRef]
32. Alejziak, W. Przemysł turystyczny—Przyczynek do dyskusji na temat zasadności używania, definicji oraz
zakresu znaczeniowego poj˛ecia. In Przemysł Turystyczny; Szwichtenberg, A., Dziegieć, E., Eds.; Politechnika
Koszalińska–Uniwersytet Łódzki: Koszalin, Poland, 2000; pp. 13–58.
33. Rak, G.; Pstrocka-Rak, M. Ścieżki rozwoju, upadku i odmłodzenia obszarów recepcji turystycznej/Tourist
destinations’ pathways of development, decline and rejuvenation. Tur. Rekreac. 2011, 7, 41–53.
34. Thomas, R.N.; Pigozzi, B.W.; Sambrook, R.A. Tourist Carrying Capacity Measures: Crowding Syndrome in
the Caribbean. Prof. Geogr. 2005, 57, 13–20.
35. Majewski, J. Wykorzystanie metod prognozowania w turystyce/The use of method of forecasting in tourism.
Tur. Rekreac. 2013, 10, 45–51.
36. Sobczyk, M. Statystyka/Statistics, 1st ed.; PWN Publishers: Warsaw, Poland, 1996.
37. Eurostat. Tourism Statistics—Expenditure. 2018. Available online: http://ec.europa.eu/eurostat/
statisticsexplained/index.php/Tourism_statistics_expenditure#Accommodation_took_up_the_largest_
share_of_the_tourism_budget_of_EU_residents (accessed on 10 November 2019).
38. Peeters, P.M. Tourism’s Impact on Climate Change and its Mitigation Challenges: How Can Tourism Become
‘Climatically Sustainable’? Ph.D. Thesis, Delft University of Technology, Delft, The Netherlands, 2017.
39. World Bank Group. World Databank, World Development Indicators. 2018. Available online: http:
//databank.worldbank.org/data/home.aspx (accessed on 4 January 2020).
40. Institut National de la Statistique. Statistiques Tunisie. Rapport Annuel sur Les Indicateurs D’infrastructures
2018. Annual Report of Infrastructure Indicator. Available online: http://www.ins.tn/fr/publication/rapport-
annuel-sur-les-indicateurs-d%E2%80%99infrastructures-2017 (accessed on 20 July 2019).
41. Office National du Tourisme Tunisien. Available online: www.tourisme.gov.tn (accessed on 20 July 2019).
42. Institut National de la Statistique. Statistiques Tunisie. Annuaire Statistique de la Tunisie 2013–2017.
Statistical Yearbook Tunisia 2013–2017. Available online: http://www.ins.tn/sites/default/files/publication/
pdf/annuaire-2017_0.pdf (accessed on 20 July 2019).Sustainability 2020, 12, 2004 13 of 13
43. Institut National de la Statistique. Statistiques Tunisie. Tunisie en Chiffres 2018. Tunisia in Figures 2018.
Available online: http://www.ins.tn/en/publication/tunisia-figures-2018 (accessed on 10 December 2019).
44. Commissariat Général de Développement Régionale (CGDR). Available online: http://cgdr.nat.tn/fr/index.
php?srub=299&art=679 (accessed on 5 January 2019).
45. Derek, M. Funkcja Turystyczna Jako Czynnik Rozwoju Lokalnego w Polsce/Tourism Function as a Factor
of Local Development in Poland. Ph.D. Thesis, University of Warsaw, Warsaw, Poland, 2008. Available
online: http://py.wgsr.uw.edu.pl/uploads/f_turyzm/1_pdfsam_doktorat%20w%20pdf.pdf (accessed on 10
September 2019).
46. Poirier, R.A.; Wright, S. The Political Economy of Tourism in Tunisia. J. Mod. Afr. Stud. 1993, 31, 149–162.
[CrossRef]
47. Office National du Turisme Tunisien (ONTT). 2015. Available online: http://www.tourisme.gov.tn/tourisme-
en-tunisie/produit-touristique/bienvenue-en-tunisie.html (accessed on 15 August 2019).
48. Weigert, M. Le Tourisme en Tunisie: Les Défis à l’heure de la Transition Démocratique; IPEMED: Paris, France, 2012;
Available online: http://www.ipemed.coop/adminIpemed/media/fich_article/1326104889_LesNotesIPEMED_
12_LeTourismeEnTunisie_janv12.pdf (accessed on 14 October 2019).
49. Institut National de la Statistique. Statistiques Tunisie. Available online: http://www.ins.tn/ (accessed on 10
December 2019).
50. Web Manager Center (WMC, 2020) Plus de 9,4 Millions de Touristes ont Visité la Tunisie en 2019. Available
online: https://www.webmanagercenter.com/2020/01/03/443174/plus-de-94-millions-de-touristes-ont-visite-
la-tunisie-en-2019/ (accessed on 4 January 2020).
51. Zmyślony, P. Wykorzystanie koncepcji cyklu życia obszaru turystycznego do zarzadzania ˛ rozwojem turystyki
w mieście/Using the Tourist Area Life Cycle concept to manage the development of tourism in the city.
In Konkurencyjność Miast i Regionów na Globalnym Rynku Turystycznym/Competitiveness of Cities and Regions in
the Global Tourism Market; Sala, J., Ed.; PWE Publishers: Warsaw, Poland, 2010; pp. 383–399.
52. Mika, M. Przemiany pod wpływem turystyki na obszarach recepcji turystycznej/Changes under the influence
of tourism in the tourist reception areas. In Turystyka/Tourism; Kurek, W., Ed.; PWN Publishers: Warsaw,
Poland, 2010; pp. 406–482.
53. Szromek, A.R. Rozwój obszarów turystycznych i uzdrowiskowych w koncepcjach S.C. Ploga i R.W.
Butlera/Development of tourism area and health resorts in concepts of S.C. Plog and R.W. Butler. Zesz. Nauk.
Politech. Ślaskiej
˛ W Gliwicach 2010, 54, 305–322.
54. Zajadacz, A.; Śniadek, J. Cykl życia obszaru turystycznego—Studium przypadku regionu leszczyńskiego/The
Tourism Area Life Cycle—A Case Study of Leszno Region. In Gospodarka Turystyczna w Regionie/The Tourism
Economy in the Region; Rapacz, A., Ed.; Uniwersytet Ekonomiczny we Wrocławiu: Wrocław, Poland, 2011;
pp. 1029–1041.
55. UNESCO. Available online: https://whc.unesco.org/en/list/498/ (accessed on 7 December 2019).
56. Widz, M. Możliwości Wykorzystania Zasobów Środowiska Geograficznego Tunezji w Kreowaniu Oferty
Turystycznej/Possibilities of Using the Resources of Tunisia’s Geographical Environment in Creating a Tourist
Offer. Ph.D. Thesis, Maria Curie-Sklodowska University, Lublin, Poland, 2018.
57. Regaya, K. Etude Géologique de la Formation des Limons de Matmata (Sud Tunisien); Revue des Sciences de la
Terre INRS: Tunis, Tunisie, 1985; Volume 1.
58. Camps, G. Les Berbères, Mémoire et Identité; Editions Errances: Paris, France, 1995.
59. Tempelman, G.J. Tourism in South-Tunisia Developments and Perspectives in the Djerba-Zarzis Region.
J. Econ. Soc. Geogr. 1975, 66, 35–42.
60. Jeffrey, H.L.; Bleasdale, S. Tunisia: Mass Tourism in Crisis? In Mass Tourism in a Small World; Harrison, D.,
Sharpley, R., Eds.; CABI: Wallingford, UK, 2017.
© 2020 by the authors. Licensee MDPI, Basel, Switzerland. This article is an open access
article distributed under the terms and conditions of the Creative Commons Attribution
(CC BY) license (http://creativecommons.org/licenses/by/4.0/).You can also read