The Bike-Sharing System in Slovakia and the Impact of COVID-19 on This Shared Mobility Service in a Selected City
←
→
Page content transcription
If your browser does not render page correctly, please read the page content below
sustainability

Article
The Bike-Sharing System in Slovakia and the Impact of
COVID-19 on This Shared Mobility Service in a Selected City
Stanislav Kubal’ák              , Alica Kalašová        and Ambróz Hájnik *

                                          Department of Road and Urban Transport, University of Žilina, 01 026 Žilina, Slovakia;
                                          stanislav.kubalak@fpedas.uniza.sk (S.K.); alica.kalasova@fpedas.uniza.sk (A.K.)
                                          * Correspondence: ambroz.hajnik@fpedas.uniza

                                          Abstract: The current COVID-19 pandemic situation has a very significant impact on urban mobility,
                                          as evidenced by fundamental changes in passengers’ behavior. In many cases, passengers have
                                          switched to other modes of transport to minimize the risk of infection (particularly cycling and
                                          walking). This paper aims to point out the analysis results of the impacts of a bike-sharing system
                                          in the city of Košice before and during the COVID-19 pandemic. Additionally, this paper describes
                                          an analysis of the current state of bike-sharing in the Slovak Republic. We have stated a timeline of
                                          significant dates related to the COVID-19 pandemic. COVID-19 had a significant impact on people’s
                                          mobility and bike-sharing, as evidenced by the graphs and results in this paper.

                                          Keywords: shared economy; mobility; bike-sharing; COVID-19; Slovakia


                                          1. Introduction
Citation: Kubal’ák, S.; Kalašová, A.;
                                                At present, the car is the most commonly used means of transportation. This often
Hájnik, A. The Bike-Sharing System
                                          leads to major problems in cities, such as congestion, emissions, traffic accidents and long
in Slovakia and the Impact of
                                          delay times. Transport is an important area that directly affects the country’s economy [1].
COVID-19 on This Shared Mobility
                                                Most large cities address heavy traffic and a lack of parking spaces by investing in
Service in a Selected City.
                                          the development of public transport and new forms of mobility [2]. One of the most
Sustainability 2021, 13, 6544. https://
doi.org/10.3390/su13126544
                                          suitable solutions is to switch passengers from cars to public transport vehicles and other
                                          transport modes (e.g., walking and cycling). The attractiveness of bike-sharing and public
Academic Editor: Antonio Comi
                                          transport can affect passengers and the number of cars on the road network. It is possible
                                          to increase passengers traveling via public transportation by upgrading transport vehicles;
Received: 30 April 2021                   however, sufficient funding is needed to increase its attractiveness and competitiveness [3].
Accepted: 6 June 2021                     Along with the development of public transport, it is appropriate to introduce a bike-
Published: 8 June 2021                    sharing system. Thanks to that, passengers can travel to places where there is no public
                                          transport route.
Publisher’s Note: MDPI stays neutral            Every year, there has been an increase in published scientific articles on the topics of
with regard to jurisdictional claims in   both bike-sharing and how the pandemic has impacted urban mobility [4].
published maps and institutional affil-         Bike-sharing is used mainly in cities, where it facilitates the last mile of transportation
iations.                                  among commuters, meaning transport to places where public transport has no route [5].
                                          The bike-sharing system can also be used by companies in the form of the use of free space
                                          for advertising products and services [6].
                                                The target group of bike-sharing is users with the need to travel to a specific place.
Copyright: © 2021 by the authors.         For example, the user can be a tourist who wants to see and visit the surroundings of the
Licensee MDPI, Basel, Switzerland.        city, a student or worker who needs to be transported to school or work or residents who
This article is an open access article    do not own a bicycle or do not have bicycle storage facilities [7]. A great advantage for
distributed under the terms and           bike-sharing operators is the possibility of achieving revenue from advertising space [8].
conditions of the Creative Commons              The advantages for bike-sharing users are the low price and availability. Furthermore,
Attribution (CC BY) license (https://     bike-sharing supports the reduction of the number of cars on the roads and thus helps to
creativecommons.org/licenses/by/          improve traffic in cities. This reduces accidents and increases traffic safety. Bike-sharing is
4.0/).

Sustainability 2021, 13, 6544. https://doi.org/10.3390/su13126544                                       https://www.mdpi.com/journal/sustainability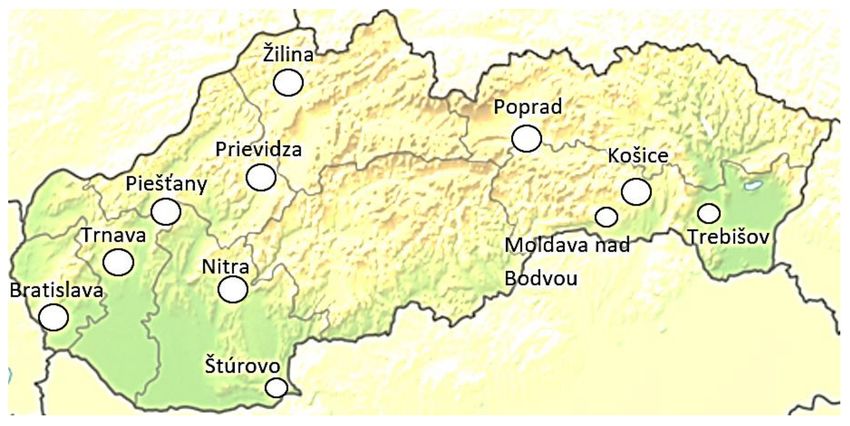
Sustainability 2021, 13, 6544                                                                                           2 of 20

                                also environmentally friendly and has a positive effect on human health. Thus, it is a more
                                sustainable mode of transport compared with public transport [9].
                                      The disadvantage for both users and bike-sharing operators is that it is weather
                                dependent. For this reason, the operation of bike-sharing during the winter is limited.
                                Further disadvantages for the bike-sharing operator are its high start-up costs, including the
                                cost of procuring bicycles, stations and maintenance, and the weak cycling infrastructure
                                in most places when implementing the system. A major disadvantage is also dealing with
                                possible theft and vandalism [9]. There are some other disadvantages of using bike-sharing
                                (e.g., health issues and carrying luggage). People with bad physical fitness, older people
                                and disabled people are not able to use a bike for transportation. Furthermore, there is
                                no space to carry large luggage. In most bike-sharing systems, it is not possible to rent a
                                bicycle adapted to traveling with children. In addition, the necessary accessories are absent,
                                such as a child seat [10].
                                      Most of the published scientific studies are primarily concerned with the composition,
                                operation, analysis and modeling of bike-sharing systems. The available studies can be
                                divided into several different areas of research. First of all, there is empirical research of
                                the functioning and use of a bike-sharing system [11–13].
                                      Furthermore, there are studies on problems with the locations and capacities of bike-
                                sharing stations [14,15].
                                      Additionally, there are other studies aimed at the following:
                                •    Modeling and optimizing problems with the relocation of bicycles [16–19];
                                •    The functioning of the bike-sharing system and the efficiency of using it under different
                                     conditions [20];
                                •    The impact of the bike-sharing system on people’s health and live as well as on the
                                     environment [21–23].
                                      Some studies indicate that the locations of stations being in densely populated areas
                                and places of concentration of companies, schools, universities, restaurants, cinemas and
                                shops increases the number of rentals [24,25].
                                      Until now, studies have been carried out on factors influencing the use of bike-sharing
                                systems and the level of satisfaction with the use of them [26]. The purpose of this research
                                was to understand the factors influencing the relatively low use of the bike-sharing system
                                in Ningbo (China). Based on this research, several conclusions were drawn regarding
                                planning and efficiency to increase the use of this system in the mentioned city.
                                      In the first months of the COVID-19 pandemic, most countries introduced restrictions
                                in the form of reduced mobility to prevent the spread of the virus. Several studies have
                                shown that these restrictions have been able to slow the global spread of this virus [27–29].
                                      The impact of the Covid-19 pandemic has also been intense in the area of urban
                                mobility. In [30], the authors identified a 76% decrease in overall mobility and a 93%
                                decrease in public transport use in Santander, Spain. On the contrary, the decrease in
                                car use was not as significant compared with public transport [30]. In [31], the authors
                                described a significant reduction in traffic of up to 80% in specific countries.
                                      The impact on mobility caused by the COVID-19 pandemic is expected to have a
                                lasting effect on passenger perception and behavior. Many studies [32–34] estimate that
                                this pandemic will lead to a long-term reduction in public transport use and, conversely, an
                                increase in bicycle use and walking. A study carried out in the Netherlands showed that
                                people are now more willing to use cars instead of public transportation [35]. The same
                                study states that a large proportion of people working from home during a pandemic
                                expect to work more often this way in the future [36]. Another study using mobility
                                data from Budapest identified an 80% decrease in demand for public transport and a 2%
                                decrease in demand for bike-sharing [37]. There was a significant decrease in the use of
                                bike-sharing in the case of Beijing, as 40% fewer rentals were made compared with the
                                same period in 2019 [38].
                                      This paper aims to point out the analysis results of the impacts of a bike-sharing
                                system in the city of Košice before and during the COVID-19 pandemic. Last year, there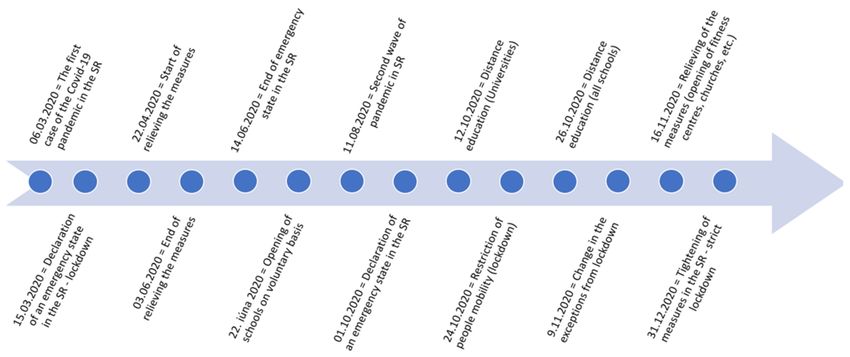
Sustainability 2021, 13, 6544                                                                                              3 of 20

                                was a decline in the number of bike rentals due to the impact of the COVID-19 pandemic.
                                In addition, this paper describes an analysis of the current state of bike-sharing in the
                                Slovak Republic. In our research, we asked the following questions:
                                1.   What bike-sharing models are used in Slovakia?
                                2.   Did COVID-19 affect the use of bike-sharing in the selected city?
                                3.   What decrease or increase in the number of bike rentals was recorded in 2020 com-
                                     pared to 2019?
                                     Section 2 describes the bike-sharing system in Slovakia, where we have listed all cities
                                that have established bike-sharing systems. There, the individual bike-sharing systems in
                                the mentioned cities are described and compared. We also describe bike-sharing in Košice
                                in more detail. Košice has the largest system of shared bicycles in Slovakia, which is why
                                we chose this city for our research. In the “Results and Discussion” section, we present a
                                comparison of data for 2019 and 2020. Furthermore, a summary of the results achieved
                                and our conclusions are stated.

                                2. Analysis of the Bike-Sharing System in Slovakia
                                      The following part of our study includes a description of the bike-sharing systems
                                in cities in Slovakia. This includes information on the prices and the number of available
                                bicycles and stations, as well as a comparison of this data between the mentioned cities.
                                      Bike-sharing currently operates in eleven Slovak cities (see Figure 1): Bratislava,
                                Trnava, Piešt’any, Nitra, Štúrovo, Prievidza, Žilina, Poprad, Košice, Moldava nad Bodvou
                                and Trebišov [39–46].

                                Figure 1. Cities in Slovakia providing bike-sharing systems [own study].

                                Comparison of Bike-Sharing Systems between the Mentioned Cities
                                     For comparison between cities, we chose data based on population and city area,
                                among other factors. The population of the city is an indicator of the possible demand
                                for the service operating in the city. The more inhabitants the city has, the more potential
                                users of the service there are. If it is a significant city, there is a growing need for people to
                                commute from home to school or work. This can make bike-sharing more attractive and
                                contribute to its greater use. It is university students who can have a significant impact on
                                the success of bike-sharing. The large area of the city contributes to the need for transport
                                from housing estates and more distant points of the city, which is suitable for the use of
                                bike-sharing.
                                     Table 1 provides data on the population, city area and terrain for each city where a
                                bike-sharing system operates. The bike-sharing model used is also listed.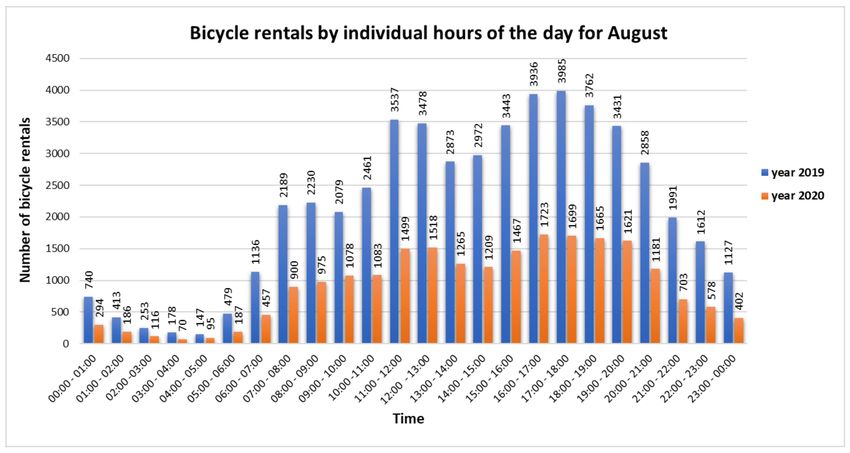
Sustainability 2021, 13, 6544                                                                                                          4 of 20

                       Table 1. Information about the cities where bike-sharing works [own study], based on [39–46].

             City                        Model                   Population *                   City Area (km2 )          Terrain
          Bratislava               Docking station                   437,725                        367.33             Rugged terrain
           Trnava                    Geo-fencing                     65,033                          71.54              Flat terrain
            Nitra                  Docking station                   76,533                         100.48             Rugged terrain
          Piešt’any                  Free-floating                   27,336                           44.2              Flat terrain
          Prievidza                Docking station                   50,626                          63.02              Flat terrain
            Žilina                 Docking station                   80,727                          80.03             Rugged terrain
            Košice                   Free-floating                   238,593                        242.77             Rugged terrain
           Poprad                    Free-floating                   51,235                          63.11             Rugged terrain
          Trebišov                   Free-floating                   24,649                          70.16              Flat terrain
  Moldava nad Bodvou                 Free-floating                   11,307                          19.77             Rugged terrain
     Štúrovo-Ostrihom              Docking station                   39,330                          114.4              Flat terrain
                                                     * For the period of 2020 (in thousands).

                                         If the terrain is difficult for the user to overcome with a bicycle, this may discourage
                                    him or her from choosing this means of transport. Some bike-sharing providers, such as
                                    Arboria bike in Trnava, use electric bicycles for transportation [43]. Antik Telecom s.r.o. also
                                    plans to put into operation electric bicycles. This company also operates electric scooters in
                                    Košice, which allow easier access to hilly terrain and are also suitable for longer routes [39].
                                         The use of this system is also affected by the number of available bicycles for trans-
                                    portation. There must be no situations where the user wants to rent a bike, but there is no
                                    free bike available at the moment, or it is too far away. This could affect the satisfaction
                                    with the service and its further use.
                                         Table 2 shows the information on the individual systems operating in the cities. One
                                    can see the number of available bicycles and stations as well as the number of inhabitants
                                    per bicycle available in the program, the number of bicycles calculated per 1000 inhabitants
                                    and the number of stations per 1 km2 .

      Table 2. Information on the number of bicycles and bike-sharing system locations in individual cities [own study], based
      on [39–46].

                                                                                                        Number of
                                Number of             Number of                Population/1                               Number of
          City                                                                                         Bicycles/1000
                                 Bicycles              Stations                  Bicycle                                 Stations/km2
                                                                                                        Inhabitants
       Bratislava                  750                     96                       584                      1.71             0.26
         Trnava                    118                     90                       551                      1.81             1.26
          Nitra                    70                      7                       1093                      0.91             0.07
       Piešt’any                   120                     6                        228                      4.39             0.14
       Prievidza                   103                     25                       492                      2.03             0.40
         Žilina                    120                     20                       673                      1.49             0.25
         Košice                   1000                     91                       239                      4.19             0.37
        Poprad                     65                      12                       788                      1.27             0.19
        Trebišov                   65                      12                       379                      2.64             0.17
     Moldava nad
                                   25                      6                        452                      2.21             0.30
      Bodvou
  Štúrovo-Ostrihom                 142                     20                       270                      3.70             0.17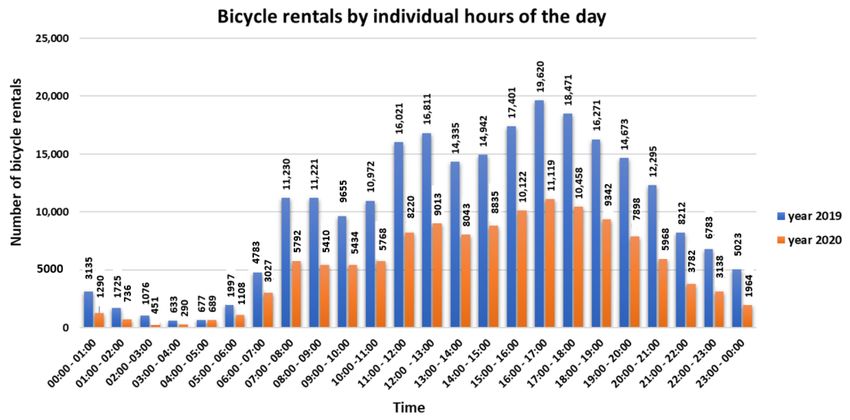
Sustainability 2021, 13, 6544                                                                                                         5 of 20

                                       The number of inhabitants per bicycle shows us the possible demand for the bicycle
                                 in the bike-sharing system. The last column of the table describes the density of stations
                                 in individual cities. However, this is not exact information, as the stations are deployed
                                 mainly according to user needs. Nevertheless, we can see in which cities there are fewer
                                 stations concerning the city area. The fewest number of stations per km2 is in Nitra at 0.07
                                 stations per km2 . On the contrary, the best result is in Trnava (1.26 stations per km2 ), but
                                 this is also caused by using a different bike-sharing model. The stations in Trnava are only
                                 virtual, and there is no need to build physical stations. The largest systems in Slovakia
                                 are in SlovnaftBajk in Bratislava and Verejný bicykel in Kosice [39–46]. Figure 2 shows the
                                 ratio of the number of bicycles in the individual bike-sharing systems.

                                 Figure 2. The ratio of the number of bicycles in the bike-sharing systems in cities in Slovakia [own
                                 study], based on [39–46].

                                      We can see that the largest number of shared bicycles is in Košice, and the second
                                 largest number is in Bratislava [39,41]. These two cities are the largest cities in the Slovak
                                 Republic, and there are also the largest numbers of bicycles.
                                      Table 3 describes the number of bicycle rentals and the number of users per bicycle
                                 available in the provider’s system. The data are for the year 2019. The highest value was
                                 in Nitra and Žilina. In Nitra, this was due to the smaller number of bicycles available in
                                 the system.

      Table 3. Information on the number of users and bicycle rentals in cities where bike-sharing systems are operated (2019)
      [own study], based on [39–46].

             City                  Population             Number of Users *        Number of Bicycle Rentals *   Number of Users/1 Bicycle
           Bratislava                437,725                    44,000                       440,000                        59
            Trnava                   65,033                      1800                        110,000                        15
             Nitra                   76,533                     14,000                       45,000                        200
           Piešt’any                 27,336                   Unknown                      Unknown                      Unknown
           Prievidza                 50,626                      4407                        13,632                         43
             Žilina                  80,727                     23,000                       291,000                       192
            Košice                   238,593                                                 226,727
            Poprad                   51,235                 24,000 together                   6100                          14
            Trebišov                 24,649                                                   3886
     Moldava nad Bodvou              11,307                                                   1249
       Štúrovo-Ostrihom              38,330                   Unknown                      Unknown                      Unknown

                                                    * Approximate value [39–46].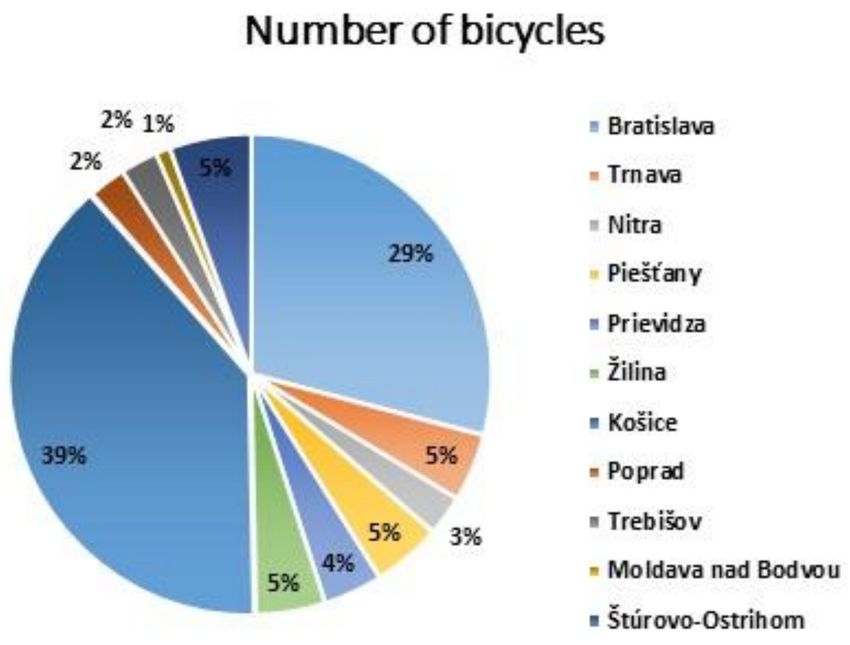
Sustainability 2021, 13, 6544                                                                                                          6 of 20

                                        Data from the system in Piešt’any were not available, as it was a system without
                                   registration; therefore, data on the number of users were unavailable. Additionally, we had
                                   no data from Štúrovo-Ostrihom.
                                        A comparison in terms of the price for renting a bike is one of the important factors
                                   in determining the attractiveness of the system. Some providers offer free minutes at the
                                   start of the ride, which can attract users. If the customer can get to the designated place
                                   by bicycle and knows that he or she will be able to do so within the free limit, he or she is
                                   more likely to choose this service.
                                        For comparison, we chose to rent a bicycle for 30 min, one hour and two hours.
                                   This can be seen in Table 4 [39–46], which shows the prices in individual cities when
                                   renting a bicycle for 30 min, 1 h and 2 h.

      Table 4. Prices for bicycle rentals in individual cities with rental periods of 30 min, 1 h and 2 h [own study], based on [39–46].

                                                                The Price of Driving at a Given Time (EUR)
                 City
                                                 30 min                                1h                                 2h
             Bratislava                            0.60                                0.60                              1.80
               Trnava                              0.35                                1.00                              2.50
                Nitra                              0.50                                0.50                              1.00
              Piešt’any                            0.0                                 0.0                                0.0
              Prievidza                            0.40                                0.80                              1.20
                Žilina                             0.0                                 0.0                               0.0 *
                Košice                             1.00                                1.00                              2.00
               Poprad                              1.00                                1.00                              2.00
              Trebišov                             1.00                                1.00                              2.00
      Moldava nad Bodvou                           1.00                                1.00                              2.00
         Štúrovo-Ostrihom                          1.30                                1.80                              2.80
                                                           * Free of charge for 1 h.

                                        Figure 3 shows a comparison of the prices in individual cities. The blue color shows
                                   the rental time of the bike for 30 min, the orange is for 1 h, and the gray is for 2 h.

        Figure 3. Price comparison when paying for bike rides with times of 30 min, 1 h and 2 h [own study], based on [39–46].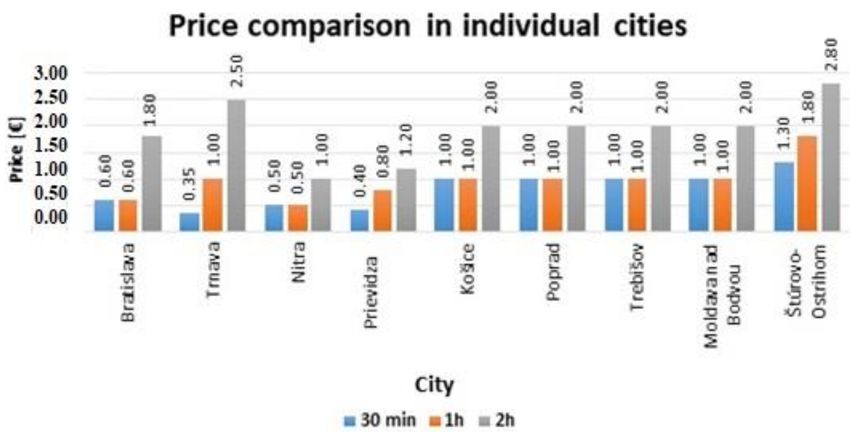
Sustainability 2021, 13, 6544                                                                                                      7 of 20

                                        In Bratislava, we chose a credit program for comparison, with a principle of deduction
                                   of credit for the minutes of rental [41]. There is no possibility of choosing programs or
                                   packages in Trnava. The amount to be paid is proportional to the rental time [43]. In Nitra,
                                   we chose a one-off fee, in which the rental price is cumulated with the rental time [40].
                                   “Piešt’anské užitočné koleso” in Piešt’any is a free service [45]. In Prievidza, we chose a
                                   one-time payment via SMS [44]. In Žilina, the first hour of the rental is free, and then we
                                   can use the opportunity to return the bike and rent it again for another free hour. If we did
                                   not lock the bike, we would be charged EUR 20 for a ride over the limit of 1 h [42]. There is
                                   a shared tariff for Košice, Poprad, Trebišov and Moldava nad Bodvou [39]. In terms of price,
                                   the most favorable systems are “Piešt’anské užitočné koleso” and “BikeKIA” in Žilina.
                                        The accessibility of the individual systems implemented in the mentioned cities differs
                                   not only in price, but also in limiting the minimum age of the user. Table 5 shows the
                                   minimum age of the user in each city.

                                   Table 5. Minimum ages of bike-sharing system users in individual cities [own study], based on [39–46].

                                                          City                                        Minimum User Age
                                                       Bratislava                                             16
                                                        Trnava                                                18
                                                         Nitra                                                16
                                                       Piešt’any                                         Unspecified
                                                       Prievidza                                         Unspecified
                                                         Žilina                                               16
                                                         Košice                                               18
                                                        Poprad                                                18
                                                        Trebišov                                              18
                                                  Moldava nad Bodvou                                          18
                                                   Štúrovo-Ostrihom                                           14

                                        Table 5 shows the compared advantages and disadvantages of the individual bike-
                                   sharing systems in Slovakia. The table is based on the described analysis of the bike-sharing
                                   systems in Slovakia.
                                        Table 6 shows that in terms of price, the most advantageous bike-sharing is in Piešt’any.
                                   The system in Piešt’any is the easiest to use for users. On the one hand, it is free. On the
                                   other hand, there is no need to install any application, and the bike is always available for
                                   immediate use without the need to unlock or lock the bike. This system would be more
                                   attractive with more bicycles to rent. Therefore, we consider bike-sharing in Žilina to be the
                                   most advantageous. It offers the possibility to return the bike and rent it again, while the
                                   user gets a free rental hour. This offers users plenty of time to travel for free and provides
                                   more bicycles than the bike-sharing system in Piešt’any.

        Table 6. Advantages and disadvantages of individual bike-sharing systems in Slovakia [own study], based on [39–46].

                        SlovnaftBajk—Bratislava                                              Arriva bike—Nitra
             Advantages                      Disadvantages                      Advantages                         Disadvantages
   A large number of bicycles        Deposit EUR 30 for the daily       Possibility to use nextbike        Small number of bicycles
                                              program                            programs
 Does not require installing the                                                                           Small number of bicycle
          application                                                                                              stations
                          Arboria bike—Trnava                                     Piešt’anské užitočné koleso—Piešt’any
             Advantages                      Disadvantages                      Advantages                         Disadvantages
          Virtual stations                                                       Free use
                                      When renting for 2 h, one of
                                                                                                         All bicycles are often rented
          Electric bicycles          the most expensive programs
                                                                         Without the need to lock
        Possibility of pause
                                                                        Verejný bicykel—Košice, Trebišov, Poprad, Moldava nad
                       Zelený Bicykel—Prievidza
                                                                                              Bodvou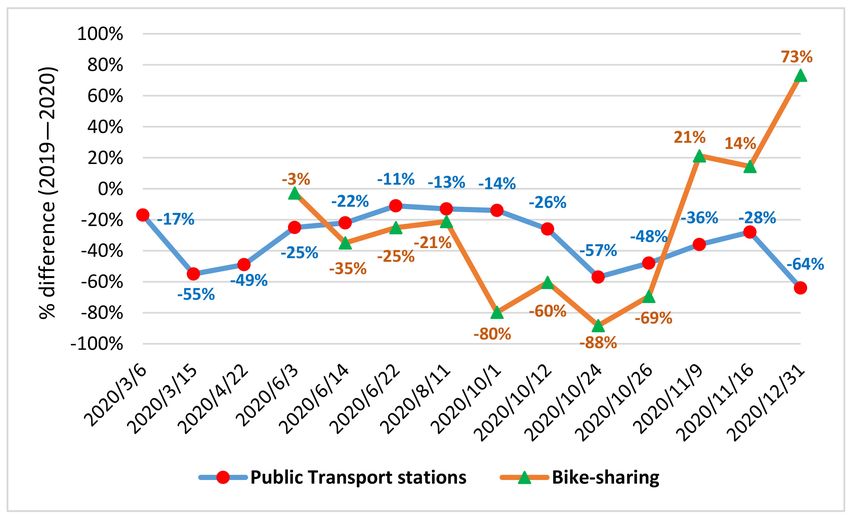
Sustainability 2021, 13, 6544                                                                                                    8 of 20

                                       3. Bike-Sharing System in Košice before and during the COVID-19 Pandemic
                                            We chose the city of Košice because it has the largest bike-sharing system in the
                                       Slovak Republic. Also, it is the second-largest city in the Slovak Republic.
                                            Košice is one of the six cities in Slovakia where there is a bike-sharing system from
                                       Antik Telecom s.r.o. The system operator was willing to provide us with data. The full
                                       operation was launched in May 2019. The use of rented bicycles is not limited to the city
                                       area, but their return must be made in this area. The operation of this system is based on
                                       the free-floating model [39].
                                            Stations have been set up in the city where it is possible to park and lock a bicycle [39].
                                       However, this is not a condition, and the user can lock the bicycle freely in the city, provided
                                       that the safety and smoothness of traffic is maintained. One cannot park the bicycle on
                                       a sidewalk, road or in a place where it would restrict the movement of pedestrians and
                                       cyclists. All bicycles are equipped with a mechanical system on the rear wheel which
                                       allows them to be locked away from the station.
                                            As for bike-sharing in Košice, it has the largest number of bicycles in Slovakia. Users
                                       have at their disposal approximately 1000 smart bicycles, each equipped with a GPS.
                                       There are 91 stations. It is necessary to register to use this service. The applicant can do this
                                       using the Antik SmartWay mobile application [39,47].
                                            After registration, it is necessary to pay a deposit of EUR 20. This deposit is returned
                                       to the user’s bank account in the case of the cancellation of the user’s account. It is also
                                       necessary to have at least EUR 1 of credit [39].
                                            The prices for bicycle rental are as follows: payment after the rental is EUR 1; the
                                       monthly payment is EUR 5; and the seasonal payment is EUR 30. Each hour, a fee of EUR 1
                                       is charged. The characteristics of the bike-sharing system are in Table 7.

                                Table 7. Characteristics of the bike-sharing system [own study], based on [39,48].

                                         Area        Start of                       Service                    Number of   Number of
      City         Population                                       Operator                       Model
                                        (km2 )      Operation                       Name                        Stations    Bicycles
                                                                     Antik
                                                                                    Verejný         Free-
    Košice            238,593           242.77       May 2019       Telecom                                          91       1000
                                                                                    bicykel       floating
                                                                      s.r.o.

                                       3.1. COVID-19 in the Slovak Republic
                                             The first case of COVID-19 (in Slovakia) was confirmed on 6 March 2020. Extensive
                                       measures against the spread of COVID-19 were gradually taken. Schools, offices, churches
                                       and some factories and shops (except groceries) were closed. These strict measures led
                                       to a reduction in people’s mobility. Additionally, they significantly reduced the spread
                                       of COVID-19. During June, the number of people with COVID-19 increased minimally.
                                       Gradually, individual measures were relieved. This favourable situation also resulted in
                                       increased mobility.
                                             The situation deteriorated in September and led to a tightening of measures. Based
                                       on that, the government of the Slovak Republic declared a second state of emergency
                                       (1 October 2020). Exemptions from the curfew changed after mass testing. Fitness cen-
                                       ters, swimming pools, churches and some schools, among other places, were gradually
                                       opened under strict hygiene rules. The situation started to deteriorate again after the
                                       relieving of measures. At the end of the year, there was a strict lockdown (churches, schools
                                       and other places were closed).
                                             Figure 4 is a timeline showing significant dates during 2020 related to the COVID-
                                       19 pandemic.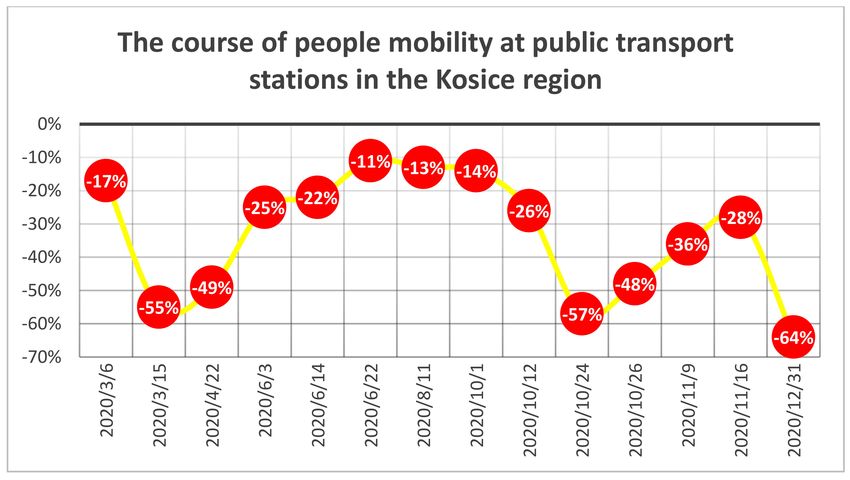
Sustainability 2021, 13, 6544                                                                                                 9 of 20

                       Figure 4. Timeline of significant dates during 2020 related to the COVID-19 pandemic [49–52].

                                        Figure 5 shows the course of the number of people with COVID-19 from March to
                                    December 2020.

                                    Figure 5. The course of the number of people with COVID-19 in the Slovak Republic [51].

                                    3.2. Data Processing Research Methodology
                                         This part of the paper aims to create a uniform and comprehensive procedure for the
                                    data analysis so that this procedure can be used in the same way and enable monitoring of
                                    the development of bike-sharing use in individual cities.
                                         This procedure was divided into three basic parts:
                                    •     Data pre-processing;
                                    •     Non-spatial analysis;
                                    •     Spatial analysis of data processing.
                                        Together, these parts formed a complete guide on how to process data from the
                                    export from the database to the creation of the presentable outputs (e.g., graphs, tables and
                                    map outputs).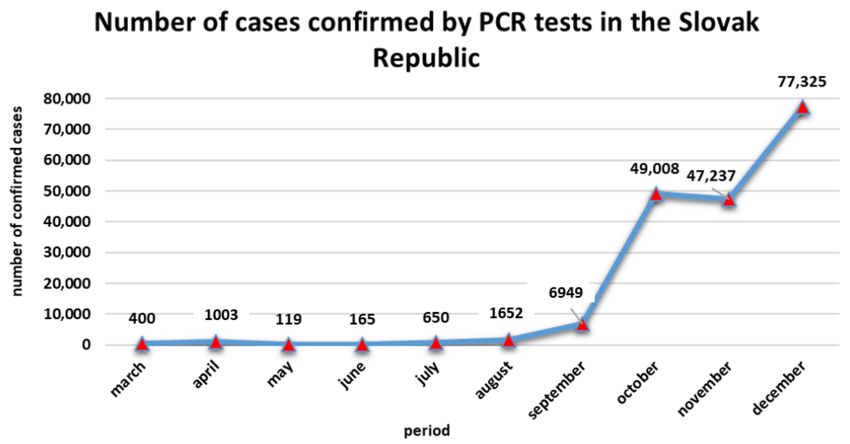
Sustainability 2021, 13, 6544                                                                                            10 of 20

                                Methodology and Processing Procedure
                                     For the purposes of this paper, spatial and non-spatial analysis were used. Spatial
                                analysis is the process of examining trends, equations and relationships between elements
                                and phenomena in a territory. Spatial analysis extracts or creates new information from the
                                input spatial data. It is used by geographic information systems [53].
                                     An important part of data processing was data pre-processing, followed by spatial
                                and non-spatial analysis. Together, these parts formed a comprehensive procedure for
                                analyzing the processing of bike-sharing data.
                                •    Used data:
                                      The most important data collected was information on the use of the Antik Telecom
                                s.r.o. bike-sharing system. Specifically, these were data for the year 2019, when bike-sharing
                                was introduced in Košice, and data for the year 2020, during which the COVID-19 pandemic
                                situation began and persisted. These data were for the period from May to December.
                                      Data from Antik Telecom s.r.o. were provided in .csv text format. A total of 237,962
                                records for 2019 and 131,016 records for 2020 were processed (e.g., date and time of bicycle
                                rental, GPS route coordinates and bicycle identification data).
                                •    Used programs:
                                    Microsoft Excel was used to process the non-spatial analysis. The Quantum Geo-
                                graphic Information System (QGIS) desktop traffic planning program version 3.4.15 [54]
                                and Open Street Maps [55] were used to process the spatial accessibility analysis.
                                •    Processing procedure:
                                     The following procedure was chosen for the processing of the provided data:
                                #    The study of the scientific literature dealing with the analysis of data on bike-sharing;
                                #    Obtaining the provided data (2019 and 2020) from Antik Telecom s.r.o.;
                                #    Pre-processing of the data provided by the operators into the form in which they
                                     would enter the analysis;
                                #    Processing of non-spatial analysis and the creation of graphs and tables with monthly,
                                     weekly and daily reports;
                                #    Processing of spatial analysis and the creation of maps on the use of bike-sharing;
                                #    Completion of information in the literature review and finishing the text part of the
                                     paper.

                                3.3. Pre-Processing of Data
                                      Data pre-processing was a very important phase which meant the removal of all
                                unsuitable data that was provided. The resulting data was then prepared for non-spatial or
                                spatial analysis. All results and outputs from these analyses were affected by the quality of
                                the data pre-processing, which made this phase very important.
                                      Some of the records in the data set did not occur in the territory of Košice, and in
                                some instances, part of the data gathered contained records from another city (e.g., Poprad
                                and Trebišov).
                                      This was because the identifier of a bicycle in the database remained the same even
                                after relocation to another city. For this reason, all bicycle activity records were transferred
                                from all cities where the bicycle was in operation. Some records did not even contain any
                                spatial localization, and therefore, they were not usable for further processing [39].
                                      In some cases of data pre-processing, there was a small decrease in the number of
                                records for each data set. However, this decrease occurred because some of the bicycles
                                were involved in testing the system during the 2019 season, so we did not use this data for
                                data processing. A total of 365,949 records were processed (2019 = 237,962 records; 2020 =
                                127,987 records).
                                      For these reasons, it was important to carry out pre-processing of the data correctly,
                                which guaranteed that the correct records of the rentals would enter the analyses.
Sustainability 2021, 13, 6544 11 of 20
4. Results and Discussion
This section describes the statistical evaluation of the data on the use of bike-sharing
in Košice. A comparison between 2019 and 2020 is also described. Part of our research was
for examining the impact of the COVID-19 pandemic on the use of bike-sharing.
The COVID-19 pandemic and individual measures had a significant impact on peo-
ple’s mobility. Figure 6 shows the course of people’s mobility at public transport stations
in the Kosice region.
Figure 6. The course of people’s mobility at public transport stations in the Kosice region [56].
A comparison of the decline in the use of bike-sharing and the reduction in people’s
mobility at public transport stations is in Figure 7. We performed this comparison based on
the individual important dates shown in Figure 4. However, bike-sharing data for March–
May were not available. Therefore, the values were missing for these months (6 March,
15 March and 22 April 2020). The course of reduced mobility at public transport stations
was a reflection of the measures at the time. The comparison of bike-sharing use for the
mentioned dates revealed an interesting increase in November and December. The reason
for this increase is stated in the text below Figure 8.
Figure 7. The decline in the use of bike-sharing and reduction in people’s mobility at public transport
stations [authors].Sustainability 2021, 13, 6544 12 of 20
Figure 8. Number of bicycle rentals for the periods of 2019 and 2020 [own study], based on [39].
In addition, in [52], the authors described the results of how the COVID-19 pandemic
affected the mobility of the Slovak population. The authors stated that the decrease in
mobility was due to the impact of COVID-19. The most significant decrease was recorded
for the following passenger groups: students, children (under 6 years old) and seniors
(65 years and older).
Table 8 shows the number of bicycles rented from May to December in 2019 and 2020.
The table shows that in 2020, there was a 46.25% decrease in bicycle rentals compared with
2019 (a decrease of 110,065 rentals). This decrease was caused by COVID-19. It had a very
significant impact, as evidenced by major changes in the decrease in bicycle rentals.
Table 8. Number of bicycle rentals via Antik Telecom s.r.o. for the years 2019 and 2020 [own study], based on [39].
Month May June July August September October November December Together
Number of year
11,721 18,388 21,587 24,344 23,859 13,997 8425 5576 127,897
Bicycle 2020
Rentals year
15,125 29,507 45,864 51,310 46,756 36,048 9785 3567 237,962
2019
Difference
−3404 −11,119 −24,277 −26,966 −22,897 −22,051 −1360 2009 −110,065
(2020–2019)
% Decrease or
−22.51% −37.68% −52.93% −52.56% −48.97% −61.17% −13.90% 56.32% −46.25%
Increase
Figure 8 shows the course of bicycle rentals from May to December in 2019 and 2020.
The figure also shows a significant decrease of 52.56% in bicycle rentals in August 2020
compared with August 2019. From September to December, a decrease in the number
of bicycle rentals can be observed (due to worse weather conditions (i.e., cold, rainy
weather)). The increase in the number of bicycle rentals in December 2020 was due to
the favorable weather during this period and the relieving of restrictions (e.g., opening
shops, services, churches and schools) against the spread of COVID-19. According to data
from the source [57], December was strongly above normal (very warm) in most parts
of Slovakia, except in some locations. Deviations of the average daily air temperature,
compared with the normal value for 1981–2010, reached from +5 to +10 ◦ C.Sustainability 2021, 13, 6544 13 of 20
We performed a statistical analysis where we calculated the mean, mode, median and
standard deviation. The mode was the most common value in the statistics file. The mean
is the usual average and can be calculated according to the following equation [58]:
n
1
x=
n ∑ xi (1)
i =1
where xi is the value of the ith point in the data set and n is the number of data points in
the data set.
The median is the middle value of the measured values, ordered in a non-decreasing
sequence. For an even n value [58], the median is calculated as follows:
x( n ) + x( n
2 2 +1)
xe = (2)
2
The standard deviation is a statistic that measures the dispersion of a dataset relative
to its mean [59]: s
2
∑( x − x )
σ= (3)
n
In statistics, the variance measures the variability from the average or mean. The
variance is calculated using this equation [59]:
1 n
σ2 =
n ∑ i =1 ( x i − x )2 (4)
The results of the statistical analysis are stated in Table 9. It is possible to see an
increase in the rental time in 2020 compared with 2019. This increase is represented by both
the mean (11.03%) and the median (14.56%).
Table 9. Results of statistical analysis of the average bicycle rental time [authors].
Period Mean Median Standard Deviation Variance
2020 9.96 10.15 1.4 1.69
2019 8.97 8.86 1.15 1.32
Figure 9 shows the course of the average bicycle rental time from May to December
for both years (2019 and 2020).Sustainability 2021, 13, 6544 14 of 20
Figure 9. Average bicycle rental time for the periods of 2019 and 2020 [own study], based on [39].
Figure 10 shows rentals of bicycles for each day of the week (2019 and 2020). The
days with the largest number of rentals included Monday, Tuesday, Wednesday, Thursday
and Friday. These days represent workdays, when the traffic volume is higher than
during weekends.
Figure 10. Bicycle rentals by working days and weekends for the periods of 2019 and 2020 [own
study], based on [39].
Figure 11 shows the course of bicycle rentals during the day in 2019 and 2020. In 2019,
the maximum number of rentals was in the interval from 4:00p.m. to 5:00 p.m. (19,620
rentals). Additionally, in 2020, the maximum (11,119 rentals) was recorded in the same
interval. This represents the afternoon peak hour. During this time interval, many people
are going home from work, schools and shops. During evening and night hours, the
number of rentals was lower than during the day, when people’s mobility was higher.Sustainability 2021, 13, 6544 15 of 20
The morning peak hour was between 7:00 a.m. and 08:00 a.m. The number of rentals for
each year was 11,230 (2019) and 5792 (2020).
Figure 11. Bicycle rentals by individual hours of the day for the periods of 2019 and 2020 [own study], based on [39].
There was a significant decrease in bicycle rentals in Košice during the COVID-19
pandemic. The bike-sharing system was not used often for transportation to school, work
or other locations because most people worked and studied from home.
Data Comparison: August 2019 and 2020
This part describes the comparison of data for August (2019 and 2020). We chose
this month due to the maximum number of bicycle rentals during both compared years.
Additionally, the most significant decrease in bike rentals was in 2020, compared with 2019.
Figure 12 shows the number of rentals for each day of the week. The days with
the largest number of rentals in 2019 included Thursday and Friday. The maximum was
recorded on Friday: 9656 rentals. In 2020, there were 64.5% (6228) fewer bicycle rentals
on Friday.
Figure 12. Bicycle rentals by working days and weekends for August 2019 and 2020 [own study], based on [39].Sustainability 2021, 13, 6544 16 of 20
Figure 13 shows the course of bicycle rentals at hourly intervals throughout the day.
The course of bicycle rentals was the same during both years, but in 2020, there was a
significant decrease in the number of rentals.
Figure 13. Bicycle rentals by individual hours of the day for August 2019 and 2020 [own study], based on [39].
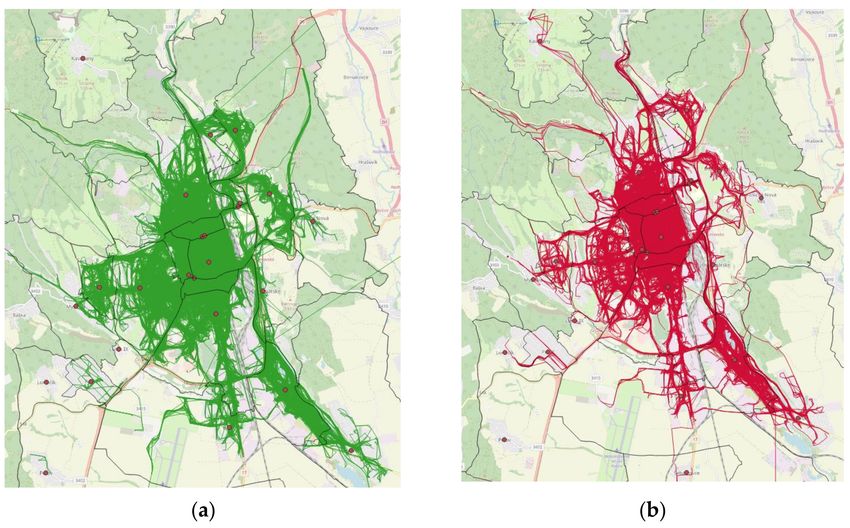
The main purpose of the spatial analysis was to analyze the data provided on bike-
sharing from Antik Telecom s.r.o. We performed this analysis using the selected GIS soft-
ware. Figure 14 shows that there was a larger volume of transportation in 2019 (Figure 14a)
compared with 2020 (Figure 14b). The largest changes can be seen in the outskirts of the
city. One can see a higher density of routes in 2019, such as in the western or northeast
parts of the city. In 2019, there were 51,310 rentals in Košice, while in 2020, there were only
24,344 rentals.
Figure 14. (a) Tracing of rented bicycles in August 2019 and (b) August 2020 [own study].Sustainability 2021, 13, 6544 17 of 20
In our research, we found answers to our research questions. In Slovakia, there are
three types of bike-sharing models in use: docking station, geo-fencing and free-floating.
The most-used models are the free-floating and docking station models.
The COVID-19 pandemic affected bike-sharing in Slovakia. In addition, individual
measures against the spread of COVID-19 influenced mobility and bike-sharing in Slovakia.
It is possible to see that impact in the graphs, tables and results described in the third and
fourth sections of the paper.
In 2020, there was a 46.25% decrease in the number of bike rentals (a decrease of
110,065 rentals). A decrease was achieved throughout the year, except in December, when
an increase of 56.32% was recorded.
The largest decrease was in October (61.17%). The main reason for this decrease was
the lockdown during this month. Restrictions were relieved in November, and demand
for transport increased slightly. There was a smaller percentage of decrease between 2019
and 2020.
The decrease was caused by COVID-19, which had a very significant impact on the
bike-sharing system. As we mentioned, the system was not used because most people
worked and studied from home (the home office). However, it was not only caused by the
home office and other restrictions. It was also caused by the people’s fear of COVID-19.
Many people were afraid of using the bike-sharing system or public transport, where they
would meet other passengers. People’s fear was mainly caused by the risk of infection.
Bicycles are not disinfected after each ride, as it is very difficult to ensure disinfection.
In this way, it is possible to get infected if the bike was used by someone with COVID-19.
It is simply caused by touching the bike with hands.The user had to wear a face mask and
gloves when renting a shared bicycle [39]; nevertheless, there were people without a face
mask or gloves. For some, it was uncomfortable to wear it while they were using a shared
bicycle. People preferred to use their own car or bicycle for transportation.
However, interesting results were achieved for the average rental time of the bicycles.
In 2020, there was a longer average rental time compared with 2019 during all months
except June. The average rental time in 2019 was 8.97 min, and in 2020 it was 9.96 min.
Thus, in 2020, the average rental time was almost 1 min longer. This is an increase of
approximately 11%. A longer rental time is a very interesting result. We do not have a
rational justification for this result. On the one hand, there was restricted movement for
people (lockdown). On the other hand, the rental time increased, but the number of rentals
decreased. It is possible that people started using bicycles for longer routes and enjoyed
cycling more. Additionally, people lacked social contact and enjoyed talking to other
people in real life (not just via video call). We think that before the pandemic, there was a
more hectic life in Slovakia. During the pandemic, people began to enjoy the opportunity
to meet another person. This could also have caused longer rental times. Of course, we
cannot say that this assumption of ours is the real reason for longer rental times. However,
this is one of the options.
In Košice, the flow of bicycles is higher in the city center area. On the other hand, bicy-
cles are located throughout the city. The purpose of bike-sharing is to offer an alternative,
more environmentally friendly mode of transport.
The decrease in using bike-sharing systems will influence the demand for transport
and its sustainability. The bike-sharing companies will have a little loss of income, but
all companies provide at least half an hour of use for free. Most rentals were provided
for free before this pandemic, so we can argue that it will have no significant impact on
the income of providers. However, due to the COVID-19 pandemic, the provider Antik
halved the monthly subscription (from EUR 5 to EUR 2.5). Antik wants to attract people to
start using bike-sharing again this way. We still believe that after this pandemic, people
will use shared bicycles again and more often. Public policy should support people using
bike-sharing for transportation, as it could help to attract people.
System operators are required to have enough bicycles at a given time and place that
can meet demand and enable the short-term use of this sustainable and environmentallySustainability 2021, 13, 6544 18 of 20
friendly mode of transport. Bicycles can be rented and returned at freely accessible stations
located in designated places around the city. Today, these stations allow smooth operation
without the need for an operator thanks to full automation.
The introduction of the bike-sharing system for residents and visitors to cities has
great potential. This is also evidenced by the increase in users of bike-sharing around
the world.
There are several positive benefits to sharing public bikes:
• An affordable alternative to individual car transport;
• Reduction of the amount of greenhouse gas emissions produced;
• Increasing the mobility of residents and visitors to the city;
• Increasing the attractiveness of the city from the point of view of tourism.
5. Conclusions
Our paper aimed to examine the impact of the COVID-19 pandemic on the bike-
sharing system. For our research, we used data from 2019, when the bike-sharing system
was not affected by the COVID-19 pandemic. We compared these data with data from
2020, when COVID-19 significantly affected this system. In addition, our other goal was to
describe the functioning of the bike-sharing system in cities in Slovakia. In recent years,
these systems have been introduced in many cities in Slovakia. Bike-sharing represents a
method of sustainable and smart mobility.
The quality of the bike-sharing system should meet the user’s expectations. Therefore,
it is possible to fulfill a questionnaire where users can state any expectations, requirements
and possible solutions to improve bike-sharing attractiveness. The achieved results may
be useful in carrying out activities aimed at increasing the use of bike-sharing as well as
increasing the user’s level of satisfaction.
In our further research, we want to focus on the outputs of this questionnaire. We
also want to find out the behavior and age structure of the users. It will be interesting to
continuously monitor the development of the number of shared bicycle rentals during the
COVID-19 pandemic and subsequently when it ends. Will the demand for bike-sharing be
the same as before the COVID-19 pandemic, or will it decrease or increase?
Author Contributions: Conceptualization, S.K. and A.H.; data curation, S.K., A.K. and A.H.; formal
analysis, S.K. and A.H.; investigation, S.K.; methodology, S.K.; resources, S.K.; visualization, S.K.,
A.K. and A.H.; writing—original draft, S.K. and A.H.; writing—review and editing, S.K.; supervision,
A.K.; project administration, A.K.; funding acquisition, A.K. All authors have read and agreed to the
published version of the manuscript.
Funding: This paper was created within the Identification and possibility of implementing new
technological measures in transport to achieve safe mobility during the pandemic caused by COVID-
19 (ITMS 313011AUX5) project.
Institutional Review Board Statement: Not applicable.
Informed Consent Statement: Not applicable.
Data Availability Statement: Not applicable.
Conflicts of Interest: The authors declare no conflict of interest.
References
1. Poliak, M.; Svabova, L.; Konecny, V.; Zhuravleva, N.A.; Culik, K. New Paradigms of Quantification of Economic Efficiency in the
Transport Sector. Oeconomia Copernic. 2021, 12, 193–212. [CrossRef]
2. Kubal’ák, S.; Hájnik, A.; Čulík, K. Analysis of the Carsharing System in the Slovak Republic. In Proceedings of the International
Conference on Transport Systems Telematics, Kraków, Poland, 27–30 October 2020; Springer: Cham, Switzerland, 2020; pp. 110–123.
3. Konečný, V.; Gnap, J.; Settey, T.; Petro, F.; Skrúcaný, T.; Figlus, T. Environmental sustainability of the vehicle fleet change in public
city transport of selected city in central Europe. Energies 2020, 13, 3869. [CrossRef]Sustainability 2021, 13, 6544 19 of 20
4. Web of Science. Available online: https://apps.webofknowledge.com/RAMore.do?product=WOS&search_mode=GeneralSearch&
SID=E5VTn3SzlhP4DhUeqBB&qid=3&ra_mode=more&ra_name=PublicationYear&colName=WOS&viewType=raMore (accessed
on 20 April 2021).
5. Si, H.; Shi, J.G.; Wu, G.; Chen, J.; Zhao, X. Mapping the bike sharing research published from 2010 to 2018: A scientometric review.
J. Clean. Prod. 2019, 213, 415–427. [CrossRef]
6. Rekola Pre Firmy. Rekola. Available online: https://www.rekola.cz/firmy (accessed on 12 March 2021).
7. Using Big Data to Identify Bike-Sharing Customers. Towards Data Science. Available online: https://towardsdatascience.com/24-7
-bikesharing-inhamburg-1158afedbe68 (accessed on 15 March 2021).
8. Yanocha, D.; Mason, J.; Patlán, M.; Benicchio, T.; Alfred, I.; Laksmana, U. The Bikeshare Planning Guide. 2018. Available online: https://
www.transformative-mobility.org/assets/publications/The-Bikeshare-Planning-Guide-ITDP-Datei.pdf (accessed on 15 March 2021).
9. Systémy Verejných Bicyklov—“Bike-Sharing”. OBIS (Optimising Bike Sharing in European Cities). Available online: https:
//www.cyklodoprava.cz/file/1-4-1-sterbova-bicicletaspublicas/ (accessed on 15 March 2021).
10. Czech, P.; Turoń, K.; Sierpiński, G. Development of the Bike-Sharing System on the Example of Polish Cities. In Scientific and
Technical Conference Transport Systems Theory and Practice; Springer: Cham, Switzerland, 2017; pp. 161–169.
11. Austwick, M.Z.; O’Brien, O.; Strano, E.; Viana, M. The structure of spatial networks and communities in bicycle sharing systems.
PLoS ONE 2013, 8, e74685.
12. Maio, P. Bike-sharing: Its history, impacts, models of provision, and future. J. Publ. Transp. 2009, 12, 41–56.
13. Faghih-Imani, A.; Hampshire, R.; Marla, L.; Eluru, N. An empirical analysis of bike sharing usage and rebalancing: Evidence
from Barcelona and Seville. Transp. Res. Part A Policy Pract. 2017, 97, 177–191. [CrossRef]
14. Frade, I.; Ribeiro, A. Bike-sharing stations: A maximal covering location approach. Transp. Res. Part A Policy Pract. 2015, 82,
216–227. [CrossRef]
15. Lin, J.R.; Yang, T.H. Strategic design of public bicycle sharing systems with service level constraints. Transp. Res. Part E Logist.
Transp. Rev. 2011, 47, 284–294. [CrossRef]
16. Raviv, T.; Tzur, M.; Forma, I.A. Static repositioning in a bike-sharing system: Models and solution approaches. EURO J. Transp.
Logist. 2013, 2, 187–229. [CrossRef]
17. Benchimol, M.; Benchimol, P.; Chappert, B.; De La Taille, A.; Laroche, F.; Meunier, F.; Robinet, L. Balancing the stations of a self
service “bike hire” system. RAIRO-Oper. Res. 2011, 45, 37–61. [CrossRef]
18. Chemla, D.; Meunier, F.; Calvo, R.W. Bike sharing systems: Solving the static rebalancing problem. Discret. Optim. 2013, 10,
120–146. [CrossRef]
19. Raviv, T.; Kolka, O. Optimal inventory management of a bike-sharing station. IIE Trans. 2013, 45, 1077–1093. [CrossRef]
20. Vogel, P.; Mattfeld, D.C. Modeling of repositioning activities in bike-sharing systems. In Proceedings of the World Conference on
Transport Research (WCTR), Lisbon, Portugal, 11–15 July 2010.
21. Alberts, B.; Palumbo, J.; Pierce, E. Vehicle 4 change: Health implications of the Capital bikeshare program. Cap. Bikeshare Health
Surv. Rep. 2012, 10.
22. Jurdak, R. The impact of cost and network topology on urban mobility: A study of public bicycle usage in 2 US cities. PLoS ONE
2013, 8, e79396. [CrossRef]
23. Guo, Y.; Liu, P.; Bai, L.; Xu, C.; Chen, J. Red light running behavior of electric bicycles at signalized intersections in China. Transp.
Res. Rec. 2014, 2468, 28–37. [CrossRef]
24. Rixey, R.A. Station-level forecasting of bikesharing ridership: Station network effects in three US systems. Transp. Res. Rec. 2013,
2387, 46–55. [CrossRef]
25. Faghih-Imani, A.; Eluru, N.; El-Geneidy, A.M.; Rabbat, M.; Haq, U. How land-use and urban form impact bicycle flows: Evidence
from the bicycle-sharing system (BIXI) in Montreal. J. Transp. Geogr. 2014, 41, 306–314. [CrossRef]
26. Guo, Y.; Zhou, J.; Wu, Y.; Li, Z. Identifying the factors affecting bike-sharing usage and degree of satisfaction in Ningbo, China.
PLoS ONE 2017, 12, e0185100. [CrossRef]
27. Anzai, A.; Kobayashi, T.; Linton, N.M.; Kinoshita, R.; Hayashi, K.; Suzuki, A.; Yang, Y.; Jung, S.-M.; Miyama, T.; Akhmetzhanov,
A.R.; et al. Assessing the impact of reduced travel on exportation dynamics of novel coronavirus infection (COVID-19). J. Clin.
Med. 2020, 9, 601. [CrossRef]
28. Chinazzi, M.; Davis, J.T.; Ajelli, M.; Gioannini, C.; Litvinova, M.; Merler, S.; Piontti, A.P.; Mu, K.; Rossi, L.; Sun, K.; et al. The effect
of travel restrictions on the spread of the 2019 novel coronavirus (COVID-19) outbreak. Science 2020, 368, 395–400. [CrossRef]
29. Oztig, L.I.; Askin, O.E. Human mobility and coronavirus disease 2019 (COVID-19): A negative binomial regression analysis.
Public Health 2020, 185, 364–367. [CrossRef]
30. Aloi, A.; Alonso, B.; Benavente, J.; Cordera, R.; Echániz, E.; González, F.; Ladisa, C.; Lezama-Romanelli, R.; López-Parra, Á.;
Mazzei, V.; et al. Effects of the COVID-19 Lockdown on Urban Mobility: Empirical Evidence from the City of Santander (Spain).
Sustainability 2020, 12, 3870. [CrossRef]
31. Shilling, F.; Waetjen, D. Special Report (Update): Impact of COVID19 Mitigation on Numbers and Costs of California Traffic Crashes;
University of California: Davis, CA, USA, 2020.
32. De Vos, J. The effect of COVID-19 and subsequent social distancing on travel behavior. Transp. Res. Interdiscip. Perspect. 2020, 5,
100121. [CrossRef]Sustainability 2021, 13, 6544 20 of 20
33. Batty, M. The Coronavirus crisis: What will the post-pandemic city look like? Environ. Plan. B Urban Anal. City Sci. 2020, 47,
547–552. [CrossRef]
34. Megahed, N.A.; Ghoneim, E.M. Antivirus-built environment: Lessons learned from Covid-19 pandemic. Sustain. Cities Soc. 2020,
61, 102350. [CrossRef]
35. de Haas, M.; Faber, R.; Hamersma, M. How COVID-19 and the Dutch ‘intelligent lockdown’change activities, work and travel
behaviour: Evidence from longitudinal data in the Netherlands. Transp. Res. Interdiscip. Perspect. 2020, 6, 100150.
36. Nikiforiadis, A.; Chrysostomou, K.; Aifadopoulou, G. Exploring Travelers’ Characteristics Affecting their Intention to Shift to
Bike-Sharing Systems due to a Sophisticated Mobile App. Algorithms 2019, 12, 264. [CrossRef]
37. Bucsky, P. Modal share changes due to COVID-19: The case of Budapest. Transp. Res. Interdiscip. Perspect. 2020, 8, 100141.
[CrossRef]
38. Chai, X.; Guo, X.; Xiao, J.; Jiang, J. Analysis of Spatial-temporal Behavior Pattern of the Share Bike Usage during COVID-19
Pandemic in Beijing. arXiv 2020, arXiv:2004.12340.
39. Oficiálna Stránka Poskytovate’a Služby Verejný Bicykel. Available online: https://www.verejnybicykel.sk/sk/ (accessed on 20
March 2021).
40. Arriva Bike. Available online: https://arriva.bike/ (accessed on 10 March 2021).
41. Slovnaft BAJK. Available online: https://slovnaftbajk.sk/ (accessed on 10 March 2021).
42. BikeKIA. Available online: https://bikekia.sk/ (accessed on 12 March 2021).
43. Arboria Bike. Available online: https://www.arboriabike.sk/ (accessed on 12 March 2021).
44. Zelený Bicykel. Available online: https://www.zelenybicykel.sk/ (accessed on 12 March 2021).
45. Piešt’anské Užitičné Koleso. Available online: https://www.magna-energia.sk/pnuk (accessed on 10 March 2021).
46. Mária Valéria Bike. Available online: https://mariavaleriabike.eu/sk (accessed on 10 March 2021).
47. Košičania A Turisti Môžu Využíva’ Službu Bikesharingu. Ako na to? Available online: https://www.kosiceonline.sk/kosicania-
a-turisti-mozuvyuzivat-sluzbu-bikesharingu-ako-na-to (accessed on 20 March 2021).
48. The Bike-sharing World Map 2021. Available online: https://www.bikesharingmap.com (accessed on 5 April 2021).
49. Ministry of Health of the Slovak Republic. Available online: https://www.health.gov.sk/Clanky?tlacove-spravy&stranka=4
(accessed on 24 May 2021).
50. Public Health Authority of the Slovak Republic. Available online: https://www.uvzsr.sk/index.php?option=com_content&
view=category&layout=blog&id=250&Itemid=153 (accessed on 24 May 2021).
51. Coronavirus (COVID-19) in the Slovak Republic. Available online: https://korona.gov.sk/sk/coronavirus-covid-19-in-the-
slovak-republic-in-numbers/ (accessed on 24 May 2021).
52. Konečný, V.; Brídziková, M.; Senko, Š. Impact of COVID-19 and Anti-Pandemic Measures on the Sustainability of Demand in
Suburban Bus Transport. The Case of the Slovak Republic. Sustainability 2021, 13, 4967. [CrossRef]
53. Internetová Stránka Gis-Riešenia. Available online: https://www.gisriesenia.sk/ponuka/priestorove-analyzy/ (accessed on 5 April 2021).
54. A Free and Open Source Geographic Information System. Available online: https://www.qgis.org/en/site/ (accessed on 5 April 2021).
55. Open Street Map. Available online: https://www.qgis.org/en/site/https://www.openstreetmap.org/#map=15/49.2090/18.7715
(accessed on 5 April 2021).
56. Covid-19. Available online: https://news.google.com/covid19/map?hl=sk&gl=SK&ceid=SK%3Ask&mid=%2Fm%2F06ywnh
(accessed on 26 May 2021).
57. Weather Conditions. Available online: http://www.shmu.sk/sk/?page=2049&id=1105 (accessed on 24 May 2021).
58. Markechová, D.; Stehlíková, B.; Tirpáková, A. Štatistické Metódy a Ich Aplikácie; Prírodovedec, Fakulta prírodných vied UKF v
Nitre: Nitra, Slovakia, 2011.
59. Standard Deviation and Variance. Available online: https://www.investopedia.com/terms/ (accessed on 26 May 2021).You can also read


