Detecting Information on the Spread of Dengue on Twitter Using Arti cial Neural Networks
←
→
Page content transcription
If your browser does not render page correctly, please read the page content below
Computers, Materials & Continua                                                                 Tech Science Press
DOI:10.32604/cmc.2021.014733
Article

                   Detecting Information on the Spread of Dengue on Twitter
                               Using Artificial Neural Networks
                   Samina Amin1, * , M. Irfan Uddin1 , M. Ali Zeb1 , Ala Abdulsalam Alarood2 ,
                              Marwan Mahmoud3 and Monagi H. Alkinani4

               1
               Institute of Computing, Kohat University of Science and Technology, Kohat, 26000, Pakistan
           2
            College of Computer Science and Engineering, University of Jeddah, Jeddah, 21959, Saudi Arabia
                      3
                        Faculty of Applied Studies, King Abdulaziz University, Jeddah, Saudi Arabia
      4
        Department of Computer Science and Artificial Intelligence, College of Computer Sciences and Engineering,
                                         University of Jeddah, Jeddah, Saudi Arabia
                          *
                            Corresponding Author: Samina Amin. Email: kustsameena@gmail.com
                                  Received: 13 October 2020; Accepted: 28 November 2020

                    Abstract: Social media platforms have lately emerged as a promising tool for
                    predicting the outbreak of epidemics by analyzing information on them with
                    the help of machine learning techniques. Many analytical and statistical mod-
                    els are available to infer a variety of user sentiments in posts on social media.
                    The amount of data generated by social media platforms, such as Twitter,
                    that can be used to track diseases is increasing rapidly. This paper proposes
                    a method for the classification of tweets related to the outbreak of dengue
                    using machine learning algorithms. An artificial neural network (ANN)-based
                    method is developed using Global Vector (GloVe) embedding to use the data
                    in tweets for the automatic and efficient identification and classification of
                    dengue. The proposed method classifies tweets related to the outbreak of
                    dengue into positives and negatives. Experiments were conducted to assess the
                    proposed ANN model based on performance evaluation matrices (confusion
                    matrices). The results show that the GloVe vectors can efficiently capture a
                    sufficient amount of information for the classifier to accurately identify and
                    classify tweets as relevant or irrelevant to dengue outbreaks. The proposed
                    method can help healthcare professionals and researchers track and analyze
                    epidemic outbreaks through social media in real time.

                    Keywords: Artificial neural network; classification; social media; GloVe;
                    social networking sites

1 Introduction
    Social networking sites (SNS) are extremely popular worldwide, and are redefining how peo-
ple communicate and engage with one another. Such services as Twitter, Facebook, Instagram,
LinkedIn, and blogs are used to not only share media and text content, but also to provide oppor-
tunities to users to share their perceptions or opinions on any topic, activity, or trending issue.
SNS are also helpful for gathering situational information during disasters, like an earthquake or

                        This work is licensed under a Creative Commons Attribution 4.0 International License,
                        which permits unrestricted use, distribution, and reproduction in any medium, provided
                        the original work is properly cited.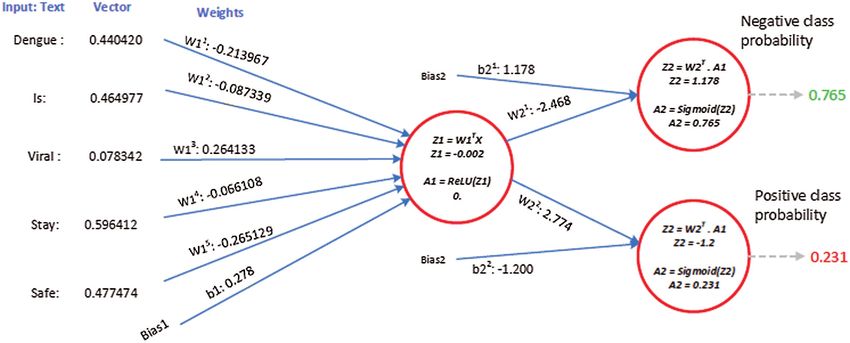
1318                                                                         CMC, 2021, vol.67, no.1

an epidemic outbreak. The rapid spread of epidemic outbreaks in recent years has highlighted the
need for effective analytical techniques to understand the flow of information and plan according
actions. The SNS can be used to efficiently deliver information for the detection of diseases for
the public to reduce their spread [1].
     Viral infections pose a major threat to public health. The timely and precise tracking of
infectious diseases and their growth can help reduce their damaging effects. However, research on
disease-related information on SNS has primarily targeted healthcare professionals and physicians
tracking their patients’ visits, and is used to identify the occurrence of diseases. Dengue fever is
among the most rapidly rising mosquito-borne viral infections. An average of 389 million people
are annually infected by it worldwide, of which 95–97 million exhibit medical symptoms [2]. The
risk of dengue is expected to rise in the future owing to increased urbanization, an insufficient
supply of clean water, and, possibly, climate change. The epidemiological nature of dengue is
complicated, it is challenging to monitor, and mechanisms to track it are expensive and ineffec-
tive [3]. The number of regions affected by dengue has grown in recent years as cases continue
to increase [2].
     SNS have been utilized in various applications of disease surveillance [1,4]. Researchers have
developed methods for the prediction of diseases using health-related data derived from Web
2.0 [1]. Moreover, Google search queries have incorporated a Web-based system to monitor early
warnings in real time [5]. In recent years, SNS, in particular Twitter, have had a positive impact on
disease identification, such as predicting the given state of spread as reported by the public [6,7],
reporting traditional medical data, and detecting epidemic outbreaks [8,9].
    This paper proposes an ANN-based model that uses optimization techniques along with the
GloVe embedding dictionary-based approach [10]. It leverages SNS to detect and classify dengue
outbreaks. The above-mentioned research on the identification and classification of diseases on
SNS has used machine learning approaches, such as the support vector machine (SVM), naïve
Bayes, k-nearest neighbor, the decision tree, and ANN techniques. The proposed model examines
Twitter data to provide a useful way to detect epidemic outbreaks instead of formal data collection
techniques. Formal methods of surveilling epidemic outbreaks use manually collected clinical data
that take weeks, or even months, to become accessible and interpretable. We train an optimized
ANN model on a corpus of tweets, using the GloVe embedding technique for feature extraction,
to classify dengue-related tweets and determine whether they represent instances of infection.
       The proposed work applies the ANN to make the following contributions to the literature:
       1. It classifies tweets as “dengue positive” or “dengue negative” using the ANN with
          parameter tuning.
       2. It uses a word embedding technique (GloVe) to efficiently learn the context of the word
          structure for better classification.
       3. The proposed optimized model significantly outperforms prevalent methods in terms of
          precision, accuracy, recall, and the F1-score.
    The proposed model was evaluated and tested on various domains to assess its performance,
accuracy, and reliability (see Section 4). The results show that it offers many opportunities to
detect and classify diseases, such as the novel coronavirus (COVID-19).
    The remainder of this paper is organized as follows: Section 2 discusses related work in the
area and Section 3 details the proposed method. Section 4 describes the results of experiments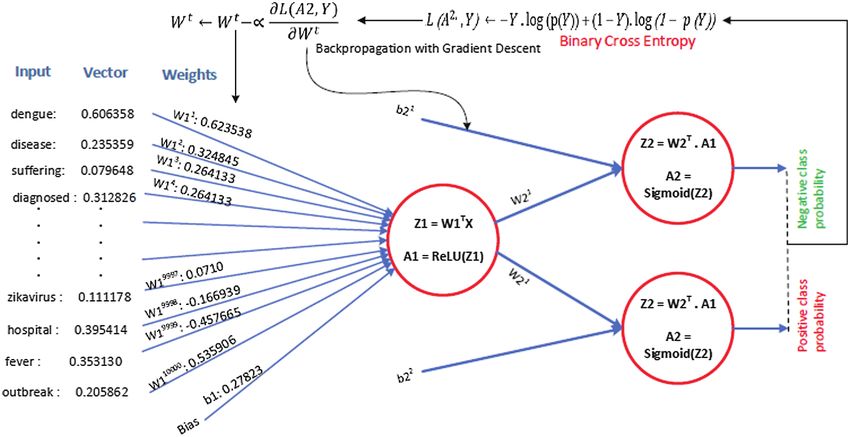
CMC, 2021, vol.67, no.1                                                                        1319

to assess its performance, and Section 5 offers the conclusions of this study as well as a set of
research suggestions for future work in the area.

2 Related Work
     Numerous epidemiological studies have been conducted on social media analysis to under-
stand the role of public sentiment expressed on such platforms in disease detection [11]. The
available information on epidemic outbreaks is highly dynamic given the temporal and spatial
aspects of social media. The authors of [12] used spatio-temporal information to develop an
unsupervised machine learning model to identify infectious diseases in a given location through
sentimental analysis, rather than by using such background knowledge as the names of diseases
and associated symptoms. Many researchers have applied content analysis and machine learning
models, such as the SVM [13], linear or logistic regression [14,15], and k-nearest neighbors
(KNN) [16], and have reported an accuracy of around 88% [11]. The goal of the research [11] was
to monitor public concerns about diseases by classifying tweets into those conveying the symptoms
of a given disease and those that did not.
     Hussain-Alkhateeb et al. [17] proposed an early warning and response system (EWARS) that
uses warnings and outbreak-related information to generate a prediction for the detection of
dengue outbreaks at the district level. Guo et al. [18] developed a model for detecting dengue in
China based on tweets by using a machine learning technique. They trained the support vector
regression (SVR) model. According to the World Health Organization (WHO), dengue has been
reported in almost every continent. Iqbal et al. [19] trained machine learning models to predict
dengue outbreaks by using clinical data conducted from dengue patients discharged from hospital.
Their proposed model was trained on such traditional machine learning models as the naïve Bayes,
logistic boost, random forest, and SVM. Another interesting study was carried out by Gomide
et al. [20], in which a framework was designed for monitoring dengue outbreaks through tweets
by focusing on four aspects: Place, time, and opinion of the public. Two datasets were used, one
from the Brazilian health department and the other based on Twitter data obtained using the
keyword “#dengue,” to predict the outbreak using a linear regression model [20].
     A large amount of Twitter data have been used to estimate the incidence of health issues
in society. Cacheda et al. [21] focused on two languages, Portuguese and Spanish, in the Iberian
Peninsula, and develop and tested an automated machine learning-based model. The goal was
to detect four health conditions through tweets: Flu, anxiety, depression, and pregnancy [21].
This approach is limited in its implementation to other languages. Several approaches have been
proposed to detect flu and ILI from tweets in real time. Aramaki et al. [8] used an SVM-based
model to predict rates of influenza in Japan from Twitter data. The authors focused on detecting
flu-related tweets based on frequency: The greater the number of tweets related to the disease was,
the higher the chances were that it was spreading in the given region. However, frequency might
not be a good indicator for determining whether someone is infected.
     In this study, we extract dengue-related tweets (Section 3.1), i.e., tweets containing the word
“dengue,” from Twitter to determine whether each of them conveys that someone has been
infected. For example, “Today was the international day of dengue. I also gave a lecture on
dengue” does not reflect that a person has been infected, even though the word “dengue” appears
twice. However, “My daughter is suffering from dengue” reflects that a person has been infected.
The classification of people infected by dengue based on tweets has not been examined in previous
studies in the area. Current approaches to text classification based on the ANN have obtained
important results [22]. Motivated by the accuracy of classification of ANN-based techniques, we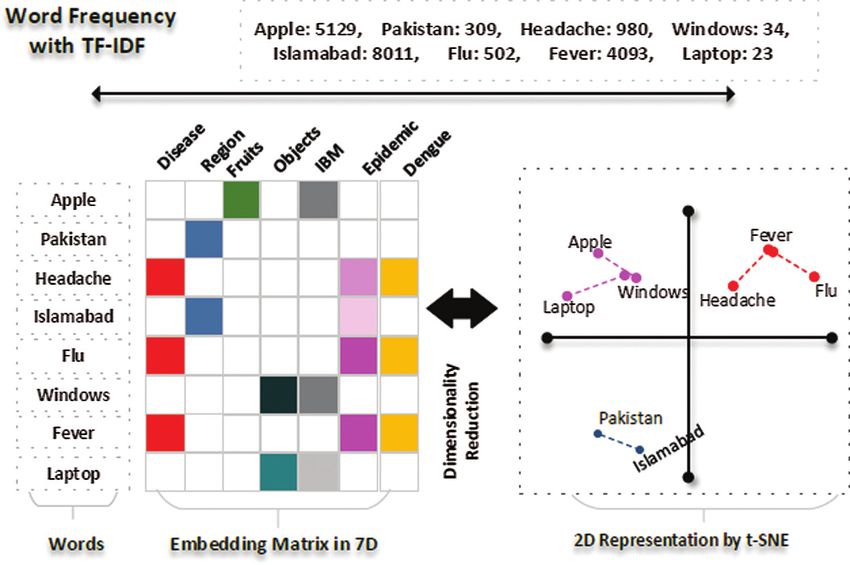
1320                                                                            CMC, 2021, vol.67, no.1

use the network to classify tweets indicating infection by dengue. In the proposed model, the
classification of infected people, which is the core task of disease detection, is not the ultimate
target, but a means of distinguishing between tweets that do and do not convey infection. The
aim is to provide a baseline for identifying other viral diseases, such as COVID-19, using social
media content.

3 Proposed Method
    Fig. 1 shows features and modules of the proposed model, including (i) data acquisition and
data visualization, (ii) feature selection (ii) data splitting, and (iv) an overview of the model design
and (v) model architecture by using example tweets. The details of each module are as follows.

                             Figure 1: Flow of the proposed approach

3.1 Data Acquisition
    The first step in developing a dengue classification model is the acquisition of the relevant
data. For this purpose, we chose Twitter because it provides a larger amount of useful information
regarding epidemic outbreaks rather than formal data collection techniques. To acquire tweets on
dengue outbreaks, we used Twitter’s Application Programming Interface (API) [23] designed for
researchers to access the tweets in real time using the JavaScript Object Notation (JSON). The
keywords used for querying and shortlisting the repository of relevant tweets included appropriate
contextual words like #dengue, #denguemosquito, #denguefever, #denguevirus, #malaria, and
#denguemalaria. We hence collected 141,435 tweets from June 2018 to November 2019, and stored
them in JSON format. To abide by Twitter’s terms and conditions, we extracted only a stripped-
down version of the raw data containing a limited number of parameters, such as username, date,
and tweet content.

3.2 Data Preprocessing and Building Ground Truth Dataset
    The natural language processing (NLP) of an unstructured text corpus collected from Twitter
is a new task because of the informal nature of tweets. It was used to eliminate unnecessary
content from the dengue corpus to enhance the quality of the data deployed as features for further
processing. This included the removal of hashtags, retweets, special characters, emoticons, Uniform
Source Locators (URLs), and “@” mentions. Tweets posted in English were saved and those in
any other language were eliminated. The saved tweets were then transformed to lowercase letters
and checked for misspellings [24]. Stop words were then eliminated from the corpus.
     To construct the dataset with a ground truth tag (concerning whether a given tweet conveys
infection by dengue). Of the 141,435 tweets, a sample of 5,000 was selected for tagging. These
tweets were tagged by three people to eliminate prejudice in the tagging procedure. Every tweet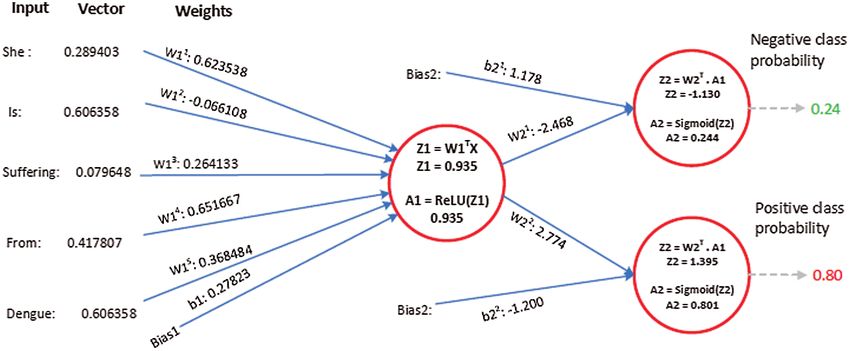
CMC, 2021, vol.67, no.1                                                                          1321

was tagged as either 1 or 0, where 1 represents infection by dengue (i.e., conveys the someone has
been infected) while 0 represents no infection (the tweet presents other information about dengue).
The tagged dataset consisted of features to understand the dataset description—for instance, six
observations with their target labels are shown in Tab. 1.

                                       Table 1: Tweets with target labels

S#    Text/Tweet                                                                             Target
1.    She is suffering from dengue.                                                          1
2.    Dengue has made my life miserable.                                                     1
3.    Dengue, which is a viral disease and is spreading in our city, is a very dangerous     0
      disease and can possibly take your life; please stay safe.
4.    My friend lost her father due to dengue in Lahore.                                     1
5.    Every dengue season, messages calling papaya leaf extract and drugs made out of        0
      it a miracle cure for dengue are widely circulated.
6.    So we went back to the hospital only to find out that I had been infected with         1
      dengue again.

    To render the tagged data more useful for further processing and classification, we performed
tokenization and stemming. The former splits a given sentence (tweet) into word tokens whereas
the latter shrinks the derived forms of a given word by retrieving its base word [25].

3.3 Feature Extraction
    Feature selection is an essential part of processing text data. Raw data need to be interpreted
and converted into numeric values for processing. In this paper, we used word embedding with the
GloVe dictionary strategy for data processing. In text processing, a tweet needs to be interpreted
as a weighted feature vector. For this purpose, it must be replicated as a weighted feature. The
n-gram is a useful technique because it offers a sequence of words that allows for the allocation
of probabilities to them. N-grams can thus be described as a sequence of words within a specified
window size [26]. The proposed method derives n-gram features from input data acquired from
the GloVe embedding layer.
    GloVe is used to convert the tweet text into numeric vectors [10]. A GloVe is a count-based
approach that generates a matrix of word coincidence to acquire word vectors by performing
dimensionality reduction to a greater extent than the traditional term frequency-inverse document
frequency (TF-IDF). For instance, the word “apple” can be given the numeric value 6234, whereas
the word “windows” can be assigned an integer value, like 45. Similar words like “dengue,”
“headache,” “flu,” “body aches,” and “dengue fever” are assigned integers that can easily be
viewed graphically, as in Fig. 2. Relevant words thus appear together, rather than irrelevant words.
GloVe captures global as well as local statistics by generating the word vectors of a corpus. As
shown in Fig. 4, similar metrics deployed for closest neighbor analysis generate a single matrix
multiplication that computes the connectedness among the words. As shown in Eq. (1), word
embedding E : Word (w × u) is a parametrized function that plots words in a corpus to a high-
dimensional space (100–500 dimensions). For instance, “fever” can be considered as similar to
“dengue” in that both words represent symptoms of diseases.
E (w × u) = (0.2, −0.4, 0.7, 0.9, . . . , 0.8)                                                    (1)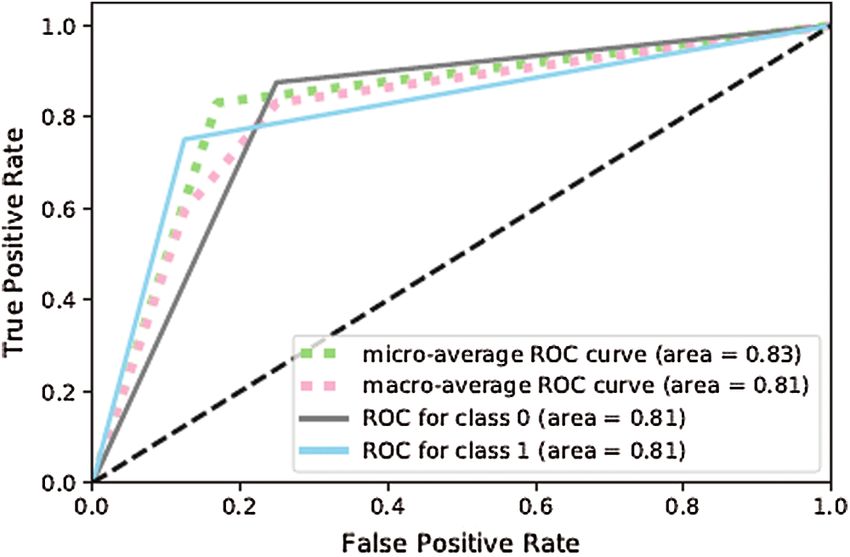
1322                                                                             CMC, 2021, vol.67, no.1

where E (w, u) is the weight matrix that converts the input values x1 , x2 , x3 , . . . , xn into a hidden
layer (w.udimensionalmatrix), and the transpose of E 0 (u, w) is the matrix of weights that converts
the output of the hidden layer into the actual output layer (u.wdimensionalmatrix).

    Figure 2: A sample demonstration of word embedding-based representation and TF-IDF

3.4 Data Splitting
     This section presents the data splitting approach based on k-fold cross-validation [27]. Before
training the model, we divided the tagged data into three sections—training, validation, and test
sets—through 10-fold cross-validation. The k-fold validation scheme breaks the dataset in an 80:20
ratio, where 80% of the data are used to fit the model and the remaining 20% are used for model
testing. We also further split the training data in a 60:20 ratio, where 60% of the data were used
for model fitting and 20% for validation to tune the model parameters. This is done to determine
whether the model efficiently works on the training data by removing overfitting and under-fitting.

3.5 Classification Approach
    The ANN is a special form of machine learning technique inspired by biological neural
networks [28]. The ANN contains an input and an output layer as well as one or more than
one hidden layers of neurons that process the input values to generate the output. An ANN
incorporating more than one hidden layer is also known as a deep neural network. It can
obtain knowledge from the data and deliver solutions to problems of classification, forecasting
(prediction), and detection. The ANN is a nonlinear mathematical technique that incorporates
multifaceted input–output relationships to find a new pattern. ANNs make use of machine
translation, text classification, speech recognition, image recognition, and facial racemization. They
are structured into two forms, as feed-forward neural networks (FFNNs) and feedback neural
networks (FBNN). In the FFNN data processing occurs only in one way/direction from input to
output. In the FBNN, the output is transferred internally to the model by calculating the error
and propagating it back to earlier layers to achieve optimized results [28].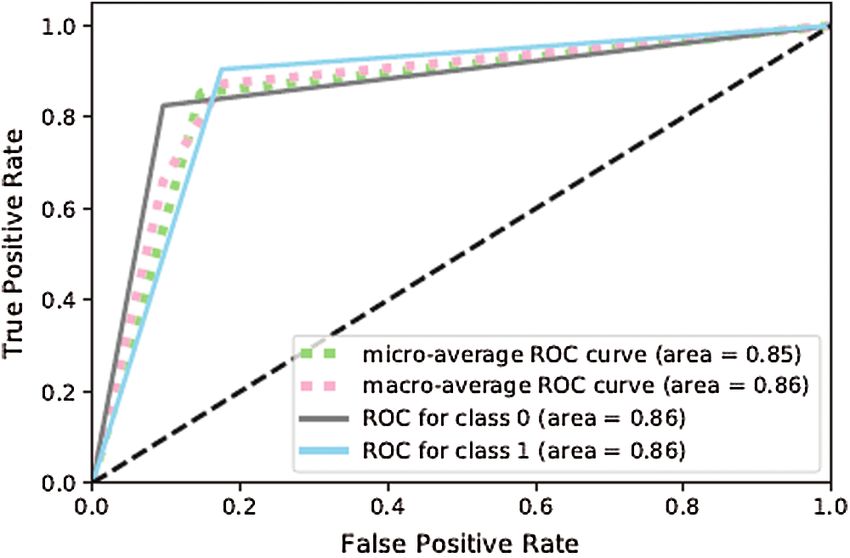
CMC, 2021, vol.67, no.1 1323
3.6 Parameter Tuning
This section analyzes the hyperparameters used in the development of the proposed model.
Of eight deployed ANNs, the best four formulations for the proposed method in terms of
performance are reported in Tab. 2.
Table 2: Overview of formulations of the ANN
Formation Max_features No. of No. of nodes No. of nodes No. of nodes Emb_dim Dropout
hidden layers in layer 1 in layer 2 in layer 3
ANN-1 8,000 1 32 – – 100 –
ANN-2 8,000 2 16 4 – 100 0.3
ANN-3 8,000 3 64 32 16 100 0.5
ANN-4 8,000 3 128 64 32 100 0.5
Tab. 2 represents the settings of the formulations of the ANN, where “hidden layers” rep-
resent a set of neurons positioned between the input and the output layers to impose various
modifications on the input features. With each input is associated a corresponding weight that
represents the magnitude of the links between neurons [29]. A weight close to zero indicates that
the input is not altered by the output, whereas a negative value indicates that the output will be
reduced by enhancing the input. This determines the degree to which the input affects the output.
In addition, the sharpness (gradient) of the activation function is enhanced by the weight, which
indicates that the weight determines how rapidly the activation function is actuated. A bias is
added to the weighted sum to control the triggering of the activation function. The calculated
value is then passed to the activation function to produce the output (i.e., positive or negative)
in a way best suited for the provided data. An epoch is one instance (iteration) of compilation
of the dataset (such as one forward as well as one backward pass). An epoch becomes too large
to pump into the machine simultaneously [30], because of which it is split into smaller batches
to optimize the training data. Furthermore, the batch size is the number of training examples of
the dataset in a single batch. Compiling an epoch for the required number of batches is known
as an iteration. The other parameters are maintained at fixed sizes in the model, including the
maximum numbers of features (Max_features) and embedding dimensions (Emb_dim) (Tab. 2).
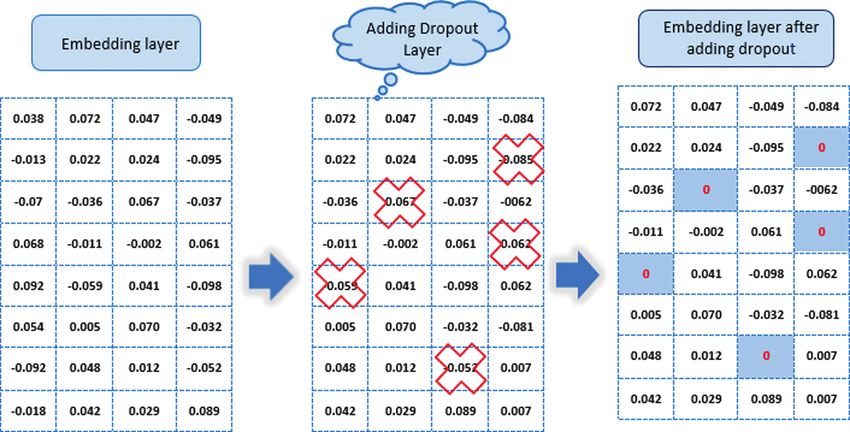
DNNs are efficient machine learning models with a large number of parameters. Overfitting
is a significant issue in them. The models are also challenging to develop. Overfitting is handled
by integrating the outputs of several deep learning models during the evaluation phase. Dropout
is a regularization technique in ANN models used to solve this problem (overfitting) [31]. The
main role of the dropout layer is to randomly turn off or drop the activation of the units along
with their links in a model during training. Removing neurons from a model means deleting them
from the model temporally, including all their links (e.g., both incoming and outgoing links). The
work of the dropout layer is graphically represented in Fig. 3, which shows the embedding layer
containing the vector dimension (actual value representation) for the tweet: “Oh I am diagnosed
with dengue again.” Consequently, some vector values of the embedding layer are temporally
disabled to “0” at random after applying the dropout layer.
3.7 Classification Results
This section presents the graphical visualization of tweet processing using the ANN. The aim
of the proposed method is to analyze tweets and classify them according to whether they convey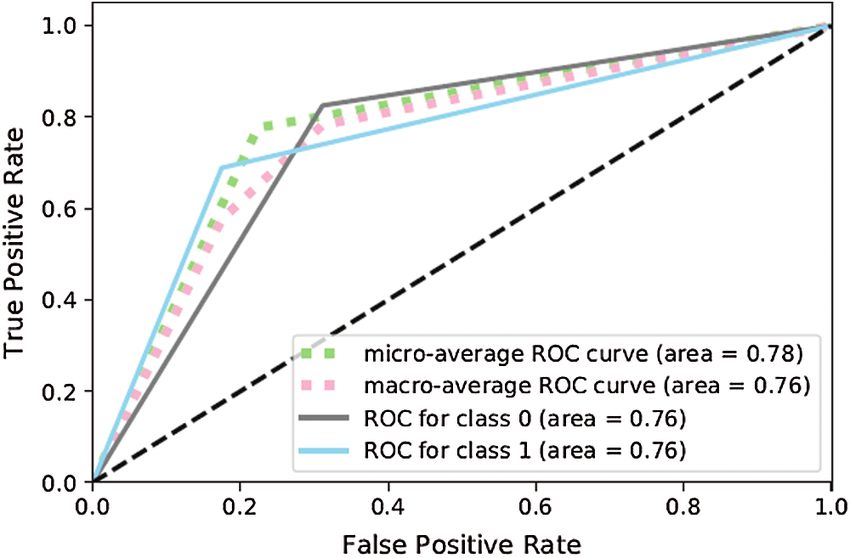
1324                                                                            CMC, 2021, vol.67, no.1

                              Figure 3: Structure of the dropout layer

the fact that someone has been infected with dengue, or contain only information about the
disease. Since the ANN cannot process text data directly, they were converted into numeric vectors
for computation. In NLP, the textual data were converted into numerical values, and vector values
were computed for all words in the corpus using the GloVe embedding technique.
     The embedded vectors were fed into the ANN to train the model for classification. The ANN
with a single hidden layer was selected only to demonstrate the method through which tweet text
was processed and the numbers computed in each step. At the output layer, two units were created
to classify the data into a negative or a positive class. In the first step, the data were converted into
vectors as discussed above. Around 8,000 vectors values (referred to as features) were obtained
for the entire training dataset. In the training phase, the data (i.e., vector values of text) were
processed by the ANN as shown in Fig. 4. After training, the values of the weight (w) and bias
(b) were optimized using the gradient descent algorithm. We then used the values of wt and b
for classification.
    Example: The processing and numerical computation of each layer of the ANN with some
example tweets (i.e., positive and negative) are graphically provided in accordance with the
guidelines discussed in the Section 3.
    Suppose the two tweets—“she is suffering from dengue” and “stay safe dengue is viral”—are
considered as disease positive and disease negative, respectively. Disease positive means that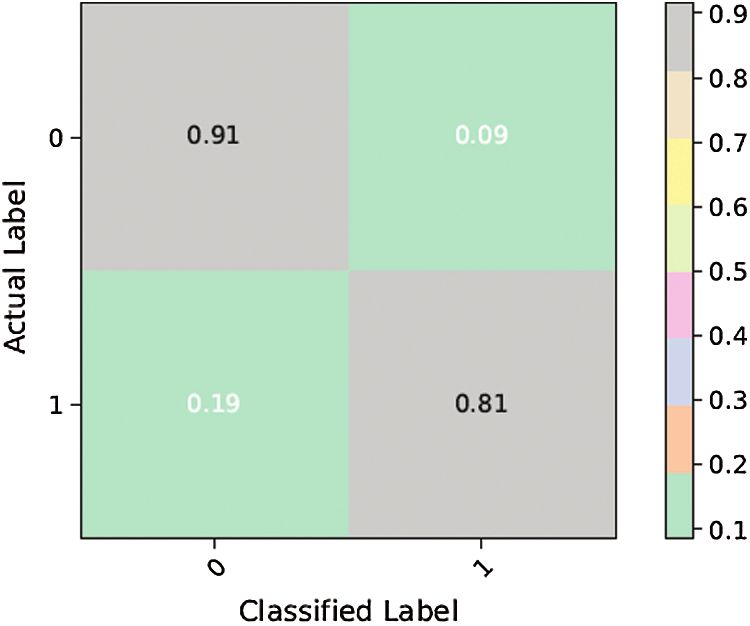
CMC, 2021, vol.67, no.1                                                                        1325

someone is infected from dengue while disease negative tweet represents that tweet contains some
information about the dengue disease. Then, the tweets are analyzed through the ANN. Figs. 5
and 6 show the way in which they were classified by the ANN. The relevant vector is represented
by vector X in these figures, and the other values were all zero in these examples. Then, the
corresponding weights of the hidden layer were calculated as shown by vector W1 . The following
operations were performed (Eqs. (2) and (3)).

Z1 = np.dot W 1T .X , and A1 = ReLU Z1                                                        (2)

Z 2 = np.dot W2T .A1 , and A2 = Sigmoid Z 2                                                   (3)

           Figure 4: Example—ANN structure for processing embedded training data

     A2 contains two probabilities. The first number shows the probability of the given tweet
belonging to the negative class and the second shows the probability of it belonging to the positive
class. The negative class probability in Fig. 5 was 0.24 and the positive class probability was 0.8.
This means that the ANN classified the first tweet as belonging to the positive class tweet at an
accuracy of 80%.
    Similarly, Fig. 6 shows the negative class probability (0.765) and positive class probability
(0.231) of the tweet “dengue is viral stay safe.” It shows that the model classified this tweet as a
negative tweet with an accuracy of 76.5%.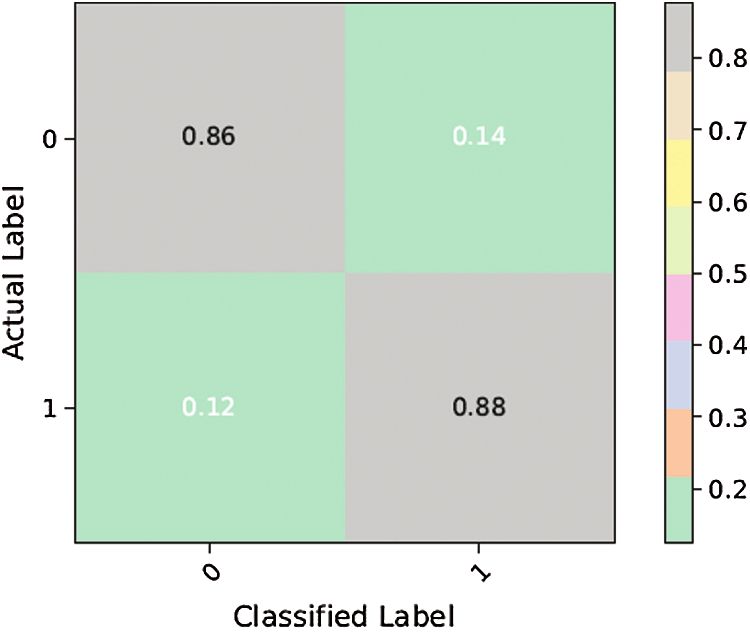
1326                                                                        CMC, 2021, vol.67, no.1

Figure 5: The processing of the tweet “she is suffering from dengue” as an example of a tweet
belonging to the positive class

Figure 6: The processing of the tweet “dengue is viral stay safe” as an example of a negative class
tweet

4 Experimental Results and Discussion
    This section presents the results of experiments to validate the proposed method. The exper-
iments were performed on Anaconda Python 3.6 with the TensorFlow, Keras, and scikit learning
modules [32–35]. The preprocessed data were formulated for analysis using the two classes of
dengue positive and dengue negative.
    The results that the textual content of the tweets was converted into feature vectors by
the GloVe embedding technique. The GloVe dictionary efficiently captured a sufficient amount
of information for the selected ANN to use the hyperparameters to classify the tweets as
CMC, 2021, vol.67, no.1 1327
dengue positive or negative. Its performance was evaluated in terms of precision, recall, and the
F1-score [36].
Tab. 3 lists the performance of the proposed method in training, validation, and testing,
and lists the training times in seconds for the given formulations of the ANN. Its test accuracy
gradually increased with the training time, with some deviations in orientation. ANN-3 yielded
the best result using three hidden layers, 64, 32, and 16 nodes in layers 1–3 respectively, and 0.5
as the value of the dropout layer.
Table 3: Accuracy of the proposed classifiers
Formation Training accuracy (%) Validation accuracy (%) Test accuracy (%) Training time (s)
ANN-1 81.30 79.00 79.30 983
ANN-2 83.80 80.01 81.08 1120
ANN-3 90.04 88.40 89.80 1211
ANN-4 89.10 86.50 87.40 1491
Tab. 4 reports the performance of the proposed method in terms of precision, recall, and the
F1-score) for various formulations of the proposed ANN model. ANN-3 achieved the best results
in terms of precision (88%), recall (88%), and the F1-score (88%).
Table 4: Evaluation metrics of the proposed method
Formation Precision (%) Recall (%) F-score (%)
ANN-1 79 77 78
ANN-2 82 81 81
ANN-3 88 88 88
ANN-4 84 83 83
Figure 7: Confusion matrix for ANN-1
The model was also evaluated by deploying confusion matrices and the receiver operating
character curve (ROC curve) [36]. The confusion matrix compared the classified data with actual1328 CMC, 2021, vol.67, no.1
labeled data, whereas the ROC curve is a graphical visualization that shows the investigative
capability of a binary classification problem as its discrimination threshold is varied. In the graphs
below, for the confusion matrix, the y-axis represents the actual label whereas the x-axis represents
the classified data (i.e., the data detected by the model). Similarly for the ROC curve, the y-
axis shows the true positive rate and the x-axis shows the false positive rate (tweets that did
not represent infection but were judged by the model as dengue positive). Moreover, a micro-
average ROC curve was used for the most populous class (negative class) and a macro-average
ROC curve for the least populous class (positive class). If the macro-average value was smaller
than the micro-average value of the ROC curve, it showed that the most populous class featured
a significant number of instances of incorrect classification, whereas smaller class labels were
correctly classified. If the macro-average was slightly smaller than the micro-average, this indicated
that smaller labels were improperly classified by the model while the larger class was properly
classified. Fig. 7 shows that ANN-1 was not efficient at classifying tweets indicating dengue
without the optimization techniques. The ROC curve reflects this in Fig. 8. However, as shown
in Figs. 9 and 10, ANN-2 performed better than ANN-1 owing to the slight optimization of the
hyperparameters (see Tab. 2).
Figure 8: ROC curve for ANN-1
Figure 9: Confusion matrix for ANN-2CMC, 2021, vol.67, no.1 1329
Figure 10: ROC curve for ANN-2
Figure 11: Confusion matrix for ANN-3
Figure 12: ROC curve for ANN-31330 CMC, 2021, vol.67, no.1
The results above show that the performance of ANN-3 (Figs. 11 and 12) for the class of
disease-positive tweets (88%) was significantly better than the other formulations as it used differ-
ent hyperparameters. Moreover, Figs. 13 and 14 show that ANN-4 delivered poorer performance
(81%) because with its limited number of nodes, it works efficiently on medium-sized data but
not on large corpora (5,000 tagged data items were used in this study).
Figure 13: Confusion matrix for ANN-4
Figure 14: ROC curve for ANN-4
5 Conclusion
In recent years, Twitter has emerged as the most popular social media platform for sharing
health-related information in real time. We explored ANN techniques in this study to classify
dengue-related tweets into positive and negative classes. A ground truth dataset was used for
experiments. It was passed through modules for (i) data acquisition, (ii) data preprocessing,
(iii) feature extraction, and (iv) classification. The proposed model was then trained and evaluated
in terms of its ability to correct classify tweets into positive and negative classes, according to
whether they did or did not indicate that someone had been infected, respectively. We used several
evaluation metrics to assess the model. The synthetic and semantic relationships among the wordsCMC, 2021, vol.67, no.1 1331
were also checked by uses features of the GloVe embedding technique with bi-grams. The results
showed that the proposed method can efficiently learn the context of the word structure. In
future, the proposed model may also be applicable as a surveillance system to quickly detect the
transmission of COVID-19.
Despite substantial findings revealed by the proposed model, it has certain drawbacks. Super-
vised learning was used in this research, because of which the data used for model training needed
to be labeled. The model should be trained in an unsupervised way to avoid requiring labeled data.
Funding Statement: The author(s) received no funding specifically for this study.
Conflicts of Interest: The authors declare that they have no conflicts of interest to report regarding
the publication of this study.
References
[1] M. J. Paul, A. Sarker, J. Brownstein, A. Nikfarjam, M. Scotch et al., “Social media mining for public
health monitoring and surveillance,” in Pacific Sym. on Biocomputing, Hawaii, USA, pp. 468–479, 2016.
[2] W. W. Hung, U. A. Nayim, C. Max, R. Assavalapsakul, L. P. Liang et al., “Dengue hemorrhagic fever–
A systemic literature review of current perspectives on pathogenesis, prevention and control,” Journal
of Microbiology, Immunology and Infection, vol. 53, no. 16, pp. 963–978, 2020.
[3] C. D. A. Marques-Toledo, C. M. Degener, L. Vinhal, G. Coelho, W. Meira et al., “Dengue prediction
by the web: Tweets are a useful tool for estimating and forecasting dengue at country and city level,”
PLoS Neglected Tropical Diseases, vol. 11, no. 7, pp. 1–20, 2017.
[4] N. Thapen, D. Simmie, C. Hankin, J. Gillard and C. M. Danforth, “DEFENDER: Detecting and
forecasting epidemics using novel data-analytics for enhanced response,” PLoS One, vol. 11, no. 5,
pp. 1–19, 2016.
[5] H. A. Carneiro and E. Mylonakis, “Google trends: A web-based tool for real-time surveillance of
disease outbreaks,” Clinical Infectious Diseases, vol. 49, no. 10, pp. 1557–1564, 2009.
[6] M. Zivkovi, “Flu detector-tracking epidemics,” in Joint European Conf. on Machine Learning and
Knowledge Discovery in Databases, Berlin, Heidelberg, pp. 599–602, 2010.
[7] J. Du, L. Tang, Y. Xiang, D. Zhi, J. Xu et al., “Public perception analysis of tweets during the 2015
measles outbreak: Comparative study using convolutional neural network models,” Journal of Medical
Internet Research, vol. 20, no. 7, pp. 1–11, 2018.
[8] E. Aramaki, M. Sachiko and M. Morita, “Twitter catches the flu: Detecting influenza epidemics using
Twitter,” in Proc. of the 2011 Conf. on Empirical Methods in Natural Language Processing, Edinburgh,
Scotland, UK, pp. 1568–1576, 2011.
[9] S. Amin, M. I. Uddin, M. A. Zeb, A. A. Alarood, M. Mahmoud et al., “Detecting dengue/flu infections
based on tweets using LSTM and word embedding,” IEEE Access, vol. 8, pp. 189054–189068, 2020.
[10] J. Pennington, R. Socher and C. Manning, “Glove: Global vectors for word representation,” in Proc. of
the 2014 Conf. on Empirical Methods in Natural Language Processing, Doha, Qatar, pp. 1532–1543, 2014.
[11] S. Wakamiya, M. Morita, Y. Kano, T. Ohkuma and E. Aramaki, “Tweet classification toward twitter-
based disease surveillance: New data, methods, and evaluations,” Journal of Medical Internet Research,
vol. 21, no. 2, e12783, 2019.
[12] S. Lim, C. S. Tucker and S. Kumara, “An unsupervised machine learning model for discovering
latent infectious diseases using social media data,” Journal of Biomedical Informatics, vol. 66, no. 3,
pp. 82–94, 2017.
[13] S. Tong and D. Koller, “Support vector machine active learning with applications to text classification,”
Journal of Machine Learning Research, vol. 2, no. 11, pp. 45–66, 2001.
[14] U. Kaya, G. Kaya and N. Güler, “A study on multiple linear regression analysis,” Procedia-Social and
Behavioral Sciences, vol. 106, pp. 234–240, 2013.1332 CMC, 2021, vol.67, no.1
[15] H. A. Park, “An introduction to logistic regression: From basic concepts to interpretation with
particular attention to nursing domain,” Journal of Korean Academy of Nursing, vol. 43, no. 2,
pp. 154–164, 2013.
[16] S. Zhang, X. Li, M. Zong, X. Zhu and D. Cheng, “Learning k for KNN classification,” ACM
Transactions on Intelligent Systems and Technology, vol. 8, no. 3, pp. 1–19, 2017.
[17] L. Hussain-Alkhateeb, K. Alex, O. Piero, R. Joacim, O. Maquins et al., “Early warning and response
system for dengue outbreaks: Recent advancements towards widespread applications in critical settings,”
PLoS One, vol. 13, no. 5, pp. 1–14, 2018.
[18] P. Guo, T. Liu, Q. Zhang, L. Wang and J. Xiao, “Developing a dengue forecast model using machine
learning: A case study in China,” PLoS Neglected Tropical Diseases, vol. 11, no. 10, pp. 1–22, 2017.
[19] N. Iqbal and M. Islam, “Machine learning for dengue outbreak prediction: A performance evaluation
of different prominent classifiers,” Informatica, vol. 43, no. 3, pp. 1–10, 2019.
[20] J. Gomide, A. Veloso, W. Meira, V. Almeida, F. Benevenuto et al., “Dengue surveillance based on a
computational model of spatio-temporal locality of Twitter,” in Proc. of the 3rd Int. Web Science Conf.,
USA, pp. 1–8, 2011.
[21] F. Cacheda and A. Manuel, “Twitter: A good place to detect health conditions,” PLoS One, vol. 9, no.
1, pp. 1–11, 2014.
[22] V. A. Maksimenko, S. A. Kurkin, E. N. Pitsik, V. Y. Musatov, A. E. Runnova et al., “Artificial neural
network classification of motor-related EEG: An increase in classification accuracy by reducing signal
complexity,” Complexity, vol. 2018, pp. 1–12, 2018.
[23] Twitter scraper. [Online]. Available: https://github.com/taspinar/twitterscraper.
[24] https://github.com/phatpiglet/autocorrect.
[25] NLTK 3.5 documentation. [Online]. Available: https://www.nltk.org/_modules/nltk/stem/porter.html.
[26] J. Violos, K. Tserpes, I. Varlamis and T. Varvarigou, “Text classification using the n-gram graph
representation model over high frequency data streams,” Frontiers in Applied Mathematics and Statistics,
vol. 4, pp. 1–19, 2018.
[27] T. Fushiki, “Estimation of prediction error by using K-fold cross-validation,” Statistics and Computing,
vol. 21, no. 2, pp. 137–146, 2011.
[28] Y. Lecun, Y. Bengio and G. Hinton, “Deep learning,” Nature, vol. 521, no. 7553, pp. 436–444, 2015.
[29] C. Nwankpa, W. Ijomah, A. Gachagan and S. Marshall, “Activation functions: Comparison of trends
in practice and research for deep learning,” pp. 1–20, 2018.
[30] C. J. Shallue, J. Lee, J. Antognini, J. Sohl-Dickstein, R. Frostig et al., “Measuring the effects of data
parallelism on neural network training,” Journal of Machine Learning Research, vol. 20, pp. 1–49, 2019.
[31] N. Srivastava, G. Hinton, A. Krizhevsky, I. Sutskever and R. Salakhutdinov, “Dropout: A simple way
to prevent neural networks from overfitting,” Journal of Machine Learning Research, vol. 15, no. 1,
pp. 1929–2958, 2014.
[32] Anaconda. [Online]. https://anaconda.org/.
[33] TensorFlow. [Online]. https://www.tensorflow.org/tutorials/keras/keras_tuner.
[34] Keras. [Online]. https://keras.io/api/layers/initializers/.
[35] Scikit-learn. [Online]. https://scikit-learn.org/stable/.
[36] D. M. W. Powers, “Evaluation: From precision, recall and F-measure to ROC, informedness, marked-
ness & correlation,” Journal of Machine Learning Technology, vol. 2, no. 1, pp. 37–63, 2011.You can also read