Microsensors CHALLENGE 2021 - Protocol - AIRLAB
←
→
Page content transcription
If your browser does not render page correctly, please read the page content below
Microsensors CHALLENGE 2021

 - Protocol -

With the participation of:

 Last revision: 21.12.2020
AIRLAB Microsensors Challenge 2021 Protocol

 2/22
AIRLAB Microsensors Challenge 2021 Protocol

 Table of contents

 1 Introduction

 2 Method
 2.1 Categories
 2.2 Evaluation sites
 2.3 Performance criteria
 2.4 Criteria weighting
 2.5 Deliverables

 3 Discussion
 3-1 Limitations
 3-2 Outlook

 3/22

AIRLAB Microsensors Challenge 2021 Protocol

1 Introduction
Remarkable progress in sensor technologies over the last two decades has opened the door to a wide
range of potential new applications based on air quality measurements. This has in turn led to the
emergence of a very dynamic and arguably volatile market of integrated air quality monitoring
solutions, based on low-cost sensors. While important steps have been made in recent years for
developing norms and performance standards, the large array of commercially devices already
available on the market, very few of which have been subject to any data quality certification
process, can lead to confusion even in the ranks of expert users when faced with the challenge of
choosing an appropriate measurement platform for a particular application.

The AIRLAB Microsensors Challenge seeks to meet the growing demand from potential users for an
independent and objective evaluation of the performance of such microsensor based devices.
Pioneering work towards this same goal has been made by the South Coast Air Quality Management
District through its Air Quality Sensor Performance Evaluation Center (AQ-SPEC) [41]. Differently
from their work, which focuses solely on the quality of the measurements, the AIRLAB Microsensors
Challenge goes beyond metrological criteria to also consider the utility, usability, portability, and cost
of the considered platforms. Moreover, another novel aspect of the AIRLAB Microsensors Challenge
is that it is designed as a periodic event in which all candidate sensing platforms are evaluated in
parallel. Therefore, the Microsensors Challenge provides a snapshot of the state of the art of
commercially available microsensor platforms at a given moment in time.

The current iteration of the Challenge seeks to consolidate and improve its evaluation process by
leveraging the experience accumulated over the first two editions (i.e. in 2018 and in 2019) and has
prepared a significant evolution of the evaluation criteria, thanks in no small part to the constructive
feedback we have received from Challenge results users and previous edition candidates. Another
novelty for this year is the evaluation of DIY sensor platforms – the use of which has been gaining
momentum in recent years. Finally, an overhaul of the way in which the Challenge results are
presented is planned for the 2021 edition, by offering the users an interactive Web-based platform
for interacting directly with the Challenge results, through customizable searches and side-by-side
comparisons.

The scope of the present document is to present in detail the Challenge evaluation criteria as well as
the associated measurement protocols. It represents a complement to the Microsensors Challenge
Rules (complete title: Microsensors Challenge 2021 - Terms and Conditions, Regulations and
Guidelines1). It is presented for information purposes and is published at the same time as the call for
participations. It can be subject to modifications and evolutions during the unfolding of the Challenge
event as a function of material constraints (e.g., replacement of reference analyzers with equipment
of different model and/or make), in response to varying demand for specific pollutant evaluations,
depending on the actual candidate submissions, or any other evolutions deemed necessary by the
Challenge Steering Committee to ensure the quality of the evaluation process. All modifications to
the protocol will be integrated in revisions of this document and Challenge candidates will be dully
notified of each revision.

1
 Available online at: http://www.airlab.solutions/en/projects/microsensor-challenge
 4/22
AIRLAB Microsensors Challenge 2021 Protocol

2 Method
In order for their respective air quality sensors to be evaluated within the Challenge, candidates need
to submit their applications in accordance with the Microsensors Challenge Rules. Once all
applications are received, the Jury convenes to validate them and to perform a preliminary selection
of candidate solutions based on the relevance of the submission dossiers. During this same meeting,
the Jury decides which DIY platforms available on the market would present an interest for
evaluation and specifies for which categories of use they should be tested.

In the month following the preliminary selection, samples of the microsensor platforms belonging to
standard candidates are received and the necessary elements for building the selected DIY platforms
are purchased and assembled by the Challenge technical team. A set of initial technical tests are
performed (e.g., data recovery verifications, mechanical robustness for usage category, etc.), in order
to evaluate the technical soundness of all the candidate solutions. On the basis of the experience
gathered during the phase, the Jury reconvenes to determine which candidate solutions (including
DIY platforms) can proceed to the next phase of the Challenge.

Thereafter, the metrological quality of the candidate sensors are tested in accordance with the list of
use-case categories specified in their application either in a metrology laboratory, or in the field, or in
mobile settings. These tests provide the necessary measurement data and usage information for
evaluating the candidate solutions according to the accuracy and usability criteria. The remaining
criteria (i.e. utility, portability and cost) are evaluated mostly based on the verification of
manufacturer specifications.

In this section we present the methodology used for performing the evaluation of the candidate
solutions. We start by defining the different usage categories considered by the Challenge, we then
describe the evaluation sites, and, finally, we present in detail each evaluation criterion and its
calculation.

 2.1 Categories
In the context of the Challenge, we define a sensor’s category as its type of use or intended
application. The categories in this Challenge are eight; some of them are freely adapted from the
World Meteorological Organization (WMO) technical report No. 1215 on microsensors [42]. In this
edition of the Challenge we have proceeded to a reorganization of the categories into three main
groups, based on the targeted application domain: Outdoor Air, Indoor Air, and Citizen Air (see
Figure 1). The latter application domain relates to applications that target the air to which people are
personally exposed throughout their daily activities.

 Figure 1: The eight Challenge categories grouped by their application domain.

 5/22
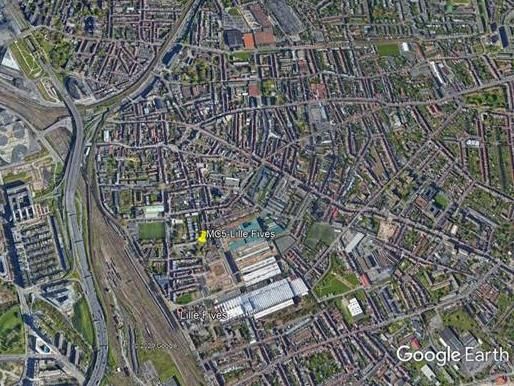
AIRLAB Microsensors Challenge 2021 Protocol In this context, the eight usage categories are defined as follows: Outdoor Air (OA): Awareness (OA-A) – Promote the information and the awareness of the public or users through outdoor air data. The requirements for this type of application are lower on the quality of the data. These sensors aim only at coherence to reference devices and not at equivalence. The panel of pollutants to be monitored may be reduced. Monitoring (OA-M) – Target the complementary integration into regulatory networks for monitoring of compliance to national or transnational standards of air quality for a given outdoor location. This implies very high requirements for the quality of data produced and their traceability to reference devices. The main regulated and problematic pollutants are to be measured. Vehicular (OA-V) – Promote information and public or user awareness with mobile data obtained using a vehicle (e.g., car, bicycle). As this data can complement fixed air quality monitoring devices, data quality close to those produced by reference equipment and the monitoring of the main pollutants of outdoor air is expected. Indoor Air (IA): Awareness (IA-A) – Promote the information and the awareness of the public or users through indoor air data. The requirements for this type of application are lower on the quality of the data. These sensors aim only at coherence to reference devices and not at equivalence. The panel of pollutants to be monitored may be reduced. Monitoring (IA-M) – The support of the verification of compliance to national air quality standards in childcare establishments under 6 years old (nurseries, day-care centers, etc.), kindergartens and elementary schools. This implies a high quality of data by meeting the accreditation requirements LAB REF30 or the specifications of the INERIS on this subject2. The measurement process follows fully prescribed methods and best practices. Piloting (IA-P) – Controlling, managing, and regulating indoor air quality for building or installations with the help of a multi-parameter sensor. The requirements for this type of application are lower on the quality of the data. These sensors aim only at coherence to reference devices and not at equivalence, while at the same time being continuously available and easily interoperable with the domotics system, including the managing or user interface. Citizen Air (CA): Awareness (CA-A) – Promote the information and the awareness of the individual. The requirements for this type of application are lower on the quality of the data. These sensors aim only at coherence to reference devices and not at equivalence. Adequate sensors for this category need to be able to operate in motion while being worn over several hours by a human being. Exposure (CA-E) – Evaluate the impacts on human health of air pollution. The measurements used for this type of application must be quantitative and preferably have an equivalent to regulatory measures, while operating in motion and with a Sensor that can be worn over several hours by a human being. The main indoor and outdoor pollutants with a demonstrated impact on health are to be monitored. 2.2 Evaluation sites To cover the different Challenge categories, three different types of evaluation sites are used: an outdoor site, an indoor site, and a mobile site. The outdoor measurement site is the urban background regulatory monitoring station Lille-Fives which is located in the capital of the Hauts-de-France region, Lille (see Figure 2). The elevation at this 2 Evaluation of the conformity of kits for the realization of indicative measurements of formaldehyde, benzene and carbon dioxide in the indoor air of establishments receiving children – INERIS, 2017 6/22

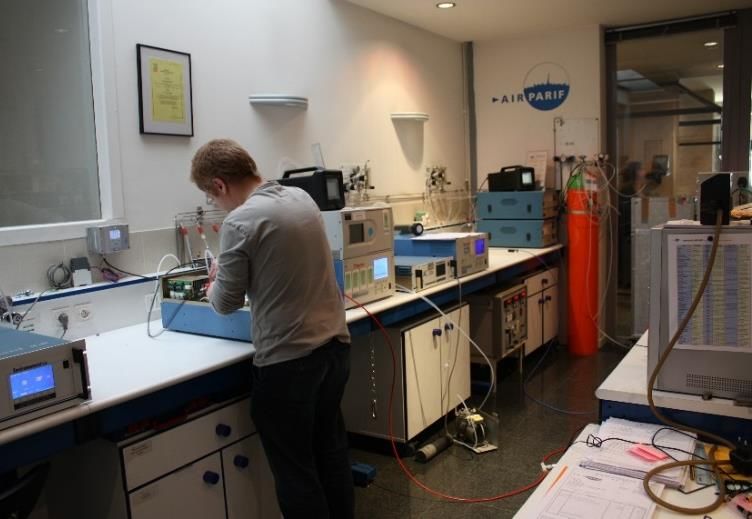
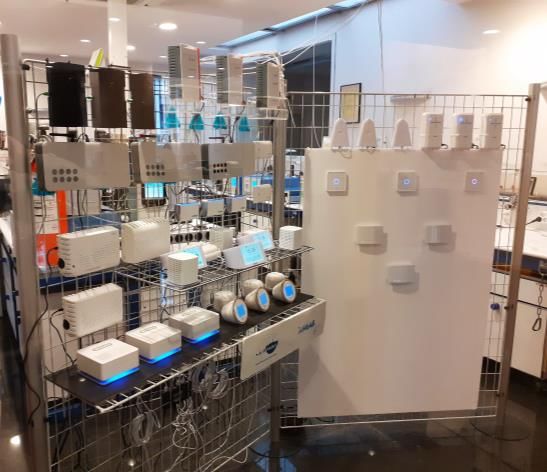
AIRLAB Microsensors Challenge 2021 Protocol site is 21 m, with WGS 84 coordinates: 50° 37' 40.98" N (latitude) and 3° 5' 25.13" E (longitude). Lille is the 4th largest city in France, in a region with more oceanic influence and more rainfall than Ile-de- France, with concentration levels more typical of the French average than the Parisian BP-Est station used in the previous editions of the Challenge. Usage categories evaluated at the Lille-Fives station are OA-A and OA-M. Figure 2: Outdoor evaluation site – Lille-Fives monitoring station exterior view (left) and location (right). The following analyzers are used at Lille-Fives as reference measurements for the purpose of the Microsensors Challenge: Particulate matter is measured with the Thermo Scientific FDMS TEOM-1405F3 Filter Dynamics Measurement System (FDMS) for PM10 and PM2.5 (Reference standard for ambient air: NF EN 16450: 2017). Hourly averages are used, but finer time resolutions are also possible (e.g., 15 minute-averages, 10 s scans). Nitrogen oxides are measured by an Envea AC32e4 chemiluminescence analyzer, which provides measurements for NO and NO2 (Reference standard for ambient air: NF EN 14211: 2012). In the context of the Challenge hourly averages are used, however the data from these analyzer is also available at finer resolutions (e.g., 15 minute-averages, 10 s scans). Ozone is measured with an Envea O342e5 UV photometry analyzer (Reference standard is ambient air: NF EN 14625: 2013). Hourly averages are used, but 15 minute-averages and 10 s scan data is also possible. For the evaluation of indoor air quality sensors the interior of Airparif’s metrology laboratory is used as indoor measurement site (see Figure 3). The metrology laboratory has a number of features that make it a practical choice for running the indoor evaluation tests: the easy access to the necessary reference analyzers and gas circuitry, the air conditioning of the room which allows a certain degree of control over the environment, the regular use of the space by employees during the trials period, and, last but not least, the availability of a glass wall which allowed the tests to be showcased for communication purposes. The usage categories that are evaluated in this space are IA-A, IA-M, and IA-P. For this purpose the following material is used as reference: Particulate matter is measured using the the PALAS Fidas 200 analyzer6, an optical spectrometer (measurement principle described by NF EN 16450: 2017). The Fidas provides 3 https://www.thermofisher.com/order/catalog/product/TEOM1405F 4 https://www.envea.global/s/ambient-en/gas-monitors-ambient-en/ac32e/ 5 https://www.envea.global/s/ambient-en/gas-monitors-ambient-en/o342e/ 6 https://www.palas.de/en/product/fidas200 7/22
AIRLAB Microsensors Challenge 2021 Protocol multiple outputs, including particle granulometry. Currently, for the Challenge, we make use of its PM10, PM2.5 and PM1 outputs with a 10 min average temporal aggregation. Carbon dioxide is measured using the Thermo Scientific 410i7, a non-dispersive infrared (NDIR) analyzer, with a 10 min average temporal aggregation. Nitrogen oxides are measured by Thermo Scientific 42i chemiluminescence analyzer, which provides measurements for NO and NO2 (measurement principle described by NF EN 14211: 2012). For the indoor evaluations 10 min averages are used. Figure 3: General view of Airparif's metrology laboratory (left) and detail of part of the sensor evaluation rig (right). Volatile organic compounds (VOCs) concentrations are measured using the method of pumped sampling on Tenax sorbent tubes followed by thermal desorption and gas chromatography analysis in Airparif’s chemistry laboratory (measurement principle described by NF EN 14662-1). The Tenax tubes were exposed with an 8 hour periodicity. In order to permit a higher temporal resolution analysis, two additional analyzers are also used which are based on the method of automatic pumped sampling with in situ gas chromatography (described by NF EN 14662-3). These are a VOC online solution constituting of a Turbomatrix ATD and a Clarus 500 GC from Perkin Elmer8 and the Syntech Spectras GC 9559. The COV online is configured for hourly averaged measurements, while the GC 955 for 15 min averaged measurements. Since these automatic analyzers suffer from an insensitivity for heavier VOCs and microsensors typically target total VOCs measurements, the integrated measurements of the automatic analyzers are corrected using the NF EN 14662-1 method results. In order to investigate the response of the sensors, a number of specific stimulation scenarios are considered for the indoor evaluations by using regular and electronic cigarettes, candles, incense, cleaning products, and cooking. 7 https://www.thermofisher.com/order/catalog/product/410I#/410I 8 http://www.perkinelmer.com/fr/category/gas-chromatography-gc-instruments 9 https://www.synspec.nl/products/gc-955.html 8/22
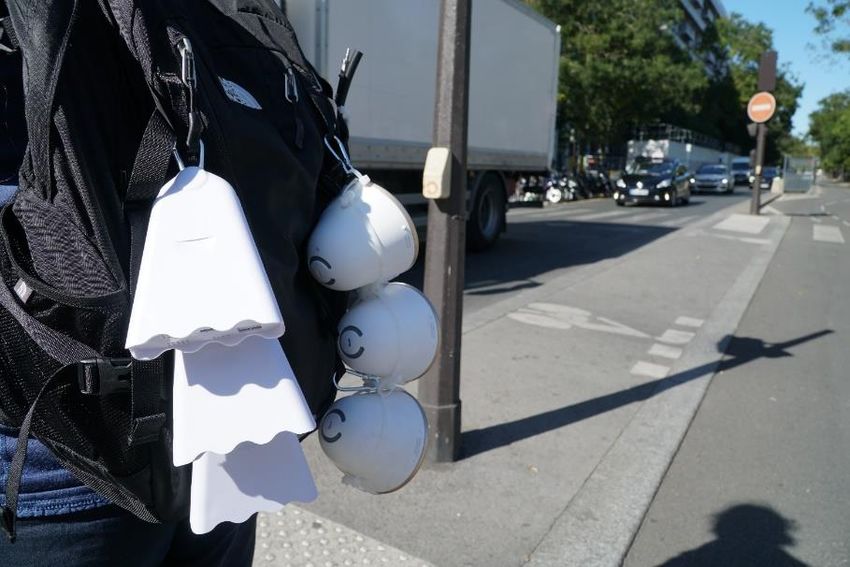
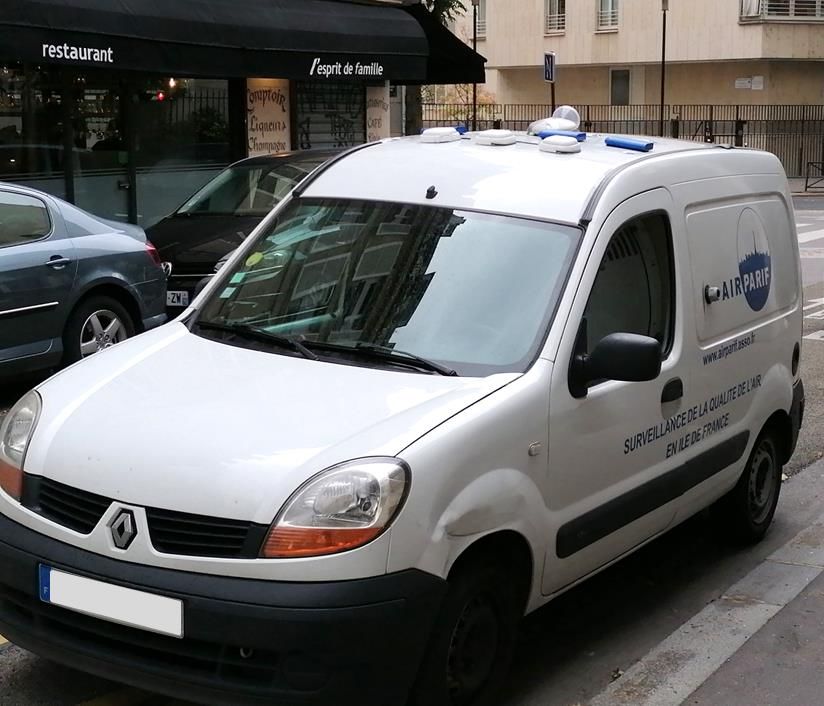
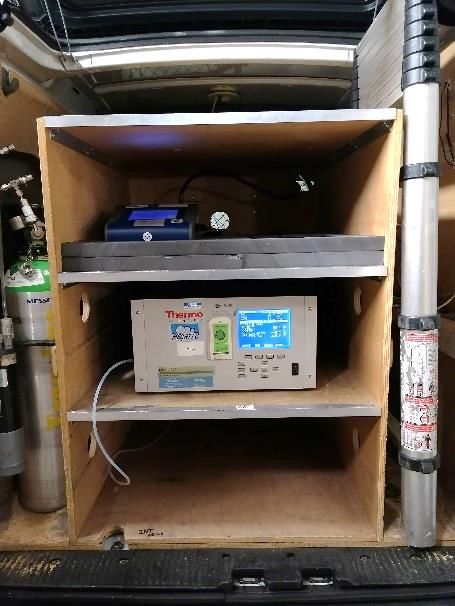
AIRLAB Microsensors Challenge 2021 Protocol Figure 4: Airparif vehicle equipped for mobile evaluation. External view of vehicle setup (left) and detail of internal setup (right). In the context of the Challenge, we define as the mobile site the ensemble of mobility vectors used for mobile sensor evaluation. These include an Airparif vehicle setup (Figure 4), and a number of volunteers for portable microsensor testing (Figure 5). The vehicle setup is used for evaluating microsensors competing in the OA-V category. To this end, the reference devices were installed in the back of the vehicle with an inlet allowing for air to be sampled from the exterior, while the sensors under evaluation were deployed on its roof. The reference material for the vehicle tests is the following: Particulate matter are measured using TSI DustTrak DRX Aerosol Monitors 853310. The DustTrak is a light-scattering laser photometer (measurement principle described by NF EN 16450: 2017). The particulate matter measurements considered are PM10, PM2.5, and PM1, and the temporal aggregation is 1 minute averages. Nitrogen oxides are measured by Thermo Scientific 42i chemiluminescence analyzer, which provides measurements for NO and NO2 (measurement principle described by NF EN 14211: 2012). For the indoor evaluations 10 min averages are used. Figure 5: Back-pack setup for the portable tests The Challenge volunteers are equipped with a backpack which houses the reference material and on the exterior of which the candidate microsensors are attached. Considering the combined weight of 10 http://www.tsi.com/dusttrak-drx-aerosol-monitor-8533/ 9/22
AIRLAB Microsensors Challenge 2021 Protocol the equipment, only two different candidate solutions are tested at one time. However evaluation periods are overlapped across the different candidate solutions for achieving a fair performance comparison. The backpack is worn by each volunteer on their daily commute and during the office hours it is kept in the same room as the volunteer, allowing to characterize a large number of microenvironments (e.g., outdoor, indoor, public transportation, etc.). The reference material for the portable tests is the following: Particulate matter are measured using TSI DustTrak DRX Aerosol Monitors 8533. The particulate matter measurements considered are PM10, PM2.5, and PM1, and the temporal aggregation is 1 minute averages. Total VOCs are measured using a portable PID monitor from RAE Systems11 (model ppbRAE PGM7240). 2.3 Performance criteria The AIRLAB Microsensors Challenge adopts a holistic approach to air quality sensor evaluation by combining accuracy, utility, usability, portability, and cost criteria. In this subsection we present each of these criteria and detail their calculations. 1. Accuracy – The accuracy performance criterion is defined based of the Sensor Evaluation Toolkit (SET) index from Fishbain et al. [43], enriched with additional criteria for trueness and precision. The SET Global Method Index includes seven evaluation metrics: The Root-Mean-Square Error (RMSE) is a frequently used error metric for numerical deviations. While being an excellent and popular general purpose error measure, it is sensitive to outliers, and when used on its own it can be disproportionally penalizing for signals that contain large sporadic errors. This shortcoming can be counterbalanced by the use of correlation coefficients. The Pearson correlation coefficient (ρ) characterizes the presence of a linear relationship between two signals (e.g., reference and candidate sensor). It is the most commonly used correlation criterion. The Kendall correlation coefficient (τ) and the Spearman correlation coefficient (S) are two different rank correlation coefficients which are used to test for the presence of a non-linear relationship between two variables. The Presence (spresence) metric represents the evaluation of the completeness of the data, highlighting sensor failures, operational or data transmission problems. The Source analysis (ssource) characterizes the capacity of the device to identify and localize a source (perception of the variations of pollutant level as a function of wind direction). The Match score (smatch) relates to the common use of air quality grading schemes (e.g., the Air Quality Index) in the context of applications that do not require precise absolute measurements such as citizen science projects or general risk estimations. It consists in the division of the reference and candidate sensor dynamic ranges into equal number of bins and quantifying the bin-classification agreement for reference-candidate measurement pairs. The Lower Frequencies Energy (LFE) metric characterizes the acquired sensor signal rather than a comparison with a reference instrument and reflects the sensor’s ability to capture the temporal variability of the targeted pollutant. The additional criteria used in the Challenge are: 11 https://www.raesystems.com/products/survey-monitors 10/22
AIRLAB Microsensors Challenge 2021 Protocol
The Slope (b) and Intercept (a) of a linear regression model of the relationship between the
reference measurements and the microsensor measurements. The values of these two
parameters permit an evaluation of the trueness of the candidate solution. A partial score sb
is assigned as a function of the value of the slope, by splitting its possible values into three
groups as detailed in Table 1. The split is based on the approach adopted by the LNE and the
INERIS for their “AIR Quality Sensor” Certification12.
Table 1: Assignment of the sb score for the slope.
Group A Group B Group C
0.5 ≤ b < 0.7 b < 0.5
Slope (b) 0.7 ≤ b ≤ 1.3 or or
1.3 < b ≤ 1.5 b > 1.5
Score (sb) 1 0.5 0
A second partial score, sa, is calculated based on the intercept using the following formula:
| |
1− , | | ≤ ( )
= { ( )
0, | | > ( )
The final score for the trueness criterion, st, is the average between sb and sa.
The Reproducibility is an expression of the precision of the candidate solution and is
calculated across the microsensor samples of a candidate solution, it includes both the
variability due to causes intrinsic to one sensor unit (e.g., measurement noise) and inter-
device variability (e.g., due to the manufacturing process). It is calculated according to the
ISO 5725-2 standard13 as the standard deviation of the reproducibility expressed as a
percentage, .
The final Integrated Performance Index (IPI) aggregates the eight metrics and has a value between 0
and 1 (1 being equivalent to the reference method):
= {(1 − ), , , , , , ℎ , , , 1 − /100}
where NRMSE represents the normalized RMSE, which we calculate as the ratio between the error
and the measurement range:
=
−
In the context of the Challenge, the accuracy of the candidate sensors is calculated by using a
reference measurement and the presented method for calculating the IPI with data acquired over a
time interval of at a minimum ten days. An example of a result of the complete accuracy calculation
is illustrated in Table 2.
Table 2: Example of accuracy result.
SET method
Match RMSE Pearson Kendall Spearman Presence LFE Trueness Repro IPI
Sensor #1 0.44 0.85 0.83 0.62 0.82 0.96 0.99 0.84 0.89 0.80
12
https://prestations.ineris.fr/en/certification/certification-sensors-system-air-quality-monitoring
13
ISO 5725-2 Accuracy (trueness and precision) of measurement methods and results — Part 2: Basic method
for the determination of repeatability and reproducibility of a standard measurement method:
https://www.iso.org/standard/69419.html
11/22AIRLAB Microsensors Challenge 2021 Protocol 2. Utility – This criterion reflects the capacity of a sensor system to provide the essential functionalities for accomplishing the targeted goal. The criteria taken into account to evaluate Utility vary based on the category of use, with two criteria always present: targeted pollutants and data recovery: The targeted pollutants sub-criterion rewards a good match between the type of measurements provided by the sensor platform and the pollutant of interest for a given environment. It is calculated based on Table 3, by adding the corresponding coefficients for the pollutants targeted by the candidate solution, up to a maximum score of 1. Table 3: Evaluation grid for calculation of the targeted pollutants sub-criterion. OA IA CA NO2 0.4 0.3 0.4 CO2 - 0.4 0.3 PM10 0.4 0.3 0.2 PM2.5 0.4 0.4 0.4 PM4 - - 0.4 PM1 0.2 0.2 0.2 O3 0.3 - 0.2 CH2O - 0.4 0.3 VOC - 0.4 0.3 BC 0.3 - 0.2 Benzene 0.2 0.4 0.3 SO2 0.1 - - CO 0.1 0.4 0.4 CP 0.2 0.2 0.4 H2S 0.1 0.2 0.2 NH3 0.3 0.2 0.2 NO 0.2 0.2 - The data recovery characterizes the communication options that allow the recuperation of measurement data from the sensor for inspection, analysis or further processing. It is calculated based on Table 4, by adding the available communication options for the candidate solution, up to a maximum score of 1. Table 4: Evaluation grid for calculation of the data recovery sub-criterion. Outdoor Air Indoor Air Citizen Air Physical connection 0.25 0.25 0.25 Short-distance wireless 0.25 0.75 0.75 Long-distance wireless 0.75 0.75 0.75 Other nine sub-criteria that, depending on the category of use can be part of the utility or the usability criterion calculation are: The acoustic comfort is inversely proportional with the unwanted sound that the microsensor platform generates. French noise regulation for residential buildings requires that acoustic pressure levels be inferior to 30 dB (A). In the context of the Challenge, we characterize acoustic noise by measuring the maximum acoustic pressure levels generated by the candidate microsensor solution at a distance of 1 m. For this purpose we use a RION 12/22
AIRLAB Microsensors Challenge 2021 Protocol NL52-3014 sound level meter, equipped with a NH-25 preamplifier and a UC-59 microphone. The grading scale for the acoustic pressure sub-criterion is presented in Table 5. Table 5: Evaluation grid for the acoustic comfort sub-criterion. Acoustic pressure level Score < 24 dB(A) 1.00 30 dB(A) 0.80 36 dB(A) 0.60 42 dB(A) 0.40 48 dB(A) 0.20 > 54 dB(A) 0.00 The energy autonomy of a microsensor product can play an important role in its usability, particularly for settings that do not provide access to a standard power supply connection (e.g., mobile applications, remote fixed locations, etc.). This characteristic is graded according to the grid in Table 6. Table 6: Evaluation grid for the autonomy sub-criterion. Autonomy en H 1 < 72 0.9 72 0.8 48 0.7 24 0.6 16 0.5 8 0.4 6 0.3 4 0.2 2 0.1 1 0 Power socket Data interoperability characterizes a system’s ability to allow for data exchange with other systems without technical restrictions. In the context of the Challenge, we consider the ability of the candidate microsensor systems to allow for the use of its produced data by other systems. The score for this sub-criterion is calculated according to Table 7. Table 7: Evaluation grid for the data interoperability sub-criterion. Data not accessible 0.00 Proprietary data format 0.25 Open data format 0.75 Open format respecting INSPIRE15 1.00 Data visualization plays an important role in the understanding of measurement data. More so for devices that are designed for non-expert users as is often the case for air quality microsensors. In this context we consider a two dimensional partitioning of the possible 14 https://rion-sv.com/products/NL-52_42-E.html 15 https://inspire.ec.europa.eu 13/22
AIRLAB Microsensors Challenge 2021 Protocol visualization solutions (see Table 8). On the horizontal axis we consider the availability of either a real-time or offline (subsequent to the measurement experiment) visualization solution. On the second axis we consider whether a display is integrated directly on the sensor, constitutes a remote solution (e.g., leveraging a mobile phone display or a computer display through a cloud service), or no possibility of displaying the data exists. Table 8: Evaluation grid for the data visualization sub-criterion. Real-time Offline Integrated display 1.00 0.75 Remote display 0.75 0.50 None 0.00 0.00 The form factor sub-criterion is calculated based on two characteristics of the microsensor product: its mass and its volume. It relates to how much of a physical burden the device represents for operations like transportation or installation. The encumbrance sub-criterion value is calculated by first attributing a mass score, smass, and a volume score, svolume (see Table 9), and then computing the encumbrance score as follows: = √ ∙ Table 9: Evaluation grids for mass (left) and volume (right) scores for the form factor sub-criterion. Mass Volume in g in cm3 1 < 100 1 < 10 0.9 250 0.9 50 0.8 500 0.8 100 0.7 750 0.7 200 0.6 1000 0.6 400 0.5 2000 0.5 800 0.4 4000 0.4 1600 0.3 6000 0.3 3200 0.2 8000 0.2 6400 0.1 100000 0.1 12800 0 > 10000 0 > 12800 The measurement time step sub-criterion refers to the sampling period of the microsensor solutions. A relatively higher temporal resolution is typically needed for mobile sensing applications. The score for this sub-criterion is given according to Table 10. Table 10: Evaluation grid for the measurement time step sub-criterion. Sampling period Score < 1 min 1.00 5 min 0.80 15 min 0.60 60 min 0.40 120 min 0.20 > 240 min 0.00 14/22
AIRLAB Microsensors Challenge 2021 Protocol Real-time notifications – relates to whether the considered microsensor system permits the transmission of notifications to the operator/user either directly through an integrated screen or through remote messaging (e.g., SMS, e-mail). The score of this sub-criterion is evaluated according to Table 11. Table 11: Evaluation grid for the real-time notifications sub-criterion. Type of notification Score None 0.00 Visual 0.50 Remote 0.75 Visual and remote 1.00 The reduced maintenance sub-criterion is a measure of the periodicity of necessary maintenance operations. Its value represents the average of the user maintenance score and the professional maintenance score. The former refers to the maintenance operations to be performed by the microsensor platform user. Examples of such operations are: cleaning of inlets, filter changes, basic calibration (e.g., for zero levels), battery replacement, etc. The latter is defined as a measure of the periodicity of all maintenance operations that cannot be performed directly by the user and need the intervention of a specialized technician. The values of these scores are determined according to the grids presented in Table 12. Table 42: Evaluation grids for the user maintenance (left) and professional maintenance (right) scores for the maintenance sub-criterion. User Maintenance Professional Maintenance Periodicity Score Periodicity Score Hourly 0 < Monthly 0 Daily 0.1 Monthly 0.1 Weekly 0.2 Trimestral 0.3 Monthly 0.4 Annually 0.6 Trimestral 0.6 18 Months 0.8 Annually 0.8 > 18 Months 1 > Annually 1 Statistical summary – this sub-criterion characterizes whether or not the microsensor product provides statistical options for the measured data. This statistical options relate on the one hand to the possibility of accessing historical data, either in raw form or through customizable aggregations, and on the other hand to the availability of statistical summaries. We classify statistical summaries into two broad classes: indicative or comparative. Indicative statistics are direct calculations exclusively on the basis of the measured data (e.g., mean, median, minimum, maximum), while comparative statistics highlight relationships with respect to specific external benchmarks (e.g., limit levels, statistics over a population, a region, or a historical period). The method of evaluating the analytics criterion is presented in Table 13. Table 13: Evaluation grid for the statistical summary sub-criterion. Statistics None Indicative Comparative None 0.00 0.25 0.50 History Raw only 0.25 0.50 0.75 Customizable aggregations 0.50 0.75 1.00 15/22
AIRLAB Microsensors Challenge 2021 Protocol The way in which these nine sub-criteria are assigned to the utility criterion depending on the category of use is presented in Table 14. The overall utility criterion score is calculated as the average over all considered sub-criteria. Table 14: Sub-criteria forming the utility criterion depending on category of use. Targeted Data Data Measurement Reduced OA-M pollutants recovery interoperability time step maintenance Targeted Data Data Real-time Statistical OA-A pollutants recovery visualization notifications summary Targeted Data Measurement Reduced OA-V Form factor pollutants recovery time step maintenance Targeted Data Acoustic Data Real-time IA-M pollutants recovery comfort interoperability notifications Targeted Data Acoustic Data Real-time IA-A pollutants recovery comfort visualization notifications Targeted Data Acoustic Data Measurement IA-P pollutants recovery comfort interoperability time step Targeted Data Measurement CA-E Autonomy Form factor pollutants recovery time step Targeted Data Data CA-A Autonomy Form factor pollutants recovery visualization 3. Usability – This criterion characterizes the ability of the candidate solution to provide the conditions for its users to perform the tasks safely, effectively, and efficiently while enjoying the experience. The criteria taken into account to evaluate Usability vary based on the category of use (detailed in the Challenge Protocol), with one criterion always present – the Ease of Use (Test of use): The ease of use sub-criterion is calculated using a timed start-up test. The candidate sensor is unpackaged and a timer is started. If available, its user manual is consulted and the sensor is switched on. The timer is stopped when its correct operation can be confirmed (e.g., measurement values read on an integrated display or through a cloud interface). Two grades are given following this test. The first one, simpression, is based on the general impression of the test operator who can give one of 4 possible qualifiers. These are subsequently scored based on the evaluation grid in Table 15. Table 15: Evaluation grid for general impression score. Score Qualifier 0 Unsatisfactory 0.50 Average 0.75 Satisfactory 1 Excellent The second grade, stime, is based on the time elapsed for performing the test and takes into account the presence and quality of the user manual through an additive bonus-malus factor, which is applied if the start-up test takes longer than 5 min. The stime grade, including any potential bonus-malus factor, is bounded between 0 and 1. The principle of calculating this grade is summarized in Table 16. The final grade for the ease of use sub-criterion is the average between simpression and stime. 16/22
AIRLAB Microsensors Challenge 2021 Protocol

 Table 16: Evaluation grid for elapsed time score.

 Elapsed time Manual
 [min] presence/quality
 1 ≤5 -0.3 No manual
 0.9 10 -0.1 Unsatisfactory
 0.8 15 +0.1 Average
 0.7 25 +0.2 Satisfactory
 0.6 30 +0.3 Excellent
 0.5 45
 0.4 > 50

The rest of the sub-criteria considered in the calculation of the usability criterion and their
assignment as a function of the category of use is presented in Table 17. The overall usability
criterion score is calculated as the average over all considered sub-criteria.

 Table 17: Sub-criteria forming the usability criterion depending on category of use.

 Data Real-time Statistical
 OA-M Ease of use Autonomy
 visualization notifications summary
 Data Reduced
 OA-A Ease of use Autonomy Form factor
 interoperability maintenance
 Data Data Real-time
 OA-V Ease of use Autonomy
 interoperability visualization notifications
 Data Measurement Reduced
 IA-M Ease of use Form factor
 visualization time step maintenance
 Reduced Statistical
 IA-A Ease of use Autonomy Form factor
 maintenance summary
 Data Real-time Reduced
 IA-P Ease of use Form factor
 visualization notifications maintenance
 Acustic Data Real-time Statistical
 CA-E Ease of use
 comfort visualization notifications summary
 Acustic Measurement Real-time Statistical
 CA-A Ease of use
 comfort time step notifications summary

4. Portability – This criterion characterizes the ability of the candidate sensor solution to be used as
a portable device (i.e. for CA applications). Its calculation is based on three underlying sub-criteria:
autonomy, mass, and volume.

Each of these sub-criteria is calculated based on a grid (see Table 18) that assigns a respective rank
between 0 and 1. The portability criterion is then calculated as the cubic root of the product of the
three sub-criteria. A value close to zero means that the solution is not portable, while a value close to
one indicates a portable sensor.

For example, a candidate sensor that has an autonomy of 8 hours, weighs 1 kg, and has a volume of
100 cm3, will have a portability score of:
 3
 = 3√ ∙ ∙ = √0.5 ∙ 0.6 ∙ 0.8 ≅ 0.62

 17/22
AIRLAB Microsensors Challenge 2021 Protocol

 Table 18: Autonomy, mass, and volume evaluation grids for the portability criterion. The values used in the numerical example are
 highlighted in red.

 Autonomy Mass Volume
 in H in g in cm3
 1 < 72 1 < 100 1 < 10
 0.9 72 0.9 250 0.9 50
 0.8 48 0.8 500 0.8 100
 0.7 24 0.7 750 0.7 200
 0.6 16 0.6 1000 0.6 400
 0.5 8 0.5 2000 0.5 800
 0.4 6 0.4 4000 0.4 1600
 0.3 4 0.3 6000 0.3 3200
 0.2 2 0.2 8000 0.2 6400
 0.1 1 0.1 100000 0.1 12800
 0 Power socket 0 > 10000 0 > 12800

5. Cost is an important selection criterion for any product. In the context of the Challenge, we
consider the cumulated investment and running costs (e.g., for subscriptions, sensitive element
replacement, etc.) over the first 3 years of the microsensor platform use. The cost criterion is graded
similarly to the other criteria, on a scale from 0 (most expensive) to 1 (least expensive), as presented
in Table 19, with costs falling between two consecutive classes being graded through a linearization
between the two corresponding score indexes.
 Table 19: Evaluation grid for the cost criterion.

 Cost
 1.0 30000 €

 2.4 Criteria weighting

The performance criteria presented in the previous subsection are naturally more or less relevant
depending on the use category targeted by the platform. For instance, the portability of a
microsensor that is competing in categories that do not imply mobility (i.e. OA-M, OA-A, IA-M, IA-A,
and IA-P) is completely irrelevant. Likewise, the cost of a platform to be used for regulatory purposes
is less important than for the other categories.

In order to reflect these type of considerations, we use a criteria weighting mechanism which
modulates the criteria evaluation scores as follows:

 18/22
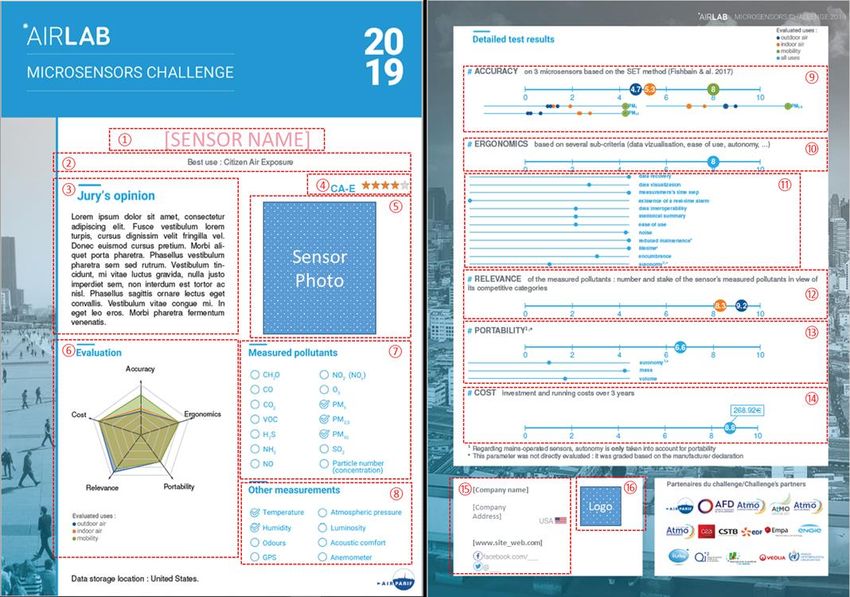
AIRLAB Microsensors Challenge 2021 Protocol Once the different performance criteria are evaluated for a microsensor candidate platform, its obtained scores are then weighted for each of the categories that it is competing in, by using the weighting factors summarized in Table 20. The resulting weighted scores are then averaged to obtain an overall grade on a star scoring scheme, between 0 and 5 stars, for each of the categories in which the microsensor platform is competing. Table 20: Performance criteria weighting as a function of usage categories. Portability / Accuracy Utility Usability Cost Form factor16 OA-M 5 5 3 - 3 OA OA-A 3 4 4 - 5 OA-V 4 4 4 3 4 IA-M 5 5 3 - 3 IA IA-A 3 4 4 - 5 IA-P 3 5 4 - 4 CA-E 4 5 4 3 3 CA CA-A 3 4 4 5 5 2.5 Deliverables The 2021 edition aims at a significant overhaul of the way in which the Challenge results are presented, by creating an interactive Web interface which will enable an interactive user experience, allowing for searches by specific criteria, and side-by-side comparisons of different candidate solutions. The design of this interactive service is still work in progress and cannot at the time of the current revision of the protocol be presented in detail. Such a description will be added in a later revision of the Challenge Protocol. In regards to the presentation of the evaluation results of the DIY platforms, a novel element of the 2021 edition, this will be clearly differentiated from the presentation of the results of standard candidate solutions. The main principles of clarity and accessibility that were at the core of previous Challenge editions deliverables will continue to guide the current design process and an effort will be made for a certain degree of continuity in the employed graphical elements. As such, we advise candidate potential users of the Challenge deliverables to familiarize themselves with the format used in the 2019 Challenge edition, which is presented, for information purposes, in the rest of this section. The results of the Challenge are delivered through a two-page summary for each candidate microsensor solution. The design of this summary is meant to be clear, concise, and accessible to both professionals and the general public. 16 In the case of the OA-V category, the form factor sub-criterion replaces the portability criterion in the criteria weighting. 19/22
AIRLAB Microsensors Challenge 2021 Protocol

 Figure 6: Challenge result summary template with numbered components.

The template of the result summary is presented in Figure 6, with each design element individually
numbered. These elements are, in order, the following:

 1) The name of the microsensor product.
 2) Sentence stating the category in which the candidate performed the best.
 3) Short paragraph presenting the overall review of the microsensor by the Challenge jury.
 4) The overall star score (0 to 5) of the microsensor for the category in which it performed best.
 5) The photo of the microsensor product.
 6) Radar chart showing five criteria scores of the microsensor for each applicable evaluation
 setting out of the total of three (i.e. outdoor, indoor, and mobile). Four out of the five radar
 chart branches represent always the Accuracy, the Ergonomics, the Relevance17, and the Cost
 criteria. The fifth axis is chosen depending on the category for which the microsensor has
 scored the best in relevance, as follows:
 Table 5: Selection of the fifth axis of the radar chart.

 Best relevance
 OA-M or IA-M OA-V OA-A or IA-A IA-P CA-E or CA-A
 score for:
 5th axis Data access Form factor Ease of use Interoperability Portability

 7) Check list marking the pollutants targeted by the microsensor solution.
 8) Check list marking additional environmental parameters measured by the microsensor
 platform.
 9) Detailed graphical representation of the accuracy results (SET method score) breakdown: by
 evaluation settings, by targeted pollutant, and for each of the three provided microsensor
 samples.
 10) Graphical representation of ergonomics criterion result.
 11) Detailed graphical breakdown of the 12 sub-criteria results of the ergonomics criterion.

17
 The Ergonomics and Relevance criteria will no longer be used in the 2021, being replaced by the Utility and
Usability criteria.
 20/22
AIRLAB Microsensors Challenge 2021 Protocol

 12) Graphical representation of the relevance of pollutants criterion for each evaluation setting.
 13) Graphical representation of the portability criterion results together with its three sub-
 criteria (i.e. autonomy, mass, and volume).
 14) Graphical representation of the cost criterion result.
 15) Name and coordinates of the company commercializing the microsensor product.
 16) The logo of the company.

At the end of the Challenge all results summaries are made publicly available on the AIRLAB
website18.

3 Discussion
The AIRLAB Microsensors Challenge represents a periodic evaluation of the state of the art of
commercially available microsensors solutions for air quality monitoring. Its main goal is to create a
large and publicly available information repository for the benefit of all potential users (i.e.
academics, industry, and the general public).

The results of the AIRLAB Microsensors Challenge are published for information purposes only and
do not constitute a guaranty of product performance. In this section we discuss the limitations of the
Challenge and the possible directions for improvement in future editions.

 3.1 Limitations
A correct interpretation of the Challenge results should take into account the inherent limitations of
such an evaluation format. The first limitation derives from the relatively short time in which the
candidate microsensors are available for evaluation. The length of the evaluation period represents a
compromise between the desire for a time period that is as representative as possible for the
evaluation site and the material constraints of the project (e.g., man-hours, instrumentation and
consumables costs, etc.). This reasoning takes also into account the fact that, since candidate
solutions are temporarily lent by the participants, the duration of their use for the Challenge needs
to be kept within reasonable bounds.

A second inherent limitation lies in the choice the location of the Challenge evaluation site which, in
the case of outdoor measurements, plays a decisive role in constraining the dynamic range of the
observable pollutant concentrations. To a certain extent this choice will also influence observable
indoor concentration levels. This limitation implies that the performance scores of microsensor
platforms when evaluated under the specific geographical, urban, and climatic conditions of the
Parisian region, might differ significantly when evaluated at a location with greatly divergent
conditions.

For specific pollutants, like SO2 and CO, the observable concentrations in the Parisian region and the
Lille metropolitan area are very low with a dynamic range that typically stays bounded within the
uncertainty interval of the reference analyzer. Thus, for microsensor devices that target the
monitoring of these pollutants in outdoor environments any meaningful evaluation is technically
impossible.

The principle of simultaneously testing all candidate microsensors is fundamental to the AIRLAB
Microsensors Challenge philosophy. This however requires a large degree of volume flexibility for the
indoor evaluation site thus eliminating the possibility of performing controlled concentration testing,
which are typically performed inside relatively small exposure chambers.

18
 http://www.airlab.solutions/
 21/22
AIRLAB Microsensors Challenge 2021 Protocol

The use of an entire room for the indoor evaluation site implies safety concerns for particularly toxic
pollutants, like CO. Microsensor platforms that target the monitoring of this pollutant indoors are not
currently evaluated for this feature.

 3.2 Outlook
While the intrinsic limitations which are dictated by the Challenge format cannot be completely
eliminated, a number of measures can be envisioned to further improve the representativeness of
the Challenge results. The temporal limitation could be tackled by increasing the evaluation period
and/or considering evaluation intervals that capture seasonal effects.

The geographical representativeness could be improved by multiplying further the types of
evaluation sites. The consideration of monitoring sites with a different typology (e.g., rural,
background) could improve the dynamic range for particular pollutants (e.g., ozone). Moreover,
further collaborations with other regional associations and monitoring bodies would allow for an
increase of representativeness.

4 Bibliography

1. Polidori, A., Feenstra, B., Papapostolou, V., and Zhang, H., 2017. Field Evaluation of Low-cost Air
Quality Sensors. South Coast Air Quality Management District (SCAQMD), Diamond Bar, California,
U.S.A. Accessed: 8 March 2019, [Online]. Available: http://www.aqmd.gov/docs/default-source/aq-
spec/protocols/sensors-field-testing-protocol.pdf?sfvrsn=0

2. Lung, C., Jones, R., Zellweger, C., Karppinen, A., Penza, M., Dye, T., Hüglin, C., Ning, Z., Leigh, R.,
Hagan, D. et al., 2018. Low-Cost Sensors for the Measurement of Atmospheric Composition:
Overview of Topic and Future Applications, World Meteorological Organization (WMO), 2018,
Geneva, Switzerland. Accessed: 8 March 2019, [Online]. Available:
https://www.wmo.int/pages/prog/arep/gaw/documents/Low_cost_sensors_post_review_final.pdf

3. Fishbain, B., Lerner, U., Castell, N., Cole-Hunter, T., Popoola, O., Broday, D.M., Iñiguez, T.M.,
Nieuwenhuijsen, M., Jovasevic-Stojanovic, M., Topalovic, D. and Jones, R.L., 2017. An evaluation tool
kit of air quality micro-sensing units. Science of the Total Environment, 575, pp.639-648.

 22/22
You can also read


