Robustness of best track data and associated cyclone activity over the North Indian Ocean region during and prior to satellite era
←
→
Page content transcription
If your browser does not render page correctly, please read the page content below
J. Earth Syst. Sci. (2020)129 84                                                                                      Ó Indian Academy of Sciences
https://doi.org/10.1007/s12040-020-1344-x   (0123456789().,-volV)(0123456
                                                                       789().,-volV)

Robustness of best track data and associated cyclone
activity over the North Indian Ocean region
during and prior to satellite era

KASTURI SINGH1, JAGABANDHU PANDA1,*                                                    and M MOHAPATRA2
1
  Department of Earth and Atmospheric Sciences, National Institute of Technology Rourkela, Sundargarh,
Odisha 769008, India.
2
  Cyclone Warning Division, India Meteorological Department, Mausam Bhawan, Lodhi Road, New Delhi 110003,
India.
*Corresponding author. e-mail: pandaj@nitrkl.ac.in

MS received 15 February 2018; revised 28 September 2019; accepted 3 December 2019

There are few studies focusing on analysing climatological variation in cyclone activity by utilising the
best track data provided by the India Meteorological Department (IMD) over the North Indian Ocean
(NIO). The result of such studies has been beneBcial in decision-making by government and meteoro-
logical agencies. It is essential to assess the quality and reliability of the currently available version of the
dataset so that its robustness can be established and the current study focuses on this aspect. The analysis
indicates that there is an improvement over the years in the quality and availability of the data related to
cyclones over NIO, especially in terms of frequency of genesis, intensity, landfall etc. The available data
from 1961 onwards has been found robust enough with the advent of satellite technology. However, there
can be still missing information and inaccuracy in determining the location and intensity of cyclones
during the polar satellite era (1961–1973). The study also indicates undercount of severe cyclones during
the pre-satellite era. Considering the relatively smaller size of NIO basin, these errors can be neglected
and thus, the IMD best track data can be considered as reliable enough for analysing cyclone activity in
this region.
Keywords. Tropical cyclones; best track; satellite; North Indian Ocean.

1. Introduction                                                                              activities, including the rise in greenhouse gases
                                                                                             throughout the globe (Holland and Webster 2007).
Studies on tropical cyclone (TC) climatology and                                             Most of these studies used historical best track
associated changes in environmental parameters                                               data from different sources, viz., JTWC (Joint
have been emphasised by several researchers dur-                                             Typhoon Warning Center), IBTrACS (Interna-
ing last two decades (Mann and Emanuel 2006;                                                 tional Best Track Archive for Climate Steward-
Holland and Webster 2007; Mohanty et al. 2012;                                               ship), JMA (Japan Meteorological Agency) and
Deo and Ganer 2014; Sugi et al. 2014). Few of these                                          IMD (India Meteorological Department). Best
studies indicated that the changes in TC activity                                            tracking is the process of post-season analysis for
could be due to the increased anthropogenic                                                  determining the ‘best estimate’ of a TC’s position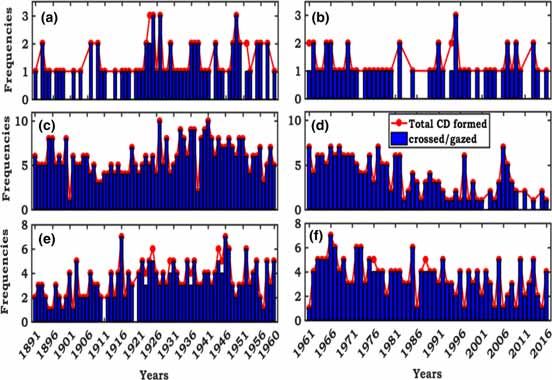
84       Page 2 of 20                                         J. Earth Syst. Sci. (2020)129 84

and intensity during its lifetime (Mohapatra et al.      (iv) Is there any error in the intensity determina-
2012). However, these best track data sets have               tion process in the absence of satellite
their limitations. The annual TC frequency counts             technique?
over the global basins might have potential              (v) Is the annual frequency for depressions,
undercount bias (Landsea 2007; Chang and Guo                 cyclonic storms (CS), severe cyclonic storms
2007; Mann et al. 2007a, b), although the exact              (SCS) provided by the best track data over
magnitude of this bias is controversial. The                 NIO reliable?
undercount in the magnitude of TC frequency is           (vi) Was the determination of proper track of CDs
mainly because of the absence of eDcient mea-                 erroneous?
surement techniques, better observations, aircraft
                                                           Most of the points mentioned are not yet taken
reconnaissance and satellite technology during past
                                                         up by any of the studies over NIO region. Further,
centuries (Kozar et al. 2013).
                                                         the questions mentioned above are also answered
   There are several studies, which analyse the
                                                         by separately analysing the IMD data for CDs
changes in TC activity over North Indian Ocean
                                                         formed over Arabian Sea (AS) and Bay of Bengal
(NIO) region by considering the best track IMD
                                                         (BOB) sub-basins by considering the seasonal
data since 19th century (Singh et al. 2000; Srivas-
                                                         behaviour during pre-monsoon, monsoon and post-
tava et al. 2000; Mandke and Bhide 2003; Sikka           monsoon months distinctly. Therefore, the present
2006; Niyas et al. 2009; Tyagi et al. 2010; Mohanty      study is quite important and is expected to help in
et al. 2012; Mohapatra et al. 2012, 2015; Rajeevan       enhancing the understanding regarding the IMD
et al. 2013; Vissa et al. 2013). Most of these studies   best track data and its reliability.
found that there has been a decrease in the number
of TCs over the basin (Mohaptra et al. 2012, 2015)
although a few mentioned about the increase in           2. Data and methodology
severity (Mohanty et al. 2012). All of these studies
used IMD data for their studies. It is realised that     The present study mainly attempts to assess the
there is a continuous modiBcation in it by incor-        quality and hence reliability of IMD best track
porating information collected from various sour-        data for cyclonic systems (version 2.0/2011 ver-
ces, especially satellite-derived ones. Very few         sion) over NIO region. Most of the previous studies
studies (Mohapatra et al. 2012, 2015) examined the       considered an earlier version (i.e., version 2008a)
reliability of the data set by considering an earlier    for the study of cyclonic activities over NIO basin
version (e-Atlas 2008a version). Since the data set      (Mohapatra et al. 2012, 2015; Mohanty et al. 2012)
has been improving continuously, and the current         by considering the data sets until 2010, unlike the
version of it is 2.0 or version 2011, and none of the    present study where the consideration is until 2016.
studies examined its robustness, it is intended to do    The data is obtained from the cyclone e-Atlas
so in the present work. The current study analyses       archive provided by IMD (http://rmcchen
the quality and reliability of the data used by          naieatlas.tn.nic.in). The frequency of CDs is also
earlier studies so that robustness can be established    obtained from the JTWC archive (http://www.
and the trend provided by these studies can be           metoc.navy.mil/jtwc/jtwc.html?north-indian-ocean)
veriBed to carry out further climatological analysis     to make a comparative study of both the data sets.
under the impact of changing climate scenario. An        The NIO region lies in the range 45°–100°E longi-
attempt is made here to address the following            tude, and the latitudinal extent is from 0° to 30°N.
questions:                                               The east side of the basin is the BOB, and on the
                                                         west, lies AS.
(i) Whether prior to satellite era there was any
     data-sparse region over NIO.                           Following the IMD classiBcation, over NIO
                                                         basin, different types of cyclonic systems are
(ii) How much difference in the percentage of
      cyclonic disturbances (or CDs) striking/com-       (Singh et al. 2016):
      ing across the land is there during and prior to   (i) Depressions (D) having maximum sustained
      satellite era?                                          surface wind speed (MSW) of 17–27 knots
(iii) Is the possibility of missing a cyclonic depres-   (ii) Deep depression (DD) with MSW of 28–33
       sion formed over the basin higher or uncer-             knots,
       tainties in the count is overestimated over       (iii) Cyclonic storm (CS) with MSW of 34–47
       NIO?                                                     knots,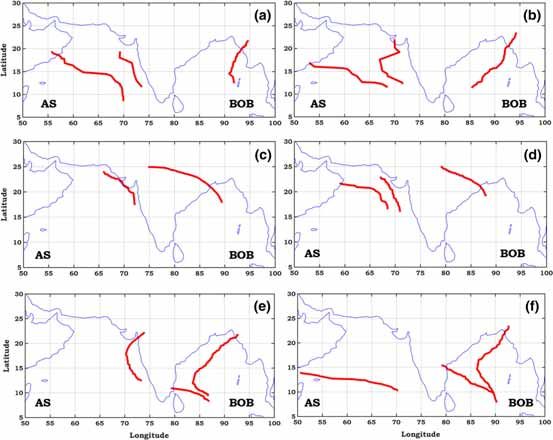
J. Earth Syst. Sci. (2020)129 84                                                       Page 3 of 20 84

(iv) Severe cyclonic storm (SCS) with MSW of              recurving tracks and southward moving)’ and
      48–63 knots,                                        ‘mean tracks’. Analysing these factors would help
(v) Very severe cyclonic storm (VSCS) with MSW            in assessing major differences between two periods
     of 64–89 knots                                       and hence the drawbacks in detection and life cycle
(vi) Extremely Severe Cyclonic Storm (ESCS)               determination during the pre-satellite era. In
      with MSW of 90–119 knots                            addition, Student’s t-test at 95% significance level
(vii) Super cyclonic storm (SuCS) with MSW of             is also performed to validate the difference in
       120 knots or more.                                 results between two periods.
   On the other hand, IMD cyclone e-Atlas pro-
vides data, in three major categories, i.e., for
                                                          3. Discussing the robustness of IMD best
depressions (cyclonic depressions that includes D
                                                             track data
and DD types), CS and SCS (which also includes
VSCS, ESCS and SuCS types). For the current
                                                          Studies assessing the reliability of best track data
study, the term ‘CD’ (hereafter) refers to the con-
                                                          over NIO is limited. The present work would be
sideration of all categories of cyclonic systems, i.e.,   helpful in assessing the trustworthiness of long-
depressions, CS, and SCS formed over NIO. This            term variations in the behaviour of CDs and their
study considers ‘TCs’ (hereafter) as the CDs with         frequency trend over the basin. It is well known
intensity higher than 34 knots (i.e., CS and above).      that NIO region is relatively smaller than PaciBc or
The analysis in this work is performed for whole          Atlantic basin. Landsea (2007) observed that, as
NIO basin by considering all the coastlines, i.e.,        one goes back in time (e.g., before 1960), the
including those of the RIM countries (Bangladesh,         number of people living in coastal regions was less;
Myanmar, Sri Lanka, Pakistan, Oman, Yemen,                the number of shipping lanes and ships was not
and Somalia) as well as India.                            much, and these factors increase the probability of
   Initially, the study focusses on the historical        missing some hurricanes over Atlantic regions. If
background of data capturing capability in the            we look into NIO region case, it is a comparatively
absence of satellite technology over NIO and              smaller basin with marginal population across the
enhancement of coastal observatory network over           coast even back in time (to 19th century). In 1865,
India. Thereafter, assessment of the reliability of       Brst storm warning centre was established in
IMD best track data is done by following Landsea          Kolkata when two severe systems caused massive
(2007). The best track data from IMD is statisti-         destruction among the coastal regions in 1864
cally analysed considering non-parametric Kendal          (www.rsmcnewdelhi.imd.gov.in). It is worth men-
tau test at 95% significance level by computing           tioning that the world’s highest storm tide
correlations, bias and other relevant parameters.         (Bakherganj cyclone near Meghna Estuary, Ban-
Further, trend analysis is also performed to eval-        gladesh) of 45 feet was recorded in 1876 that
uate the robustness of the data. Following Landsea        occurred in BOB region. To reduce the loss caused
(2007), differentiating between the frequency of          by such destructive systems, tracking over NIO
CDs that struck land vs. those remained over the          started during the 19th century.
open ocean analysed considering the long-term                The detection and estimation of cyclone inten-
percentage of CDs. A similar approach is adopted          sity is a critical process. It is not necessary that
for NIO TCs to estimate the error in annual fre-          satellites are always capable of detecting a CD or
quency. The percentages are also computed sepa-           provide a better estimate of its intensity. For
rately for BOB, and AS systems those struck the           example, mesocyclone Ogni (28–30 October 2006)
land out of the total number of systems formed for        was detected by radar and coastal observations,
pre-monsoon, monsoon and post-monsoon seasons             but was missed by satellite (IMD 2011). Therefore,
respectively.                                             the determination of life cycle of CDs and under-
   Additional relevant analyses are carried out to        standing of associated meteorological features need
identify the inherent limitations if any. More            inputs from different sources including satellites
detailed analysis of the data is performed by con-        (e.g., Deb et al. 2011; Panda and Giri 2012; Kish-
sidering ‘decadal change in frequency and genesis         tawal et al. 2012; Panda et al. 2015) and radars
location’, ‘changes in mean life period’, ‘annual         (Osuri et al. 2015). Over NIO, the surface obser-
frequency of depressions, CS and SCS’, ‘annual            vations got an ideal status by 1960 due to expan-
frequency of unusual tracks (viz., looping tracks,        sion in the 1940s and 1950s; radar observations got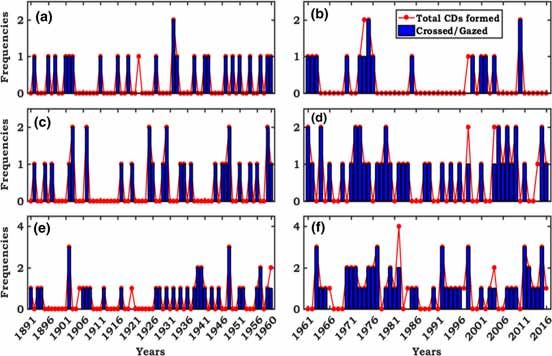
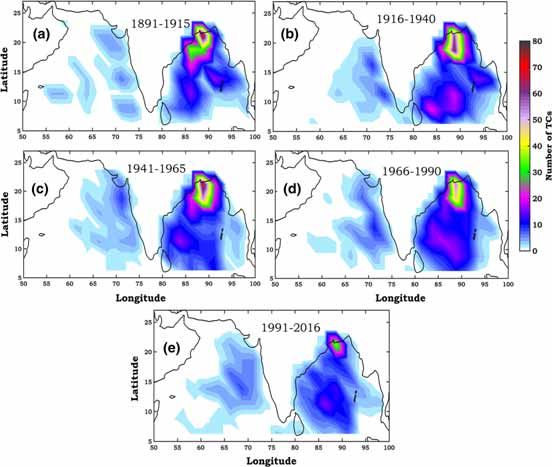
84       Page 4 of 20                                       J. Earth Syst. Sci. (2020)129 84

enhanced by 1973, pilot balloon and radio wind         data related report, there were several short-lived
observations by 1980 (Mohapatra et al. 2012). The      depressions, which do not have tracks, as NIO is
polar satellite input was used since 1961, Dvorak’s    prone to monsoonal depressions. Therefore, in the
technique since 1974, Indian geostationary satellite   current e-Atlas version, these short-lived depres-
since 1983, AWS and buoys observations since           sions without a track have been removed, to reduce
1997 and enhanced AWS network along with               the monsoonal depression counts and for better
microwave imageries since 2008. All of the avail-      determination of the frequency of CDs. During the
able observations including those from satellite,      period of the pre-satellite era, a possibility of
radar, ships, buoys, and coastal and island plat-      missing depressions cannot be denied in addition to
forms are taken into consideration for developing      the error in intensity and location estimation,
the best track data by IMD (IMD 2003).                 especially for CDs formed to the south of 7.5°N
   Further, with the advent of satellite technology    over BOB. The area west of 65°N over AS has no
after 1960, the determination of track and intensity   depression during the pre-satellite era; therefore,
of TCs became more accurate. The use of weather        chances of some missing depressions over the
satellite by IMD has begun since the launching of      region is also expected.
TIROS-I in 1960 (Koteswaram 1961, 1971). Again,           For determining the extent to which the cur-
the use of data provided by geostationary satellites   rently available IMD e-Atlas data is reliable to
such as series of Indian National Satellites           predict the annual frequency of CDs and associated
(INSAT) and Kalpana, delivered more accurate           cyclone activities over NIO, an attempt is made to
location and intensity of CDs over NIO. In addition    assess the differences owing to the presence and
to satellite technology, because of the enhanced       absence of satellite technology and limitations
coastal observatory network over NIO, the inten-       during pre-satellite and satellite era. An eAort is
sity of CDs was better estimated from the year         made to Bnd the trend in location and frequency of
1940s and 1950s (Mohapatra et al. 2014). The best      their genesis, frequency of unusual tracks such as
track data provided in the e-Atlas (IMD) contains      looping, recurving and southward moving tracks,
genesis location, temporal variability in position,    and mean life of CDs during both the periods.
dissipation location and the position at which the     Furthermore, mean tracks of CDs and mean track
systems change the direction of motion etc. The        length are also analysed.
Brst position of a CD recorded during the period
1890–1990 was provided at 8.30 hrs local time and
not the exact time/date of formation (cyclone          3.1 Variation in genesis location
eAtlas-IMD 2011). This may be the probable rea-
son behind fewer genesis locations over a certain      A detailed investigation is carried out in order to
region of BOB and AS.                                  Bnd the data sparse region and perform a com-
   The IMD technical note on cyclone e-Atlas           parative analysis based on genesis location of CDs
version 2.0 (IMD 2011), discusses the advent,          over NIO basin by considering the cyclone e-Atlas
improvements in the process identifying depres-        provided by IMD for the period 1891–2016.
sions, monitoring and warnings and about some of       Figure 1 gives an idea about the variation in gen-
the published annual reports about CDs. The his-       esis locations of CDs, for the years 1891–2016
torical data over AS is available from 1648 onwards    (primarily at an interval of 25 yrs except Bgure 1e).
and for BOB since 1737. It is noteworthy that          Here, the data considered and available is of 2.5°
e-Atlas published by IMD has gone through several      resolution. It is realised that monitoring is done
modiBcations to make the best track data homo-         throughout the basin and recorded for warnings.
geneous and reliable. From 1886, the annual report     Even the e-Atlas of 19th century also covers the
of IMD entitled ‘Reports on the Meteorology of         entire basin for providing CD tracks. The detection
India’ started taking into account depressions, TCs    of the genesis of CDs near the southern part and
and their track over NIO (Mohapatra et al. 2012).      central bay also found to be good (Bgure 1a–d).
The annual report of IMD (1964) provided a             The genesis of cyclonic systems near the west coast
revised and more comprehensive publication of          of AS (50°–55°E) is absent for each interval con-
tracks of all tropical depressions those occurred      sidered. The frequency is higher (*70 cyclonic
over the area bounded by latitudes 5°–35°N and         systems) during 1891–1965 over BOB and has a
longitudes 50°–100°E for the period 1877–1890 and      decreased frequency for 1966–1990 (*55 systems
1891–1960. In the 1979 edition of IMD best track       for the period) and severely decreased during
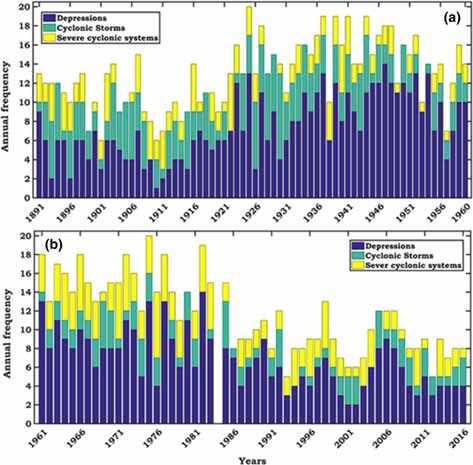
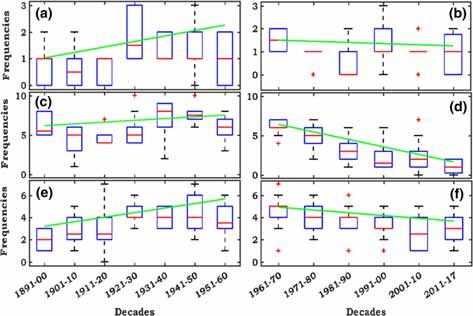
J. Earth Syst. Sci. (2020)129 84                                                                    Page 5 of 20 84

Figure 1. Spatial distribution of genesis location of cyclonic disturbances or CDs (includes deep depressions, depressions,
cyclonic storms, severe cyclonic storms and higher intensity cyclones) over NIO as provided by IMD cyclone e-Atlas (www.
rmcchennaieatlas.tn.nic.in) for Bve different periods i.e., (a) 1891–1915, (b) 1916–1940, (c) 1941–1965, (d) 1966–1990, and (e)
1991–2016. Here, 25-yr composite is considered for (a–d) but for (e), 26 years is taken by including the year 2016.

1991–2016 (*35 cyclonic systems). It indicates a                 different grids (5-degree lat./lon. difference)
decrease in CD genesis over BOB in recent years.                 indicated along the x-axis. During both the periods,
The seasonal analysis also showed similar kind of                the maximum genesis location lies within 85°–90°E
results. During pre-monsoon season (Bgure S1a–e),                and 15°–20°N over BOB. However, the inter-quartile
the genesis frequency of CDs over both BOB (*9)                  range of decadal variation in CD genesis over the
and AS (*5) was higher, which observed to have                   grid is ranging from nearly 37–46 during the pre-
decreased (*5 and *3 respectively) during                        satellite era and approximately 14–34 during
1991–2016. However, an enhanced genesis is                       satellite era over BOB (Bgure 2a, c). The 75th
observed near the coast of Somalia after 1990,                   percentile of decadal genesis frequency decreases
which was absent earlier. During monsoon season,                 from 46 to 36 over that particular location, showing
the frequency over BOB is observed to be drasti-                 a reduction during satellite era. The data over the
cally decreasing (from 70 to *30; Bgure S2a–e).                  grid shows skewness during satellite era and indi-
During post-monsoon season, the genesis was                      cates absence of normal distribution. A consider-
higher (up to *18) over a wider area during                      able number of genesis is also observed over the
1966–1990, but found to be decreasing drastically                region 85°–90°E and 10°–15°N in BOB during
(*8) after 1991 (Bgure S3). The seasonal variation               satellite era. The inter-quartile ranges over other
indicates that the detection of cyclogenesis was                 grids also show a significant increase in values
quite good irrespective of seasons in the past too.              during satellite era and spatial modiBcation in
  The variation in decadal frequency in genesis                  genesis frequency indicates that during the absence
location over BOB and AS during the considered                   of satellite technology, the detection of genesis
periods is illustrated in Bgure 2 by considering                 location of a CD was not correct. Similarly, over
84         Page 6 of 20                                                J. Earth Syst. Sci. (2020)129 84

Figure 2. Decadal variation in genesis location of CDs during pre-satellite era (a, b) and satellite era (c, d) for BOB and AS,
respectively. The left panel is for BOB and the right one is for AS.

AS, there is a relative increase in maximum value                34 and TN coast was seven. During 1916–1940, the
of genesis over the region lying between 65° and                 systems making landfall over AP was 39. If the
75°E during satellite era (Bgure 2d). The inter-                 landfalling systems could be detected, then the
quartile range and 75th percentile also show an                  capability to detect the genesis of a system near the
increase over the AS basin; thereby representing                 coast is not questionable. Moreover, Indian coast
better detection of genesis. No difference is                    had marginal population even during 19th century.
observed in maximum genesis locations during                     Thus, the chance of missing cyclonic systems near
both periods. However, the frequency statistics                  to coast is very less though cannot be zero.
change for other grid locations except the ones
mentioned earlier, over both BOB and AS sub-
basins.                                                          3.2 Annual frequency of cyclonic systems
   Both Bgures 1 and 2 indicate that there is an                     formed
increase in genesis near 80°–85°E/10°–15°N and
80°–85°E/15°–20°N regions, i.e., Tamil Nadu (TN)                 The decadal variation of CD frequency over NIO as
to Andhra Pradesh (AP) coast during the satellite                a whole during pre-satellite and satellite era is
era. Near Gujarat coast, CD genesis is absent                    analysed to Bnd the chances of inclusion or exclu-
during 1916–1940. There is also the absence of                   sion of depressions during the pre-satellite era
genesis near BOB coast during 1891–1915. The                     (Bgure 3). The trend for 75th percentile shows an
maximum genesis location over AS is varying                      increase during the pre-satellite era, whereas,
during one period to another, whereas, over BOB,                 during satellite era, decreasing trend is quite evi-
it is nearer to Bangladesh coast (Bgure 1). Over                 dent. The decades in between 1921 and 1950 show
BOB, the second maximum genesis location is                      the highest value during pre-satellite era whereas
shifting randomly during each period of consider-                decades in between 1960 and 1990 realise maxi-
ation. However, the absence of genesis near to the               mum frequency during satellite era and after 1990,
coasts pointed out here could not be subjected to                started decreasing very sharply (Bgure 3b). The
the lack of observatory techniques. The coastal                  annual average frequencies are 12.9 and 11.39
observatory over Indian coast was considerably                   during pre-satellite and satellite era. The t-test (t-
good even back in time (Mohapatra et al. 2012). It               crit = 1.981, t-stat = 2.481, p-value = 0.014)
is observed that during 1891–1915, the landfall of               indicated that difference between the average fre-
cyclonic systems over Odisha coast was 88, AP is                 quencies during pre-satellite and satellite era is
J. Earth Syst. Sci. (2020)129 84                                                               Page 7 of 20 84

                                                                provides ‘3 min averaging for the sustained wind’
                                                                (http://imd.gov.in/section/nhac/wxfaq.pdf). JTWC
                                                                reports higher maximum sustained surface wind
                                                                speeds compared to that of IMD for the same
                                                                cyclone. The second difference is that JTWC issues
                                                                forecast out to 120 hrs as required by U.S.
                                                                Department of Defence. The third difference is in
                                                                adopting the numbering scheme, i.e., JTWC does
                                                                not apply the same tropical cyclone numbering
                                                                scheme used by the regional centres.
                                                                   The decadal variation in CD frequency over
                                                                BOB shows a decrease in 75th percentile trend for
                                                                pre-monsoon, monsoon and post-monsoon season
                                                                during satellite era (Bgure 4b, d and f). However,
                                                                the decrease is very much significant for the mon-
                                                                soon season, where a sharp fall in frequencies is
                                                                observed. The corresponding trend is increasing
                                                                during pre-satellite era for all the three seasons
                                                                (Bgure 4a, c and e). The annual average frequen-
Figure 3. Variation of decadal frequency of occurrence of CDs   cies are 1.071, 5.871 and 3.4 in pre-monsoon,
over NIO for the period of 1891–2016 and trend of 75th          monsoon and post-monsoon season respectively
percentile during (a) pre-satellite and (b) satellite era.
                                                                during the pre-satellite era. The corresponding
                                                                numbers are 0.982, 3.41 and 3.589 respectively
                                                                during satellite era. The result for t-test (t-crit =
significant at 95% significance level. The annual               1.659, t-stat = 6.583, p = 1.72001E-09) for mon-
frequency of cyclonic systems over NIO is contin-               soon season shows a significant decrease in annual
uing to decrease (Mohapatra et al. 2015) during                 average number of systems formed over BOB. The
recent years. The Kendall coefBcients for pre-                  Kendall coefBcients are 0.189, 0.193, 0.306 and
satellite era and satellite era are 0.390 and –0.425            –0.163, –0.545, –0.330 for the three seasons (pre-
at 95% significance level.                                      monsoon, monsoon and post-monsoon) during pre-
   Further, the annual frequency of systems formed              satellite and satellite era respectively at 95% sig-
over NIO as detected by IMD is compared with                    nificance level. The result of Kendall test repre-
that of JTWC best track data for NIO region. It is              sents an increase during pre-satellite era and a
observed that till 1976, the difference between                 decreasing trend during satellite era.
frequencies of CDs by both the agencies is zero for                Similarly, for AS, the trend for 75th percentile is
most of the years. From 1977 onwards, a huge                    observed to be slightly increasing during pre-
difference in frequencies is observed (JTWC is                  monsoon, monsoon season and is stable for the
providing an undercount frequency for NIO). Sev-                post-monsoon season during pre-satellite era
eral depressions are also found to be missing in                (Bgure S4). The annual average number for sys-
JTWC data set during recent years. The RMSE                     tems formed during pre-satellite era is 0.342, 0.428
(root mean square error) is 0.258 during the pre-               and 0.542 for pre-monsoon, monsoon and post-
satellite era, whereas the corresponding error is               monsoon seasons respectively. During satellite era,
4.856 during satellite era. The RMSE is found to be             the corresponding trend for pre-monsoon is found
4.315 when calculated for the entire period of                  to be decreasing sharply, stable for monsoon season
1891–2016, which is not so large. There are pri-                and increasing for the post-monsoon season
marily three differences between the data sets for              (Bgure S4). The annual average frequencies are
several reasons. The Brst reason could be because               0.321, 0.803 and 1.107 for all the three seasons
of difference in the measurement of maximum                     respectively in satellite era. The student t-test
sustained surface winds. JTWC measures the                      results are significant during satellite era for mon-
maximum sustained surface winds in tropical dis-                soon and post-monsoon season. The Kendall coef-
turbances and cyclones in terms of ‘1-minute mean               Bcients are 0.077, 0.118 and 0.15 for pre-monsoon,
wind speed’ (https://www.usno.navy.mil/JTWC/                    monsoon and post-monsoon seasons during pre-
frequently-asked-questions-1/), whereas IMD                     satellite era. The respective coefBcients are –0.163,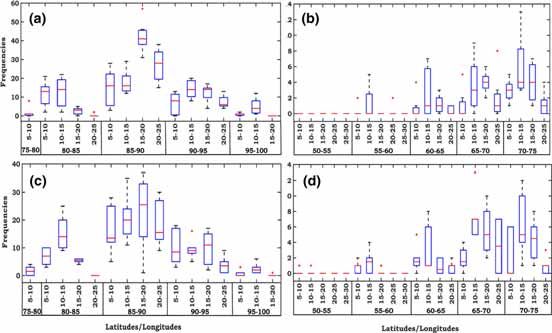
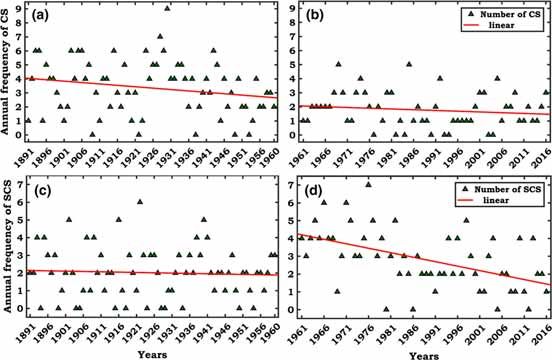
84         Page 8 of 20                                                     J. Earth Syst. Sci. (2020)129 84

Figure 4. Variation of decadal frequency of occurrence of CDs over BOB for the period of 1891–2016 and trend of 75th percentile
during (a, b) Pre-monsoon, (c, d) Monsoon (e, f) Post-monsoon season during pre-satellite era and satellite era, respectively.
The green straight line represents the linear trend for 75th percentile of data. The left side panel is for pre-satellite and right side
panel is for satellite era.

–0.545 and –0.33 during satellite era for all the                    trend of SCS during satellite era is significant with
three seasons.                                                       Kendall coefBcient value = –0.384 and p-value = 0.
   It is evident from Singh et al. (2019b) that the                  0001.
surface level relative humidity has decreased,                          Comparison of annual frequencies of CS during
whereas an increase in surface wind hinders the                      both the periods indicates that there may be a
genesis of CDs for pre-monsoon, monsoon and post-                    wrong estimation of intensity during the pre-
monsoon seasons over both BOB and AS in recent                       satellite era. Therefore, a sudden fall in number of
years. It is worth noting that during the warming                    CS is observed with the implementation of satellite
climate, the surface level RH is an important factor                 technology. Since NIO consists of two sub-basins
for cyclogenesis to avoid dry intrusion into the                     BOB and AS, the frequency of TCs over them need
systems that hinder the growth of cyclones.                          to be analysed separately to make an aDrmative
Therefore, the decrease in frequency CDs is in                       statement in this regard during the considered
synchronisation with the environmental parame-                       seasons concerning pre-satellite and satellite era.
ters. On that account, the role of implementation                       Over BOB, it is observed that during the pre-
of satellite technology is very less on the increasing               monsoon season, the trends are nearly stable both
trend of CDs frequency during pre-satellite and                      for CS and SCS for the pre-satellite era
decreasing trend of CDs frequency during satellite                   (Bgure S5a). However, during satellite era, the
era.                                                                 trend for CS is decreasing rapidly, but a
   The trend for annual frequency variation of CS                    stable trend is seen for SCS (Bgure S5b). During
over NIO shows a decrease during both satellite                      monsoon season, the number of CS is observed to
and pre-satellite era, but it is not so significant in               be quite high with a decreasing trend for pre-
the earlier case (Bgure 5a, b). The decreasing trend                 satellite era (Bgure S5c). However, the number has
for CS during the satellite era is found to be sig-                  decreased during satellite era with a further
nificant (at 95% significance level) when examined                   decreasing trend, and the trend is significant (at
with Kendall’s tau test. The Kendall coefBcient is                   95% significance level). The trend for SCS during
found to be –0.182 (p-value = 0.036). The trend for                  monsoon season is found to be decreasing for both
SCS is found to be nearly stable during the pre-                     pre-satellite and satellite era over BOB (Bgure S5c
satellite era and significantly decreasing during                    and d). During post-monsoon season, the number
satellite era (Bgure 5c–d) over NIO. The decreasing                  of CS is higher than SCS with stable trend for pre-
J. Earth Syst. Sci. (2020)129 84                                                                      Page 9 of 20 84

Figure 5. Annual frequency variation and linear trend of CS (a, b) and SCS (c, d) during pre-satellite and satellite era over NIO
for the period of 1891–2016. The left side panel is for pre-satellite and right side panel is for satellite era.

satellite era (Bgure S5e). However, the number of                 The corresponding values are –0.056, –0.032 and
SCS has increased during satellite era with a sharp               0.023 for all three seasons during satellite era.
decreasing trend (Bgure S5f). Significant Kendall                 The values found through Kendall tau test for CS
coefBcients for SCS are –0.227, –0.274 and –0.359                 and SCS are observed to be of insignificant over
during pre-monsoon, monsoon and post-monsoon                      AS for all seasons in both pre-satellite and
seasons for satellite era, which indicate a decreas-              satellite era.
ing trend. The number of CS has decreased (shows
a stable trend) in the satellite era in post-monsoon              3.3 Formation vs. crossed/grazed cyclonic
season. This analysis indicates possible error in                     systems
intensity determination process during pre-satellite
era. Several deep depressions and SCS were possi-                 The temporal variability of frequency of CDs
bly termed as CS, and thus, their number is quite                 formed over the basin, and those crossed or grazed
high in pre-satellite era, which decreased during                 the coastal areas of NIO is analysed for the period
satellite era.                                                    1891–2016 during peak cyclone seasons, i.e., pre-
   Over AS, the frequency of CS and SCS are very                  monsoon and post-monsoon seasons (Bgures S7, 6,
few in comparison to BOB for all the three con-                   7). The number of CDs crossed or grazed is deter-
sidered seasons during both pre-satellite and                     mined by their center either crossing or passing
satellite era. However, the frequency of SCS has                  within 5° of a coastal region. The correlation
increased during monsoon and the post-monsoon                     coefBcient between the number of CDs formed and
season for satellite era although exhibit nearly                  those struck land is very high (*0.97). The reason
stable trend (Bgure S6d and f). The Kendall coef-                 behind such a significant correlation could be due
Bcients for CS are –0.007, –0.066 and –0.109                      to the smaller coastline compared to other basins
respectively for pre-monsoon, monsoon and post-                   like that of the Atlantic Ocean. It indicates that
monsoon season during the pre-satellite era. The                  most of the cyclonic systems struck (the coasts) out
corresponding coefBcients are –0.007, 0.062 and                   of total CDs formed through the entire period of
0.062 for all three considered seasons during                     data considered. However, few CDs dissipating
satellite era. The Kendall coefBcients for SCS are                over sea might have been missed while preparing
–0.065, –0.049 and 0.068 for pre-monsoon, monsoon                 the best track data during pre-satellite era for some
and post-monsoon seasons during pre-satellite era.                areas where coastal observatories were not
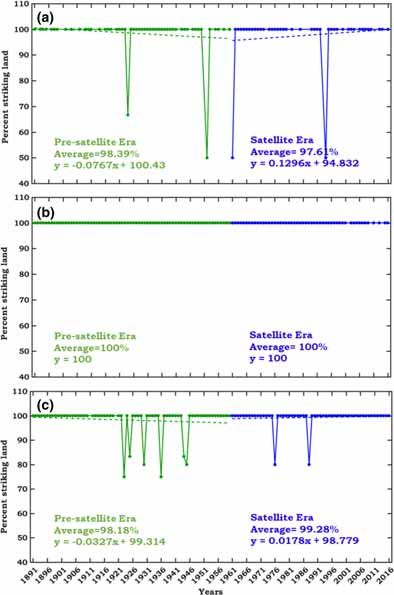
84         Page 10 of 20                                              J. Earth Syst. Sci. (2020)129 84

functional, or sea-based observations were not                  Further, the number of systems those struck the
taken. On the other hand, if such an argument does              coast out of the total number of systems formed
not hold good, then there could be no direct rela-              over AS are also equal for most of the years during
tionship between the total number of CDs formed                 both the considered periods for all three seasons
and those crossing the coast. This is not 100%                  (Bgure 7). The correlation coefBcients during pre-
correct if the considerations of Landsea (2007) and             satellite era are 0.972, 1 and 0.882 for pre-monsoon,
size of NIO basin is taken into account.                        monsoon and post-monsoon season. The corre-
   For better understanding, the impact of intro-               sponding correlation coefBcients for satellite era
duction of satellite technology for monitoring the              are 0.945, 0.824 and 0.864. The higher correlations
activities of NIO CDs, pre-satellite (1891–1960)                indicate that most of the formed systems either
and satellite (1961–2016) era are separately con-               crossed or grazed the coast of AS. As the size of the
sidered. It is observed that the number of CDs,                 BOB basin is comparatively small, most of the
those struck land and total number formed (in-                  systems developed over it do not get chance to
cluding short-lived systems) are nearly equal for               dissipate over the ocean; whereas, few systems over
most of the years, irrespective of whether it is pre-           AS are observed to dissipate over the sea although
satellite or satellite era for the whole NIO region. It         the numbers are not very high.
is realised that very less number of systems stayed               Further analysis of the data set is also carried
over ocean in both the periods considered here.                 out by considering the annual percentage of CDs
When similar study is carried out for BOB basin,                those crossed or grazed the coastal areas out of the
the number of systems formed and those crossed or               total number of the systems formed during pre-
grazed the coast are equal for most of the years for            satellite and satellite era (Bgure 8) over NIO. It is
pre-monsoon, monsoon and post-monsoon seasons                   observed that during both pre-satellite as well as
both during pre-satellite and satellite era                     the satellite era, the landfall percentage is 100% for
(Bgure 6). The correlation coefBcients for the                  most of the years (102 out of 126 years) as far as
number of systems crossed or grazed concerning                  annual frequency is concerned. The slope values of
the total number of systems formed is *0.9 for all              the trend line during pre-satellite era is nearly
three considered seasons during both epochs.                    –0.023 and that during satellite era is *0.027. The

Figure 6. Total number of CDs formed over BOB vs. total number of systems crossed or grazed the coastal regions for pre-
monsoon (a, b), monsoon (c, d) and post-monsoon season (e, f) during pre-satellite era and satellite era, respectively for the
period 1891–2016.
J. Earth Syst. Sci. (2020)129 84                                                                  Page 11 of 20 84

Figure 7. Total number of CDs formed over AS vs. total number of systems crossed or grazed the coastal regions for pre-
monsoon (a, b), monsoon (c, d) and post-monsoon season (e, f) during pre-satellite era and satellite era, respectively for the
period 1891–2016.

Figure 8. Annual percentage of CDs that crossed or grazed the coastal areas of NIO vs. the total number of systems formed over
ocean for the period 1891–2016. Here, the cyclonic disturbances formed during monsoon seasons are excluded.

average percentage of the number of CDs struck                  until 1920 probably indicates missing of some
the land during pre-satellite era is 96.61%, whereas            depressions those dissipated over the basin and
during the satellite era it is 96.52%. This analysis            were unable to gaze the coastal land. If it is pre-
indicates that there is hardly any issue with the               sumed that some stayed over ocean and missed by
detection of genesis and landfalling during pre-                IMD during pre-satellite era, 0.046 number of CDs
satellite and satellite era. However, one interesting           per year could be added to the annual frequency for
aspect may be noticed in Bgure 8 that the fre-                  pre-satellite years, assuming an average number of
quency of dissipation over the sea is relatively                0.232 systems per year stayed over ocean during
higher during the period 1961–1998 in satellite era             this period as compared to that of satellite era. In
compared with the period 1920–1960 during the                   spite of the adjusted/corrected value, the trend for
pre-satellite era. The absence of dissipated systems            frequency of CDs for the period would remain
84         Page 12 of 20                                              J. Earth Syst. Sci. (2020)129 84

unchanged due to insignificant variation (Bgure not             seasons during both epochs over BOB. Over AS,
shown). The trends also remain unaffected irre-                 the percentage of systems striking the land during
spective of inclusion or exclusion of short-lived               the pre-satellite era is 100% for most of the years
depressions (life period of *24 hrs) during peak                (Bgure S8) in all three seasons. However, the per-
cyclone seasons.                                                centage is found to be low for some recent years
   The percentage of CDs those crossed or grazed                during monsoon and post-monsoon seasons of the
the coast out of the total number of systems formed             satellite era. The percentages during satellite era
over BOB is also 100% for most of the years during              are 95.65, 100 and 91.66% for pre-monsoon, mon-
all the three seasons pre-monsoon, monsoon and                  soon and post-monsoon seasons respectively. The
post-monsoon in both epochs (Bgure 9). The cor-                 corresponding percentages are 90, 94.11 and
responding annual average percentages for pre-                  87.17% during satellite era. The trend for per-
monsoon season are 98.39 and 97.6%, for monsoon                 centages is observed to be slightly decreasing for
season it is 100% each and for post-monsoon season              pre-monsoon and monsoon seasons, but a nearly
are 98.18 and 99.28% respectively for both epochs.              stable trend observed in post-monsoon season
The trends are also nearly stable for all three                 during satellite era.

Figure 9. Annual percentage of CDs that crossed or grazed the coastal areas of BOB vs. the total number of systems formed over
ocean during (a) pre-monsoon, (b) monsoon, and (c) post-monsoon for the period 1891–2016 for pre-satellite and satellite era.
The dotted green and blue straight lines represent the linear trend for pre-satellite and satellite era respectively.
J. Earth Syst. Sci. (2020)129 84                                                                 Page 13 of 20 84

   Under the impact of the warming climate, the                range 1–2, CS with CI no. ranging between 2.5 and 3
rate of dissipation of CDs has increased over AS,              and SCS with CI no.[3. Number of CS during pre-
since the climatological integrated wind circulation           satellite era is very high compared to the SCS,
within 65°–70°E inhibits the landfalling (Singh                whereas the frequency of CS is lower than SCS for
et al. 2019a). Therefore, high annual percentage of            many years during satellite era. The frequency of CDs
system striking the coast during pre-satellite is due          is quite high between the years 1923 and 1985. Until
to the climatological factor rather than the chance            1960, the SCS frequency is lower than CS, but after
of missing dissipated systems over ocean. When the             1961, the SCS frequency shows a rise. The depressions
percentages and its trends are analysed separately             formed during pre-satellite era is 57.36%, and during
for BOB and AS, it can be observed that the                    satellite era it is 58.62% out of the total number of
chance of missing systems over both the basins is              systems formed. The percentage decrease for CS
very less and the trend would not vary much with               category from pre-satellite to satellite era is from
the addition of few missing systems, if there is any.          26.79% to 16.45% and for SCS, the percentage
                                                               increases from 15.83% to 24.92%. The possible reason
                                                               behind this variability could be the erroneous process
3.4 Intensity variation
                                                               of determination of T or CI nos. for higher intensity
Another attempt is made to analyse the difference in           storms, though the annual frequency is less Cawed
frequency of occurrence of different categories of             during pre-satellite era.
tropical storms by considering the maximum CI
(Cyclone Intensity) no. attained by CDs in both the            3.5 Mean life period
pre-satellite and satellite era (Bgure 10). Prior to
satellite era, the CDs were classiBed into three cate-         The annual mean life period for most of the CDs
gories only, i.e., depressions having a CI no. in the          during the pre-satellite era is observed to be

Figure 10. Annual frequency of CDs by considering their CI numbers of the systems formed during the period (a) pre-satellite
and (b) satellite era over NIO.
84 Page 14 of 20 J. Earth Syst. Sci. (2020)129 84
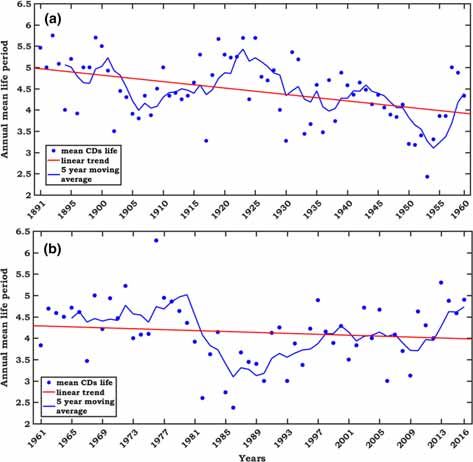
between 3 and 6 days (an exception is found during decreasing since 1891 (instead of a sudden decrease
1953, where mean life is *2.5 days) and the trend in life period during satellite era). The overesti-
is decreasing during that period (Bgure 11a). mation of life period during the pre-satellite era is
However, the annual mean life is observed to be not accountable as the exact time of genesis was
ranging between 2.4 and 5.3 days during satellite not known, which indicates the exact life could be
era, and the trend is nearly stable (Bgure 11b). more than what is mentioned in best track data.
Thus, during pre-satellite era, the CDs had com- Comparatively shorter life period during satellite
paratively longer life span than the satellite period era may be because of a greater number of rapidly
or post 1960. Similar inference can also be drawn intensifying and decaying CDs.
from table 1, where life span of different categories
of storms during both eras and results for student’s
3.6 Frequency of unusual tracks
t-test illustrated. The mean life for depressions
during pre-satellite era is 3.964 days, whereas Figure 12 depicts the frequency of looping tracks,
during satellite era it is 3.255 days. Similarly, for recurving tracks and southward moving CDs over
CS, the corresponding values are 4.667 and 3.668 NIO during the pre-satellite era and satellite era.
days respectively and for SCS, the respective mean Prior to the satellite era, the detection of looping
life periods are 4.842 and 4.092 days. Considering cyclone is completely absent, whereas, during
all the categories of cyclonic storms together, the satellite era, the frequency is quite high. The
corresponding mean life periods are found to be southward moving CD frequency is relatively low
4.431 and 4.147 days. A reduction in life period of during pre-satellite era. It is observed that prior to
CS and SCS is evident from table 1, indicating 1981, there are several years, where recurving CD
shorter life span during satellite compared to that frequency is 3–4 annually and post 1981, the years
of the pre-satellite era. The life span is gradually with such frequency is absent, though the
Figure 11. Variation of annual mean life period of CDs during (a) pre-satellite and (b) satellite era over NIO for the period of
1891–2016. Here, 5-yr moving average and linear trend is considered for both pre-satellite and satellite era.J. Earth Syst. Sci. (2020)129 84 Page 15 of 20 84
Table 1. The annual mean life period of cyclonic depressions, cyclonic storms (CS) and severe
cyclonic storms (SCS) and all CDs as a whole (including depressions, CS and SCS) for pre-satellite
era (PSE) and satellite era (SE).
Category Alpha Mean life (PSE) Mean life (SE) t-stat df p-value
Depression 0.05 3.964 3.255 4.768 122.520 5.1757E 06
CS 0.05 4.667 3.668 4.795 108.003 5.2386E 06
SCS 0.05 4.842 4.092 3.075 82.807 0.003
CDs 0.05 4.431 4.147 2.102 113.063 0.038
Figure 12. Annual frequency of unusual tracks including those of looping, recurving and southward moving CDs over NIO
during the (a) pre-satellite and (b) satellite era.
maximum value is up to 2. Thus, it appears that that can give an idea about the reliability of the
the detection of recurving CDs is considerably good best track data. The climatological mean tracks of
irrespective of periods considered. However, in CDs are shown in Bgure 13. During the pre-satel-
between the genesis and landfall, the proper path of lite era, most frequent CD genesis region was
travel of CDs was not well detected during pre- 85°–90°E/15°–20°N and the cyclonic systems
satellite era as evident from this analysis. travelled to make landfall near Odisha and West
Bengal coast. The mean track length found to be
882.39 km in this period. Interestingly, during
3.7 Mean tracks and mean-track length
satellite era, two different mean prevailing tracks
Another important aspect is the comparison were observed (Bgure 13b). The Brst track (located
between the mean tracks of CDs and mean track in the northern part of BOB) originates from
length during pre-satellite and satellite periods 85°–90°E/15°–20°N region and travels towards84 Page 16 of 20 J. Earth Syst. Sci. (2020)129 84
Figure 13. Mean track of CDs over BOB and AS during pre-satellite (a, c) and satellite (b, d) era.
West Bengal and Bangladesh coast to make land- The tracks for BOB and AS basins are also
fall near Bangladesh with mean track length 1195 analysed separately for pre-monsoon, monsoon and
km. The second one (southern part of BOB) orig- post-monsoon seasons to see the possible changes
inates from 85°–90°E /10°–15°N region and travels in accordance to the two epochs considered. For
towards Andhra Pradesh and Tamil Nadu coast pre-monsoon season, the mean track over BOB
with a mean track length of 1287 km. CDs can (Bgure 14a) starts from 90°–95°E/10°–15°N region
always originate from different regions and travel and travels towards Myanmar during the pre-
different paths. Nonetheless, having a sense of the satellite era. However, the route of mean track has
climatological mean pattern can give a better idea changed to 85°–90°E /10°–15°N region and CDs
of limitation of data acquisition over the region. are mostly travelling towards Myanmar with
The prevailing mean tracks indicate possible increased track length during satellite era
missing of few short-lived systems over central (Bgure 14b). The track lengths are 1265.5 and
BOB during pre-satellite era. 1829.5 km, respectively during pre-satellite and
The climatological track for AS does not show satellite era. During monsoon season, the tracks of
much variation except the length of the track CDs over BOB generate from 85°–90°E/15°–20°N
(Bgure 13c and d). During the pre-satellite era, and travel towards West Bengal, Odisha during
most of the cyclones over AS formed near 10°N pre-satellite era (Bgure 14c), and the track length
latitude and 70°–75°E longitudes and travelled is 1958.9 km. During satellite era, similar track is
along the coast to make landfall near Gujrat and followed by CDs with an exception to the distance
Pakistan region. The mean track length is of travel (Bgure 14d), i.e., with track length 1313.8
observed to be nearly 1751 km in this period. km. For post-monsoon season, again similar types
Interestingly, the mean climatological track of tracks are observed to be followed by CDs for
during satellite era starts from the location near both the epochs except the region of genesis and
to 14°N (though remains within the longitudinal landfalling. There are two most travelled routes of
extent 70°–75°E), travels along the coast and CDs in pre-satellite era over BOB, i.e., one is
makes landfall near Gujrat. The mean track travelling towards Andhra Pradesh and Tamil
length during satellite era thus reduces to 1152 Nadu border starting from 85°–90°E /5°–10°N with
km, having a difference of nearly 599 km com- track length 959.87 km and the other one from
pared to that of the track during pre-satellite era. same latitude/longitude region towards Myanmar
As the systems formed over AS are concentrated with a recurved path (Bgure 14e) and mean track
near to the coast, chances of missing systems are length 2171.1 km. During satellite era, one track
very less. starts from *90°E/5°–10°N region travels towardsJ. Earth Syst. Sci. (2020)129 84 Page 17 of 20 84 Figure 14. Mean track of CDs during pre-monsoon (a, b), monsoon (c, d) and post-monsoon (e, f) during pre-satellite and satellite era, respectively over BOB and AS. Andhra Pradesh with mean tack length 1477.3 km and travels along the Gujarat coast during while another travels towards Myanmar by gener- pre-satellite era (Bgure 14c) with mean track length ating from the same area with mean track length 1176.3 km. Unlike pre-satellite era of monsoon 2251.9 km (Bgure 14f). season, two tracks are observed over AS during Over AS, different types of CD tracks are satellite era (Bgure 14d). One of the tracks origi- observed for different seasons of pre-satellite and nates from 70°–75°E/15°–20°N travelling along the satellite era. During pre-monsoon season, two coast of Gujarat (track length 993.5 km) and the mean tracks are observed during the pre-satellite other track (track length 1364.6 km) originates era (Bgure 14a). One track with mean track length over 65°–70°E/15°–20°N region and moves towards 1091km generates from 70°–75°E/10°–15°N travels Oman during satellite era. During post-monsoon, along the western coast of India but do not make two completely different tracks are observed in the landfall, while another one with track length 2290.7 two epochs. During pre-satellite era, the mean km, generates from *70°E/5°–10°N and travels track starts from 70°–75°E /10°–15°N and then westward to landfall at Yemen coasts. Similarly, recurves to cross Gujarat coast by travelling during satellite era, two travelling tracks are *1413.4 km. During satellite era, the mean track observed for pre-monsoon season too but with dif- (length 2269.3 km) starts from *70°E/10°–15°N ferent genesis and landfalling locations and track region and travels towards Somalia. lengths (Bgure 14b). The track that was earlier The season-wise variability in mean track char- travelling along the western Indian coast, observed acteristic features for both BOB and AS (Bgure 14) to recurve towards Gujarat (increased track length is found to be quite distinct as when compared with to 1694.2 km) and the other one still travels the overall mean track (Bgure 13). The overall towards Yemen (decreased track length to 1941.9 mean track over BOB in the pre-satellite era km) but it is now generated from 65°–70°E/ (Bgure 13a) is found to be similar to that of the 10°–15°N region. For monsoon season, there is only monsoon season in terms of the direction of travel one track, which starts from 70°–75°E/15°–20°N (Bgure 14c). For AS, the overall mean track
84       Page 18 of 20                                         J. Earth Syst. Sci. (2020)129 84

(Bgure 13c) shows similar characteristics as those        100% during pre-satellite era, whereas the
of monsoon and post-monsoon seasons (Bgure 14c,           percentages decreased during satellite era (ranging
e). In satellite era, the overall track characteristics   between 87 and 94%) for all the three considered
over BOB (Bgure 13b) appear to be similar to those        seasons. The reason behind the decrease in per-
of pre-monsoon (one track similar) and post-mon-          centage of systems striking the land is not related
soon seasons (Bgure 14b, f). In case of AS, the           to the implementation of satellite technology.
overall mean track during satellite era (Bgure 13d)       Instead, because of the well-organised wind circu-
appears to have similar characteristics with one of       lation persisting over AS, the scenario encourages
the tracks (that travels along the Indian coast) of       dissipation of systems in recent years (Singh et al.
pre-monsoon and monsoon seasons (Bgure 14b, d).           2019a).
                                                             While analysing the decadal variation in genesis
                                                          location, significant spatial variability is observed
4. Concluding remarks                                     over several regions of BOB and AS. However,
                                                          change in the annual frequency is found to be
The average difference in location estimated              insignificant over NIO and the decrease in annual
through satellite-based observations of IMD and           frequency in recent years may not be related to the
the best track is nearly 55km in deep ocean (Goyal        availability of satellite inputs. It is mostly due to
et al. 2013). The average error in intensity esti-        decrease in surface-level relative humidity along
mation during pre-satellite era was almost one            with increase in surface wind for pre-monsoon,
stage in Beaufort scale. According to Mishra and          monsoon and post-monsoon season (Singh et al.
Raj (1975), the maximum sustained wind is                 2019b). The comparison of annual frequency from
underestimated by 8–17 kts in depression phase,           IMD and JTWC gives an RMSE value of 0.258 and
26–28 kts in cyclonic storm phase and 37 kts in case      4.856 during pre-satellite and satellite era. The
of severe ones. Although the characteristics fea-         difference between both the data is associated with
tures of CDs is erroneous, the error in annual fre-       the intensity estimation process adopted by JTWC
quency is not appreciable over NIO. Considering           and therefore, several depressions are missing from
the size of the AS and BOB basin, coastal popu-           its archive during recent years. The annual mean
lations, the CD detection procedure described in          life period of CDs shows a decrease after 1940,
technical notes of IMD (IMD 2011), it could be            which may be because of the better detection and
concluded that the missed cyclones during the 20th        determination of life span of CDs after the aug-
century are not substantial.                              mentation of enhanced coastal observatory sys-
   The correlation between the number of CDs              tems. The current study also suggests chances of
formed and those struck the land is notably high          wrong interpretation of CD intensity for storms of
(*0.97) due to the smaller size of the basin as           higher category during pre-satellite era. With the
compared to other world basins and maximum                implementation of satellite technology, a signifi-
number of landfalls over NIO region. Even the             cant change is observed in frequency of different
corresponding correlation values are very high            types of CDs.
(*0.9) when analysed separately for pre-monsoon,             With the implementation of satellite technology,
monsoon and post-monsoon seasons over BOB and             the development in procedure for detection of
AS during both epochs. The trend for percentage of        proper path or track of CDs both over BOB and AS
landfall is also not showing much variation with          is also observed during satellite era. Analysis of the
lower slope values of –0.022 and 0.027 during pre-        mean tracks of both the periods over BOB indi-
satellite and satellite era respectively over NIO.        cates few missing short-lived systems over central
The trends over BOB and AS for pre-monsoon,               part during pre-satellite era. It may also be due to
monsoon and post-monsoon seasons are nearly               the lack of recognition of proper genesis location
stable during both epochs. The average percent-           and track of CDs. The mean track over AS shows
ages of CDs striking the coastal areas of NIO dur-        systems dissipating near Somalia during satellite
ing the considered periods are 96.61% and 96.52%          era for post-monsoon season indicating chances of
respectively. The average percentage of CDs hit-          erroneous track determination during pre-satellite
ting the coast of BOB ranges between 97 and 100%          era. The frequency of looping track, recurving and
when analysed for all the three seasons considered        southward moving CDs increased when the satel-
separately during pre-satellite and satellite era.        lite data is incorporated for preparing best track
The percentages over AS ranges between 91 and             data. Distinct differences among season-wise mean
J. Earth Syst. Sci. (2020)129 84 Page 19 of 20 84
tracks over BOB and AS in both epochs also Applications Centre, Indian Space Research
indicate erroneous track determination in pre- Organisation with Grant Number SAC/EPSA/
satellite era to some extent. However, incorpora- 4.19/2016. The authors would also like to thank
tion of satellite data may not be the only reason for the anonymous reviewers for their valuable sug-
such behaviour. The changing climate may partly gestions and comments, which helped to improve
be responsible for this too. the paper further.
The present analysis suggests that though the
genesis location, tracks of CDs and their intensity
are erroneous, indicative landfall point is consid- References
erably good. The error in CDs’ annual frequency
records is supposed to be insignificant in IMD best Chang E K M and Guo Y 2007 Is the number of North Atlantic
track data. Moreover, there have been several tropical cyclones 482 significantly underestimated prior to
modiBcations (peer-reviewed adjustments) in dif- the availability of satellite observations?; Geophys. Res.
ferent phases of NIO CDs best track publications Lett. 34 L14801, https://doi.org/10.1029/2007gl030169.
by IMD (Mohapatra et al. 2012). Further, several Deb S K, Kumar P, Pal P K and Joshi P C 2011 Assimilation
of INSAT data in the simulation of the recent tropical
studies (Mandke and Bhide 2003; Mohanty et al.
Cyclone Aila; Int. J. Remote Sens. 32(18) 5135–5155.
2012; Sugi et al. 2014; Deo and Ganer 2014; Deo A A and Ganer D W 2014 Tropical cyclone activity over
Mohapatra et al. 2015; Singh et al. 2016, 2019a, b) the Indian Ocean in the warmer climate; In: Monitoring and
in recent past also used the dataset to analyse and Prediction of Tropical Cyclones in the Indian Ocean and
review the cyclonic activities over NIO region. Climate Change (eds) Mohanty U C, Mohapatra M, Singh
Thus, it could be inferred that the frequency pro- O P, Bandyopadhyay B K and Rathore L S, Co-published
by Springer and Capital Publishers, New Delhi, India,
vided by IMD e-Atlas gives a reasonable under- pp. 72–80.
standing of the trend of CDs over NIO even during Goyal S, Mohapatra M and Sharma A K 2013 Comparison of
the pre-satellite era and thus, establishes the best track parameters of RSMC, New Delhi with satellite
robustness of it. It may be noted that there is a estimates over north Indian Ocean; Mausam 64 25–34.
considerable data gap between satellite and pre- Holland G J and Webster P J 2007 Heightened tropical
cyclone activity in the North Atlantic: Natural variability
satellite era in other world ocean basins (Landsea
or climate trend?; Phil. Trans. Roy. Soc. A: Math. Phys.
2007). Compared to the other ocean basins of the Eng. Sci. 365 (1860) 2695–2716.
world, being relatively smaller and having less CD IMD 1964 Tracks of storms and depressions. IMD, New Delhi.
frequency gap between satellite and pre-satellite IMD 2003 Cyclone manual. IMD, New Delhi.
era also indicates the IMD best track data to be IMD 2011 Cyclone eAtlas: Tracks of cyclones and depressions
reasonable for use. over North Indian Ocean (from 1891 onwards), Electronic
version 2.0/2011; Cyclone Warning & Research Centre,
Based on the present study and available rele- IMD, Chennai, India.
vant literature, the IMD best track data can be Kishtawal C M, Jaiswal N, Singh R and Niyogi D 2012
considered reliable enough for understanding Tropical cyclone intensiBcation trends during satellite era
cyclonic activities over the NIO basin on a clima- (1986–2010); Geophys. Res. Lett. 39(10) L10810-
tological scale. Nonetheless, CD monitoring capa- 1–L10810-6. https://doi.org/10.1029/2012GL051700
Koteswaram P 1961 Cloud pattern in a tropical cyclone in the
bilities and predictability over NIO basin in the
Arabian Sea, viewed by TIROS I meteorological satellite;
present century has increased further because of Sci. Rep., 2, Prepared for Geo. Phy. Res, Dir. AFCL,
accuracy in intensity measurement, size and num- Hawai Inst. Geophys. Rep 18, pp. 34.
ber count due to the adopted advanced technolo- Koteswaram P 1971 A decade of satellite meteorology in India;
gies. The technological platforms include high- Ind. J. Met. Geophys. 22 273–278.
resolution weather satellites, installed Doppler Kozar M E, Mann M E, Emanuel K A and Evans J L 2013
Long-term variations of North Atlantic tropical cyclone
weather radar systems at coastal areas and large activity downscaled from a coupled model simulation of the
AWS installations. last millennium; J. Geophys. Res. Atmos. 118(24).
13383–13392. https://doi.org/10.1002/2013JD020380
Landsea C 2007 Counting Atlantic tropical cyclones back to
Acknowledgements 1900; Eos. Trans. AGU 88 (18) 197–202.
Mandke S and Bhide U V 2003 A study of decreasing storm
The authors would like to thank the India Meteo- frequency over Bay of Bengal; J. Indian Geophys. Union
7(2) 53–58.
rological Department (www.imd.gov.in) for pro- Mann M E and Emanuel K A 2006 Atlantic hurricane trends
viding the TC best track data. This work is partly linked to climate change; EOS. Trans. AGU 87 (24)
supported by the project funded by Space 233–241.You can also read


