Utilizing MapReduce to Improve Probe-Car Track Data Mining - MDPI
←
→
Page content transcription
If your browser does not render page correctly, please read the page content below

International Journal of
           Geo-Information

Article
Utilizing MapReduce to Improve Probe-Car Track
Data Mining
Li Zheng 1 ID , Meng Sun 1 , Yuejun Luo 2,3, *, Xiangbo Song 3 , Chaowei Yang 4      ID
                                                                                          , Fei Hu 4 and
Manzhu Yu 4
 1    School of Geodesy and Geomatics, Wuhan University, Wuhan 430072, China; lzheng@sgg.whu.edu.cn (L.Z.);
      mengsun_2016@163.com (M.S.)
 2    School of Resource and Environmental Sciences, Wuhan University, Wuhan 430072, China
 3    Wuhan Kotei Infomatics Co., Ltd., Wuhan 430072, China; xiangbos@kotei-info.com
 4    Department of Geography and GeoInformation Sciences, College of Science, George Mason University,
      Fairfax, VA 22030, USA; cyang3@gmu.edu (C.Y.); fhu@masonlive.gmu.edu (F.H.); myu7@gmu.edu (M.Y.)
 *    Correspondence: yuejunl@kotei-info.com; Tel.: +86-27-8785-5598

 Received: 29 May 2018; Accepted: 19 July 2018; Published: 23 July 2018

 Abstract: With the rapidly increasing popularization of the automobile, challenges and greater
 demands have come to the fore, including traffic congestion, energy crises, traffic safety,
 and environmental pollution. To address these challenges and demands, enhanced data support
 and advanced data collection methods are crucial and highly in need. A probe-car serves as
 an important and effective way to obtain real-time urban road traffic status in the international
 Intelligent Transportation System (ITS), and probe-car technology provides the corresponding
 solution through advanced navigation data, offering more possibilities to address the above problems.
 In addition, massive spatial data-mining technologies associated with probe-car tracking data have
 emerged. This paper discusses the major problems of spatial data-mining technologies for probe-car
 tracking data, such as true path restoration and the close correlation of spatial data. To address the
 road-matching issue in massive probe-car tracking data caused by the strong correlation combining
 road topology with map matching, this paper presents a MapReduce-based technology in the second
 spatial data model. The experimental results demonstrate that by implementing the proposed
 spatial data-mining system on distributed parallel computing, the computational performance was
 effectively improved by five times and the hardware requirements were significantly reduced.

 Keywords: Probe-car track; spatial data-mining; big data; MapReduce

1. Introduction
     With the rapid development of urbanization and the economy, the automobile has become
essential in everyday life. For example, China’s national motor vehicle ownership reached 310 million
as of the end of 2017, which includes 217 million cars [1]. As a consequence, various problems
have emerged, including traffic congestion, energy crises, traffic safety, and environmental pollution.
The increasing traffic demands and tightened automotive emission standards urge infrastructure
operators and the automotive industry to act. Faced with these problems, urgent demands have been
set on green driving, safe driving, congestion relief, and so on. To meet these demands, more advanced
navigational data are needed, including dynamic traffic status information, passage cost information,
road accident information, and road fuel consumption information. Probe-cars provide an opportunity
to obtain these data by participating in the traffic flow and determining self-experienced traffic
conditions, and transmitting these to a traffic center.

ISPRS Int. J. Geo-Inf. 2018, 7, 287; doi:10.3390/ijgi7070287                      www.mdpi.com/journal/ijgi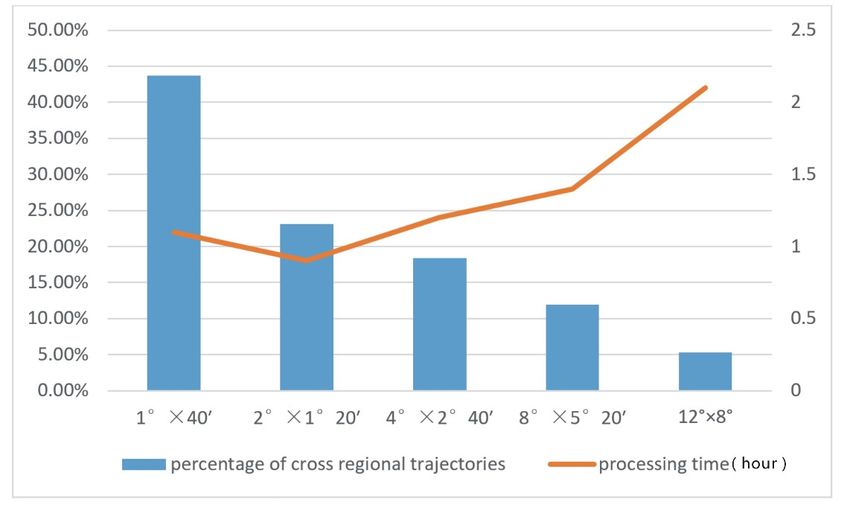
ISPRS Int. J. Geo-Inf. 2018, 7, 287 2 of 17
ISPRS Int. J. Geo-Inf. 2018, 7, x FOR PEER REVIEW 2 of 17
The
The probe-car,
probe-car,knownknown as as
thethe
Global
GlobalPositioning System
Positioning (GPS)(GPS)
System rover, is an important
rover, and effective
is an important and
way
effective way to obtain urban road traffic status in the international Intelligent Transportation(ITS)
to obtain urban road traffic status in the international Intelligent Transportation System [2].
System
It is an
(ITS) advanced
[2]. road traffic
It is an advanced road information collectioncollection
traffic information technology in the field
technology of international
in the ITS [3].
field of international
By mounting a GPS device on a vehicle, the vehicle’s position information,
ITS [3]. By mounting a GPS device on a vehicle, the vehicle’s position information, behavioral behavioral information,
and event information
information, and eventareinformation
transferred are to a transferred
data center in to real
a datatimecenter
or offline. By combining
in real time or offline.massiveBy
probe-car
combining tracks and behavioral
massive probe-car data tracksobtained from the data
and behavioral datacenter with from
obtained the existing
the datamap data, with
center a variety
the
of advanced
existing mapnavigation data can
data, a variety be mined navigation
of advanced to address certain
data can problems,
be mined including
to address thecertain
discovery of new
problems,
roads,
includingthe the
actual cost of road
discovery of new traffic,
roads,thethepeak periods
actual cost of
of roads, and accident-prone
road traffic, the peak periods areas. Probe-car
of roads, and
data can range throughout the region and be collected 24/7. This technology
accident-prone areas. Probe-car data can range throughout the region and be collected 24/7. This greatly improves the
efficiency of information collection by wireless real-time transmission
technology greatly improves the efficiency of information collection by wireless real-time and center-through processing.
Meanwhile,
transmissionit lowers the cost of maintenance
and center-through processing. of acquisition
Meanwhile,equipment
it lowers by thethecost
installation of GPS and
of maintenance of
other communication network resources [4].
acquisition equipment by the installation of GPS and other communication network resources [4].
A
A probe-car
probe-carsystemsystemconsists
consists of aofwireless communication
a wireless communication network that includes
network GPS andGPS
that includes wireless
and
communication
wireless communication capabilities and an information
capabilities processing
and an information center. Probe-car
processing data (PCD)
center. Probe-car data systems
(PCD)
are composed
systems of three parts:
are composed of three the parts:
data acquisition system of the
the data acquisition probe-car,
system of thethe traffic information
probe-car, the traffic
processing
informationsystem, and the
processing real-time
system, and thetraffic information
real-time traffic distribution
information system. The probe-car
distribution system. The is driven
probe-
on city roads and uploads the collected real-time raw data to the probe-car
car is driven on city roads and uploads the collected real-time raw data to the probe-car data data acquisition system.
The traffic information
acquisition system. The processing system is responsible
traffic information processingfor the raw
system is data preprocessing,
responsible for thecoordinate
raw data
conversion,
preprocessing, geographic
coordinate information
conversion, system (GIS) electronic
geographic map matching,
information system (GIS) as wellelectronic
as travel time
map
calculation. The information distribution system releases the traffic information
matching, as well as travel time calculation. The information distribution system releases the traffic by the processing
system to provide
information by the theprocessing
public withsystemreal-time to road
providetraffic
thereference
public with information
real-time by road
General Packet
traffic Radio
reference
Service
information(GPRS), the Internet,
by General Packet and other
Radio means.
Service The architecture
(GPRS), the Internet,ofand a probe-car
other means.dataThesystem is shown
architecture of
in Figure 1.
a probe-car data system is shown in Figure 1.
Real-time traffic
Probe-car Data
information
Intelligent traffic Path-
Map matching Calculate and
information system estimation
processing estimate travel time
processing center processing
Road network data structure
Road GIS data Vehicle route data
Figure 1. Technical architecture
architecture of
of aa probe-car
probe-car system.
system.
As an
As an important
important component
component of of ITS,
ITS, the
the urban
urban traffic
traffic dynamic
dynamic route
route guidance
guidance system
system obtains
obtains
vehicle locations
vehicle locations underunder real-time
real-time road
road traffic
traffic conditions
conditions and and provides
provides thethe best
best route
route guidance
guidance
information. It helps direct travelers in order to improve traffic conditions, reduce
information. It helps direct travelers in order to improve traffic conditions, reduce traffic congestion, traffic congestion,
and achieve
and achieve aa reasonable
reasonable distribution
distribution of of traffic
traffic flow
flow on on the
the roads.
roads. ITS
ITS experts
experts and
and enterprises
enterprises have
have
conducted theoretical
conducted theoretical research
research and and developed
developedapplications
applicationsbased basedon onvehicle
vehiclelocations.
locations.Countries
Countriesin
Europe have developed various new technologies and made intelligent
in Europe have developed various new technologies and made intelligent road transport systems road transport systems
availableininvarious
available various cities.
cities. TheThe ADVANCE
ADVANCE real-time
real-time traffictraffic releasing
releasing systemsystem for probe-cars
for probe-cars was
was initiated
by the State of Illinois with the US Federal Highway Administration as its partner [5]. The purposeThe
initiated by the State of Illinois with the US Federal Highway Administration as its partner [5]. of
purpose
this systemofisthis system is
to determine to determine
whether whether
drivers need drivers
real-time need real-time
information informationintoorder
to avoid congestion, avoid
to
congestion, in order to increase capacity. The UK traffic master offers a series of
increase capacity. The UK traffic master offers a series of traffic information services, where the datatraffic information
services,
are mainlywhere
providedthe data
fromare mainly
fixed provided
sensors from fixed sensors
and supplemented by PCDand supplemented by PCD [6].
[6].
To the authors’ knowledge, research on large-scale PCD processes is still in the preliminary
stages. The existing research mainly focuses on cost, probe-car size, system architecture, and
ISPRS Int. J. Geo-Inf. 2018, 7, 287                                                                3 of 17

     To the authors’ knowledge, research on large-scale PCD processes is still in the preliminary stages.
The existing research mainly focuses on cost, probe-car size, system architecture, and precision [7,8].
With the development of PCD technology and the popularity of GPS devices, the amount of data will
grow dramatically. Due to the specific mobility of probe-car data and the limitation of the size of the
cars, real-time probe-car data is unable to cover all of the road network. It is essential to address the
missing data issues in the road network analysis and improve the application’s efficiency.
     We describe the basic principles and key issues of mining probe-car data in Section 2. Section 3
describes a MapReduce approach to accelerate the map-matching of massive probe-car tracking data.
Section 4 demonstrates the experimental results of the MapReduce approach. Section 5 concludes the
research and introduces future work.

2. Literature Review and Key Issues of Mining Probe-Car Data

2.1. Literature Review
      Probe-car technology research can be traced back decades. Considering the complex construction
of intelligent transportation systems, the relevant agencies have internationally conducted a great
amount of research and application, as shown in Table 1. For example, the UK’s probe-car data
system was developed to collect and analyze traffic information and was invested in by ITIS Holdings
Plc, a typical successful probe-car system [6]. The data sources include both real-time and historical
information from the Automobile Association Traffic Control Centre (AATCC). The probe-car data
system uses the GPS/wireless data transmission mode. After the acquired data are processed,
the system predicts the traveling time for users in real time and continues to update the information.
Another example is the American ADVANCE system, which was an experimental project of dynamic
road induction in an Illinois suburban area conducted by the Federal Highway Administration (FHA),
Illinois Transportation Authority (ITA), Motorola, Transportation Research Institute at Illinois State
University, and other agencies in 1991. Its goal was to determine whether traffic guidance information
is helpful to avoid traffic congestion and improve driving quality [6]. The Vehicle Information and
Communication System (VICS) in Japan is one of the successful applications in the field of intelligent
transportation. VICS acquires traffic data via GPS navigation devices and releases accurate traffic
guidance information and real-time traffic information to travelers by FM radio and wireless data
transmission [9]. The Korea Road Traffic Information Center(KORTIC) system of Korea, developed by
the Korean Road Safety Association (KRSA), combines toroidal coil, GPS probe-car, and Closed-Circuit
Television(CCTV) surveillance equipment for traffic information collection. Then it extracts traffic
information after data fusion, analysis, and processing, and determines the traffic status to reduce
the estimated error probability for obtaining road travel time to 10% or less [10]. In 2001, the German
Space Center Transportation Institute (GSCTI) integrated probe-cars with 300 floating taxis to collect
and analyze their location, speed, and other information in Berlin [11]. Jan Fabian Ehmke predicted
time-dependent travel time and assessed the resulting road information using data-mining methods
through different levels of aggregation for the large amount of probe-car data [12]. With its acquisition
of Waze in 2013, Google added a human element to its traffic calculations. Drivers can use the Waze
app to report traffic incidents including accidents, disabled vehicles, slowdowns, and even speed
traps [13].
ISPRS Int. J. Geo-Inf. 2018, 7, 287                                                                                            4 of 17

      Table 1. Research and applications of intelligent transport systems. AATCC, Automobile Association
      Traffic Control Centre; FHA, Federal Highway Administration; ITA, Illinois Transportation Authority;
      GPS, Global Positioning System; VICS, Vehicle Information and Communication System.

             System                   Country                Developer                  Main Characteristics/Data Source
                                                                                        From AATCC and real-time and
         Probe-car data                 UK               ITIS Holdings Plc
                                                                                        historical data
                                                                                        Avoid traffic congestion, improve
       ADVANCE system                  USA         FHA, ITA, and other agencies
                                                                                        driving quality
              VICS                     Japan                     \                      From GPS navigation devices
                                                                                        From the toroidal coil, GPS
            KORTIC                     Korea      Korean Road Safety Association
                                                                                        probe-cars, and so on
     Probe-car Data System            Germany   Space Center Transportation Institute   From floating taxis
                                                                                        A human element is added to its
          Google Maps                  USA                    Google                    traffic calculations, report traffic
                                                                                        incidents from drivers

     Probe-car technology research in China started relatively late, but the progress is rapid. Various
research institutes and scholars have made great achievements in theory and practice. Based on GPS
navigation and the positioning of vehicles, Li [14] used velocity and time information to obtain the
average speed, traffic, travel time, and other traffic information through a mathematical model to
achieve real-time road detection. With the urban road network data acquired by probe-cars equipped
with GPS devices, Dong [15] analyzed the road network level and obtained the travel conditions and
functioning of the road network at different levels. Zhang [16] used pattern recognition, statistical
forecasting, time series, and intelligent algorithms through traffic parameters of probe-car data
acquisition to detect traffic incidents. Xin [17] analyzed the space and time distribution characteristics
of urban road networks based on probe-car data, adopting the coverage and intensity in a certain
coverage as indicators. Xin pointed out that the coverage and intensity of probe-car data have similar
peak hours on weekdays. The higher the level of the road, the higher the coverage and intensity of
probe-car data. Li [18] presented a mathematical model of probe-car coverage in a single section and
the whole road network on the basis of the minimum requirements for probe-car samples in a single
section and verified it by simulation. This model considered various factors such as computing interval,
average traffic flow density, average travel speed, mistake matching scores of probe-cars, and so on.
The simulated results showed that the coverage rate calculated by this model can ensure a 93.7%
link of the road network through collecting data. Zhang [19] described the composition of probe-car
systems and the optimization theory for probe-car sampling. By considering velocity and analyzing
the random signal and the spectrum of the Fourier transform, the optimal sampling frequency is
determined by the Shannon sampling theory. The results showed that the more optimal the sampling
frequency obtained, the higher the data accuracy, which is suitable for practical applications. Weng [20]
categorized probe-car data into three stages, historical data applications, historical traffic state data
applications, and dynamic traffic state data applications, on the basis of summarizing the research of
probe-car traffic information applications. He analyzed the urban transport operating characteristics
of probe-car data in Beijing, such as the distribution characteristics of road traffic and the utilization of
different levels of road mileage. Feng [21] proposed a probe-car map-matching algorithm based on the
search for local paths by analyzing the characteristics of the collection of raw data. Making use of GPS
points matched previously, it greatly reduces the search space to achieve better positional accuracy of
probe-car data, so as to determine the vehicle track.
     As the probe-car tracking data is massive, the above traditional data-processing methods cannot
meet the current data-processing needs. This paper proposes a parallel algorithm combined with cloud
computing technology to process the data.
ISPRS Int. J. Geo-Inf. 2018, 7, 287 5 of 17
2.2. Probe-Car Collection Interval
The timeliness and reliability of traffic status identification can be largely impacted by the
configuration of essential parameters based on the data collection of GPS probe-cars, including the
data-sampling interval and the sampling ratio. The collection interval refers to the time interval of
uploading the collected data of the probe-car to the information processing center; in other words,
the time period of the probe-car data collection. Generally speaking, the higher the frequency of data
collection, the more accurate the real-time road traffic information.
However, if the acquisition time interval is too short, it will not only increase the cost of acquisition,
but also result in higher data redundancy, and the road traffic conditions will be very similar. On the
contrary, if the time interval is too long, it will miss important data, which would lead to not reflecting
the dynamic traffic conditions precisely. Therefore, it is very important to set an appropriate collection
interval for probe-car data.
Yamane conducted research on urban probe-cars in Osaka, Japan [22], and found that different
data-collection intervals would result in different road map matching results. Researchers also found
that the longer the time interval of probe-car data acquisition, the worse the accuracy of the reflection
of real-time road traffic conditions, in spite of the relatively low cost of the acquisition. If the probe-car
collection interval is short, the reflected effect of real-time road traffic conditions is better. Though
the time cost of the acquisition will be relatively higher, the effect of GIS map-matching is better.
From different tests, we found that when the probe-car collection interval is 30 s, we can achieve the
best balance among the acquisition cost, the reflection accuracy of real-time traffic conditions, and the
results of matching. Therefore, the optimal sampling interval of the probe-car is 30 s in this research.
2.3. The Key Issues in Probe-Car Data Mining
Probe-car track data consists of sampling points with a series of latitude and longitude information
and other vehicle behavior information. The characteristics of probe-car data are as follows [23,24]:
(1) Position information (latitude and longitude).
(2) Position information with noise, and the noise is affected by a variety of factors (GPS noise,
clouds, the status of buildings nearby, indoor and outdoor conditions, and so forth).
(3) Loss of spatial information: the sampling interval of probe-car tracks is usually long (tens of
seconds or minutes), which will result in the loss of shape information.
(4) Spatial information redundancy caused by intensive sampling and low speed.
(5) The temporal correlation between some series of track points.
(6) Additional property information: incidental event information, driving behavior information,
sensor parameters while sampling points.
For the above features of probe-car data tracks, the first five characteristics are the inherent basic
properties of time and space, which will be fully considered during the data matching. The last
characteristic is the additional information provided by the probe-car, which may vary greatly
(not available for all vehicles) according to the vehicle’s own situation, but it can be used to mine more
behavioral factors.
In the spatial data mining of probe-car tracks, there are several key issues for the above data
features [25,26]:
(1) The close correlation of spatial data. Since the electronic map of the road network topology has
a close correlation, it often needs to load all of the road network data into memory to handle
all the tracks. Since the road network data is massive, it demands high performance for the
hardware. Moreover, it results in low performance for searching the matching data in the entire
road network to process each specific track, which is a fatal flaw for the massive spatial data
mining of the probe-car track.ISPRS Int. J. Geo-Inf. 2018, 7, 287 6 of 17
(2) True path restoration for the probe-car track. It is crucial to combine the electronic map to restore
the true path of probe-car tracks as accurately as possible. Since the sampling interval is sparse,
the distance between two adjacent track points might be far. Due to data noise, the position of
each track point may greatly deviate from the position of the real road, so large errors result from
the conventional method, which matches the best roads according to each track point location on
an electronic map. As shown in Figure 2a, if it is a partial match, a part marked I in the whole
track will be matched to road 1. However, the whole track should be matched to road 2, as shown
in Figure 2b. Therefore, combining the spatial characteristics of the entire track optimally and
globally restores the path, while the local single track point cannot be matched to the best road.
ISPRS Int. J. Geo-Inf. 2018, 7, x FOR PEER REVIEW 6 of 17
(a) (b)
Figure
Figure 2.
2. (a)
(a) Global
Global Positioning
Positioning System
System (GPS)
(GPS) track; (b) track
track; (b) track point
point matching.
matching.
To obtain city-wide real-time traffic information, large-scale data in are collected in real time and
To obtain city-wide real-time traffic information, large-scale data in are collected in real time and
analyzed to ensure the timely release of traffic information. Using a general process to deal with these
analyzed to ensure the timely release of traffic information. Using a general process to deal with these
data, PCD will encounter great bottlenecks, thus the real-time data cannot be obtained, and there is
data, PCD will encounter great bottlenecks, thus the real-time data cannot be obtained, and there is
no way to use a more sophisticated processing algorithm to improve the accuracy of the processing
no way to use a more sophisticated processing algorithm to improve the accuracy of the processing
results. MapReduce adopts a distributed parallel computing model and makes it easy to implement
results. MapReduce adopts a distributed parallel computing model and makes it easy to implement
parallel computing, load balancing, and other excellent properties [27–30], thus it is very suitable for
parallel computing, load balancing, and other excellent properties [27–30], thus it is very suitable for
big data mining. However, due to the close spatial correlation characteristic of the probe-car track
big data mining. However, due to the close spatial correlation characteristic of the probe-car track data,
data, the entire road network of the electronic map data needs to be read for each computing node to
the entire road network of the electronic map data needs to be read for each computing node to handle
handle the massive track, which increases the hardware requirements for each computing node and
the massive track, which increases the hardware requirements for each computing node and impairs
impairs computing performance.
computing performance.
To address the above-mentioned problems of spatial data mining on probe-car tracks, massive
To address the above-mentioned problems of spatial data mining on probe-car tracks, massive
probe-car track data and map data need to be loaded. By combining road topology with map
probe-car track data and map data need to be loaded. By combining road topology with map matching,
matching, strong correlations can be made between track and map data. When matching and
strong correlations can be made between track and map data. When matching and analyzing the data,
analyzing the data, the data are not locally matched, but globally matched, so as to avoid the case of
the data are not locally matched, but globally matched, so as to avoid the case of Figure 2. For high
Figure 2. For high data throughput and limited computing performance, we propose a parallel
data throughput and limited computing performance, we propose a parallel processing algorithm to
processing algorithm to reduce the probe-car tracks, namely, two-step MapReduce technology in the
reduce the probe-car tracks, namely, two-step MapReduce technology in the spatial data model.
spatial data model.
3. Methodology
3. Methodology
Two types of data were processed by different MapReduce algorithms to enable parallel
Two types of data were processed by different MapReduce algorithms to enable parallel
computing of spatial data. A two-step MapReduce was conducted: (1) for space partitioning to
computing of spatial data. A two-step MapReduce was conducted: (1) for space partitioning to
analyze the relatively independent data, that is, the full tracks in one spatial division range that can be
analyze the relatively independent data, that is, the full tracks in one spatial division range that can
matched with the real road net, which is global matching; (2) for the cross-regional track processing to
be matched with the real road net, which is global matching; (2) for the cross-regional track
match with the road network of the electronic map in the designated cross-region.
processing to match with the road network of the electronic map in the designated cross-region.
3.1. MapReduce Parallel Distributed Computing Model
Dean and Ghemawat proposed a MapReduce distributed computing model for the analysis of
web log files [27]. The Hadoop project implemented this computational model, which used a cluster
consisting of thousands of computers to analyze the massive server files. The MapReduce model is
realized mainly through two functions: mapping (Map) and reduction (Reduce). The main processISPRS Int. J. Geo-Inf. 2018, 7, 287 7 of 17
3.1. MapReduce Parallel Distributed Computing Model
Dean and Ghemawat proposed a MapReduce distributed computing model for the analysis of
web log files [27]. The Hadoop project implemented this computational model, which used a cluster
consisting of thousands of computers to analyze the massive server files. The MapReduce model is
realized mainly through two functions: mapping (Map) and reduction (Reduce). The main process [31]
is shown
ISPRS in Figure
Int. J. Geo-Inf. 2018,3.7, x FOR PEER REVIEW 7 of 17
User
Program
(1)fork (1)fork
(1)fork
Master
(2)assign
(2)assign
map
map
Split0 worker (6)write
Output
Split1 (4)local (5)remote worker File 0
(3)read write read
Split2 worker
Output
Split3 worker
File 1
Split4 worker
Input Map Intermediate files Reduce Output
files phase (on local disks) phase files
Figure
Figure3.3.Main
Mainprocesses
processesofofMapReduce.
MapReduce.
Google’s MapReduce programming model serves to process large datasets in a massively
Google’s MapReduce programming model serves to process large datasets in a massively parallel
parallel manner (subject to a MapReduce implementation). The programming model is based on the
manner (subject to a MapReduce implementation). The programming model is based on the following
following simple concepts: (i) iteration over the input; (ii) computation of key/value pairs from each
simple concepts: (i) iteration over the input; (ii) computation of key/value pairs from each piece
piece of input; (iii) grouping of all intermediate values by key; (iv) iteration over the resulting groups;
of input; (iii) grouping of all intermediate values by key; (iv) iteration over the resulting groups;
and (v) reduction of each group.
and (v) reduction of each group.
The model is stunningly simple and effectively supports parallelism. The programmer may
The model is stunningly simple and effectively supports parallelism. The programmer may
abstract from the issues of distributed and parallel programming, because MapReduce
abstract from the issues of distributed and parallel programming, because MapReduce implementation
implementation takes care of load balancing, network performance, fault tolerance, and so forth. The
takes care of load balancing, network performance, fault tolerance, and so forth. The seminal
seminal MapReduce paper [28,32,33] described one possible implementation model based on large
MapReduce paper [28,32,33] described one possible implementation model based on large networked
networked clusters of commodity machines with local storage. The programming model may appear
clusters of commodity machines with local storage. The programming model may appear restrictive,
restrictive, but it provides a good fit for many problems encountered in the practice of processing
but it provides a good fit for many problems encountered in the practice of processing large datasets.
large datasets. Additionally, expressiveness limitations may be alleviated by decomposing problems
Additionally, expressiveness limitations may be alleviated by decomposing problems into multiple
into multiple MapReduce computations or by escaping to other (less restrictive, but more
MapReduce computations or by escaping to other (less restrictive, but more demanding) programming
demanding) programming models for subproblems.
models for subproblems.
3.2. MapReduce Method for Data Mining in Probe-Car Tracks
3.2. MapReduce Method for Data Mining in Probe-Car Tracks
The size division is based on the distribution and density of the trajectory. After dividing the
The size division is based on the distribution and density of the trajectory. After dividing the total
total area into the target areas as described above, a nested MapReduce approach can be used to
area into the target areas as described above, a nested MapReduce approach can be used to achieve
achieve spatial data mining for the probe-car tracks. The implementation is described as follows:
spatial data mining for the probe-car tracks. The implementation is described as follows:
(1) Level-1 Map function design
(1) Level-1 Map function design
The Level-1 Map function is mainly responsible for dealing with the track in a small designated
The Level-1 Map function is mainly responsible for dealing with the track in a small designated
area of the probe-car, and the algorithm flow is shown in Figure 4.
area of the probe-car, and the algorithm flow is shown in Figure 4.
The pseudocode is as follows:
Enter the range A1 to be processed;
A2 = A1 + 0.1 ° // Extend the range A1 as A2
M = LoadData (A2); // Load the map data of the range A2 into memory
Enter the track collection D
While(D != NULL)
{
P = Read(D); // Read one track in M in orderISPRS Int. J. Geo-Inf. 2018, 7, 287 8 of 17
The pseudocode is as follows:
Enter the range A1 to be processed;
A2 = A1 + 0.1 ◦ // Extend the range A1 as A2
M = LoadData (A2); // Load the map data of the range A2 into memory
Enter the track collection D
While(D != NULL)
{
P = Read(D); // Read one track in M in order
if (P ∈ A1) // Track P belongs to the range A1
{
Match track P with the electronic map M;
If (matched)
{
log(P and M match relations);
}
else
{
log (non-matched trajectory P);
}
}
else if (Part of P belongs to A1) / / Track P is cross-regional
{
log(Track P, the latitude, and the longitude of track P);
}
D = D – P;
}
The algorithm is explained as follows:
Step 1: A small area is to be assigned and processed, such as the example of the spatial
division range (8◦ × 5◦ 200 ), extended to a range (for example, 0.1◦ ) on the basis of a small area
range. The algorithm will read the road network data in the electronic map of the extended region
into memory.
Step 2: The algorithm will sequentially read all the probe-car tracks and determine whether the
probe-car track is in the scope of the small area being processed currently.
Step 3: If the tracks of the probe-car are entirely in the small area, then it will match the track data
with the road network data and record the matching relationship and a portion of the nonmatching to
the road network in the electronic map.
Step 4: If the track of the probe-car is partly in the small area or out of the small area to be
processed, it will record the track and range of latitude and longitude.
Step 5: If the tracks of the probe-car are entirely outside the small area to be processed, then it will
do nothing.ISPRS Int. J. Geo-Inf. 2018, 7, 287 9 of 17
ISPRS Int. J. Geo-Inf. 2018, 7, x FOR PEER REVIEW 9 of 17
Figure
Figure 4. Workflow
4. Workflow forfor
thethe first
first mapmap algorithm.
algorithm.
(2) Level-1 Reduce function design
(2) Level-1 Reduce function design
The Level-1 Reduce function is responsible for writing the results processed for the probe-car
The Level-1 Reduce function is responsible for writing the results processed for the probe-car
tracks within the designated area to the master server. The algorithm is as follows:
tracks within the designated area to the master server. The algorithm is as follows:
Step 1: Write the correspondence relation for matching the local probe-car track and the
Step 1: Write the correspondence relation for matching the local probe-car track and the electronic
electronic road map to the master server.
road map to the master server.
Step 2: Write the local records that the probe-car track does not match with the road in the
Step 2: Write the local records that the probe-car track does not match with the road in the
electronic map into the master server.
electronic map into the master server.
(3) Level-2 Map function design
The Level-2 Map function is mainly responsible for processing the existence of probe-car tracks
across the region of the designated small area currently. The algorithm is shown in Figure 5.ISPRS Int. J. Geo-Inf. 2018, 7, 287 10 of 17
(3) Level-2 Map function design
The Level-2 Map function is mainly responsible for processing the existence of probe-car tracks
across theJ.region
ISPRS Int. Geo-Inf. of the7, designated
2018, small area currently. The algorithm is shown in Figure 5.
x FOR PEER REVIEW 10 of 17
Figure5.5.Second
Figure Secondmap
mapalgorithm
algorithmflow.
flow.
The pseudocode is as follows:
The pseudocode is as follows:
Enter the range A1 to be processed;
Enter the range A1 to be processed;
Enter the set D of the cross-regional tracks to be processed
Enter the set D of the cross-regional tracks to be processed
Read the latitude and longitude range A2 in D;
Read the latitude and longitude range A2 in D;
A3 = A1 + A2;
A3 = A1 + A2;
M = LoadData(A3); // Load the map data of A3 into memory
M = LoadData(A3); // Load the map data of A3 into memory
While(D != NULL)
While(D != NULL)
{
{
P = Read(D); // Read one of the cross-region tracks in M in order
Match track P with the electronic map M;
If(matched)
{
log(P and M match relations);
}ISPRS Int. J. Geo-Inf. 2018, 7, 287 11 of 17
P = Read(D); // Read one of the cross-region tracks in M in order
Match track P with the electronic map M;
If(matched)
{
log(P and M match relations);
}
else
{
log (non-matched trajectory P);
}
D = D – P;
}
while (log != NULL)
{
l = Read(log); // read a log in the log, matched relationship or non-matched track P
if (l not in ControlServe)
{
l in the ControlServe;
}
log = log − l;
}
The algorithm is explained as follows:
Step 1: According to the latitude and longitude range A2 across the whole region for probe-car
tracks, extended on the current designated area A1, the algorithm will read them into the memory for
all the road network data A3(A3 = A1 + A2) in the electronic map of the extended region.
Step 2: Sequentially read all the probe-car tracks across the region.
Step 3: Match the track data with the road network data, then record the matching relation and
nonmatching relation to the road network of the electronic map to the machine.
(4) Level-2 Reduce function design
The Level-2 Reduce function is mainly responsible for writing the matching relation and
nonmatching relation to the road network of the electronic map in the designated cross-area to
process into the master server and remove the duplicate part. The algorithm is explained as follows:
Step 1: Read the results of the probe-car track in the cross-region.
Step 2: Check whether the processing results of the probe-car track are on the master server.
Step 3: If the results of the track handling do not exist in the master server, write the results to the
master server. Otherwise, handle the next track.
4. Experimental Results and Discussion
4.1. Experiment Scenarios
In the experiment, the test environment is the Hadoop platform. The computer is configured with
the following specifications: CPU Core Duo 2.7 GHz, memory 8 GB DDR3, Windows operating system;
one is the master node server, the other three are the computing node servers. First, all the nodes on the
master node are directly calculated for the execution time. Second, the dataset is divided into N × M
intervals by the method described. The two-time MapReduce algorithm is used to compute the nodes
in different operations. It is obtained through the experiment that the use of this algorithm can improve
the operation time of each node in the computing process and cannot lose effective association rules.ISPRS Int. J. Geo-Inf. 2018, 7, 287 12 of 17
The PCD parallel processing system consists of the collection server software, data preprocessor
program, server-side program, node calculation program, database storage, and other components.
The PCD acquisition server receives real-time transmissions of a large number of PCDs, establishes
a database, and saves all the original PCD collected by the system. The collection server has
a high-speed connection to the master server and is convenient for data to be transported to the
processing center quickly.
The preprocessing program includes two parts. First, the map data are preprocessed, generating
map grid information. This part belongs to the offline calculations, which are only done once. Second,
each of the real-time PCD records obtained is pretreated, which removes some obviously wrong invalid
records caused by equipment failure.
The server program runs on the master server KD50, which is responsible for the PCD tasks of
decomposition, scheduling, and consolidating the results. The node program on each computing node
will allocate computing resources in accordance with the instructions on the server side of the program.
In addition, the server program needs to initialize the system and load the configuration file, map file,
and historic mining information, initiate the shutdown node, and so on. The node program distributes
each computing unit over KD50, which is used to complete the map-matching data-processing tasks
distributed by the master server. KD50 has many computing units. After task scheduling by the master
server, there will be multiple node programs running processing tasks for the computing units. Thus,
it can achieve basic PCD parallel processing.
4.2. Results
Based on the methods described in the paper, the experimental verification is conducted based on
the probe-car tracks during one month in Japan. The experimental data are the long-distance freight
data shown in Table 2. Table 3 shows the PCD sample data format. The probe-car tracks are composed
of the PCD data in Table 3, and are shown on the map in Figure 6.
Table 2. Source data.
Number of Probe-Car Tracks Number of Vehicles Number of Roads in the Electronic Map Total Road Length (km)
2,056,489 51,973 12,538,343 21,453,863
Table 3. Probe-car sample data format.
RecordID GpsDateTime GpsLatitude GpsLongitude GpsAzimuth GpsSpeed
204451900001 2017/8/31 4:24 38.45707628 141.2965907 49◦ 39.6 km/h
204451900002 2017/8/31 4:25 38.45992784 141.3001752 45◦ 37.8 km/h
204451900003 2017/8/31 4:33 38.46099555 141.3012858 347◦ 9.9 km/h
204451900004 2017/8/31 4:34 38.4589209 141.2973367 164◦ 45 km/h
204451900005 2017/8/31 4:35 38.46034831 141.2877371 166◦ 57.6 km/h
204451900006 2017/8/31 4:36 38.46274794 141.2803071 155◦ 10 km/h
204451900007 2017/8/31 4:37 38.46221842 141.2794217 255◦ 36 km/h
204451900008 2017/8/31 4:38 38.45871636 141.279031 276◦ 44.1 km/h
204451900009 2017/8/31 4:39 38.45225857 141.2803076 276◦ 4.5 km/h
204451900010 2017/8/31 4:40 38.44693848 141.2823128 272◦ 42.3 km/h04451900007 2017/8/31 4:37 38.46221842 141.2794217 255° 36 km/h
04451900008 2017/8/31 4:38 38.45871636 141.279031 276° 44.1 km/
04451900009 2017/8/31 4:39 38.45225857 141.2803076 276° 4.5 km/h
ISPRS Int. J. Geo-Inf. 2018, 7, 287
04451900010 2017/8/31 4:40 38.44693848 141.2823128 272° 13 of 17 42.3 km/
Figure 6.6.Vehicle
Figure tracks.
Vehicle tracks.
The different distributions and densities of the trajectories lead to different division sizes.
The different distributions and densities of the trajectories lead to different division sizes. Th
The experiment for the different sizes of the divided region (m × n) is shown in Figure 7. There are
xperiment for4 machines
the different
to processsizes of the
the data by thedivided
proposedregion (mparallel
distributed × n) processing
is shownmode in Figure
based on 7. There are
MapReduce. As shown ◦ ◦ 0
time for 2 × 1parallel
machines to process the data in byFigure
the7,proposed
it uses the least
distributed 20 and theprocessing
percentage of the
mode based o
cross-regional trajectories is 23.1%. It uses the most time for 12◦ × 8◦ and the percentage of the
MapReduce. As shown intrajectories
cross-regional Figure 7, it uses
is 5.3%. Thethesizeleast time
division forand
for m 2°n×is1°20′
based and
on thethe percentage
actual situation, of the cros
such as the length, distribution, and density of the trajectory. Generally, the region should not be too
small. It does not reflect the effect of MapReduce while the proportion of the cross-regional track is
significant. Then the region should not be too large for the limitation of the consumption memory and
computing resources.
Then the target area is divided into n◦ × m◦ small regions (n and m are positive numbers)
according to the following principles, ensuring that most tracks (70–80%) are divided into no more
than one small lattice:
(1) n and m should not be too small, or the proportion of the tracks across the regions will be very
significant, which cannot reflect the effect of MapReduce. n and m should be chosen so that the
cross-regional trajectory ratio is kept around 25%. m × n is limited by memory limitations.
(2) n and m should not be too large. If m × n is larger, consumption memory and computing
resources will be greater. The maximum of m × n is limited by the resources a single computing
unit can provide.
(3) Within a single computing unit resource, it is not necessarily good to have larger m × n values,
but it would be better to have a greater range for m × n and a lower marginal effect of the
inter-regional track proportion. To meet the conditions in which the cross-regional track ratio is
below a certain range, the smaller m × n, the better.
In general, n and m are preferably larger than 1. The size of the divided region can be appropriately
adjusted according to the number of working machines.(3) Within a single computing unit resource, it is not necessarily good to have larger m × n values,
but it would be better to have a greater range for m × n and a lower marginal effect of the inter-
regional track proportion. To meet the conditions in which the cross-regional track ratio is below
a certain range, the smaller m × n, the better.
In Int.
ISPRS general, n 2018,
J. Geo-Inf. and7,m
287are preferably larger than 1. The size of the divided region can14be
of 17
appropriately adjusted according to the number of working machines.
Figure 7. Different
Figure sizes
7. Different of of
sizes thethe
divided region
divided (m(m
region × n).
× n).
The traditional single server and the proposed approach in this paper, respectively, are used to
The traditional single server and the proposed approach in this paper, respectively, are used to
process the road data matching in the electronic map for the probe-car track by the track-matching
process the road data matching in the electronic map for the probe-car track by the track-matching
algorithm based on the spatial semantic features, where it is divided into the range of 2° ◦× 1°20′ in the
algorithm based on the spatial semantic features, where it is divided into the range of 2 × 1◦ 200 in the
MapReduce model. The test results are shown in Table 4.The traditional single server takes about
MapReduce model. The test results are shown in Table 4.The traditional single server takes about 10.5 h.
10.5 h. By the proposed distributed parallel processing mode based on MapReduce, when the number
By the proposed distributed parallel processing mode based on MapReduce, when the number of
of machines was respectively 4 units → 8 units, the processing time required was less, from 2.5 h →
machines was respectively 4 units → 8 units, the processing time required was less, from 2.5 h → 2.1 h.
2.1 h. Thus, the processing efficiency of the distributed parallel processing based on MapReduce
Thus, the processing efficiency of the distributed parallel processing based on MapReduce shows
shows great improvement.
great improvement.
Table 4. Experimental results (2◦ × 1◦ 200 ).
Processing Approach Single Processing Distributed Processing Distributed Processing
Machine type IBM server Ordinary desktop Ordinary desktop
Machine physical memory 16 GB 2 GB 2 GB
Machine CPU 2.13 GB, 4-core 3.3 GB, 2 nuclear 3.3 GB, 2 nuclear
Number of machines 1 4 8
Processing time 10.5 h 2.5 h 2.1 h
5. Conclusions
This paper discusses the main issues of spatial data mining of probe-car tracks and presents
the two-time MapReduce technology in a spatial data model to solve map-matching by using the
massive trajectory data of floating vehicles and a special strong correlation of the data. Two types of
data are processed by the MapReduce algorithms to enable parallel spatial data computing. The first
MapReduce is conducted for space region partitioning to analyze relatively independent data, that is,
full tracks as a global matching step. The second MapReduce is conducted for cross-regional track
processing, as the cross-regional track. Experiments confirmed that MapReduce technology can be
successfully used in data mining. Using distributed parallel computing for spatial data mining,
the computing performance is significantly improved from the traditional approach of a single server
and the hardware requirements are reduced. Using the proposed MapReduce model, the master
server can better balance the tasks of a working host and achieve better load balancing and better
stability. Based on the two-time MapReduce technology, the probe-car track is divided into spatialprocessing, as the cross-regional track. Experiments confirmed that MapReduce technology can be
successfully used in data mining. Using distributed parallel computing for spatial data mining, the
computing performance is significantly improved from the traditional approach of a single server
and the hardware requirements are reduced. Using the proposed MapReduce model, the master
serverInt.can
ISPRS better2018,
J. Geo-Inf. balance
7, 287 the tasks of a working host and achieve better load balancing and 15 better
of 17
stability. Based on the two-time MapReduce technology, the probe-car track is divided into spatial
region processes and track processes to solve the strong spatial correlation characteristics of the map
region
data andprocesses
achieve and trackprocessing
parallel processes of to the
solve the strong
probe car track spatial correlation characteristics of the map
reduction.
data Based
and achieve parallel processing of the probe car track reduction.
on the application of the parallel MapReduce algorithms, it is crucial to improve the
probe-car trackthe
Based on application
matching of reduction
and the the parallel MapReduce
algorithms algorithms,
for further it is so
research, crucial to improve
as to make the
better use
probe-car track matching and the reduction algorithms for further research,
of parallel computing to enhance the massive probe-car registration track performance. Based on the so as to make better use of
parallel computing to enhance the massive probe-car registration track
probe-car data and spatial data mining general model, we will conduct floating space vehicle performance. Based on the
probe-car
trajectory datadataand spatial with
matching data mining
reference general
to themodel,
specific weelectronic
will conduct floating
maps. space vehicle
According trajectory
to the matching
data matching with reference to the specific electronic maps. According
information, the track is divided into matched and not matched track information. From the not to the matching information,
the track track
matched is divided into matched
information, and not
new roads, matched track
accident-prone information.
areas, and parking From the not
Point matched(POIs)
of Interests track
information, new roads, accident-prone areas, and parking Point of
can be discovered. From the matched track information, abandoned roads and shape-changing Interests (POIs) can be discovered.
From the matched
information for thetrack
roads information,
and other map abandoned
elements roads
can and shape-changing
be implied. Utilizinginformation
the parallel for the roads
MapReduce
and other map
algorithms, the elements
lane path can be implied.
extracted by theUtilizing the parallel
vehicle tracks MapReduce
is the future researchalgorithms, the lane from
issue that emerges path
extracted by the vehicle tracks is the future research issue that emerges
our approach, shown in Figures 8 and 9. Based on the probe-car data, we will conduct floating spacefrom our approach, shown
in Figures
vehicle 8 and 9.data
trajectory Based on the probe-car
matching with referencedata, towethewillspecific
conduct floating space
electronic vehicle trajectory
map. According to the
data matching with reference to the specific electronic map. According to
matching information, combining the spatial data mining model and artificial intelligence, the lane the matching information,
combining
path will bethe spatial data
extracted by themining
vehicle model
tracks,and artificial
which will intelligence, the lane
lay the foundation forpath
the will be extracted
acquisition by
of high-
the vehiclemaps.
precision tracks, which will lay the foundation for the acquisition of high-precision maps.
Figure 8. Vehicle track.
Figure 8. Vehicle track.
ISPRS Int. J. Geo-Inf. 2018, 7, x FOR PEER REVIEW 15 of 17
Figure 9. Lane path.
Figure 9. Lane path.
Author Contributions: L.Z. originated the idea, conducted the experiments, and wrote the manuscript. M.S.
performed the experiments. Y.L. and X.S. designed and performed the experiments. C.Y., F.H., and M.Y.
Author Contributions: L.Z. originated the idea, conducted the experiments, and wrote the manuscript.
designed the presentation, commented on the content, and revised the manuscript.
M.S. performed the experiments. Y.L. and X.S. designed and performed the experiments. C.Y., F.H., and M.Y.
designed the presentation,
Acknowledgments: commented
The authors thankon theanonymous
the content, and revised the
reviewers andmanuscript.
members of the editorial team for the
comments and contributions.
Acknowledgments: Thisthank
The authors workthe
is anonymous
supported by the National
reviewers Natural Science
and members Foundation
of the editorial offor
team China
the
comments
(NSFC) underandproject
contributions. This work is supported by the National Natural Science Foundation of China
number 41771486.
(NSFC) under project number 41771486.
Conflicts of Interest: The authors declare no conflict of interest.
Conflicts of Interest: The authors declare no conflict of interest.
Nomenclature
ITS Intelligent Transportation System
GPS Global Positioning System
OEM Original Equipment Manufacturer
GPRS General Packet Radio Service
VICS Vehicle Information and Communication SystemISPRS Int. J. Geo-Inf. 2018, 7, 287 16 of 17
Nomenclature
ITS Intelligent Transportation System
GPS Global Positioning System
OEM Original Equipment Manufacturer
GPRS General Packet Radio Service
VICS Vehicle Information and Communication System
AATCC Automobile Association Traffic Control Centre
FHA Federal Highway Administration
ITA Illinois Transportation Authority
KRSA Korean Road Safety Association
GSCTI German Space Center Transportation Institute
KORTIC Korea Road Traffic Information Center
CCTV Closed-Circuit Television
POIs Point of Interests
References
1. China Car Survey and Market Prospect Forecast Report. Available online: http://www.askci.com
(accessed on 31 December 2017).
2. Geng, X.; Wang, S.; JI, J. Fast road-matching algorithm of probe-car. J. Water Resour. Archit. Eng. 2013, 11,
122–125.
3. Hao, Y.; Wu, G.; Zhou, S. A multi-vehicle speed fusion algorithm based on probe vehicle data. J. Transp.
Inf. Saf. 2012, 30, 56–61.
4. Zhu, T.; Guo, S. A study on floating car based information processing technology. J. Image Graph. 2009, 14,
1230–1237.
5. Boyce, D.E.; Kirson, A.; Schofer, J.L. Design and implementation of advance: The Illinois dynamic navigation
and route guidance demonstration program. In Proceedings of the Vehicle Navigation and Information
Systems Conference, Dearborn, MI, USA, 20–23 October 1991; pp. 415–426.
6. Cowan, K.; Gates, G. Floating vehicle data system—Realization of a commercial system. In Proceedings of
the 11th International Conference on Road Transport Information and Control, London, UK, 19–21 March
2002; pp. 187–189.
7. Pang, H. Research on Key Technologies of Urban Dynamic Traffic Guidance Systems Based on FCD.
Master’s Thesis, University of Science and Technology of China, Hefei, China, 2009.
8. Wang, Y. Research on the Key Technology of Large-Scale Strategic Traffic Coordination & Control System.
Ph.D. Thesis, Jilin University, Changchun, China, 2009.
9. Vehicle Information and Communication System Center. Introduction of VICS Ver. 2010; Vehicle Information
and Communication System Center: Tokyo, Japan, 2010.
10. Han, W.; Choi, K.K. An implementation of a Korea traffic information center over metropolitan Seoul
region. In Proceedings of the Mobility for Everyone World Congress on Intelligent Transport Systems,
Berlin, Germany, 21–24 October 1997; pp. 21–24.
11. Schafer, R.; Thiessenhusen, K.; Wagner, P. A traffic information system by means of real-time floating-car
data. In Proceedings of the ITS World Congress, Chicago, IL, USA, 14–17 October 2002; pp. 1–8.
12. Jan, F.E.; Stephan, M.; Stefan, E.; Dirk, C.M. Data chain management for planning in city logistics. Int. J. Data
Min. Model. Manag. 2009, 1, 335–356.
13. System and Method for Realtime Community Information Exchange. Available online: https://www.
cbinsights.com/company/waze-patents (accessed on 1 March 2016).
14. Li, X.; Meng, Q. The applications of GPS technology in the Real-Time detection of city traffic condition to
GPS. J. Ocean Univ. Qingdao 2002, 32, 475–481.
15. Dong, J.; Wu, J.; Guo, J. Assessment of road network based on GPS/GIS data:a practice in Beijing.
City Plan. Rev. 2005, 29, 70–74.
16. Zhang, Z.; Lin, X.; Lin, S. Traffic parameter features in traffic incidents based on probe-car data. J. Transp.
Inf. Saf. 2011, 29, 94–98.You can also read