A view of traffic management and other practices resulting in restrictions to the open Internet in Europe - Findings from BEREC's and the European ...
←
→
Page content transcription
If your browser does not render page correctly, please read the page content below
BoR (12) 30

A view of traffic management and
    other practices resulting in
restrictions to the open Internet in
               Europe

 Findings from BEREC’s and the European Commission’s joint
                       investigation

                        29 May 2012
BoR (12) 30

Table of Contents
1       Introduction ................................................................................................................. 3
        1.1 A joint investigation by BEREC and the European Commission                                                                 3
        1.2 An investigation with a large scope                                                                                        4
        1.3 Stakeholder participation                                                                                                  4
2       Qualitative overview of restrictions ........................................................................... 5
        2.1 Caveats                                                                                                            5
        2.2 Categories of restrictions                                                                                         6
        2.3 Specific restrictions (“differentiated”)                                                                           8
             2.3.1 Restrictions on P2P or VoIP traffic ............................................................. 8
             2.3.2 Other specific restrictions ........................................................................... 8
        2.4 Network protection                                                                                                 9
             2.4.1 Security and integrity ................................................................................. 9
             2.4.2 Congestion management ........................................................................... 9
        2.5 Implementation of business models                                                                                 10
             2.5.1 Data caps ................................................................................................ 10
             2.5.2 Specialized services ................................................................................ 11
3       Quantification of restrictions ................................................................................... 11
        3.1 Variety of the reported measures                                                                               12
        3.2 Quantification based on numbers of operators                                                                   13
            A closer look at how restrictions are enforced ................................................... 15
        3.3 Quantification based on operators weighted according to their total number of
            subscribers                                                                                                    17
        3.4 Quantification based on numbers of Internet access subscribers                                                 19
        3.5 Aggregated statistics per types of national markets                                                            23
Annex 1 - General statistics .............................................................................................. 29
Annex 2 - List of respondents ........................................................................................... 31
Annex 3 – Questionnaire sent to operators ..................................................................... 36
Annex 4 - Glossary............................................................................................................. 39

                                                                                                                                     2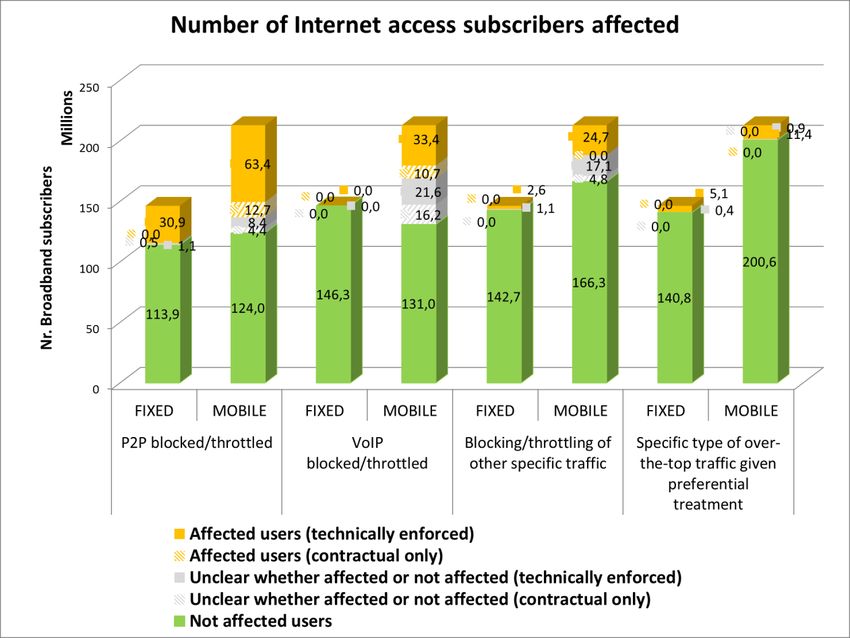
BoR (12) 30

1 Introduction

    1.1 A joint investigation                           by      BEREC            and       the       European
        Commission
This investigation on traffic management practices by providers of electronic
communications services (also called “operators” or “ISPs” in this document) was initiated in
2011 following requests from the European Commission addressed to BEREC, seeking
information regarding several aspects closely related to the debate on net neutrality1. The
Commission was interested in having more specific information on market situations
regarding blocking or hindering of applications, and throttling or degrading of traffic.
In the conclusions of its Communication on the open internet and net neutrality in Europe
issued on the 19th of April 20112, the Commission indicated that the evidence found by
BEREC would serve as a basis for assessing the potential need for additional guidance on
net neutrality3.
In December 2011 the BEREC member NRAs addressed a questionnaire on traffic
management practices to their main providers of electronic communication services4 in their
respective fixed and mobile markets. The questionnaire was published in parallel on the
website of the Commission5.
The stakeholders were invited to submit their answers by 20th of January 2012. On 6th of
March, BEREC submitted its preliminary findings to the Commission and published a
corresponding press release on 9th of March6.
This “snapshot of results” intends to deliver a more thorough qualitative and quantitative
overview of the results gathered by BEREC and the Commission.
It should be noted that the quantitative results throughout this report represent average
figures for Europe. The results for individual countries may substantially differ from these
average European figures. This aspect is specifically highlighted in section 3.5.

1
  European Commission, Communication on the open internet and net neutrality in Europe (COM (2011) 222 final, April
2012: http://eur-lex.europa.eu/LexUriServ/LexUriServ.do?uri=COM:2011:0222:FIN:EN:PDF.
2
  Ibid, pages 8 to 10.
3
  For more information regarding the European Commission’s public consultation on the open internet and net neutrality
in Europe see:
http://ec.europa.eu/information_society/policy/ecomm/library/public_consult/net_neutrality/index_en.htm.
4
  The NRAs were asked to define a scope encompassing a reasonable number of operators with the suggestion that they
consider, at least, the operators which together represent 90% of end users on both fixed and mobile markets.
5
  For more information regarding the questionnaire and the specific questions asked see Annex 3 and also:
http://ec.europa.eu/information_society/policy/ecomm/index_en.htm.
Questionnaire: http://ec.europa.eu/information_society/policy/ecomm/doc/current/ec_berec_tm_questionnaire.xls .
Instructions to respondents:
http://ec.europa.eu/information_society/policy/ecomm/doc/current/ec_berec_tm_instructionstorespondents.pdf.
6
  See the BEREC press release: http://erg.eu.int/doc/2012/TMI_press_release.pdf.

                                                                                                                    3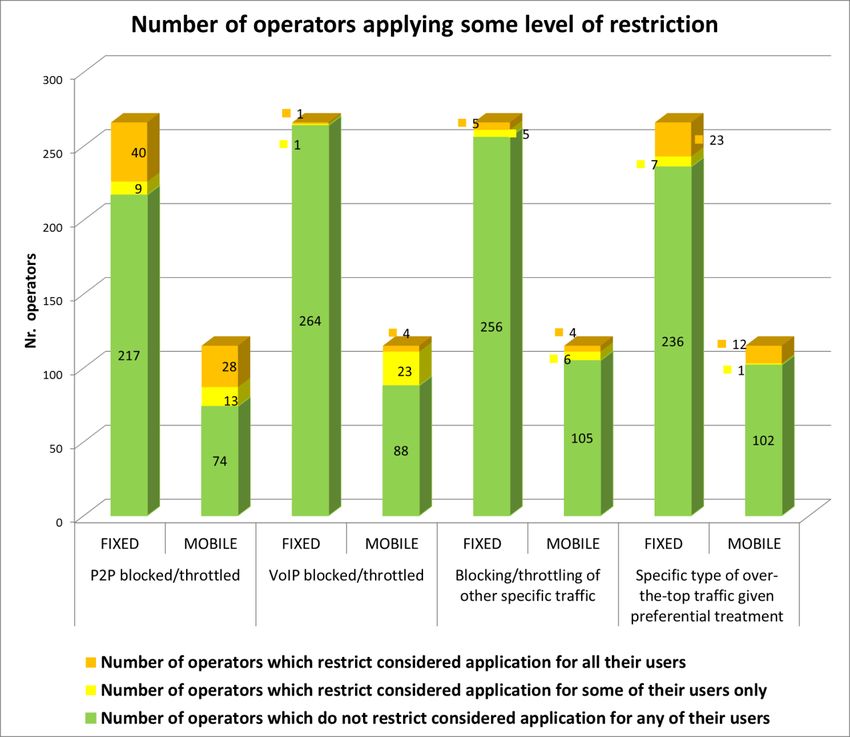
BoR (12) 30

    1.2 An investigation with a large scope
The objective of this wide-ranging European-level inquiry, jointly undertaken by BEREC and
the Commission, is to get a view of traffic management and potential restrictions to access,
content or applications, in particular to gain some insights into their variety and relative
importance. Indeed, they are done for a variety of purposes, and at the same time take
different forms, e.g. remain purely contractual or are technically enforced.
The scope of the inquiry was, in this respect, deliberately wide. The questionnaire sent to the
operators throughout Europe particularly intended to understand the variety in terms of
objectives of measures, for instance by including practices aimed at preserving network
security and integrity and measures required by legal order. It also covered the setting of
data caps, and the potential impact of some specialized services implemented alongside the
Internet access service. All these situations stem from very different business objectives or
constraints. For instance, in many cases, traffic management practices serve as an effective
mean to provide quality services to end users.
In this respect, the term “traffic management” was used with a broad meaning in the
explanatory documents of the questionnaire. Instructions to respondents typically referred to
traffic management practices, which are commonly understood as all technical means used
to process through the network traffic sent or received by end users, including both
application-specific and application-agnostic traffic management. These instructions also
specified that the investigation covered all measures pursuing similar objectives, including
through contractual terms that are not necessarily enforced technically.
This “results snapshot” will attempt to represent this variety, for instance by summarising the
results on “differentiation practices” (i.e. deviations from the “best effort” approach), which
are the most relevant with respect to the net neutrality debate.

    1.3 Stakeholder participation
The findings are largely based on the data submitted by 32 NRAs7 - out of a total of 35
BEREC members and observers - which consisted of questionnaire responses by the main
national operators they had identified8.
A total of 414 operators responded - 266 fixed and 148 mobile operators. Among those 148
mobile operators were 33 MVNOs. As MVNOs referred to practices put in place by their
MNO in most of their answers, often without being able to precisely confirm or detail them, it
was considered preferable not to count their responses in the snapshot statistics. Therefore,
the total number of operators considered within the scope of the exercise is 381 - 266 fixed
and 115 mobile operators9. The customer base of the respondent operators covers a total

7
  These 32 NRAs are: Austria, Belgium, Bulgaria, Croatia, Cyprus, Czech Republic, Denmark, Estonia, Finland, France,
FYRoM, Germany, Greece, Hungary, Ireland, Italy, Latvia, Lithuania, Luxembourg, Malta, Norway, Poland, Portugal,
Romania, Slovak Republic, Slovenia, Spain, Sweden, Switzerland, The Netherlands, Turkey and United Kingdom.
8
  The NRAs were asked to define a scope encompassing a reasonable number of operators with the suggestion that they
consider, at least, the operators which together represent 90% of the end users in both fixed and mobile markets.
9
  For further details, see Annex 1 (overall statistical data) and Annex 2 (list of respondents).

                                                                                                                  4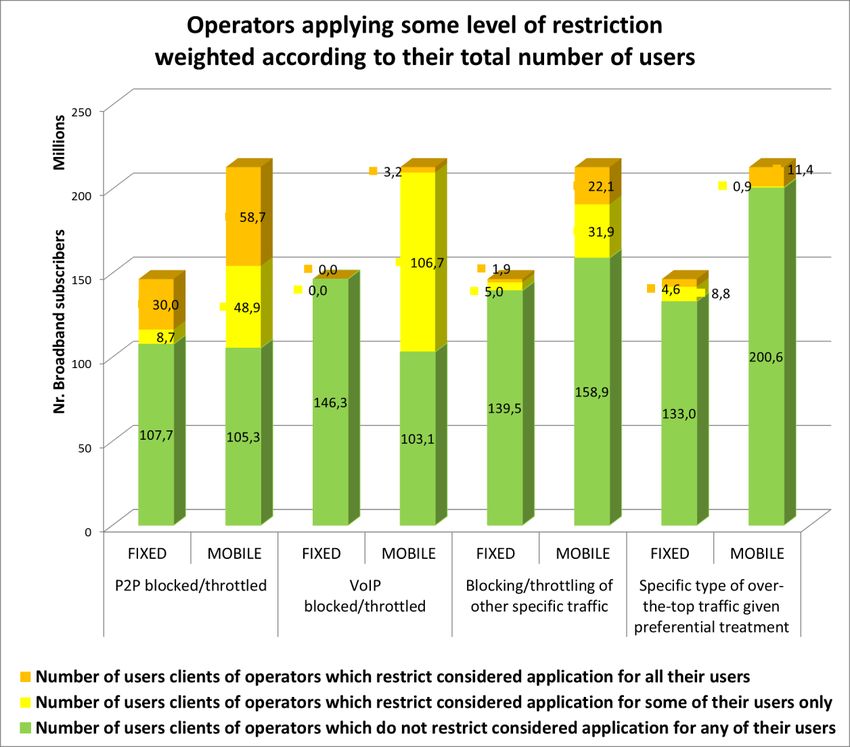
BoR (12) 30
of about 140 million fixed broadband subscribers and 200 million mobile active
Internet subscribers.
In addition, a number of providers of content and applications, consumer organisations,
industry associations and 18 private individuals responded to the questionnaire on the
Commission’s website, on a voluntary basis, which provided an additional dimension and
some extra reference for crosschecking national situations. This report does not cover those
responses.
Although the level of details varied significantly, the overall operator participation was
excellent and a lot of information was collected. BEREC is very pleased with this
comprehensive feedback and would like to thank all the respondents for their efforts and
submissions.
2 Qualitative overview of restrictions
This section provides some elements of description and understanding of the different sorts
of restrictions reported by operators, whether or not they are a common practice in the
markets. Indeed, as the quantitative analysis in chapter 3 will show, only a minority of
providers apply some of the categories of practice described below.
Among the measures reported by respondents, BEREC found across Europe a wide array of
traffic management practices resulting in restrictions, and an equally wide range of
implementation methods and policy justifications for them (sections 3.2 to 3.4 provide a
graphical representation of the frequency of the practices covered by the inquiry).
2.1 Caveats
When studying the details of the results, it is important to bear in mind the following
limitations and caveats:
This is the first time that such a wide-ranging and comprehensive exercise of this type
has been jointly carried out by BEREC and the Commission. It was thus decided, as far
as possible, to simplify some aspects regarding traffic management characteristics, in
order to limit the complexity associated with the use of new concepts, or unusual
questions that may be understood differently by European operators (also foreseeing
possible language issues, as the text of the traffic management questionnaire is in
English). This is an important constraint of the exercise, which explains some inevitable
“imprecisions” in the subsequent analysis. For example, it was not systematically
demanded to specify the duration of a measure, or the place in the network (e.g. access
or backhaul) where it is implemented. As a result, the categories presented in this
document regroup situations that are broadly similar, but which in fact may impact end
users in quite different manners.
The level of information provided varies significantly among the different operators. While
some operators provided brief answers, others explained their actions in detail and a few
even gave additional reasons and arguments in separate attached documents.
5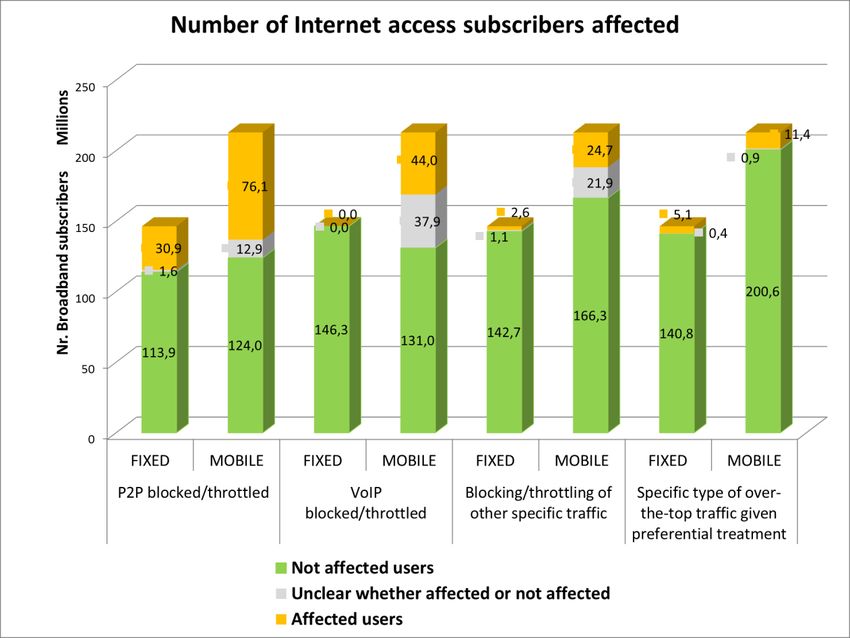
BoR (12) 30
The categories of measures in the questionnaire were built, of course, before knowing
which ones were the most representative in the European Union. When preparing this
snapshot, it seemed useful to distribute the information according to a modified
categorization, better adapted to the responses. This resulted in the creation of two
categories (“Measures related to network security and integrity” and “Measures upon
legal order”), whereas the category “Restriction on the type of terminal allowed, or tiered
pricing depending on the terminal used” disappeared (the corresponding answers were
included in “restrictions of other kind of traffic”).
The reliability of quantitative information is, to a certain extent, limited - mainly due to a
lack of up-to-date information regarding the number of Internet access subscribers per
operator. This derives from the fact that a significant number of operators did not provide
this information, sometimes on the basis of commercial confidentiality. Drawing on
information and estimations provided by NRAs helped to fill some gaps in this
information. With this approach, it was possible to propose a quantification of practices in
reference to the number of Internet users, but any absolute figure should be considered
with extreme caution.
2.2 Categories of restrictions
The first overview of results proposed in the next section presents the frequency, as reported
by operator, of the different types of restrictions, distinguishing the following main categories:
differentiation (of traffic, or providers…) in section 2.3; technical network protection
(congestion, security) in section 2.4; implementation of business models (data caps,
specialized services) in section 2.5; and legal obligations. Hereafter is a general description
of these categories.
The first part in this overview (section 2.3) considers the occurrences of restrictions
(contractual and/or technical “blocking/throttling”10) of specific traffic contained in the
operator responses:
1) P2P/VoIP traffic: operators were specifically required to reference any restriction
(contractual and/or technical) to the transportation of such kind of P2P/VoIP traffic
within the Internet access packages they offer.
2) Other contents/applications (e.g. file sharing, FTP, etc.) or specific providers
These “differentiation” practices, which result in restrictions to access content or
applications, are the most relevant in terms of net neutrality. It can be emphasized here that
restrictions indicated in the offers, and possibly enforced technically, will not necessarily
impact all end users at all times.
The second part (section 2.4) consists of measures reported by operators as allowing a
more efficient protection and management of networks. These include:
3) Congestion management and
4) Security and integrity:
10
As labelled in the questionnaire.
6BoR (12) 30
30% of the fixed and 20% of the mobile operators reported certain traffic
management practices which have been categorised under this umbrella (such as
controlling “spam” traffic). In addition, some of the traffic management measures
justified by the operators as being based on these “security and integrity” concerns
are best described as congestion management techniques, and have therefore been
categorized accordingly. This distinction is further explored in other BEREC work
streams (particularly in relation to minimum quality of service requirements).
The third part (section 2.5) corresponds to measures put in place by operators in order to
implement specific business models, either concerning the bundling of specialized services
with Internet access, or with respect to data volume pricing.
5) Specialised services in fixed networks:
35% of the fixed operators manage their networks in order to offer specialised
services (for the provision of facility–based applications, e.g. telephony or TV) in a
way which could potentially affect the (public and best efforts) Internet access service
being delivered through the same access network.
6) Data caps:
A wide variety of data caps and “fair use” policies, used to implement specific
business models, were found (especially in mobile networks, where 83% of ISPs
apply data caps). However, it should be noted that these were not the main focus of
this investigation, since (with some exceptions) in general they do not imply
differentiated treatment of traffic. While data caps are a technical measure in the
sense that traffic volume needs to be measured and throttled once the data cap has
been reached or charging for extra volume implemented, these practices are
common business models since the early days of narrowband Internet access. Data
caps provide a price signal to end users related to the cost of bandwidth
consumption. As pointed out by BEREC in its Response to the Communication on
the open internet and net neutrality in Europe, limiting the data volume or throughput
rate independent of data type does not constitute a departure from the principle of
net neutrality11. Offers implemented through such measures are frequent and of
interest to end users, which is why they are also detailed here.
The last category covers any form of restriction that is not at the operators’ initiative, but is
required by public authorities:
7) Measures upon legal order:
These measures are undertaken under “legal obligation” purposes (e.g. anti-bill
shock in roaming, court orders, etc.) and have also been included in a separate
category. Not being the focus of this investigation, they are not further detailed in the
subsequent description.
11
See BEREC, Response to the European Commission’s consultation on the open internet and net neutrality in Europe BoR
(10)42, September 2010, page 15 (question 10):
http://www.irg.eu/streaming/BoR%20(10)%2042%20BEREC%20response_ECconsultation_Net%20neutrality_final.pdf?con
tentId=546969&field=ATTACHED_FILE.
7BoR (12) 30
2.3 Specific restrictions (“differentiated”)
2.3.1 Restrictions on P2P or VoIP traffic
Among the restrictions related to specific types of traffic, the most frequently reported
restrictions are the blocking and/or throttling of peer-to-peer (P2P) traffic, on both fixed and
mobile networks, and the blocking of Voice over IP (VoIP) traffic, mostly on mobile networks.
As regards P2P, some level of restriction is reported by 49 operators (out of 266) on fixed
networks and by 41 operators (out of 115) on mobile networks. As regards VoIP, some level
of restriction is reported by 28 operators (out of 115) on mobile networks. Each of these
types of restrictions affects at least 20% of subscribers.
However, it should be noted that the level of restriction applied and the corresponding impact
on end users vary significantly among operators: some apply it to all their users, others to
some of their users only; some apply permanent restrictions, others apply limited period
restrictions (e.g. peak time), etc.
Various approaches are proposed in chapter 3 to further quantify these practices and the
resulting restrictions at European level (see sections 3.2 to 3.4 for further details).
Furthermore some interesting descriptive information can be noted. These restrictions are
usually reflected in specific contractual terms (such information is now compulsory according
to EU directives), so that in most cases the end users are supposed to be aware that the
package they have chosen contractually excludes VoIP and/or P2P. In a certain number of
cases, these contractual terms are not followed by an effective technical enforcement of the
restriction12 (the distinction between “contractual only” and “technically enforced” is further
elaborated in section 3.2).
2.3.2 Other specific restrictions
As reflected in the graphs in chapter 3, other, less common, examples of specific restrictions
(including traffic degradation, i.e. blocking/throttling) are reported. These include restrictions
on access to other specific applications (such as gaming, streaming, e-mail or instant
messaging service) and, to a much lesser extent, on access to specific content and
application providers.
A number of cases of operators giving preferential treatment to specific types of over-the-top
traffic were also found (e.g. prioritising streaming and other real-time applications, HTTP,
etc.) and are presented separately in the figures of chapter 3.
Some examples of special treatment for over-the-top traffic reported by fixed operators are
prioritisation of certain kind of traffic or applications at peak times (such as HTTP, DNS,
VoIP, gaming, instant messaging, etc.), and assigning lower priority to applications such as
12
Conversely, some network management techniques may have an indirect impact on VoIP or P2P traffic, without this
being directly reflected in the terms of contracts. Such situations are not easy to quantify.
8BoR (12) 30
file downloading, P2P, etc. In mobile networks, it is worth to mention some cases of
applications or websites which are excluded from the monthly data cap (HTTP traffic,
customer care portals or applications such as Facebook).
These restrictions, usually detailed in the contractual terms to various extents, are (here
also) not always technically enforced. When they are accompanied by technical measures in
the network, these are sometimes not completely covering the restriction. Often the
restrictions evolve over time, for instance to target new providers of similar applications.
2.4 Network protection
This category includes network security and integrity related measures, as well as
congestion management, which are further detailed hereafter.
2.4.1 Security and integrity
As stated above, a significant number of operators reported practices that can be classified
as “based on network security and integrity reasons”. The most frequent measure in this
category is the hindering of end users’ access to protect from spam, blocking port 25
(SMTP). This measure can be deactivated by the end user in some cases. Other ports are
sometimes blocked as well (e.g. NetBios), and some respondents reported using measures
aimed at security enforcement in case of an attack (e.g. DoS attack).
Measures resulting from legal obligations are considered in a different category (e.g. anti-bill
shock in roaming, court orders, blocking of child pornography sites, etc.). These are intended
to be measures of general application by all operators, within a country, although they were
not always reported in responses.
2.4.2 Congestion management
On the Internet, temporary traffic peaks are buffered in routers, and congestion occurs when
buffers overflow and IP packets get dropped. Traditional best effort networks, like the
Internet, limit congestion through so-called “congestion control” at the edge of the network
where traffic sources (such as computers connected to the Internet) slow down the
transmission rate when packet loss is observed.
A significant proportion of the operators explain that they implement dedicated traffic
management measures in order to manage congestion. Providers of modern IP networks
often perform congestion management within their own networks. These techniques vary
from application-agnostic functions treating all traffic types equally (often referred to as “fair
sharing” and similar methods) to application-specific functions performing throttling and/or
blocking of specific applications (typically using deep packet inspection technologies). When
these practices were clearly reported (or verified by NRAs) as application-specific, they were
included in the categories of the previous section “other specific restrictions” (2.3).
9BoR (12) 30
2.5 Implementation of business models
2.5.1 Data caps
Data caps are not the focus of this net neutrality-related inquiry. Indeed, caps are generally
application-agnostic, i.e. applied indistinctively from specific types of traffic. In general, they
reflect a strategy from the operator with respect to the pricing of data traffic, according to
volume. In other words, data caps are technical measures, in the sense that traffic volume
needs to be measured and throttled once the data cap has been reached or charging for
extra volume implemented. Nevertheless, when they are application-agnostic, they represent
common business models implemented since the early days of narrowband Internet access.
Data caps indeed provide a price signal to end users related to the cost of bandwidth
consumption.
However, in a few instances, mobile operators do not include the usage of a specific
application in the consumption of the contracted data volume (e.g. in the case of a
partnership with a content website, or to promote a specific social networking application).
In its response to the Commission’s Communication on the open internet and net neutrality
in Europe, BEREC stated that: “Limiting the data volume or throughput rate may either be
independent of data type (data volume caps or bandwidth limits) or dependent of data type
(e.g. throttling of P2P file sharing). The first method does not constitute a departure from the
principle of net neutrality; while the second method presumably does as specific data types
receive a different treatment than other traffic.”13
Regarding application-agnostic data caps (or data user “volume limits”), two kinds of
implementation have been observed in the responses, mainly on mobile access services:
segmented tariff models, with various levels of data cap per month;
fair use policies, to prevent “excessive” consumption.
Several measures can be applied to the end user access after the data cap is reached: a
speed limit can be activated (e.g. restricting transmission data down to 64 kbps), access
service can be temporarily stopped or, in several cases, end users are given the opportunity
to buy extra data volume.
Data caps are often the subject of transparency improvement efforts by public authorities
and the sector (also in relation to content and application providers); this question is further
explored in other net neutrality related work streams from BEREC14.
13
See BEREC, Response to the European Commission’s consultation on the open internet and net neutrality in Europe BoR
(10)42, September 2010, page 15 (question 10):
http://www.irg.eu/streaming/BoR%20(10)%2042%20BEREC%20response_ECconsultation_Net%20neutrality_final.pdf?con
tentId=546969&field=ATTACHED_FILE.
14
See in particular BEREC, Guidelines on Transparency in the scope of net neutrality: Best practices and recommended
approaches, BoR (11) 67, December 2011: http://berec.europa.eu/doc/berec/bor/bor11_67_transparencyguide.pdf.
10BoR (12) 30
2.5.2 Specialized services
Some providers of electronic communication services offer specialized services, which differ
from (public and best effort) Internet access service in that they provide a generally
guaranteed quality of service and a strict admission control. There are quite different national
situations, varying from none to all operators offering specialized services in parallel to
offering Internet best-effort access service.
The most frequent applications offered are VoIP, IPTV, VoD. The use of these specialized
services might affect the Internet access service in some cases, due to the sharing of access
resources:
Electronic communication service
Specialized Internet
service access service
Static or dynamic
capacity allocation
Figure 1
About one third of the fixed operators indicate in their responses that specialized services
are affecting, to some extent, the Internet best-effort service of customers using the same
access network15 (see graphs in chapter 3). Potential degradation of the Internet access
service in this context is particularly examined within other net neutrality related BEREC
work streams, particularly in relation to quality of service minimum requirements.
3 Quantification of restrictions
This chapter first shows the variety of practices reported, and presents the relative
importance of the different types of restrictions considered in the questionnaire (section 3.1).
Sections 3.2 to 3.5 provide a detailed quantification, using four different approaches:
1) Number of operators applying each kind of restriction (section 3.2).
15
There are two possible relevant cases here: either a customer using specialised services has his bundled Internet access
service (IAS) affected, or the IAS of one customer affected by the specialised service of other customers.
11BoR (12) 30
2) Operators applying each kind of restriction weighted according to their total number
of subscribers (section 3.3).
3) Number of Internet access subscribers affected by restrictions (section 3.4).
4) Cross-country aggregated statistics for the most frequent restrictions (section 3.5), in
order to represent the relatively contrasting situation across Europe.
Quantification based on the number of operators is helpful to provide a first general picture.
However, it suffers from the fact that the number of operators applying a specific restriction
does not necessarily reflect the situation on the market as a whole. It is not possible to draw
any inference from the number of operators to the number of subscribers actually affected.
Moreover the number of operators per country having reported data, during the data
collection procedure, does not relate to the size of the country. Countries with many
operators compared to the overall subscriber base are overrepresented in the snapshot
data, when it is based on operator’s numbers information.
To allow more meaningful statements about the overall frequency of particular measures, it
was therefore also tried to calculate and present data in relation to the number of
subscribers affected. However subscriber data provided by operators were not complete.
Some operators did not supply any subscriber data. Those operators were excluded from
the subscriber-based calculation (which implies an underestimation, in those graphs, for the
practices that these operators reported).
Moreover, precise data was not always provided, in the cases where measures were only
applied to part of the subscriber base. Therefore the data reported allow stating a minimum
number of subscribers that are surely affected, and a minimum number of subscribers that
are surely not affected by a specific measure. For those operators responding that a
particular measure was applied to some users only, a range of uncertainty may remain in
some cases, with respect to how many users are affected by the measure.
This range is clearly marked hereafter.
3.1 Variety of the reported measures
The following graph (Figure 2) provides a general overview of the measures reported, by
representing the proportion of operators applying each type of practice considered to their
Internet access customers. The percentages regroup both practices applicable to all, and to
only a part of the client base, regardless of whether they are implemented technically and/or
contractually, and of how the information is conveyed to customers.
These charts include all types of measures described previously, including those that do not,
in most cases, represent a concern in terms of net neutrality – in particular data caps
(volume limits), which represent an important portion of responses, particularly in the mobile
environment, where they are a very common practice.
Some restrictions which were asked for are nearly never reported, neither in fixed nor mobile
networks, such as restrictions on instant messaging, or restrictions on a specific content or
application provider.
12BoR (12) 30
Figure 2
When reading this chart, it is important to keep in mind that the frequency of ISPs reporting
some level of restriction does not quantify the numbers of users affected (which depends on
the size of the ISP, on whether the restriction is applied to all users or to some users only,
etc). It does not represent either the quantitative importance of the restriction in the daily
experience of users. The measure may indeed, for example, only be applied for a limited
period of time.
Subsequent sections will look more in details at the quantification of practices which are both
net neutrality related and not insignificant. These are the practices underlined in Figure 2:
“restrictions on P2P”, “restrictions on VoIP”, “restrictions on other kind of traffic” and “specific
type of over-the-top traffic given preferential treatment”.
3.2 Quantification based on numbers of operators
This section presents the aggregated results in terms of number of operators, for some of
the restrictions sought after in the questionnaire, in particular those in the questionnaire
section labelled “Different priority levels within Internet access traffic”:
“P2P file sharing is blocked/throttled”
13BoR (12) 30
“VoIP is blocked/throttled”
Other practices of “negative differentiation” of specific traffic: “Other specific kind of
traffic (port, protocol, application, usage, etc.) is blocked/throttled”
Practices of “positive differentiation” of specific traffic: “Specific type of over-the-top
traffic given preferential treatment (e.g. specific content/application and/or specific
application/content provider)”
For each type of restriction, the figures presented below display the number of operators
reporting the practice. As mentioned before, it should be noted that these figures should not
be understood as a quantification of the impact on end users, as the level of restriction
applied varies significantly among operators (in particular, some apply it to all their users,
others to some of their users only).
In the figures presented below, a distinction is made depending on whether an ISP declaring
a practice applies this practice to all its subscribers, or only to some of its subscribers (e.g
restriction applied only in certain offers, and not in others).
As stated above, the total number of operators considered within the results of the exercise
is 381 - 266 fixed and 115 mobile network operators16.
A first version below (Figure 3) presents a general view of restrictions set up by operators.
The colours in the graphs vary, depending on whether the operator is applying the restriction
to all its customers (orange), only to a part of its customer base (yellow), or to none (green).
The second version (Figure 5) is more detailed, since it reflects the distinction between
technically-enforced restrictions and contractual-only restrictions – which is explained further
in an intermediate section.
16
The 33 respondent MVNOs were not included in the statistics, as in most cases they referred to practices put in place by
their MNOs operator, often not being able to guarantee their observations. However, in a number of cases, the level of
restrictions (frequently imposed by the host MNO) appears higher than for the MNO’s offers.
14BoR (12) 30
Figure 3
A closer look at how restrictions are enforced
An important distinction in the forms of implementation of the reported restrictions is the
method of enforcement. There are two main types of situations with regards to how the end
users are confronted with a restriction in practice. Either the contractual provision is
accompanied by technical measures, which guarantee that the provision is respected – this
is described here as “technically enforced”. Or there are no technical means put in place by
the operator to control that matter – this situation is described as “contractual only”. In the
latter case, end users would technically be able to “violate” the contractual terms and access
some contents or applications that are restricted in their offer, even though they are
obviously not supposed to do so.
In this regard, the global figures presented in Figure 3 above should not be regarded as
quantifying specifically the technical measures in place, but rather the intended restriction.
For the most frequent restrictions, BEREC has calculated the proportion that is not actually
technically enforced (according to the answers to the questionnaire). The results are the
following: “contractual only” restrictions represent 4% of the cases reported for P2P in
15BoR (12) 30
fixed networks, 12% for P2P in mobile networks, 44% for VoIP in mobile networks.
This percentage is in reference to the number of operators which report to apply such
restrictions. For example, in the case of P2P in fixed networks, 48 out of 266 operators (4%
here corresponds to 2 operators).
Figure 4
One last piece of descriptive information relates to the effectiveness of the measure. Even
when a restriction is technically enforced, it may be done incompletely (e.g. not all the
producers of a type of traffic are identified by the system). It may also be ineffective when
the end users use certain configurations. This consideration is useful to better understand to
what extent an end user is effectively prevented from accessing or using some content or
application. Nevertheless, this is not the only element to be appreciated in the context of net
neutrality: the ability to exercise choice, in particular, is a criteria emphasized in other work
streams of BEREC.
Applying this distinction between “technically enforced” and “conctractual only” to all the
categories of measures, the data collected is classified and presented in Figure 5. The
colours in the graphs vary, depending on whether the operator is applying the restriction to
all its customers (orange, solid or dashed), only to a part of its customer base (yellow, solid
or dashed), or to none (green).
16BoR (12) 30
Figure 5
3.3 Quantification based on operators weighted according to
their total number of subscribers
The objective here is, starting from previous figures, to weight each operator according to its
number of subscribers. In the resulting graphics, it should be underlined that the weight
affected to the category of operators which “restrict considered application for some of their
users only” does not correspond to the number of users affected by the restriction, but rather
to the total number of users of these operators. So that the graphics do not tell exactly how
widespread the restrictions are (which will be the aim of next section), but rather how
important (in terms of customers) are the categories of operators that apply restrictions to all,
some and none of their users.
It is important to note that, when users are counted within categories with some level of
restriction, the measure implemented on their Internet access does not necessarily have
continuous effect at all times (e.g. throttling P2P only at peak hours). Furthermore, both the
yellow and orange categories include restrictions that are implemented technically, as well
as restrictions that are implemented contractually only.
17BoR (12) 30
Lastly, it should be kept in mind that these figures are estimations, given that up-to-date data
on the number of Internet access subscribers was not provided by every operator.
A first version below (Figure 6) presents a general view of the weighting of operators’
behaviour, depending on whether they apply restrictions to all, some or none of their users.
The colours in the graphs vary, depending on whether the operator is applying the restriction
to all its customers (orange), only to a part of its customer base (yellow), or to none (green).
The second version (Figure 7) is more detailed, since it reflects the distinction between
technically enforced restrictions and contractual only restrictions.
Note: Those operators were not taken into account which did not provide any data as regards their total number
of subscribers. Therefore this graph reflects less than the total numbers of 266 (fixed operators) and 115 (mobile
operators) of Figures 3 and 5.
Figure 6
An alternative view in Figure 7 allows reflecting also the absence, in a number of cases, of
technical enforcement of a restriction stated in a contract.
18BoR (12) 30
Note: Those operators were not taken into account which did not provide any data as regards their total number
of subscribers. Therefore this graph reflects less than the total numbers of 266 (fixed operators) and 115 (mobile
operators) of Figures 3 and 5.
Figure 7
3.4 Quantification based on numbers of Internet access
subscribers
The same restrictions as in the previous sections are presented here, this time showing the
results in terms of number of Internet access subscribers, in order to present a first high-
level assessment of the impact of the operators’ practices on the end users in Europe.
It is indeed useful to further quantify the number of users “affected” by restrictions to a
considered application, and at the same time the number of users preserved from such
restrictions.
This is done easily for operators which reported not to apply a restriction (all their
subscribers were put in category “users not affected”) and for those which reported to apply
a restriction to all their users (all their subscribers were put in category “users affected”).
However, a difficulty arises for operators which reported to apply a restriction to some of
19BoR (12) 30
their users only, and not all: figures as regards the number of users affected were not always
provided by the operators. In case figures were provided, the operator’s subscribers were
split between the first two categories (“users affected” and “users not affected”). Absent such
figures, all its subscribers were put in a third category “unclear whether affected or not
affected”.
In the end, when reading the figures quantifying the impact on end users, it should be
understood that the “unclear whether affected or affected” category (grey) is in reality a
compound, of unknown proportion, between “users affected” (that would have to be painted
orange) and “users not affected” (that would have to be painted green). This implies that the
dividing line between “affected” and “not affected” stands somewhere in the grey block. Or,
said differently, the number of users effectively affected is in the range between “users
affected” (orange) and “users affected” and “unclear whether affected or affected” (orange +
grey).
Furthermore, similarly as above, both the grey and orange categories include restrictions
that are implemented technically, as well as restrictions that are implemented contractually
only.
A first version below (Figure 8) presents a general view of resulting restrictions faced by end
users. The colours in the graphs vary, depending on whether the user faces restrictions
(orange) or not (green), or whether the data does not allow to tell (grey).
The second version (Figure 9) is more detailed, since it reflects the distinction between
technically enforced restrictions and contractual only restrictions.
20BoR (12) 30
Note: Those operators were not taken into account which did not provide any data as regards their total number
of subscribers. Therefore this graph reflects less than the total numbers of 266 (fixed operators) and 115 (mobile
operators) of Figures 3 and 5.
Figure 8
Figure 8 can be read accordingly:
- In the fixed market, while at least 78% are not affected by those restrictions, at least
21 % of broadband users are affected by P2P related restrictions, either technically
or contractually. The data is not clear enough to enable reliable conclusions to be
drawn about the remaining 1% of users who might or might not face such restrictions.
- In the mobile market, while at least 58% are not affected by those restrictions, at
least 36 % of broadband users are affected by P2P related restrictions, either
technically or contractually. The data is not clear enough to enable reliable
conclusions to be drawn about the remaining 6% of users who might or might not
face such restrictions.
- In the mobile market while at least 61% are not affected by those restrictions, at least
21 % of broadband users are affected by VoIP related restrictions, either technically
or contractually. The data is not clear enough to enable reliable conclusions to be
drawn about the remaining 18% of users who might or might not face such
restrictions.
21BoR (12) 30
To correctly interpret the meaning of Figure 8 and the preceding figures, it is important to
recall the many different ways in which the reported restrictions are implemented, and thus
the fact that affected end users will be impacted in very different ways.
One important aspect relates to the type of technical management associated with a certain
type of restriction. For instance, when blocking/throttling is implemented in the network, it is
typically done through deep packet inspection (DPI). But various other techniques are
reported as well – in fact, there does not seem to be any “standard” methodology today in
Europe, or even within a country. A central element is the type of traffic that is concerned.
Indeed, quite often management related to P2P will be targeted essentially at peak hours, in
cases of congestion. So in reality, the experience of end users will be concretely affected to
a much smaller extent than the figure may suggest.
One last important factor is the absence, in a number of cases, of technical enforcement of a
restriction stated in a contract. This has been further examined in the previous section, and
is represented in Figure 9 below.
As previously, an alternative view in Figure 9 allows reflecting also the absence, in a number
of cases, of technical enforcement of a restriction stated in a contract. The colours in the
graphs vary, depending on whether the user faces restrictions (orange, solid or dashed) or
not (green), or whether the data does not allow to tell (grey, solid or dashed).
22BoR (12) 30
Note: Those operators were not taken into account which did not provide any data as regards their total number
of subscribers. Therefore this graph reflects less than the total numbers of 266 (fixed operators) and 115 (mobile
operators) of Figures 3 and 5.
Figure 9
It may be noted that the divergence between restrictions that are implemented both
technically and contractually as opposed to those that are only implemented contractually is
more significant for mobile subscribers than for fixed subscribers.
3.5 Aggregated statistics per types of national markets
This approach helps to understand the difficulty in drawing conclusions from the EU-level
statistics above, for any specific market, since there are truly different national situations.
Light is shed below on the availability of unrestricted offers at national market levels,
because it is the relevant level for an end user to exercise choice (if this choice is possible),
as highlighted in other BEREC work streams related to net neutrality. The contrasted results
confirm that any analysis of the “net neutrality status” would need to be performed at each
national market level, in order to assess appropriately the situation of its users with respect
to restrictions on the access to content/applications/services.
The following figures reflect the statistical distribution of unrestricted offers for the most
frequently restricted traffic, i.e.:
23BoR (12) 30
For the fixed broadband markets: unrestricted offers in relation to P2P traffic (Figure 11);
For the mobile Internet markets: unrestricted offers for P2P (Figure12) and for VoIP
traffic (Figure 13).
It is important to note that any (contractual and/or technical) measure in place, which could
restrict access to content, application, services of the customers of an offer, results in this
offer being classified here as “restricted”, thus naturally overstating the restricted nature of a
market – indeed, as mentioned previously, a measure implemented on an end user’s access
does not necessarily have a continuous effect at all times (e.g. throttling P2P only at peak
hours).
The data is aggregated according to three different categories of countries - low, medium
and high proportions of unrestricted offers within a national market - depending on the
percentage of end users that are clients of operators which provide unrestricted offers for all
their users in those countries. The graphs display the total number of countries in each
category, and the aggregated number of European Internet users in the countries included in
each category, in percentages17.
The categorisation of national markets follows the criteria below:
Frequent restrictions (type 1 in the graphs): Markets with a low proportion of unrestricted
offers. A national market falls under this category when the ISPs that are restricting P2P
(respectively VoIP) for all their end users have a cumulated market share over 50%.
Unfrequent restrictions (type 3 in the graphs): Markets with a high proportion of
unrestricted offers. A national market falls under this category when the ISPs that are not
restricting P2P (respectively VoIP) for any of their end users have a cumulated market
share over 50%.
Intermediate markets (type 2 in the graphs): the rest of the situations (neither of the two
previous criteria fits that national market).
The following chart (Figure 10), based on fictional data in order to keep it simple, further
explains how Figures 11 to 13 are built, from top to bottom:
national markets are sorted on the basis of the share of users clients of operators who
restrict the considered application for all / some / none of their users;
three groups of markets are formed, on the basis of categories described before
(“all”>50%, “none”>50%, others);
the size of each group (number of countries) leads to the distribution (in percentages) of
types of markets in term of number of countries; this forms the inner circle of the “pies” of
Figures 9 to 11;
weighting each national market by its number of subscribers, this leads to the distribution
(in percentages) of types of markets in terms of number of subscribers; this forms the
outer circle of the “pies” of Figures 11 to 13.
17
The percentages in the graph are related to the total number of subscribers covered by the respondent ISPs.
24BoR (12) 30
Figure 10
The resulting graphs are displayed below.
25BoR (12) 30
Figure 11
Example of information displayed in Figure 11: 25 countries (representing 75% of European
fixed Internet subscribers covered by this inquiry) have “type 3” national markets, i.e. more
than 50% of fixed broadband end users currently subscribe to offers where P2P traffic is not
restricted in any form.
26BoR (12) 30
Figure 12
27BoR (12) 30
Figure 13
28BoR (12) 30
Annex 1 - General statistics
The following tables display the general statistics of respondent operators which were taken
into account in the figures of the document. This amounts to a total of 381 operators: 266
fixed and 115 mobile operators (excluding MVNOs, as explained in section 1.3).
FIXED
Total number of lines
for access to Internet,
Number of for the respondent
respondent operators (aggregated
Member State operators per country)
Austria 3 1 799 000
Belgium 7 3 212 949
Bulgaria 10 810 071
Croatia 9 776 003
Cyprus 3 198 916
Czech Republic 22 1 611 216
Denmark 9 1 951 942
Estonia 4 272 100
Finland 10 1 415 500
France 6 22 301 000
FYRoM 3 71 324
Germany 11 26 187 516
Greece 5 2 035 500
Hungary 12 1 838 664
Ireland 9 826 932
Italy 7 13 151 787
Latvia 9 335 774
Lithuania 9 578 394
Luxembourg 7 0
Malta 3 126 959
Norway 6 1 573 227
Poland 13 4 971 528
Portugal 5 2 179 628
Romania 21 3 014 485
Slovak Republic 20 580 919
Slovenia 7 449 040
Spain 5 10 723 236
Sweden 8 2 722 100
Switzerland 4 2 565 667
The Netherlands 8 5 264 910
Turkey 5 14 038 527
United Kingdom 6 18 778 857
Total 266 146 363 671
29BoR (12) 30
MOBILE
Total number of
broadband subscriptions
for access to Internet, for
Number of the, for respondent
respondent operators (aggregated
Member State operators per country)
Austria 4 4 371 548
Belgium 3 1 779 162
Bulgaria 3 1 643 121
Croatia 3 657 000
Cyprus 2 286 972
Czech Republic 4 1 904 923
Denmark 5 3 843 333
Estonia 3 207 000
Finland 3 4 435 000
France 4 19 100 000
FYRoM 3 0
Germany 4 29 350 000
Greece 3 5 962 421
Hungary 3 942 955
Ireland 3 2 702 168
Italy 4 19 006 051
Latvia 5 1 055 951
Lithuania 3 219 992
Luxembourg 4 0
Malta 3 135 453
Norway 3 2 384 758
Poland 4 15 404 044
Portugal 3 3 870 002
Romania 6 3 020 004
Slovak Republic 3 1 223 672
Slovenia 4 556 163
Spain 4 15 179 292
Sweden 5 8 512 500
Switzerland 3 5 524 905
The Netherlands 3 10 474 096
Turkey 4 2 932 070
United Kingdom 4 46 223 987
Total 115 212 908 543
30BoR (12) 30
Annex 2 - List of respondents
The following tables display the names of all respondents to the questionnaire. As regards to
operators, this amounts to a total of 414 operators: 266 fixed and 148 mobile operators.
Among those 148 mobile operators were 33 MVNOs.
Fixed operators Fixed operators
Austria Internethome
A1 Telekom Austria Kabelova TV CZ
Tele2 MobilKom
UPC Austria Nej TV
Belgium PODA
Belgacom RIO Media
Brutélé (VOO) SELF Servis
Clearwire Belgium Sky Net
Mobistar Smart Comp
Scarlet Belgium Telefónica
TECTEO (VOO) T-mobile
Telenet T-Systems
Bulgaria UPC
BBC Cable Vodafone
Blizoo Denmark
BTC (Vivacom) ComX Networks
Bulsatcom ELRO Skyline
Cable Sat Zapad EnergiMidt
Megalan Network JSC SE
Mobiltel Stofa
Net 1 TDC
Network Bulgaria Telenor
Croatia Telia
Amis Telekom Waoo!
AT&T Hrvatska Estonia
B.Net Hrvatska Elion
H1 Telekom Elisa
Hrvatski Telekom Starman
Iskon Internet Uus Programm
Novi-Net Finland
OT - Optima Telekom AinaCom
VIPNET Anvia
Cyprus CSC (non profit)
Cablenet DNA
Cyta Elisa
Primetel Kaisanet
Czech Republic Kymen Puhelin KYMP
AVONET Nebula
COMA Pohjanmaan PPO
Dial Telecom TeliaSonera Finland
Dragon France
Erkor Bouygues Telecom
Fortech Darty
GRAPE SC France Télécom – Orange
GTS Czech Free
31BoR (12) 30
Fixed operators Fixed operators
Numericable Balticom
SFR Dautkom TV
FYRoM IZZI
Cabletel (Blizoo) Latnet Serviss
T Home (Macedonia Telekom) Lattelecom
Telekabel LMT
Germany MFL Serviss
Deutsche Telekom Telia Latvija
EWE Tel Lithuania
Kabel BW 5CI
Kabel Deutschland Balticum TV
Netcologne Baltneta
QSC CGATES
Telefónica Germany Dokeda
United Internet Init
Unitymedia LRTC
Versatel Splius
Vodafone D2 TEO
Greece Luxembourg
Cyta Hellas op1
Forthnet op2
Hellas Online op3
OTE op4
WIND Hellas op5
Hungary op6
DIGI op7
DRÁVANET Malta
EnterNet 2001 GO plc
Externet Melita plc
GTS Hungary Vodafone Malta
Invitel Norway
Magyar Telekom Altibox
PR-TELECOM Eidsiva Bredbånd
RubiCom Get
Tarr Építő NextGenTel
UPC Telenor
ViDaNet Ventelo
Ireland Poland
BT Aster
Cable and Wireless INEA
Digiweb Internetia
Eircom Multimedia Polska
Imagine Netia
O2 (Telefonica Ireland) Polkomtel
UPC PTC
Verizon PTK
Vodafone Telefonia Dialog
Italy Toya
BT Italia TP
Fastweb UPC Polska
Telecom Italia Vectra
TeleTu Portugal
Tiscali Cabovisão
Vodafone Optimus
Wind PTC
Latvia Vodafone
Baltcom ZON
32BoR (12) 30
Fixed operators Fixed operators
Romania Sweden
Ambra AllTele
BĂLEANU SERVCOM Bahnhof Unipessoal LDA
CANAL S Bredband2 AB
CCC Blue Telecom Com hem AB
Cobalt IT Ownit Broadband AB
Dial Telecom Tele2 Sverige AB
Diginet Telenor Sverige AB
Digital Cable Systems TeliaSonera AB
Electrosim Switzerland
Euro-Cable op1
Fastlink op2
GTS Telecom op3
Millenium IT op4
Nextgen Communications The Netherlands
Orange KPN
Radiocom Lijbrandt
RCS & RDS Tele2/BB Ned
Romtelecom T-Mobile/Online
TV SAT 2002 UPC
UPC Romania Vodafone
Vodafone XS4ALL
Slovak Republic Ziggo
Antik Telecom Turkey
Axalnet Smile
CondorNet Superonline
Dsi data TTnet
EHS TurkTelekom
GAYA Turksat
GTS Slovakia United Kingdom
Imafex BSkyB
Martico BT
O-NET Everything Everyhwere - Orange
Orange Slovensko Telefonica
RS NET TalkTalk
RUPKKI Virgin Media
Salamon Internet
Satro
Slovanet
SWAN
Telekom
TRNAVATEL
UPC BROADBAND
Slovenia
Amis
T-2
Telekom Slovenije
Telemach
Telemach Rotovž
Tušmobil
Telemach Tabor
Spain
Cableuropa
Jazztel
Orange
Telefonica
Vodafone
33BoR (12) 30
Mobile operators Mobile operators
Austria E-Plus
A1 Telekom Austria Kabel BW
Hutchison 3G Austria Kabel Deutschland
Orange Austria mobilcom-debitel (Freenet)
T-Mobile Austria Netcologne
Belgium Telefónica Germany
Belgacom United Internet
KPN Group Belgium Versatel
Mobistar Vodafone D2
Scarlet Belgium Greece
Bulgaria Cosmote
BTC (Vivacom) Vodafone Greece
Cosmo (Globul) WIND Hellas
Max Telecom Hungary
Mobiltel DIGI
Croatia EnterNet 2001
Hrvatski Telekom Externet
Tele 2 Invitel
VIPNET Magyar Telekom
Cyprus PR-TELECOM
Cyta Tarr Építő
Primetel Telenor Magyarország
Czech Republic ViDaNet
MobilKom Vodafone
Telefónica Ireland
T-mobile Eircom
Vodafone O2 (Telefonica Ireland)
Denmark Italy
ELRO Skyline BT Italia
Hi3G Fastweb
TDC H3G
Telenor Postemobile
Telia Telecom Italia
Estonia Tiscali
Elisa Vodafone
EMT Wind
Tele2 Latvia
Finland Bite
AinaCom Latnet Serviss
DNA LMT
Elisa Tele2
TeliaSonera Finland Telekom Baltija
France Lithuania
Bouygues Telecom BITE Lietuva
Darty Omnitel
France Télécom – Orange Tele2
Free Luxembourg
NRJ Mobile op1
Numericable op2
Omea Telecom op3
SFR op4
FYRoM Malta
ONE GO plc
T-Mobile Macedonia Melita plc
VIP Vodafone
Germany Norway
Deutsche Telekom Ice
34You can also read