Device GlobalWebIndex's flagship report on device ownership and usage - FLAGSHIP REPORT 2019 - Libranda
←
→
Page content transcription
If your browser does not render page correctly, please read the page content below

Device
GlobalWebIndex’s flagship report
on device ownership and usage

FLAGSHIP REPORT 2019

www.globalwebindex.com
Contents                         Introduction

                                 GlobalWebIndex Device Flagship places the spotlight on
Key Insights               03
                                 the latest ownership and usage trends across all major
                                 device categories, including smartphones, PCs/laptops,
Device Ownership           04
                                 smartwatches, smart homes and VR/AR.

Device Usage Trends        17
                                 Among others, this report covers the following topics in detail:

The Mobile Marketplace     24
                                 • Which devices are the most widely owned and used.

Entertainment Devices      31
                                 • H
                                    ow ownership of different devices varies across different
                                   demographic groups.
Notes on Methodology       39
                                 • H
                                    ow much time is being spent on mobiles and PCs/laptops
More from GlobalWebIndex   41
                                   and how this varies by age and region.

                                 • W
                                    hat behaviors are most likely to be taking place on mobile
                                   versus PC/laptop.

                                 • C
                                    urrent engagement with smart home devices and how this
                                   is set to grow.

                                 • W
                                    hich brands are winning in the smartphone marketplace
                                   and what users need to upgrade their current handset.

                                 • W
                                    hat devices consumers use for gaming and what is the
                                   potential of AR and VR technology.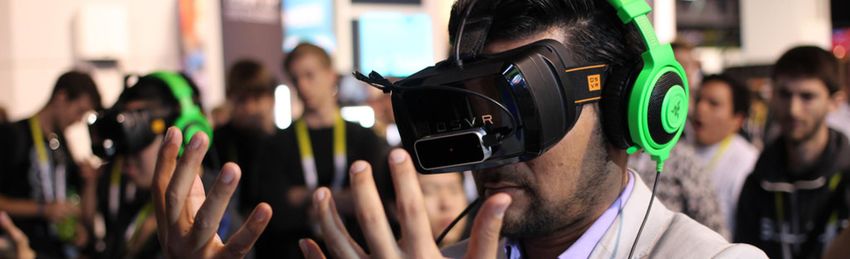
Key Insights
Mobile adoption has Smart home devices and The race between Samsung Console gaming is Virtual and augmented
reached its saturation point, voice tech are seeing and Apple is very close, stabilizing and diversifying. reality can go mainstream.
but bigger screens are still moderate growth. but Chinese brands are the
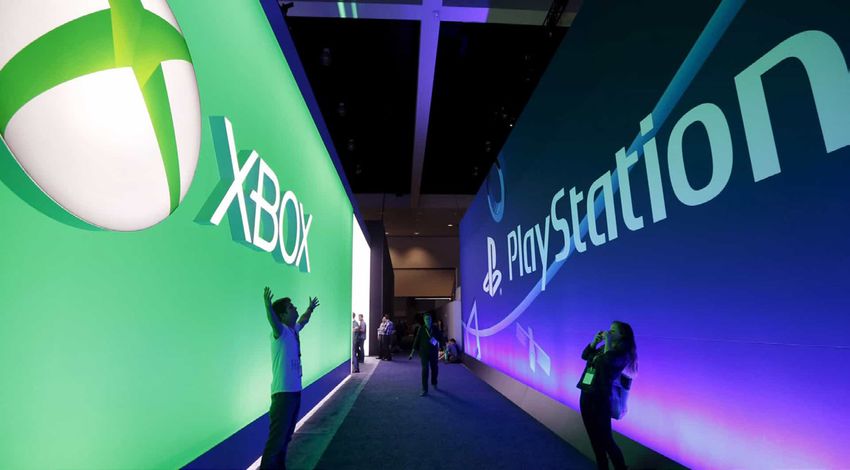
Games consoles ownership So far these technologies
relevant. ones to watch.
Smart home entertainment has been showing a (especially VR) have been
Today, 95% of internet users products have made inroads Samsung is still the most downward trend between primarily associated with
have a smartphone, up by among a large and growing popular handset brand, 2015 and 2017, but it has gaming, and this category
14 percentage points since share of internet users, but but Apple has made some remained steady at 22% in does outstrip any other use
2015. But consumers don’t global adoption remains real headway here. While the past three years. Console of AR/VR, with other forms
choose one device over relatively low at 12%. adoption of Samsung gaming is often assumed to of entertainment like films
another – they’re multi-device However, 16-24s are most handsets outside China has be male-dominated, but with or documentaries lagging
owners, having an average enthusiastic with this tech and been steady since 2015, 40% of users being female, behind. However, our data
of 3.4 different devices. a third report having a smart ownership of Apple mobiles gaming consoles aren’t shows that there’s plenty of
Moreover, looking at the home product. Voice search has risen by six percentage exclusively used by men. And scope for expansion beyond
average time users spend on usage has been on the rise in points to 27% today. Chinese while we’re seeing a decline in entertainment, with education
their devices every day, we the past two years, reaching brands like Huawei and male console gaming, female and tourism/travel proving
can see that the gap between 42% of internet users globally Xiaomi are also racing ahead representation has been particularly fruitful routes.
mobiles and bigger screens who say they have conducted and increasing their market growing since the beginning
isn’t as wide as many might a voice search within the past share on a global scale. of 2018. Video games have
presume. In 2019, online month on any device. This is Today, a full 14% of global traditionally been targeted
adults report spending only a 31% increase since the first internet users own Huawei towards men, with women and
around four minutes longer half of 2017 and sees greatest phones, with an additional ethnic minorities being largely
on mobiles than computers. uptake in the Asia Pacific 24% considering buying one. under-represented in gaming.
region. However, this approach is now
outdated and targeting in this
way is likely to mean gaming
companies are missing out
on great numbers of potential
consumers.
Device

Device Ownership

Flagship Report 2019
Device Ownership
                                                                                                                                                           Device Ownership            05

Device Ownership Over Time                                                                            RESPONDENTS SEE THE FOLLOWING
                                                                                                      DEFINITIONS / ILLUSTRATIVE EXAMPLES:
% of internet users who own the following devices
                                                                                                      e-Reader: a digital reading device,
                                                                                                      e.g. Amazon Kindle, Kobo, Nook etc

                                                                                                      Smart TV: a television that can connect
                                                                                                      to the internet

                                                                                                      Smart Wristband: a digital wristband which
                                                                                                      typically tracks your health and fitness levels,
                                                                                                      e.g. Nike Fuelband, Jawbone Up, Adidas miCoach

                                                                                                      Smartphone: a smartphone allows you to connect
                                                                                                      to the internet and download apps, e.g. an iPhone
                                                                                                      or Android phone such as the Samsung Galaxy S10

                                                                                                      Smartwatch: a watch which allows you to connect
                                                                                                      to the internet and use apps, e.g. Pebble, Samsung
                                                                                                      Galaxy Gear and the Apple Watch

                                                                                                      Tablet: Popular examples include an Apple iPad,
                                                                                                      Samsung Galaxy Tab, Microsoft Surface,
                                                                                                      Google Nexus tablet

                                                                                                      TV streaming device: a digital media device which
                                                                                                      streams web content to your TV set, e.g. Apple TV,
                                                                                                      Amazon Fire TV Stick, Google Chromecast, Roku
                                                                                                      Streaming Player

                                                                                                      VR headset/device: A device that immerses users
                                                                                                      into simulated environments, e.g. PlayStation
                                                                                                      VR, Samsung Gear VR, Google Cardboard and
                                                                                                      Deepoon VR.

Being virtually universally owned on a global scale, it’s well-   Tablets have lost the momentum they’d enjoyed in the years after
known that smartphones have transformed online behaviors.         their launch. Adoption peaked in 2015 and has since inched
Today, 95% of internet users have a smartphone, up by 14          lower year on year, reaching 37% in 2019. Games consoles have
percentage points since 2015.                                     also been showing a downward trend between 2015 and 2017,
                                                                  but they have remained steady at 22% in the past three years.
Over the same time period, PC/laptop ownership has declined by    The rising popularity of mobile gaming, the increasing cost of                           Question: Which of the
                                                                                                                                                           following devices do you own?
18 percentage points. However, we’re not in a post-PC era yet –   consoles and a longer upgrade cycle are all having an impact here.                       Source: GlobalWebIndex
                                                                                                                                                           Q1 2015 − Q1 2019
7 in 10 global internet users own one in the beginning of 2019,   However, consoles remain popular in North America and in some                            Base: 1,392,778 Internet Users
ranging from 90% in Russia to 22% in Morocco.                     parts of Europe, where 4 in 10 respondents reported owning one.                          aged 16-64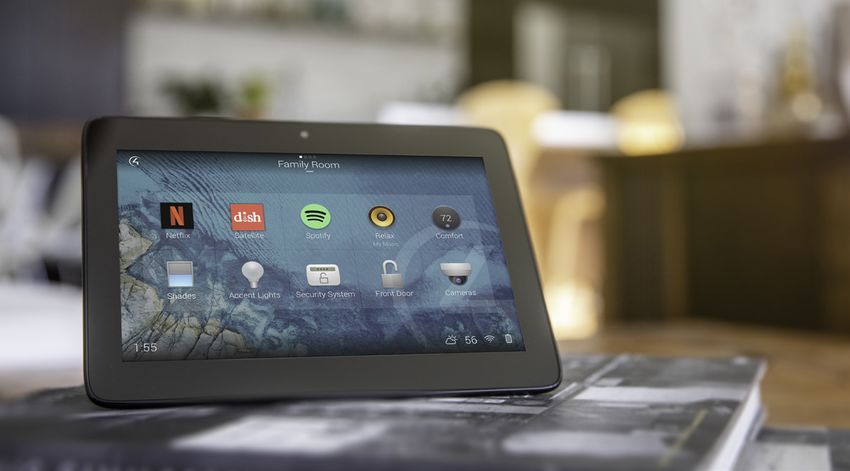
Device Ownership
                                                                                                                                                Device Ownership           06

Device Ownership
% of internet users who own the following devices

AVERAGE NUMBER OF DEVICES OWNED                     Consumers don’t choose one device             All that said, digital consumers don’t
                                                    over another – they’re multi-device           necessarily choose one device over another.
TOTAL                                  3.4          owners, having an average of 3.4              Rather, they have broad device portfolios,
                                                    different devices.                            owning an average of 3.4 of the 11
16 to 24                               3.2                                                        devices listed in the chart on page 5.

25 to 34                               3.5                                                        In the Markets Insights infographic at the
                                                    Although owned by only 13% of online
                                                                                                  end of this chapter, we look at how the
                                                    users, smartwatch adoption has grown
35 to 44                               3.5                                                        ownership of PCs, smartphones, games
                                                    the most since the first half of 2016. This
                                                                                                  consoles and smart home products varies by
45 to 54                               3.3          figure varies strongly by market though,                                                    Question: Which of the
                                                                                                                                                following devices do you own?
                                                                                                  market.
                                                    and it jumps to 19% in Hong Kong and 18%                                                    Source: GlobalWebIndex
                                                                                                                                                Q4 2018 − Q1 2019
55 to 64                               3.1          in India.                                                                                   Base: 278,359 Internet Users
                                                                                                                                                aged 16-64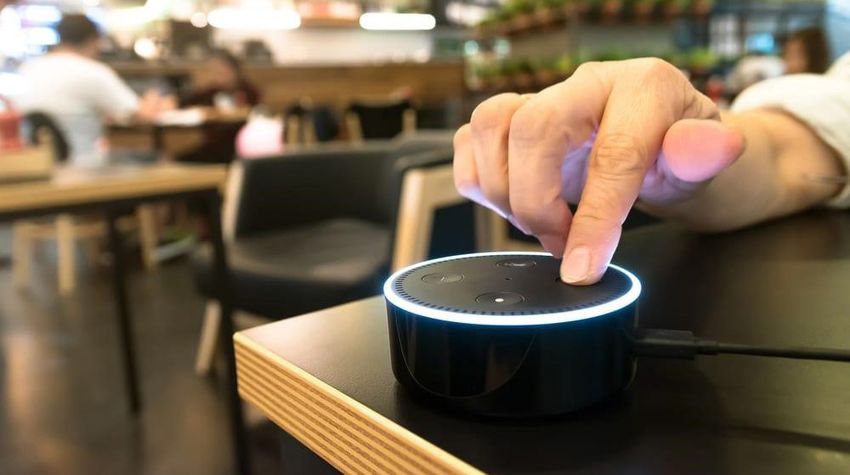
Smartphones vs PCs & Laptops
                                                                                                                                                        Device Ownership           07

Smartphones vs PC/Laptops | Region                                                                  Smartphones vs PC/Laptops | Age
% of internet users who own the following devices                                                   % of internet users who own the following devices

Smartphones have reached a 25-point                 Meanwhile, PC ownership is ingrained
lead over the bigger screens globally, but          in regions characterized by developed
it’s essential to take a regional perspective       markets like Europe and North America,
                                                                                                            Today, smartphones
here. The smartphone’s lead is particularly         where internet users likely first came online           have a lead over PCs
pronounced in the Middle East and Africa            via PCs and where online populations tend               and laptops in all 45
where virtually everyone has a smartphone           to skew older. Nevertheless, smartphones                markets we track.
and just over half have a computer. The             are leading over PCs and laptops in all
                                                                                                                                                        Question: Which of the
centrality of the mobile here is mainly down to     45 markets we track today.                                                                          following devices do you own?
the important role the smartphone has played                                                                                                            Source: GlobalWebIndex
                                                                                                                                                        Q4 2018 − Q1 2019
in the development of the internet landscape.                                                                                                           Base: 278,359 Internet Users
                                                                                                                                                        aged 16-64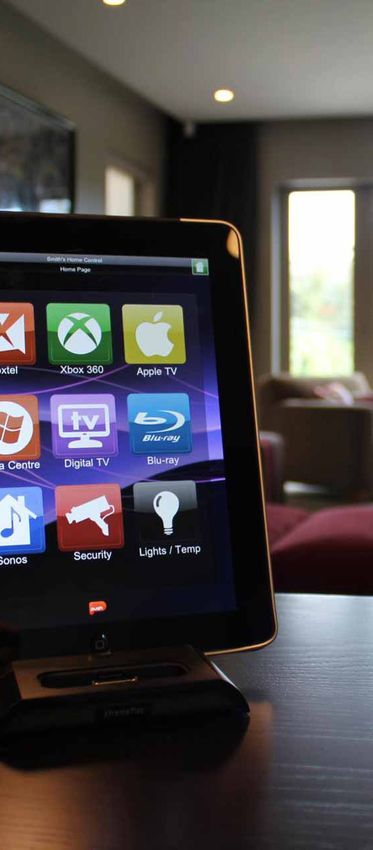
Smartwatches
                                                                                                                                                  Device Ownership           08

Profiling Smartwatch Owners
% of smartwatch owners who are…

The smartwatch market is still yet to fully
take off. They still come across as having
                                               They’re 52% more likely than the average
                                               internet user to fall into our cosmopolitan
                                                                                               51%
unjustified high price tags for the few        attitudinal segment, meaning that they          more likely to buy a product/service simply for
apps and functionalities they offer that set   are interested in other countries, like to      the experience of being part of the community
them apart from a smartphone. Globally,        be surrounded by different cultures and
just 13% of online adults say they have        lifestyles and explore the world around         39%
a smartwatch. The average smartwatch           them. On top of that, they have an above-
owners are most likely full-time working men   average tendency to keep up with the latest     more likely to keep up with the latest fashions

in their early thirties with high income.      fashions and to have the latest technological
                                               products.                                       38%
                                                                                               more likely to say that having the latest          Question: Which of the
                                                                                                                                                  following devices do you own?
                                                                                               technological products is very important to them   (Smartwatch)
                                                                                                                                                  Source: GlobalWebIndex
                                                                                                                                                  Q4 2018 − Q1 2019
                                                                                                                                                  Base: 278,359 Internet Users
                                                                                                                                                  aged 16-64 and 34,046
                                                                                                                                                  Smartwatch Owners aged
                                                                                                                                                  16-64
Smartwatches
                                                                                                                                                       Device Ownership          09

                                                                                                      smartwatch market at 52%, while Samsung
% of internet users who are smartwatch owners in the following regions                                lags behind at 23%. With rumors of the
                                                                                                      Apple Watch 5 running the brand new
                                                                                                      watchOS 6 software as well as featuring new
                                                                                                      apps and improved microphones among
                                                                                                      other features, we’re likely to see more
                                                                                                      consumers lured to this brand.

                                                       Europe
                                                        10%                                                  Apple is by far the
                  North Am                                                                                   dominant smartwatch
                    12%                                             APAC
                                                                    15%
                                                                                                             brand in the UK and
                                                 MEA                                                         U.S. among smartwatch
                                                 10%                                                         owners.
                              LatAm
                               8%

                                                                                                       Smartwatch Brands: Apple vs. Samsung
                                                                                                       % of smartwatch owners in the UK and the U.S.
                                                                                                       who own the following smartwatch brands
The extent of the smartwatch uptake differs           Outside of APAC, we see a strong uptake in
by region though. The headline figure is              North America at 12%, which is particularly
driven by Asia Pacific (15%), particularly            down to the popularity of the Apple brand.
by high adoption in Hong Kong (19%) and               The Apple smartwatch is owned by 61% of
India (18%). The reason for that is mainly            smartwatch owners here and this figure has
because in Asia the term ‘smartwatch’                 only been growing and it’s likely to continue
encompasses a range of devices, some of               to do so.                                                                                        Question: What brand is
                                                                                                                                                       your smartwatch?
which retail for as little as $20.                                                                                                                     Source: GlobalWebIndex
                                                      Despite a somewhat lower adoption, Apple                                                         Q4 2018 − Q1 2019
                                                                                                                                                       Base: 34,046 Smartwatch
                                                      is also the dominant player in the UK                                                            Owners aged 16-64
Smart Home Devices
                                                                                                                            Device Ownership           10

                     Smart Home Product Owners
                     % of internet users in each region who say they own a smart home product

                     Although a lot has been written on smart             Adoption also varies by region and it’s
                     home appliances and their functionality, the         highest in North America (17%) and lowest
                     global adoption of smart home products               in MEA (6%). In fact, it is estimated that more
                     remains relatively low at 12%. However,              than 63 million homes in North America            Question: Which of the
                                                                                                                            following devices do you own?
                     looking at younger demographics reveals              will be smart by 2022, or 44% of all homes        Source: GlobalWebIndex
                     a different picture – more than a third of           in the region.                                    Q4 2018 − Q1 2019
                                                                                                                            Base: 278,359 Internet Users
                     16-24s have a smart home product.                                                                      aged 16-64
T R E N D I N AC T I O N
Smart Home OS 3 makes smart
homes more intuitive
One peril that stands on the way of universal smart home adoption is the fact that it’s
usually difficult to navigate a smart home seamlessly when different devices come from
various companies and operating systems.
This is where global provider of automation and networking systems for homes and
businesses, Control 4, comes into play to change that. Its latest product, the Smart
Home OS 3, can control more than 13,500 third-party devices. It allows users to monitor
all smart home products via a dashboard, thus easing the fatigue they might feel as a
result of not being able to track all devices that make their home smart.Smart Home Devices
Device Ownership 12
Smart Home Products Ownership
% of smart home product owners who own the following devices
Older smart home
product owners are
more likely to own a
smart speaker than their
younger counterparts.
The reality is that voice assistants are the
perfect tool for older people. It helps
those with limited mobility in their daily
tasks, facilitates quick emergency calls, and
allows for an easy set-up of reminders. And
although people having those needs might
be older than 64 years, similar to tablets,
we do see strong adoption of household
devices here as well. Older people have
even become Amazon Echo’s target
demographic in commercials as they often
feature grandparents being introduced to
With their promise of Star Trek-style “computer, tell me–” functionalities, immediacy and ease the technology by their grandchildren.
of use, voice assistants are the most commonly owned smart home devices among smart
home product owners. They’re heralded as the future of everything from search to shopping. Smart utility products are the second-most
prominent devices among smart home
What’s interesting here though is that older people are more likely to own a smart speaker product owners, which again sees strong
than their younger counterparts, with 2/3 of 55-64-year-old smart home product owners uptake with older demographics. 42%
having one. And while many would think that’s down to them being more affluent, this trend of 55-64s own one compared to 35% Question: Which of these smart
remains even when we look at high-income earners. of 16-24s. home devices do you own?
Source: GlobalWebIndex
Q1 2019
Base: 17,096 Smart Home
Product Owners aged 16-64Voice Tech
Device Ownership 13
Voice-enabled search is a keystone habit Mobile Voice Search We see large regional disparities in the
that consumers will have to embrace if % of internet users who have used voice search or voice adoption of voice technology. Use of
assistant devices are to achieve mass command tools (e.g. Siri, Cortana) in the last month on… search ranges from 27% in Europe to
adoption. Brands are keen to understand 49% in APAC. Most importantly, with
whether they need to integrate with voice Any device Mobile PC/Laptop Tablet its higher mobile penetration as well
before it’s too late, and it’s becoming as young and affluent internet users,
clear that this is a trend which has the TOTAL 42% 32% 14% 6% there’s a wider openness to new tech in
potential to reshape entire industry the APAC region generally. 6 in 10 here
Increase since H1 2017 +31% +39% +17% +50%
landscapes. say having the latest technology is very
important to them, versus just a third in
Today, 42% of the global online AGE Europe.
population say they have conducted
16-24 50% 39% 16% 5%
a voice search within the past month But for voice technology to achieve
on any device, which represents a 31% mainstream adoption, it needs to
25-34 48% 36% 17% 7%
increase since the first half of 2017. For find better ways of monetization
many consumers, their introduction with 35-44 41% 30% 15% 6% that go beyond paid features. In that
voice command tools has been via their respect, voice assistants are poised
mobile, but computers and tablets have 45-54 30% 22% 10% 5% to incorporate advertising or product
also seen an increase of voice search in recommendations in the near future
the past two years. 55-64 23% 17% 8% 3% to prove their worth. But with a
significant number of consumers
Unsurprisingly, our data shows that the already disillusioned with the state
REGION
younger the internet user, the more likely of advertising online, will they be
they are to be engaging with voice search, APAC 49% 36% 17% 6% receptive to commercial messaging
especially on smartphones. But across delivered via voice assistants? This is
each age group, there’s been an increase Europe 27% 20% 9% 4% a challenge that needs to be tackled,
in the numbers searching via voice perhaps through contextual targeting,
commands. Almost all mid-to-premium- Latin America 39% 30% 15% 5% if the mistakes that originally led to ad- Question: In the past month,
end mobiles now have integrated voice blocking are to be avoided. which of the following things
Middle East & Asia 36% 28% 12% 4% have you done on the internet
assistants, and their capabilities continue via any device?
Source: GlobalWebIndex
to become more sophisticated with each Q4 2018 − Q1 2019
North America 35% 27% 10% 6%
new generation of handset. Base: 278,359 Internet Users
aged 16-64T R E N D I N AC T I O N
Amazon staying ahead of the curve by
introducing Alexa in-skill purchasing
Amazon, Google and Apple are locked in a battle to dominate voice tech on the hardware
side and are investing heavily into artificial intelligence. Looking to maximize profits from
different streams, Amazon in particular, has a vested interest in making sure owners of smart
speakers are using them to buy products on its proprietary retail platform.
To do this effectively, Amazon’s long-running investments in different industries are now
being connected through its foray into voice. And the opening up of “skill” and “command”
building to third-party developers has helped to prove its usefulness in many areas of
day-to-day lives. Alexa currently features 80,000 voice skills, with the latest development
being the ability to make in-skill purchases. This was mainly introduced to give a monetary
incentive to developers to continue making voice skills for the device. This means that there
is now more than one way to generate revenue from voice apps – via in-skill purchasing and
Amazon Pay for Alexa Skills.Market Insights: Device Ownership Around the World
Market Insights: Device Ownership Around the World
Device

Device Usage Trends

Flagship Report 2019
PCs vs. Smartphones
                                                                                                                      Device Usage Trends         18

We’ve been talking about the Mobile Tipping         Daily Time Spent Online: PC vs Mobile
Point for quite some time now, and we can           Average time spent online per day in h:mm on…
finally say that we’ve reached it. Looking at
the average time users spend on their devices
every day, we can see that in 2019 online
adults spend around four minutes longer
on mobiles than bigger-screen devices. This
means that daily online time is more or less
equally divided between the two devices, but
mobiles do take precedent.

However, with 3 hours 23 minutes spent on
computers, mobile-only strategies shouldn’t
yet be the default. A likely scenario is that PC/
laptop usage will fall to a stable level that’s
sustained by productivity and demanding
hobby use, like professional use, gaming or
picture editing.
                                                    Share of Daily Time Spent on PC vs Mobile
The importance of desktops is especially
prevalent when we focus on older
demographics. 55-64s are still spending an
hour and a half longer on devices other than
their smartphones. It isn’t so much that they
spend a lot of time online on their PCs though;
in fact, they tune for around 20 minutes less
than their younger counterparts, 16-24s.
Rather, this is largely driven by the low usage                                                                       Question: On an average day,
of mobiles among this group, meaning that                                                                             how long do you spend online
                                                           Device choice is dictated by needs and context of usage.   on a mobile/PC/laptop/tablet?
PCs command a relatively larger share of their                                                                        Source: GlobalWebIndex
                                                                                                                      2013 − 2019 (averages of all
device usage.                                                                                                         waves conducted in each year)
                                                                                                                      Base: 1,717,699 Internet Users
                                                                                                                      aged 16-64
PCs vs. Smartphones: Time Spent Online
Device Usage Trends 19
Daily Time Spent Online by Age
Average time spent online per day in h:mm on…
Users vary in the importance they attach to
their devices. Brands need a multi-device
strategy to reach consumers across different
demographics and regions.
It’s important to take a regional perspective here as well. Although the
smartphone (unlike the PC) is universally owned across all regions we
track, internet users in North America and Europe still spend longer
on their computers. This is mostly pronounced in the former, where
online adults spend 61% of their online time on PCs every day.
All this being said, speaking of a shift to mobile or mobile transition
Daily Time Spent Online by Region
can be misleading. Rather, people are spending more and more time
Average time spent online per day in h:mm on…
online as they’ve added mobiles as another part of their life. Mobiles,
tablets, e-readers have come in as second screens, much as TV
supplemented cinemas, and cinemas supplemented radio and theater.
Relative importance shifts, but all in all media consumption continues to
rise – especially among higher income groups.
This means that while mobile usage may be cannibalizing time
spent on computers to some extent, they should be seen more as a
complementary screen serving a different purpose, and one which can be
used on the go. But as smartphones have risen in importance, and they
have become present in a wider range of contexts compared to stationary
Question: On an average day,
and big-screen units, more behaviors have become mobile-first. how long do you spend online
on a mobile/PC/laptop/tablet?
Source: GlobalWebIndex
Q4 2018 − Q1 2019
Base: 278,359 Internet Users
aged 16-64Digital Wellbeing
Device Usage Trends 20
As we mentioned, the time people spend consuming Screen Time Tracking by Region
digital media is only increasing with no prospect of a % of internet users who have tracked their screen time or set limits for apps in the past month
saturation point anytime soon. Globally, online time
has reached an average of 6 hours and 49 minutes
per day on computers, tablets, laptops and mobiles
combined. This is around half an hour longer than
what internet users were devoting three years
ago. At the same time, device portfolios are also
expanding, with internet users owning an average of
3.4 different devices today. Europe
16%
Inevitably, people are spending longer looking at North Am
17% APAC
screens, which has had implications for their health 25%
and wellbeing and they’re becoming increasingly
MEA
conscious of the perils of excessive use of technology. 26%
With so many devices and more and more time spent
LatAm
online, digital consumers are feeling the need to limit 23%
their screen time as a result. 23% have tracked their
screen time or set limits for certain apps in the past
month, rising to 28% among 16-24s. And although
this figure decreases with age, a substantial proportion
(13%) of the 55-64s are still conscious of their screen
time and have taken action to limit it. Screen Time Tracking by Age
Unsurprisingly, regions characterized by fast-growth
markets like APAC and MEA, show the highest
screen-time tracking figures, as the mobile here has
been long established as the primary device to go
online, and is used for 3h 25m and 4h 13m every day, Question: Which of these have
you done on your mobile in
respectively. the last month?
Source: GlobalWebIndex
Q1 2019
Base: 139,397 Internet Users
aged 16-64PCs vs. Smartphones: Online Activities
Device Usage Trends 21
Top 10 Mobile-First Behaviors Top 5 Mobile-Only Behaviors
% who have done the following on % who have done the following online
the internet in the past mont via… %−POINT activities exclusively in the last month
MOBILE PC/LAPTOP DIFFERENCE
Used a chat or instant messaging service/app 86% 34% 52
Used a map or directions service/app 73% 26% 47
Uploaded/shared a photo 60% 27% 33
Checked the weather online 61% 31% 30
Watched a video clip or visited a video-sharing site 85% 60% 25
Uploaded/shared a video 47% 23% 25
Used an app/website to order hot/take-away food for delivery 40% 16% 24
Used an internet banking service 57% 34% 23
All online behaviors we track
Used a VoIP or other service to make phone calls over the internet 36% 14% 21
are now mobile-first.
Visited a news website/app/service 68% 47% 20
Today, all of our 35 online activities surveyed are more commonly undertaken on Looking at older demographics reveals a different
mobile devices. Social media related behaviors are firmly mobile-first and are picture though. 55-64-year-olds are still more
increasingly becoming mobile-only. There’s a 52-percentage-point difference in chat- likely to conduct most commercial activities, like
app usage between mobiles (86%) and PCs (34%) and 53% report doing this activity purchasing products online or visiting retail stores,
exclusively on their mobiles. This is primarily due to smartphones allowing consumers predominantly on a computer. Tablets are also a Question: In the past month,
which of the following things
to dip in and out of different messaging apps whenever and wherever they please. prominent device for this group. They’re more have you done on the internet
via any device?
Mobile figures are also strong for behaviors like using maps, banking services, and likely to choose tablets over PCs and mobiles to Source: GlobalWebIndex
engaging with videos – with many most likely doing these things while on the move. post reviews about products and to watch sports Q4 2018 − Q1 2019
Base: 230,366 Internet Users
coverage online. aged 16-64PCs vs. Smartphones: Engagement with TV
Device Usage Trends 22
TV Behaviors by Device
% of internet users who have done the following in the past month
Globally, mobiles have reached near parity
with PCs as the go-to device for TV watching.
Mobiles are now at the center of most entertainment behaviors as
well. They have reached near parity with PCs for watching TV, and the
gap between the two devices is likely to continue growing in favor of
smartphones.
This is, in part, due to the growing adoption of streaming sticks (as
illustrated in the chart on page 5) and the role they’ve played in enabling
mobiles to serve yet another purpose, namely as TV devices. Sticks
like Google’s Chromecast allow users to share almost anything — films,
personal photos, YouTube videos, Netflix shows and more — to their
TV. Today, 15% of online adults own a streaming stick, and 29% have
watched content on a TV by casting it via their phone in the past month.
% of internet users outside China who have watched these
services on the following devices in the past 30 days Globally, watching streaming services like Netflix has also turned to
a mobile-first activity, but this trend doesn’t hold on a regional level.
Internet users in all regions, except for APAC, are still more likely
to watch subscription services on their PCs than on mobiles. This
is especially the case in Europe and North America, where PCs still
command a nine-percentage-point lead over mobiles. In Latin America,
they have reached near parity, while in Asia Pacific mobiles are eight-
Question: In the last month,
percentage points ahead of computers for this activity. Looking at which of these services have
engagement with Netflix and Amazon Prime Video outside China, you used to watch / download
TV shows, films or videos?
we see that there are minimal differences between the two devices. Source: GlobalWebIndex
Q4 2018 − Q1 2019
However, online adults in MEA are more likely to watch Amazon’s Base: 119,139 internet users
service on phones than PCs, while watching Netflix remains a aged 16-64 and 110,625
internet users outside China
computer-first activity here. aged 16-64Market Insights: Device Usage Around the World TIME SPENT ONLINE ON: AVERAGE NUMBER OF DEVICES OWNED
Device

The Mobile Marketplace

Flagship Report 2019
Length of Mobile Ownership
                                                                                                                     THE MOBILE                     25
                                                                                                                     MARKETPLACE

Despite the constant release of new handset        Length of Mobile Ownership
models, most consumers are upgrading at            % who say they have had their current mobile phone for…
a relatively leisurely pace. But this is a trend
mostly associated with regions characterized
by mature markets. 25% of internet users
in North America have had their mobile
longer than two years, for example,
compared to just 14% in APAC and LatAm.

Fast-growth markets and regions hold               By Region
the key to renewed smartphone sales                % who have had their current mobile phone for more than 2 years
for phone manufacturers. Economic and
population growth as well, as well as
growing internet penetration rates, have
increased the urgency of reaching mobile
consumers in China, where global brands
are facing strong competition from local
providers. Internet users here are also
among the most likely to be in the market
for a new phone in the next year (73%).

        Mobile adoption has reached its
        saturation point in Europe and
        North America and around a
        quarter have had their mobile for
        over two years.                                                                                              Question: How long have
                                                                                                                     you had your current mobile
                                                                                                                     phone for?
                                                                                                                     Source: GlobalWebIndex
                                                                                                                     Q4 2018 − Q1 2019
                                                                                                                     Base: 230,366 Internet Users
                                                                                                                     aged 16-64
Mobile Upgrade Cycle
THE MOBILE 26
MARKETPLACE
Mobile Purchase Timeframe By Region
% who say they plan to buy a new mobile % who say they plan to buy a new mobile phone or upgrade within the next 12 months
phone or upgrade their existing phone…
TOP 5 MARKETS
China 73%
Mexico 68%
At any given time, around 3 in 10 digital The regional data confirms the slow upgrade cycles in North
consumers are planning to upgrade or buy America and Europe. Only 43% of users in the former plan to Nigeria 67%
a new phone within the next 6 months. purchase a new phone in the next year, versus 65% in APAC.
Men are slightly more likely than women to In markets with high internet penetration and smartphone Vietnam 67% Question: When do you plan
to buy a new mobile phone or
say so, as are 25-34s and those in the top adoption rates, efforts need to focus on giving upgraders good upgrade your existing phone?
Colombia 65% Source: GlobalWebIndex
income quartile. enough reasons to trade in their existing handsets. Q4 2018 − Q1 2019
Base: 278,359 Internet Users
aged 16-64Handset Brands
THE MOBILE 27
MARKETPLACE
Top 10 Mobile Handset Brands
% outside China who have owned, own and want to own the following handset brands
Samsung is still the most popular handset brand, but Apple has Samsung’s most prominent model today is the Galaxy J5 owned by
made some real headway here. While adoption of the former 8% of Samsung owners outside China, while the Galaxy S9 remains
outside China has been steady since 2015, ownership of the latter somewhat behind at 5%.
has risen by six percentage points in the same timeframe, when in
2015, 34% owned a Samsung versus 19% who had an iPhone. For purchase intention, Samsung is again far ahead of Apple, with
half of internet users outside China considering it as their top
It’s important to note that with its relatively cheap price tags, Huawei choice for next upgrade. On a market-level, users seem consistent
and Xiaomi have also managed to race ahead, taking third and in their choices for current ownership and future upgrade, with
fourth place respectively, even outside their home market – China. the exception of Egypt where the top handset brand owned at the
moment is Samsung, but a higher share of users say they’d prefer Question: Which of the
Looking at specific handset models, we can see that relatively older following mobile brands have
iPhone for future upgrade. you previously owned? //
versions like the iPhone 6s remain prominent, with 13% of iPhone Which of the following mobile
owners outside China having it. This reflects consumers’ tendency to brands do you currently own? //
Apple also seems to have a slightly more loyal consumer-base than Which brand(s) would be your
wait 1-2 years before upgrading to a newer model. However, even top choice when you next
Samsung. 85% of iPhone owners say they would upgrade to another upgrade or buy a new phone?
though adopted by only 8%, the X model has managed to outpace
iPhone, compared to 81% of Samsung owners who say the same Source: GlobalWebIndex
the 8, showing the amount of excitement that Apple created around Q4 2018 − Q1 2019
about Samsung. Base: 247,879 Internet Users
its 10-year anniversary model. aged 16-64 outside ChinaThe Mobile Market in China
THE MOBILE 28
MARKETPLACE
Chinese brands like Huawei and Xiaomi have Top 5 Mobile Brands in China
considerably increased their market share on a % in China who have owned, currently own and want to purchase the following handset brands
global scale. Today, a full 14% of global internet
users own a Huawei phone, with an additional
24% considering buying one. Although Huawei
has been bolstered by Chinese government efforts
to support domestic brands, expansion hasn’t only
been limited to the mainland.
However, this expansion and the brand’s close
links with the Chinese government haven’t been
met favorably by Western governments. After the
U.S. government banned U.S. companies from
doing business with Huawei, the future of the
brand in the West remains uncertain. Following
this decision, Google moved on to effectively ban
Huawei from access to key Android apps, while
Microsoft removed Huawei’s MateBook X Pro from
its store shelves.
Huawei is about to replace the iPhone as the top mobile
brand for current ownership in China.
Within China, the iPhone is still more popular than
Huawei for current ownership, but this is reversed
when we look at what phone consumers want in the
future. Apple has had big ambitions for the Chinese
market – where a mobile-first, affluent middle-class
internet population has become a key target, but Question: Which of the
following mobile brands have
as reported by Bloomberg, blowback from Trump’s you previously owned? //
Which of the following mobile
Huawei ban could cost Apple around 3-5% of its brands do you currently own? //
iPhone sales in China over the next year. Which brand(s) would be your
top choice when you next
upgrade or buy a new phone?
Source: GlobalWebIndex
Q4 2018 − Q1 2019
Base: 30,480 Internet Users
in China aged 16-64What it takes to upgrade
THE MOBILE 29
MARKETPLACE
The next generation mobile phone Future Smartphone Features Upcoming smartphone ranges promise
network is already here, with Ericsson % the U.S. and the UK who say they want to see the to take smartphone capabilities to a new
estimating that 5G networks are set to following features in upcoming smartphones level. Sony is reportedly working on a 5G
cover more than 40% of the world’s foldable Xperia F phone in efforts to stay
population by 2024. 5G connectivity competitive with Samsung’s Galaxy Fold
promises to revolutionize not only — a nearly $2,000 foldable smartphone –
smartphone capabilities, but also the whose release was delayed due to early
capabilities of any other connected issues. Meanwhile, Huawei has also
device, be that a watch, a car or a announced a foldable phone costing
household appliance. The major mobile around $2,600.
brands have already launched their 5G
smartphones, while 5G powered laptops Our research shows that foldable devices
are just around the corner. are important for consumers in the UK
and the U.S. who plan to upgrade soon.
A bespoke study we ran in December last A third of those who plan to upgrade
year shows the majority of consumers in within 6 months and almost a fifth of
the UK and the U.S. intend to switch to consumers planning an upgrade in the
a 5G network on their smartphone, with next year say they’d like to see foldable
nearly 4 in 10 saying they’ll switch as phones coming next. Holographic
soon as one becomes available. projections is another feature that 32% of
6-month upgraders and 22% of yearly-
Against the backdrop of longer handset upgraders, would like to see in upcoming
upgrade cycles and with 90% of smartphone devices.
consumers here saying that the latest
smartphone models are too expensive, And while consumers don’t necessarily
manufacturers need to position themselves know what the benefits or use cases of
on the leading edge of the industry to these features are, we can see that this
capture consumer attention, justify prices doesn’t mean there isn’t a market for them.
and maintain an image of innovation. Question: What features
would you most like to see in
upcoming smartphone devices?
Source: GlobalWebIndex
December 2018
Base: 1,421 (U.S.A.) & 1,610
(UK) Internet Users aged 16-64Market Insights: Mobile Brands Around the World
Device

Entertainment Devices

Flagship Report 2019
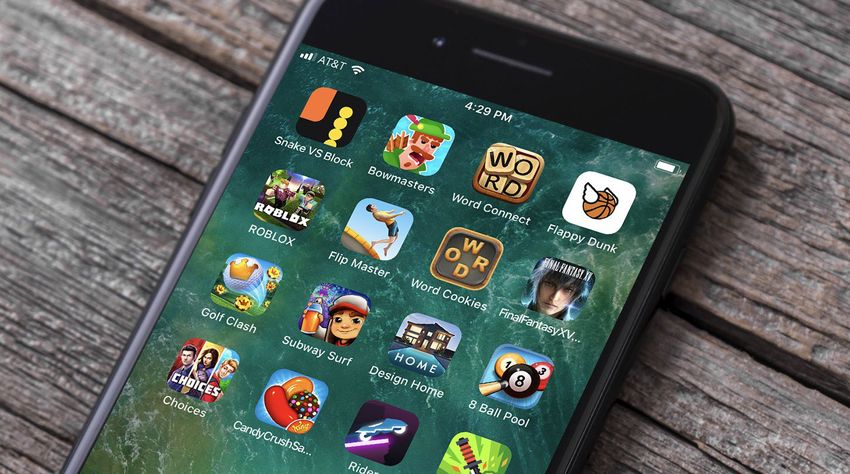
Gaming Devices
                                                                                             ENTERTAINMENT              32
                                                                                             DEVICES

Gaming Devices Over Time
% who use the following devices to play games

                                                Smartphones are now significantly ahead
                                                of other devices online adults use for
                                                gaming globally. In the beginning of 2019,
                                                72% of consumers said they use their
                                                smartphones to play games, up by nine
                                                percentage points since 2015.

                                                This shift has progressed particularly in
                                                the key Asian markets, where console and
                                                handheld device gaming never reached
                                                the same level of penetration compared       Question: Which of these
                                                                                             devices do you use to play
                                                to other regions. Even today, after the      games?
                                                                                             Source: GlobalWebIndex
                                                decrease of console gaming, we still see a   2015-2019 (averages of all
                                                10-percentage-point gap between APAC         waves conducted in each year)
                                                                                             Base: 809,605 Internet Users
                                                (23%) and North America (33%).               aged 16-64
T R E N D I N AC T I O N
Is there choice fatigue in mobile gaming?
‘Choice fatigue’ is seen as a well-known phenomenon in psychology and economics. The phrase
describes the negative psychological, emotional, and behavioral effect of having too many options
to choose from.
Mobile gaming has become so mainstream that the challenge has moved on from how to get
people playing their games on their smartphones. Instead, it lies in figuring out how to provide more
compelling content, and above all, how to monetize it. A quick browse on a mobile app store will
reveal the wealth of options when it comes to mobile gaming, and the lion’s share are free-to-play.
The abundance of choice is manifested in players’ behavior and preference: just 17% of our global
audience have paid for a mobile game in the past month.
In response to this trend, Samsung is entering into a “multi-year strategic partnership” with AMD via
which the smartphone brand will introduce advanced graphics technologies and solutions in order
to enhance innovation across mobile applications. In particular, the aim is to bring AMD’s Radeon
graphics architecture to Samsung’s smartphones and revolutionize the mobile gaming experience.Console Brands
ENTERTAINMENT 34
DEVICES
Console Brands
% of console gamers who own/are interested in purchasing/would recommend the following console brands
Console gamers see a higher Video games have traditionally been PlayStation 4 remains the strongest
representation among 25-34-year-old targeted towards men, with women console brand in the three categories
internet users (36%), and mid (48%) and ethnic minorities being largely we track – current usage, future
to high-income (29%) groups. They’re under-represented in gaming. purchase and advocacy. It’s also
most likely male (60%), but with However, this approach is now the most prominent brand in 37 of
40% being female users, gaming outdated and targeting in this way our 45 tracked markets, with highest
consoles certainly aren’t exclusively is likely to mean gaming companies penetration among console gamers
used by men. And while we’re seeing are missing out on great numbers of in Saudi Arabia (65%).
a decline in male console gaming, potential consumers.
female representation has been
Question: Which of these
growing since the beginning of 2018. devices do you use for gaming?
Which would you be interested
in purchasing? Which would
you recommend to others?
Source: GlobalWebIndex
Q4 2018 − Q1 2019
Base: 35,027 Console Gamers
aged 16-64T R E N D I N AC T I O N
Microsoft and Sony teaming up to join
the battle for cloud gaming dominance
Amazon, Microsoft, Sony and Google are in the midst of an intense battle for dominance in
the cloud gaming market. Amazon has kept rather more quiet about its ambitions, although
we could see the release of games on a new service as early as 2020. Google, on the other
hand, is releasing Stadia this year – its new cloud gaming platform that will stream video
games across a wide variety of devices. Stadia will come with its dedicated game controller,
which would link to multiple devices.
Meanwhile, the two rivals, Sony and Microsoft, decided to team up and develop new cloud
solutions for Microsoft's Azure, where Sony will host some of its game services. This partnership
doesn’t mean that the companies are abandoning consoles though. Sony already revealed
some details about PlayStation 5, while Microsoft is reportedly planning to launch a cheaper
cloud-based version of the Xbox One.Will AR & VR go mainstream?
ENTERTAINMENT 36
DEVICES
Prices are lowering and wires are disappearing – VR standalone Top 5 AR Features
headsets are set to grow and there’s more companies like Oculus % of AR users in the UK and the U.S. who say
getting in on the action. Offering premium experiences at a more they most like to see AR applied to the following
affordable price, without the need for a high-end PC or smartphone,
it was these untethered headsets that caused VR headset sales to
rebound in the last quarter of 2018, per IDC’s statistics.
AR and VR technology usually attracts similar audiences: they’re
typically young, male, affluent, and tech-savvy. In a bespoke study
we conducted in January 2019, we found that around 50% of
internet users in the UK and the U.S. have used AR/VR technology. Question: Which of the
However, AR and VR content can come in many forms, and this below would you like to see
augmented reality or AR more
could be a cause for confusion. There’s still not much clarity over applied to?
Source: GlobalWebIndex
whether consumers are aware these tools are available to them, or if January 2019
they realize they’re engaging with AR or VR when they use them. In Base: 1,313 AR Users and
1,254 VR Users aged 16-64
fact, 12% of online adults have used AR without knowing. in the UK and the U.S.Will AR & VR go mainstream?
ENTERTAINMENT 37
DEVICES
Top 5 VR Features So far these technologies (especially VR) have been primarily
% of VR users in the UK and the U.S. who say associated with gaming, and this category does outscore any
they most like to see VR applied to the following other use of AR/VR, with other forms of entertainment like films
or documentaries lagging behind. But the first step towards
mainstream adoption of a digitally-forward technology would be
to expand its user-base and open up new revenue streams beyond
what’s “default”, or in this case, gaming.
And our data shows that there’s plenty of scope for expansion
beyond entertainment, with education and tourism/travel proving
particularly fruitful routes. For AR users, education ranks as the first
feature they’d like to see being applied to AR tech, which is also the
second-most prominent VR feature, cited by over half of users.
VR and AR have already been applied to many spheres of education
from pre-school to vocational and higher education, and the market
continues to expand. Irish virtual reality company Immersive VR
Education, for example, has secured a three-year deal with South
Korean immersive digital content company D'Carrick to create
educational programmes in the country.
54% of users excited about VR in the UK
and the U.S. say it’s because they could visit
With consumers increasingly conscious of their environmental
places and see things they normally couldn’t. impact, these technologies could also be the best way to
experience destinations that would otherwise struggle to cope with
the demand. Manufacturers can unlock more sales from consumer
groups that have so far resisted the call of the technology.
Meanwhile, travel brands that can deploy VR in their marketing
Question: Which of the
strategies will know they’re using the tech in a way that resonates below would you like to see
with consumers. With multiple parties at play, perceptions of VR/ augmented reality or VR more
applied to?
AR capabilities in general can potentially change, resulting in Source: GlobalWebIndex
January 2019
greater adoption. Base: 1,313 AR Users and
1,254 VR Users aged 16-64
in the UK and the U.S.Market Insights: Gaming Devices Around the World
Notes on Methodology                                                                                                                                                                                       39

All figures in this report are drawn       OUR QUOTAS                                  MOBILE SURVEY RESPONDENTS                GLOBALWEBINDEX SAMPLE SIZE BY MARKET
from GlobalWebIndex’s online
                                           To ensure that our research is              From Q1 2017 on, GlobalWebIndex          This report draws insights from GlobalWebIndex’s Q4 2018 and Q1 2019 waves
research among internet users aged
                                           reflective of the online population         has offered our Core survey on           of research across 45 countries, with a global sample of 278,359 respondents.
16-64. Please note that we only
                                           in each market, we set appropriate          mobile. This allows us to survey
interview respondents aged 16-64
                                           quotas on age, gender, and                  internet users who prefer using a         Argentina                    3,116      Netherlands                   2,624
and our figures are representative
                                           education – meaning that we                 mobile or are mobile-only (who use        Australia                    8,057      New Zealand                   2,558
of the online populations of each
                                           interview representative numbers of         a mobile to get online but do not
market, not its total population.                                                                                                Austria                      2,560      Nigeria                       2,099
                                           men vs women, of 16-24s, 25-34s, 35-        use or own any other device). Mobile
                                                                                                                                 Belgium                      2,553      Philippines                   3,272
                                           44s, 45-54s and 55-64s, and of people       respondents complete a shorter
OUR RESEARCH                               with secondary vs tertiary education.       version of our Core survey, answering     Brazil                       4,680      Poland                        3,651

                                                                                       50 questions, all carefully adapted to    Canada                       4,539      Portugal                      2,557
Each year, GlobalWebIndex
                                           To do this, we conduct research across      be compatible with mobile screens.        China                       30,480      Romania                       2,625
interviews over 575,000 internet
                                           a range of international and national
users aged 16-64 across 46 markets.                                                                                              Colombia                     2,787      Russia                        4,368
                                           sources, including the World Bank,          Please note that the sample sizes
Respondents complete an online                                                                                                   Denmark                      2,522      Saudi Arabia                  2,886
                                           the ITU, the International Labour           presented in the charts throughout
questionnaire that asks them a
                                           Organization, the CIA Factbook,             this report may differ as some will       Egypt                        3,533      Singapore                     5,455
wide range of questions about their
                                           Eurostat, the US Bureau of Labor            include both mobile and PC/laptop/        France                      10,130      South Africa                  3,039
lives, lifestyles and digital behaviors.
                                           Statistics as well as a range of national   tablet respondents and others will
We source these respondents                                                                                                      Germany                     10,190      South Korea                   2,555
                                           statistics sources, government              include only respondents who
in partnership with a number of                                                                                                  Ghana                        1,990      Spain                       10,231
                                           departments and other credible and          completed GWI’s Core survey via PC/
industry-leading panel providers.
                                           robust third-party sources.                 laptop/tablet. For more details on        Hong Kong                    3,650      Sweden                        2,604
Each respondent who takes a
                                                                                       our methodology for mobile surveys        India                       15,109      Switzerland                   2,550
GlobalWebIndex survey is assigned
                                           This research is also used to calculate     and the questions asked to mobile
a unique and persistent identifier                                                                                               Indonesia                    3,686      Taiwan                        3,545
                                           the ‘weight’ of each respondent;            respondents, please download this
regardless of the site/panel to which                                                                                            Ireland                      2,499      Thailand                      3,094
                                           that is, approximately how many             document.
they belong and no respondent can
                                           people (of the same gender, age,                                                      Italy                       10,373      Turkey                        3,145
participate in our survey more than
                                           and educational attainment) are                                                       Japan                        3,604      UAE                           3,482
once a year (with the exception of
                                           represented by their responses.                                                       Kenya                        2,024      UK                          20,303
internet users in Egypt, Saudi Arabia
and the UAE, where respondents are                                                                                               Malaysia                     3,071      USA                         50,087
allowed to complete the survey at
                                                                                                                                 Mexico                       5,274      Vietnam                       3,164
6-month intervals).
                                                                                                                                 Morocco                      2,038
Notes on Methodology: Internet Penetration Rates 40
ACROSS GLOBALWEBINDEX’S MARKETS Internet Penetration Rates
GlobalWebIndex’s Forecasts for 2019 based on 2017 ITU data
GlobalWebIndex’s research focuses exclusively This table provides GlobalWebIndex forecasts
on the internet population and because on internet penetration (defined as the
Argentina 78% Indonesia 39% Russia 80%
internet penetration rates can vary significantly number of internet users per 100 people) in
between countries (from a high of 90%+ in parts 2019. This forecasted data is based upon the Australia 88% Ireland 87% Saudi Arabia 83%
of Europe to lows of c.20% in parts of APAC), the latest internet penetration estimates from the Austria 88% Italy 62% Singapore 85%
nature of our samples is impacted accordingly. International Telecommunication Union (ITU)
Belgium 89% Japan 92% South Africa 62%
for each market that GlobalWebIndex conducts
Where a market has a high internet online research in. Brazil 71% Kenya 43% South Korea 95%
penetration rate, its online population will be
Canada 94% Malaysia 83% Spain 87%
relatively similar to its total population and GLOBALWEBINDEX VERSUS ITU FIGURES
hence we will see good representation across China 59% Mexico 69% Sweden 96%
As GlobalWebIndex’s Core Research is
all age, gender and education breaks. This is
Colombia 66% Morocco 69% Switzerland 96%
conducted among 16-64 year-olds, we
typically the case across North America, Western
supplement the internet penetration forecasts Denmark 97% Netherlands 93% Taiwan 83%
Europe and parts of Asia Pacific such as Japan,
for a country’s total population (reproduced
Australia and New Zealand. Where a market Egypt 54% New Zealand 93% Thailand 58%
above) with internet penetration forecasts for
has a medium to low internet penetration, its
16-64s specifically. France 85% Nigeria 36% Turkey 71%
online population can be very different to its
total population; broadly speaking, the lower Germany 88% Philippines 64% UAE 95%
the country’s overall internet penetration rate, Forecasts for 16-64s will be higher than our
forecasts for total population, since 16-64s Ghana 48% Poland 79% UK 96%
the more likely it is that its internet users will
be young, urban, affluent and educated. This is are the most likely age groups to be using the Hong Kong 91% Portugal 78% USA 80%
the case throughout much of LatAm, MEA and internet.
India 42% Romania 72% Vietnam 55%
Asia Pacific.Like what you’ve read?
There’s plenty more where that came from.
Browse our latest reports and infographics
examining key consumer trends across markets.
Access More ReportsGet more from your data.
Run your own custom studies using our panel
of 22 million consumers, and get instant access
to insight tailored to your business needs.
Request Custom ResearchJason Mander Viktoriya Trifonova
Chief Research Officer Insights Analyst & Writer
jason@globalwebindex.com viktoriya@globalwebindex.com
www.globalwebindex.com
Copyright © Trendstream Limited 2019 – All rights, including copyright, in the content of GlobalWebIndex (GWI) webpages and
publications (including, but not limited to, GWI reports and blog posts) are owned and controlled by Trendstream Limited. In
accessing such content, you agree that you may only use the content for your own personal non-commercial use and that you
will not use the content for any other purpose whatsoever without an appropriate licence from, or the prior written permission of,
Trendstream Limited. | Trendstream Limited uses its reasonable endeavours to ensure the accuracy of all data in GWI webpages and
publications at the time of publication. However, in accessing the content of GWI webpages and publications, you agree that you
are responsible for your use of such data and Trendstream Limited shall have no liability to you for any loss, damage, cost or expense
whether direct, indirect consequential or otherwise, incurred by, or arising by reason of, your use of the data and whether caused by
reason of any error, omission or misrepresentation in the data or otherwise.You can also read